Embed Size (px)
Citation preview
J . CHEM. SOC. PERKIN TRANS. 2 1994 2337
The Hydrogen Bonding of Alcohols, Cholesterol and Phenols with Cyanate and Azide Ions
Pawel Goralski,a Michel Berthelot,b Jean Rannou/ Didier Legoff and Martial Chabanel * s b
a Department of Physical Chemistry, University of Lodz, 91-416 Lodz, Pomorska 18, Poland Laboratoire de Spectrochimie, Faculte des Sciences, 2 Rue de la Houssiniere, 44072 Nantes Cedex 03, France
The hydrogen bonding between ROH hydrogen bond donors (alcohols, cholesterol and phenols) and the cyanate and azide anions has been investigated in CCI, solution by FTIR spectroscopy. Equilibrium constants K, and enthalpies of complex formation have been determined by using the intensity of the antisymmetric vibration v , ( X ) of the uncomplexed anions X-. The v , ( X ) frequency shifts in the NBu,X HOR complexes have also been measured. The cyanate and azide anions are found to be the strongest hydrogen bond acceptors ever reported. The correlations between the frequency shifts and log K, values reveal a strong influence of steric effects on association constants. The very strong basicity of the cyanate ion allows a significant discrimination of the hydrogen bond acidity of the three classes of alcohol.
The hydrogen bond acidity of a given compound is more or less dependent on its state of aggregation: gas, liquid or diluted in an inert solvent. Acidities can be measured in the liquid state by solvatochromic effects and in the gas state by ion cyclotron resonance 43 or high resolution mass ~pectrornetry.~.' In the dissolved state the acidity of a hydrogen bond donor is usually measured by its free enthalpy of hydrogen bonding with a common base used as a reference i.e. by the logarithm of the equilibrium constant K, of the association.8
Abraham8' derived the scales of hydrogen bond acidity cty and basicity bT from an exhaustive analysis of the literature on log Kdata. However the foundation of the a7 scale appears to be less general because: (i) the number of hydrogen bond donors involved is comparatively much smaller; (ii) some important classes of carbon and nitrogen acids are excluded from the general statistical calculations; and (iii) none of the selected sets can emerge as a reference series.
In our view the development of a hydrogen bond acidity scale requires the definition of a reference set giving accurate primary data for a large number of diverse donors. This procedure has proved useful in the current extension of the /3: scale with p- fluorophenol as a reference acid.9 The aim of this work is to test whether some anionic bases may be considered as suitable for this purpose.
Several papers were published in the past on hydrogen bonding with halide anions lo-' and the v(0H) frequency shifts of alcohols were measured in order to estimate the basicities of these anions. ' 3-1 '
The two similar pseudo halide X- anions (X = OCN and N3) are most favourable for this kind of measurement because: (i) they exhibit an intense IR absorption in the 2000-2200 cm-' range where most organic molecules have no absorption-this band is characteristic of the antisymmetric v,(N3) or pseudo antisymmetric vCN(OCN) stretching vibration of the anion; (ii) the frequency shifts Av (bonded minus free) may serve as secondary probes of the hydrogen bonding interactions and (iii) they are stronger hydrogen bonding acceptors t than SCN-
Experimental Tetrabutylammonium azide NBu,N, was prepared l6 by the
t The values of Av(0H) of methanol in CCI, solutions are: SCN- 301, N; 360 and OCN- 436 cm-'.
reaction of NBu,OH with gaseous hydrazoic acid. The salt was recrystallized three times in methanol. Tetrabutylammonium cyanate NBu,OCN was obtained from Fluka. Both salts were dried under vacuum until they reached a constant weight. The solutions in CCl, were stored for several days over molecular sieves (Merck, 3 A) in order to remove last traces of water. The solutions were titrated with monitoring by IR spectroscopy after calibration by Volhard's method.
The alcohols of the best available commercial grade were dried over molecular sieves without further purification. Cholesterol (Sigma, standard for chromatography) was dried under vacuum for several days at 80°C. Phenols were either distilled when liquids or sublimed when solids.
The IR spectra were obtained with a FTIR spectrometer, Bruker IFS 85, with 2 cm-' resolution. The calcium fluoride cells were thermostatted with a 50.1 "C accuracy. Relative permittivity measurements were made at 2 MHz on a WTW DMOl dipolemeter with a DFLl cell.
Method and Results In this work a series of ROH proton donors was investigated: alcohols, cholesterol and substituted phenols. The equilibrium constants K, and the enthalpies AHa of formation of the 1 : 1 complexes were determined from the intensity changes of the free vCN and v(N3) absorptions after decomposition of the IR spectra by a band fitting procedure.
In CCI, solutions of NBu,X, only one v,(X) IR band is observed and its position is nearly the same as in ionizing solvents: vm = 2134 and v,(N3) = 1995 cm-'. Moreover the shape of the absorption band is independent of the con- centration. The behaviour of such tetraalkylammonium salt solutions is well known '' and the X- anions are said to be 'spectroscopically free'. In this case the perturbation brought by the large NRZ cation to the anion is so small that no spectral difference can be detected between free and bonded anions.
The extremely low conductivity of the solution makes dielectric measurements possible at low frequency. In the CCl, solutions the NBu,OCN ion pairs are found in equilibrium with non-polar aggregates. As the solubility of NBu,OCN is quite low we could measure the variations of dielectric permittivity only in a narrow range of concentration [ca. (4-6) x lo-' mol dm-3]. The apparent dipole moment of NBu,OCN was calculated by using Exner's procedure. ' * The aggregation state was represented by an ion pair-quadrupole (dimer) equilibrium
Publ
ishe
d on
01
Janu
ary
1994
. Dow
nloa
ded
by C
lark
son
Uni
vers
ity o
n 23
/10/
2013
05:
22:1
7.
View Article Online / Journal Homepage / Table of Contents for this issue
J. CHEM. SOC. PERKIN TRANS. 2 1994 2338
0.4
s 3 0.2 8 2
t
21 80 2160 2140 2120 vlcm-'
Fig. 1 IR spectra of cholesterol-NBu,OCN solutions in CCI,. Concentrations: NBu,OCN 4 x lo-,; cholesterol (a) 8 x lo-,, (b) 3.5 x (c) 0.016, ( d ) 0.032, (e) 0.064, (f) 0.2 rnol dm-3; cell thickness 0.5 cm.
as usual for electrolytes in non-polar or slightly polar solvents. l 9 By using an electrostatic model the dipole moment p of the ion pair was estimated to be 12-1 3 D2 1-23 while the dimer was supposed to be a pure quadrupole (p = O ) . 2 0 Within this model the dimerization constant Kq of the ion pair was found to be Kq 2: lo4 dm3 mol-' at 25 "C. These results are close to those obtained by other authors for NBu,X in benzene: 1.6 x lo3 (X = I )and3 x 103dm3mol-' (X = Br).22
Additions of small amounts of ROH compounds (cholesterol, 2,2,2-trichoroethanol and 4-fluoroethanol) to a NBu,OCN solution cause an increase of the dielectric permittivity in significant excess to the additivity rule. A similar effect on the dielectric permittivity through addition of methanol to NBu,Br solutions in benzene was observed by Richardson and Stern.23 Consequently, the addition of alcohol causes a separation of quadrupoles into ion pairs which form 1 : 1 complexes with the added ROH. Therefore the association equilibrium will be writen as
NBu4X + HOR NBu4X HOR
and assuming the activity coefficient ratio to be unity the equilibrium constant Ka/dm3 mol-' is calculated as shown in eqn. (1).
Ka = ~ B U , X HOR]/~BU,X][HOR] (1)
Owing to the high values of the extinction coefficients it was possible to investigate NBu,X at very low concentrations (5 x lo-' < c, < 5 x mol dmP3). The ROH concentr- ations were kept in the same range and it was checked in the vOH region that the self-association of ROH was negligible.
Larger concentrations of alcohols give 1:2 or higher complexes which causes an important increase of Av,, shifts. This can be seen on Fig. 1 in the case of cholesterol.
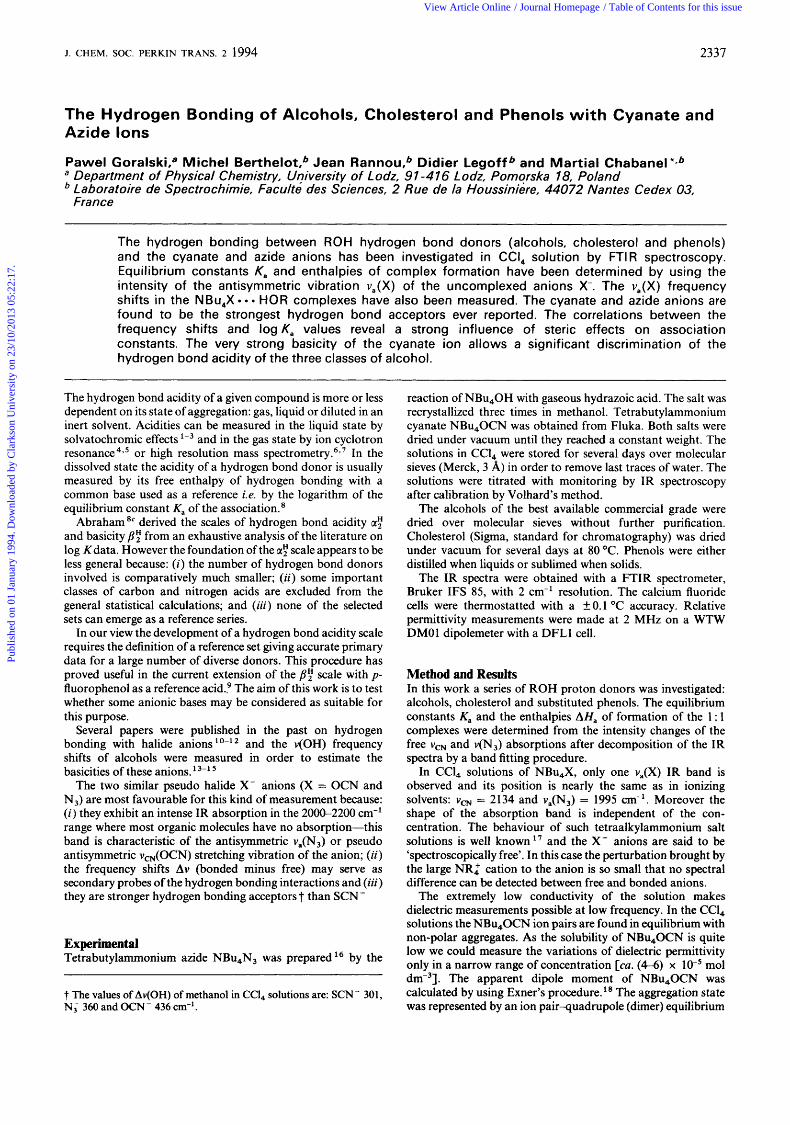
The enthalpies of association were deduced from the dependence of equilibrium constants on temperatures between 5 and 55 "C. The variations of the extinction coefficients were taken into account. A typical example of spectral changes with temperature has been reported in Fig. 2.
The experimental results are summarized in Table 1. The
1 .o
Q) 0 t Q 0.5 5: 2
2iao 2160 2140 2120 2100 vlcm-'
Fig. 2 IR spectra of cholesterol (9.8 x mol dm-3)-NBu,0CN (1.2 x lo-' mol dm-3) solutions in CCl, at various temperatures. (a) 5, (b) 15, (c ) 25, (d ) 40 and (e) 55 "C; cell thickness 0.5 cm.
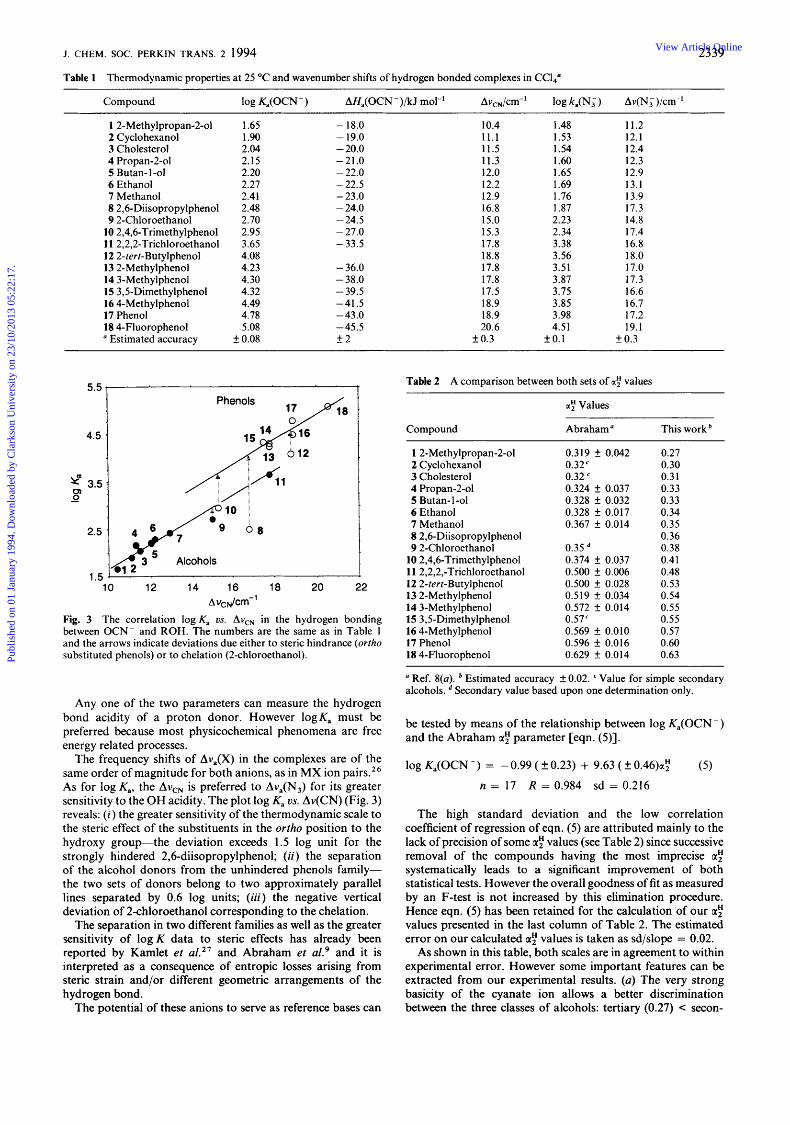
values of log Ka and of frequency shifts are reported for both anions. The AHa values are also reported for the hydrogen bonding with cyanate.
Discussion The association constants with p-fluorophenol allow a direct calculation of the /?: values for the two anionic species from eqn. (2).
/?: = [log Ka(p-fluorophenol) + 1.1y4.636 (2)
The calculated values B:(OCN-) = 1.333 and /?Y(N;) = 1.210 give these anions the strongest hydrogen bond basicities known. The basicities of the strongest molecular bases are around the 1.0 value of hexamethylphosphoramide. When a statistical correction of log 2 due to the bidentate character of N3 is applied, the ratio /?Y(OCN-) :/?Y(N,) = 1.17 is equal to the ratio of the donor numbers of the two anions DN(0CN-)/ DN(N3) = 1.18, measured recently by L i ~ ~ e r t . ~ , On the other hand the pKa of HN, (4.7) in water is higher than that of HNCO (3.5).25 Consequently the order of the basicities of OCN- and N3 is reversed when protonation in water is compared with hydrogen bonding.
The larger hydrogen bonding basicity of the cyanate ion is reflected in the positive intercept and the greater than unity slope of the linear free energy relationship [eqn. (3)] between the two sets of data.
log K,(OCN-) = 0.42 ( f 0.10) + 1.04 ( f 0.03) log Ka(N,)
n (number of points) = 18; R (correlation coefficient) =
(3)
0.992; sd (standard deviation) = 0.15
The subsequent correlations are relative to OCN- which gives more accurate data than N,. The values of equilibrium constants of the NBu,X HOR association (as log K,) are well correlated to the enthalpy of the complex formation AHa ceqn. ( 4 ~ .
log Ka(OCN-) = - 0.40 (k 0.09) + 0.122 (If: 0.003) AH,
n = 17 R = 0.996 sd = 0.11 (4)
Publ
ishe
d on
01
Janu
ary
1994
. Dow
nloa
ded
by C
lark
son
Uni
vers
ity o
n 23
/10/
2013
05:
22:1
7.
View Article Online
J . CHEM. SOC. PERKIN TRANS. 2 1994 2339
L" 3.5 ' 0) 0 -
Table 1 Thermodynamic properties at 25 "C and wavenumber shifts of hydrogen bonded complexes in CCI,"
Compound log K,(OCN-) AH,(OCN-)/kJ mol-' Av,,/cm-' log k,(N;) Av(N,)/cm-'
1 2-Methylpropan-2-01 2 Cyclohexanol 3 Cholesterol 4 Propan-2-01 5 Butan- 1-01 6 Ethanol 7 Methanol 8 2,6-Diisopropylpheno1 9 2-Chloroethanol
10 2,4,6-Trimethylphenol 11 2,2,2-Trichloroethanol 12 2-tert-Butylphenol 13 2-Methylphenol 14 3-Methylphenol 15 3,5-Dimethylphenol 16 4-Methylphenol 17 Phenol 18 4-Fluorophenol " Estimated accuracy
1.65 1.90 2.04 2.15 2.20 2.27 2.41 2.48 2.70 2.95 3.65 4.08 4.23 4.30 4.32 4.49 4.78 5.08
f 0.08
- 18.0 - 19.0 - 20.0 -21.0 - 22.0 - 22.5 - 23.0 - 24.0 - 24.5 - 27.0 - 33.5
- 36.0 - 38.0 - 39.5 -41.5 -43.0 -45.5 + 2
10.4 11.1 11.5 11.3 12.0 12.2 12.9 16.8 15.0 15.3 17.8 18.8 17.8 17.8 17.5 18.9 18.9 20.6
k 0.3
I .48 1.53 1.54 1.60 1.65 1.69 1.76 1.87 2.23 2.34 3.38 3.56 3.51 3.87 3.75 3.85 3.98 4.51
fO.1
11.2 12.1 12.4 12.3 12.9 13.1 13.9 17.3 14.8 17.4 16.8 18.0 17.0 17.3 16.6 16.7 17.2 19.1
f 0.3
5.5 1 I
4.5 I 1 7 / 4 8 1 Phenols
0
2.51/ O 9 . O 8 . , I 1.5
Alcohols 01 2
10 12 14 16 18 20 22 Avc&m-'
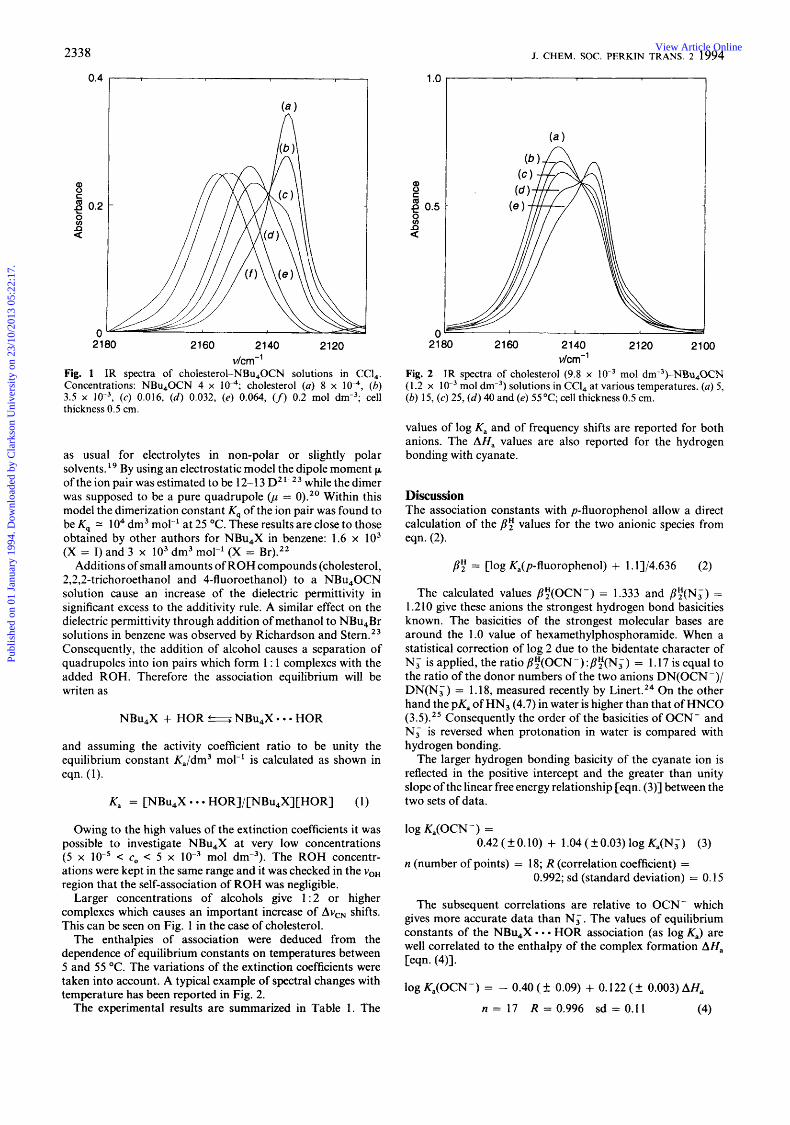
Fig. 3 The correlation log& us. AvcN in the hydrogen bonding between OCN- and ROH. The numbers are the same as in Table 1 and the arrows indicate deviations due either to steric hindrance (ortho substituted phenols) or to chelation (2-chloroethanol).
Any one of the two parameters can measure the hydrogen bond acidity of a proton donor. However logK, must be preferred because most physicochemical phenomena are free energy related processes.
The frequency shifts of Av,(X) in the complexes are of the same order of magnitude for both anions, as in MX ion pairs.26 As for log K,, the AvCN is preferred to Aua(N3) for its greater sensitivity to the OH acidity. The plot log K, vs. Av(CN) (Fig. 3) reveals: (i) the greater sensitivity of the thermodynamic scale to the steric effect of the substituents in the ortho position to the hydroxy group-the deviation exceeds 1.5 log unit for the strongly hindered 2,6-diisopropylphenol; (ii) the separation of the alcohol donors from the unhindered phenols family- the two sets of donors belong to two approximately parallel lines separated by 0.6 log units; (iii) the negative vertical deviation of 2chloroethanol corresponding to the chelation.
The separation in two different families as well as the greater sensitivity of logK data to steric effects has already been reported by Kamlet et ~ 1 . ~ ' and Abraham et aL9 and it is interpreted as a consequence of entropic losses arising from steric strain and/or different geometric arrangements of the hydrogen bond.
The potential of these anions to serve as reference bases can
Table 2 A comparison between both sets of a! values
a! Values
Compound Abraham " This work
1 2-Methylpropan-2-01 2 Cyclohexanol 3 Cholesterol 4 Propan-2-01 5 Butan-1-01 6 Ethanol 7 Methanol 8 2,6-DiisopropylphenoI 9 2-Chloroethanol
10 2,4,6-Trimethylphenol 11 2,2,2,-Trichloroethanol 12 2-tert-Butylphenol 13 2-Methylphenol 14 3-Methylphenol 15 3,5-Dimethylphenol 16 4-Methylphenol 17 Phenol 18 4-Fluorophenol
0.319 k 0.042 0.32' 0.32 ' 0.324 2 0.037 0.328 k 0.032 0.328 f 0.017 0.367 f 0.014
0.35 * 0.374 f 0.037 0.500 f 0.006 0.500 f 0.028 0.519 k 0.034 0.572 f 0.014 0.57' 0.569 f 0.010 0.596 f 0.016 0.629 f 0.014
0.27 0.30 0.3 I 0.33 0.33 0.34 0.35 0.36 0.38 0.41 0.48 0.53 0.54 0.55 0.55 0.57 0.60 0.63
" Ref. 8(a). Estimated accuracy f 0.02. ' Value for simple secondary alcohols. Secondary value based upon one determination only.
be tested by means of the relationship between log K,(OCN-) and the Abraham a; parameter [eqn. ( 5 ) ] .
log K,(OCN-) = -0.99 ( k 0.23) + 9.63 ( k 0.46)~y ( 5 )
n = 17 R = 0.984 sd = 0.216
The high standard deviation and the low correlation coefficient of regression of eqn. (5) are attributed mainly to the lack of precision of some a: values (see Table 2) since successive removal of the compounds having the most imprecise a: systematically leads to a significant improvement of both statistical tests. However the overall goodness of fit as measured by an F-test is not increased by this elimination procedure. Hence eqn. ( 5 ) has been retained for the calculation of our a: values presented in the last column of Table 2. The estimated error on our calculated a: values is taken as sd/slope = 0.02.
As shown in this table, both scales are in agreement to within experimental error. However some important features can be extracted from our experimental results. (a) The very strong basicity of the cyanate ion allows a better discrimination between the three classes of alcohols: tertiary (0.27) c secon-
Publ
ishe
d on
01
Janu
ary
1994
. Dow
nloa
ded
by C
lark
son
Uni
vers
ity o
n 23
/10/
2013
05:
22:1
7.
View Article Online
2340 J. CHEM. SOC. PERKIN TRANS. 2 1994
dary (0.30-0.33) < primary (0.33-0.35). (b) Methanol is con- firmed to be the most acidic aliphatic alcohol (0.35). ( c ) 2- Chloroethanol (0.38) is now found to be more acidic than ethanol and methanol in line with the inductive effects of the CH,C1 substituent. ( d ) A value or: = 0.36 is assigned to the strongly hindered 2,6-diisopropylphenol. (e ) The behaviour of cholesterol is the same as expected for a secondary alcohol. This fact has already been noticed in the complexes with covalent proton donors.28
References 1 M. J. Kamlet and R. W. Taft, J. Am. Chem. Soc., 1976,98,377. 2 R. W. Taft and M. J. Kamlet, J. Am. Chem. Soc., 1976,98,2886. 3 M. J. Kamlet, J.-L. M. Abboud, M. H. Abraham and R. W. Taft,
4 J. E. Bartmess, J. A. Scott and R. T. McIver, Jr., J. Am. Chem.
5 D. H. Aue, H. M. Webb and M. T. Bowers, J. Am. Chem. Soc., 1976,
6 T. B. McMahon and P. Kebarle, J. Am. Chem. SOC., 1977,99,2222. 7 M. Moet-Ner, J . Am. Chem. Soc., 1988,110,3854. 8 (a) M. H. Abraham, P. L. Grellier, D. V. Prior, P. P. Duce,
J. J. Morris and P. J. Taylor, J. Chem. Soc., Perkin Trans. 2,1989,699; (b) M. H. Abraham, P. P. Duce, J. J. Morris and P. J. Taylor, J. Chem. Soc., Faraday Trans I, 1987,83,2867; (c) M. H. Abraham, P. P. Duce, D. V. Prior, D. G. Barratt, J. J. Morris and P. J. Taylor, J. Chem. Soc., Perkin Trans. 2, 1989, 1355.
9 (a) C. Laurence, M. Berthelot, M. Helbert and K. Sraidi, J. Phys. Chem., 1989,93,3799; (b) J.-Y. Le Questel, C. Laurence, A. Lachkar and M. Berthelot, J. Chem. Soc., Perkin Trans. 2, 1992, 2091; (c) E. D. Raczinska, C. Laurence and M. Berthelot, Can. J. Chem., 1992, 70, 2203; ( d ) M. Berthelot, M. Helbert, C. Laurence and J.-Y. Le Questel, J. Phys. Org. Chem., 1993, 6, 302; (e) F. Besseau, C. Laurence and M. Berthelot, J. Chem. Soc., Perkin Trans. 2, 1994,
J. Org. Chem., 1983,48,2877.
Soc., 1979, 101,6046.
98, 311.
485; (f) C. Laurence, M. Berthelot, M. Luqon and D. G. Morris, J. Chem. Soc., Perkin Trans. 2, 1994,491.
10 H. Lund, Acta Chem. Scand., 1958,12,298. 1 1 J. Bufalini and K. H. Stern, J. Am. Chem. Soc., 1961,83,4362. 12 J. B. Hyne and R. M. Levy, Can. J . Chem., 1962,40,692. 13 A. Allerhand and P. v. R. Schleyer, J. Am. Chem. Soc., 1963,85,1233. 14 R. R. Ryall, H. A. Strobeland M. C. R. Symons, J. Phys. Chem., 1977,
15 L. M. Epstein, L. N. Saitkulova and E. S. Shubina, J. Mol. Struct.,
16 L. P. Audrieth, Chem. Rev., 1934, 15, 169. 17 P. Bacelon, J . Corset and C. de Loze, J. Solution Chem., 1980, 9,
18 0. Exner, Dipole Moments in Organic Chemistry, Georg Thieme,
19 D. Menard and M. Chabanel, J. Phys. Chem., 1975,79, 1001. 20 M. Chabanel and D. Paoli, J. Chim. Phys. Phys.-Chem. Biol., 1980,
21 C. A. Kraus, J. Phys. Chem., 1956,60, 129. 22 K. Bauge and J. W. Smith, J. Chem. Soc., 1964,4244. 23 E. A. Richardson and K. H. Stern, J. Am. Chem. Soc., 1960,82,1296. 24 W. Linert, R. F. Jameson and A. Taha, J. Chem. SOC., Dalton Trans.,
25 G. Charlot, Les Mithodesde Chimie Analytique, Masson, Paris, 1966,
26 J. Rannou, G. Masse and M. Chabanel, C. R. Acad. Sci., Paris,
27 M. J. Kamlet, A. Solomonovici and R. W. Taft, J. Am. Chem. Soc.,
28 P. Goralski, J. Chem. Soc., Faraday Trans., 1993, 89, 2433;
81,253.
1992,270, 325.
129.
Stuttgart, 1975.
77,913.
1993,3181.
p. 8.
Sir. C, 1978,287,93.
1979,101,3734.
Thermochim. Acta, 1994,235,3 1.
Paper 4/02073A Received 6th April 1994
Accepted 19th July 1994
Publ
ishe
d on
01
Janu
ary
1994
. Dow
nloa
ded
by C
lark
son
Uni
vers
ity o
n 23
/10/
2013
05:
22:1
7.
View Article Online