Embed Size (px)
Citation preview
HVS Global Hospitality Services | Level 21 The Center, 99 Queen’s Road Central, Hong Kong
THE HVS QUARTERLY
HONG KONG, MACAU, CHINA AND TAIWAN UPDATE
3RD QUARTER 2012
Cathy Luo Associate Daniel J Voellm Managing Director
An HVS Quarterly Hotel Market Update — Hong Kong PAGE 2
An HVS Quarterly Hotel Market Update
The knock-on effect of the global economic downturn has finally reached the region. Most regional markets are seeing a slowdown in visitor arrival growth, and occupancy levels are under pressure. HONG KONG
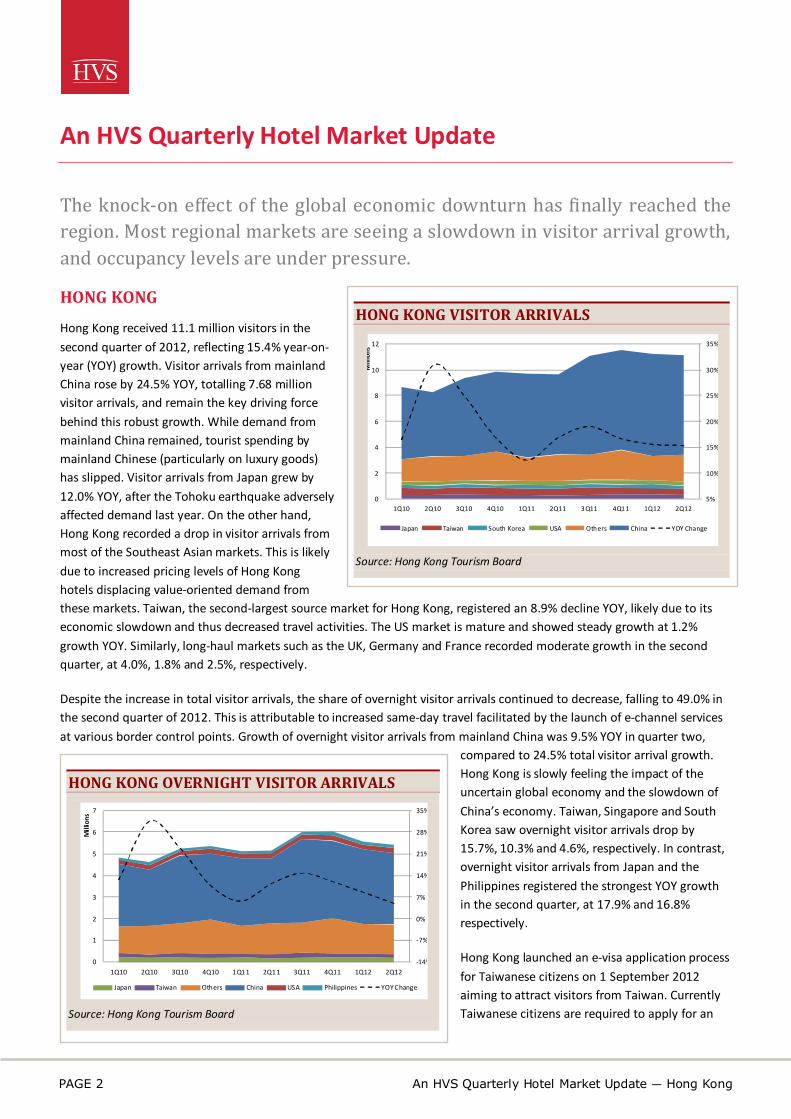
Hong Kong received 11.1 million visitors in the second quarter of 2012, reflecting 15.4% year-on-year (YOY) growth. Visitor arrivals from mainland China rose by 24.5% YOY, totalling 7.68 million visitor arrivals, and remain the key driving force behind this robust growth. While demand from mainland China remained, tourist spending by mainland Chinese (particularly on luxury goods) has slipped. Visitor arrivals from Japan grew by 12.0% YOY, after the Tohoku earthquake adversely affected demand last year. On the other hand, Hong Kong recorded a drop in visitor arrivals from most of the Southeast Asian markets. This is likely due to increased pricing levels of Hong Kong hotels displacing value-oriented demand from these markets. Taiwan, the second-largest source market for Hong Kong, registered an 8.9% decline YOY, likely due to its economic slowdown and thus decreased travel activities. The US market is mature and showed steady growth at 1.2% growth YOY. Similarly, long-haul markets such as the UK, Germany and France recorded moderate growth in the second quarter, at 4.0%, 1.8% and 2.5%, respectively.
Despite the increase in total visitor arrivals, the share of overnight visitor arrivals continued to decrease, falling to 49.0% in the second quarter of 2012. This is attributable to increased same-day travel facilitated by the launch of e-channel services at various border control points. Growth of overnight visitor arrivals from mainland China was 9.5% YOY in quarter two,
compared to 24.5% total visitor arrival growth. Hong Kong is slowly feeling the impact of the uncertain global economy and the slowdown of China’s economy. Taiwan, Singapore and South Korea saw overnight visitor arrivals drop by 15.7%, 10.3% and 4.6%, respectively. In contrast, overnight visitor arrivals from Japan and the Philippines registered the strongest YOY growth in the second quarter, at 17.9% and 16.8% respectively.
Hong Kong launched an e-visa application process for Taiwanese citizens on 1 September 2012 aiming to attract visitors from Taiwan. Currently Taiwanese citizens are required to apply for an
HONG KONG VISITOR ARRIVALS
Source: Hong Kong Tourism Board
5%
10%
15%
20%
25%
30%
35%
0
2
4
6
8
10
12
1Q10 2Q10 3Q10 4Q10 1Q11 2Q11 3 Q11 4Q1 1 1Q12 2Q12
Mill
ions
Japan Taiwan South Korea USA Others China YOY Change
HONG KONG OVERNIGHT VISITOR ARRIVALS
Source: Hong Kong Tourism Board
-14%
-7%
0%
7%
14%
21%
28%
35%
0
1
2
3
4
5
6
7
1Q10 2Q10 3Q10 4Q10 1Q11 2Q11 3Q11 4Q11 1Q12 2Q12
Mill
ions
Japan Taiwan Others China USA Philippines YOY Change
PAGE 3 An HVS Quarterly Hotel Market Update — Macau
entry permit with registered airlines. The e-visa arrangement will allow Taiwanese visitors to apply for the permit online, where the current HK$160 visa application fee will be waived.
MACAU
Macau recorded more than 6.6 million visitor arrivals in the second quarter of 2012, reflecting a YOY decline (2.6%) in visitor arrivals since the third quarter of 2009. Visitor arrivals from mainland China increased slightly by 2.3% YOY, as demand softened. Other major source markets such as Hong Kong and Taiwan saw visitor arrivals decline by 9.7% and 22.5%, respectively. Both declines are likely attributable to the softening economic environment, particularly in Taiwan.
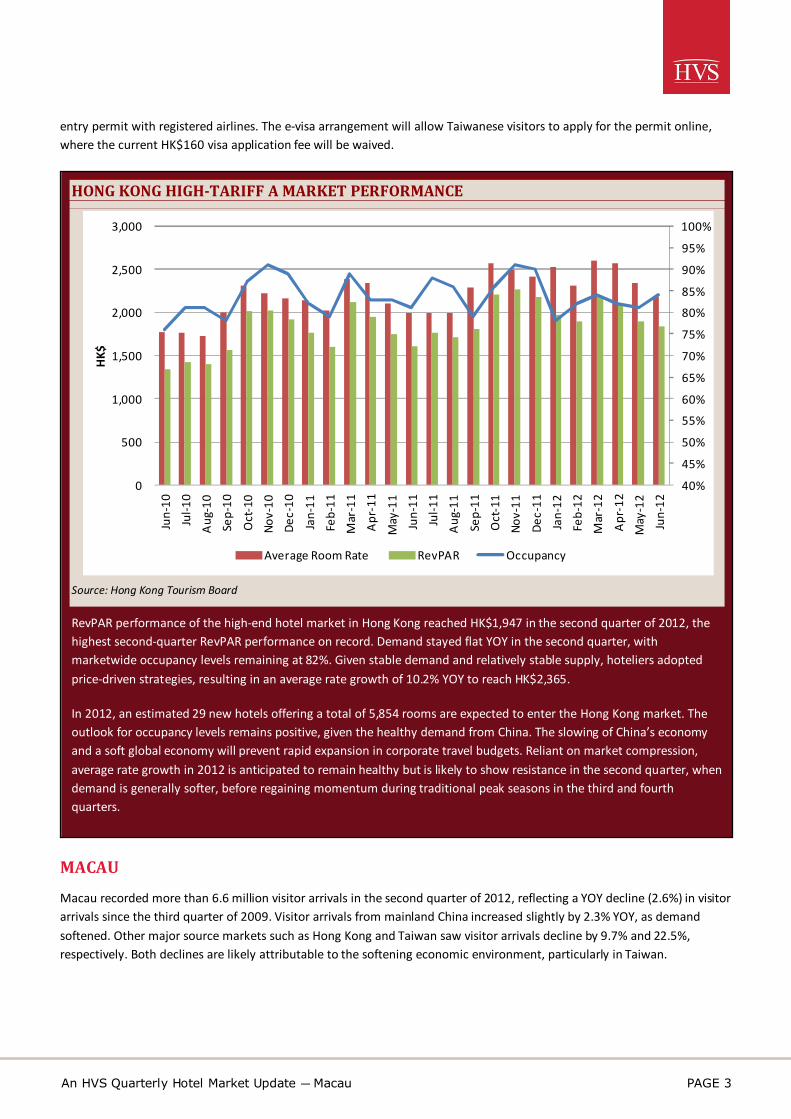
HONG KONG HIGH-TARIFF A MARKET PERFORMANCE
Source: Hong Kong Tourism Board
RevPAR performance of the high-end hotel market in Hong Kong reached HK$1,947 in the second quarter of 2012, the highest second-quarter RevPAR performance on record. Demand stayed flat YOY in the second quarter, with marketwide occupancy levels remaining at 82%. Given stable demand and relatively stable supply, hoteliers adopted price-driven strategies, resulting in an average rate growth of 10.2% YOY to reach HK$2,365.
In 2012, an estimated 29 new hotels offering a total of 5,854 rooms are expected to enter the Hong Kong market. The outlook for occupancy levels remains positive, given the healthy demand from China. The slowing of China’s economy and a soft global economy will prevent rapid expansion in corporate travel budgets. Reliant on market compression, average rate growth in 2012 is anticipated to remain healthy but is likely to show resistance in the second quarter, when demand is generally softer, before regaining momentum during traditional peak seasons in the third and fourth quarters.
40%
45%
50%
55%
60%
65%
70%
75%
80%
85%
90%
95%
100%
0
500
1,000
1,500
2,000
2,500
3,000
Jun-
10Ju
l-10
Aug
-10
Sep-
10
Oct
-10
Nov-
10De
c-10
Jan-
11Fe
b-11
Mar
-11
Apr
-11
May
-11
Jun-
11Ju
l-11
Aug
-11
Sep-
11O
ct-1
1No
v-11
Dec-
11Ja
n-12
Feb-
12M
ar-1
2
Apr
-12
May
-12
Jun-
12
HK$
Average Room Rate RevPAR Occupancy
An HVS Quarterly Hotel Market Update — Macau PAGE 4
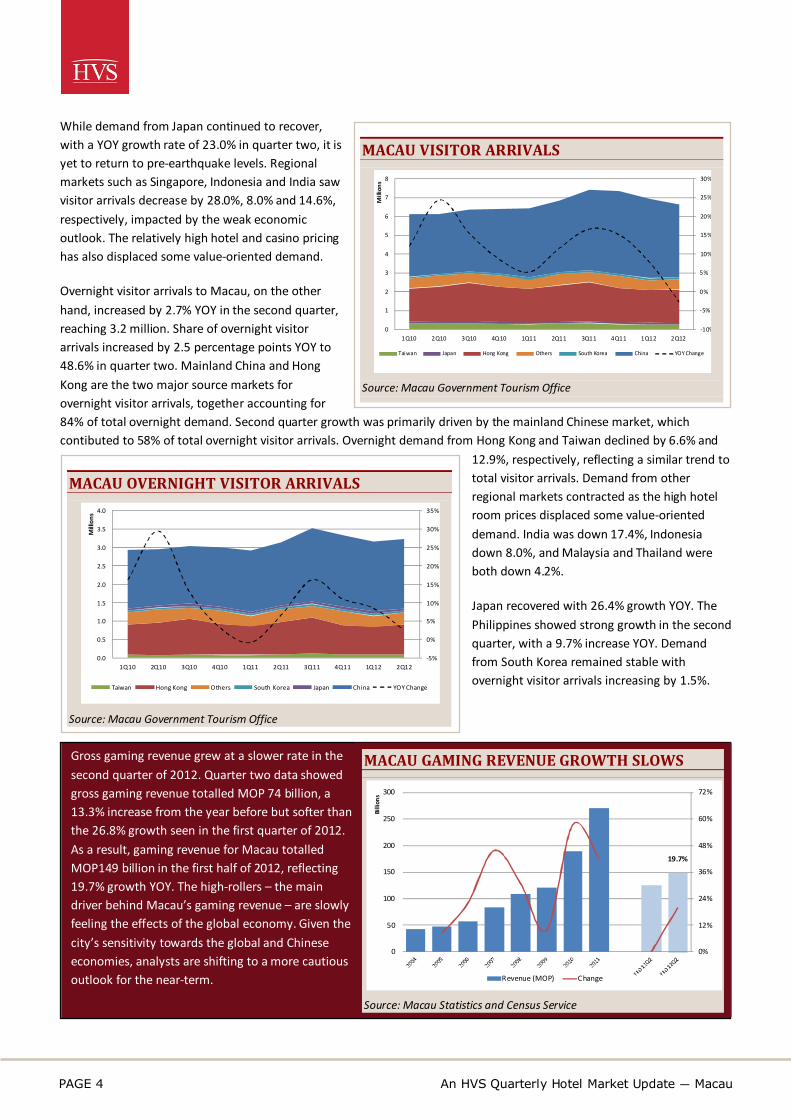
While demand from Japan continued to recover, with a YOY growth rate of 23.0% in quarter two, it is yet to return to pre-earthquake levels. Regional markets such as Singapore, Indonesia and India saw visitor arrivals decrease by 28.0%, 8.0% and 14.6%, respectively, impacted by the weak economic outlook. The relatively high hotel and casino pricing has also displaced some value-oriented demand.
Overnight visitor arrivals to Macau, on the other hand, increased by 2.7% YOY in the second quarter, reaching 3.2 million. Share of overnight visitor arrivals increased by 2.5 percentage points YOY to 48.6% in quarter two. Mainland China and Hong Kong are the two major source markets for overnight visitor arrivals, together accounting for 84% of total overnight demand. Second quarter growth was primarily driven by the mainland Chinese market, which contibuted to 58% of total overnight visitor arrivals. Overnight demand from Hong Kong and Taiwan declined by 6.6% and
12.9%, respectively, reflecting a similar trend to total visitor arrivals. Demand from other regional markets contracted as the high hotel room prices displaced some value-oriented demand. India was down 17.4%, Indonesia down 8.0%, and Malaysia and Thailand were both down 4.2%.
Japan recovered with 26.4% growth YOY. The Philippines showed strong growth in the second quarter, with a 9.7% increase YOY. Demand from South Korea remained stable with overnight visitor arrivals increasing by 1.5%.
Gross gaming revenue grew at a slower rate in the second quarter of 2012. Quarter two data showed gross gaming revenue totalled MOP 74 billion, a 13.3% increase from the year before but softer than the 26.8% growth seen in the first quarter of 2012. As a result, gaming revenue for Macau totalled MOP149 billion in the first half of 2012, reflecting 19.7% growth YOY. The high-rollers – the main driver behind Macau’s gaming revenue – are slowly feeling the effects of the global economy. Given the city’s sensitivity towards the global and Chinese economies, analysts are shifting to a more cautious outlook for the near-term.
MACAU VISITOR ARRIVALS
Source: Macau Government Tourism Office
-10%
-5%
0%
5%
10%
15%
20%
25%
30%
0
1
2
3
4
5
6
7
8
1Q10 2Q10 3Q10 4Q10 1Q11 2Q11 3Q11 4Q11 1Q12 2Q12
Mill
ions
Taiwan Japan Hong Kong Others South Korea China YOY Change
MACAU OVERNIGHT VISITOR ARRIVALS
Source: Macau Government Tourism Office
-5%
0%
5%
10%
15%
20%
25%
30%
35%
0.0
0.5
1.0
1.5
2.0
2.5
3.0
3.5
4.0
1Q10 2Q10 3Q10 4Q10 1Q11 2Q11 3Q11 4Q11 1Q12 2Q12
Mill
ions
Taiwan Hong Kong Others South Korea Japan China YOY Change
MACAU GAMING REVENUE GROWTH SLOWS
Source: Macau Statistics and Census Service
19.7%
0%
12%
24%
36%
48%
60%
72%
0
50
100
150
200
250
300
Billi
ons
Revenue (MOP) Change

PAGE 5 An HVS Quarterly Hotel Market Update — China
CHINA
Momentum of total international visitor arrivals (excluding Hong Kong and Macau) to China slowed down in the second quarter of 2012, with visitor arrivals nearly flat at 1.5% YOY, the slowest growth rate since the fourth quarter of 2009. Regional markets remain the main feeder markets to China. Japan continues to recover from the 2011 earthquake with visitor arrivals increasing by 11.7% YOY. Other regional markets such as Sri Lanka, Kyrgyzstan and North Korea posted double-digit growth rates, starting from a low base. Kazakhstan and the Philippines both posted 9.8% visitor arrival growth in the second quarter. Taiwan posted a 1.3% decline in visitor arrivals, attributable to its sluggish economy. The Russian market contracted by 4.9% in
the second quarter, impacted by the global economic environment. Germany and France posted 4.4% and 7.0% growth, respectively. Italy registered 11.0% growth YOY, supported by increased economic ties between the two nations and starting from a relatively low base. The Oceania region posted 4.2% growth YOY, supported by the Australian market and strong business relations. Visitor arrivals growth from the USA remained stable, with 1.2% growth YOY.
China reportedly tightened tourist visa requirements in an effort to clamp down on illegal overstays in August 2012. An invitation letter from a Chinese entity or citizen, a copy of a round-trip ticket, and a hotel reservation are all required for a tourist visa. This is expected to further slow visitor arrivals to China in the near future.
TAIWAN
Taiwan outperformed Hong Kong, Macau and China in the second quarter in terms of total visitor arrivals, increasing by 28.0% YOY. Four out of the five top source markets posted double-digit growth rates YOY, with the USA posting 2.1% growth YOY. This robust growth was fuelled by demand from mainland China, where visitor arrivals surged by 54.2% YOY in the second quarter. This was driven by the simplified visa application process and the growing popularity of Taiwan as a destination. Furthermore, the continuous easing of travel restrictions to Taiwan for Chinese nationals and further improvement of cross-strait relations supported visitor arrivals growth from mainland China. The large number of visitors has led to many scenic sites becoming overwhelmed by tourist flows on an unprecedented scale. Visitor arrivals from Hong Kong and Macau grew significantly by 35.0% YOY, supported by Taiwan’s growing popularity and favourable pricing levels. Visitor arrivals from Japan recorded 26.0% growth YOY in the second quarter, given the post-earthquake effect in 2011. Efforts by the Taiwan Tourism Bureau to drive regional markets have paid off: visitor arrivals from Singapore grew by 12.9%; Indonesia by 12.2%; and Malaysia, a key trade partner, by 10.3%. Despite Taiwan’s economy contracting in the second quarter, trade and tourism collaborations with Southeast Asian countries are expected to continue to drive demand to Taiwan. Long-haul markets posted stable growth in the second quarter with The Americas, Oceania and Europe registering 4.0%, 3.6% and 3.3% growth YOY, respectively.
CHINA VISITOR ARRIVALS*
Source: China National Tourism Administration * Excluding Hong Kong and Macau
-20%
-15%
-10%
-5%
0%
5%
10%
15%
20%
25%
30%
0
1
2
3
4
5
6
7
8
9
10
1Q10 2Q10 3Q10 4Q10 1Q11 2Q11 3Q11 4Q11 1Q12 2Q12
Mill
ions
Japan South Korea Taiwan Russia Other s USA YOY Change
TAIWAN VISITOR ARRIVALS
Source: Taiwan Tourism Bureau
-5%
-1%
3%
7%
11%
15%
19%
23%
27%
31%
35%
0.0
0.2
0.4
0.6
0.8
1.0
1.2
1.4
1.6
1.8
2.0
1Q10 2Q10 3Q10 4Q10 1Q11 2Q11 3Q11 4Q11 1Q12 2Q12
Mill
ions
Others USA Japan Hong Kong, Macau Singapore China YOY Change

An HVS Quarterly Hotel Market Update — Hotel Market Performance PAGE 6
Taiwan continues to drive demand from mainland China with a number of favourable policies, in particular the individual traveller scheme. The effects of doubling the quota of individual mainland visitors at the end of the first quarter are evident, with March 2012 alone tallying over 56,000 individual Chinese tourists. Coupled with the increasing number of Chinese tour groups, Taiwan welcomed more than 700,000 visitors from mainland China in the second quarter alone, double the number in 2011. The scheme is expected to include an additional four cities by the end of 2012, which will continue to drive demand from mainland China.
HOTEL MARKET PERFORMANCE
Hong Kong, Macau and Taiwan
All five markets tracked in the area started positively in 2012. Hong Kong, Taichung and Macau recorded double-digit RevPAR growth YOY in the first quarter, signs of a recovering economy.
TAIPEI IS CATCHING UP
Market 1Q10 2Q10 3Q10 4Q10 1Q11 2Q11 3Q11 4Q11 1Q12 2Q12
Hong Kong Occupa ncy (%) 84.9 84.0 85.9 91.6 87.8 87.7 89.6 91.9 87.3 88.1Avera ge Room Ra te (HK$) 1,108 1,106 1,091 1,360 1,302 1,286 1,281 1,558 1,483 1,415RevPar (HK$) 940 929 937 1,246 1,143 1,127 1,147 1,432 1,295 1,246RevPAR YOY Change (%) 11.0 38.7 31.4 29.0 21.6 21.3 22.4 14.9 13.3 10.5
Macau Occupa ncy (%) 83.8 83.5 83.5 87.3 85.2 87.4 90.0 90.8 87.3 85.7Avera ge Room Ra te (MOP) 1,129 1,120 1,168 1,276 1,304 1,290 1,336 1,516 1,472 1,376RevPar (MOP) 946 936 975 1,114 1,110 1,127 1,202 1,377 1,285 1,179RevPAR YOY Change (%) 2.6 -1.1 23.8 20.8 17.3 20.5 23.3 23.6 15.7 4.5
Taipei Occupa ncy (%) 72.4 75.9 69.6 83.1 75.9 71.1 71.0 83.3 75.5 79.2Avera ge Ra te (TW$) 3,515 3,706 3,441 3,662 3,683 3,932 3,684 3,964 3,975 4,182RevPAR (TW$) 2,544 2,813 2,395 3,042 2,794 2,794 2,616 3,304 3,003 3,314RevPAR YOY Change (%) 8.7 16.7 0.2 11.4 9.8 -0.7 9.2 8.6 7.5 18.6
Kaoshiung Occupa ncy (%) 63.0 70.5 66.6 73.6 60.9 65.7 64.7 74.7 61.3 68.6Avera ge Ra te (TW$) 2,506 2,170 2,276 2,226 2,497 2,307 2,487 2,328 2,721 2,302RevPAR (TW$) 1,579 1,531 1,516 1,639 1,520 1,515 1,609 1,738 1,669 1,579RevPAR YOY Change (%) 4.8 -1.9 5.5 10.9 -3.8 -1.0 6.1 6.1 9.8 4.2
Taichung Occupa ncy (%) 62.9 69.3 67.4 79.6 67.4 72.3 66.1 80.7 71.9 78.9Avera ge Ra te (TW$) 2,390 2,178 2,240 2,249 2,423 2,269 2,354 2,406 2,603 2,272RevPAR (TW$) 1,504 1,509 1,509 1,790 1,633 1,641 1,555 1,942 1,871 1,792RevPAR YOY Change (%) 14.0 19.8 19.0 19.5 8.6 8.7 3.1 8.5 14.6 9.2
Source: HKTB, MOT, MGOT
Macau had a phenomenal year in 2011 where all three metrics topped out in the last quarter. However, the hotel market has felt the ripple effect of the global economic downturn since then. RevPAR slipped by 6.6% in Q1 2012 compared to Q4 2011, attributable to softer demand during Chinese New Year and a slow economy. RevPAR continued its downward trend in Q2 2012 with an 8.3% decline quarter-on-quarter. This is mainly attributable to the opening of Holiday Inn Cotai and Conrad Cotai, which added 1,760 extra rooms to the market and diluted demand. The Sheraton Cotai, slated to be fully opened in Q1 2013, is expected to exert pressure on marketwide performance.
MACAU’S OCCUPANCY LEVELS OUT
Source: Macau Government Tourism Office
20%
30%
40%
50%
60%
70%
80%
90%
100%
0
200
400
600
800
1,000
1,200
1,400
1,600
1Q10 2Q10 3Q10 4Q10 1Q11 2Q11 3Q11 4Q11 1Q12 2Q12
MOP
Average Rate RevPAR Occupancy
PAGE 7 An HVS Quarterly Hotel Market Update — Hotel Market Performance
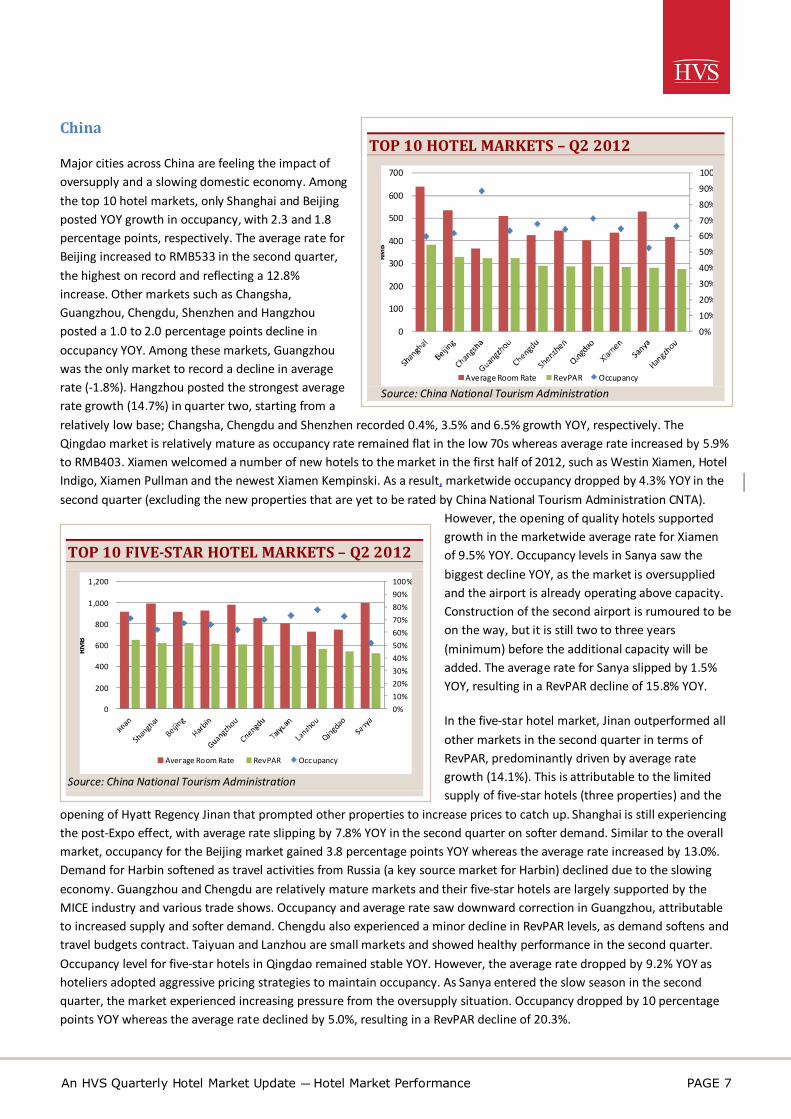
China
Major cities across China are feeling the impact of oversupply and a slowing domestic economy. Among the top 10 hotel markets, only Shanghai and Beijing posted YOY growth in occupancy, with 2.3 and 1.8 percentage points, respectively. The average rate for Beijing increased to RMB533 in the second quarter, the highest on record and reflecting a 12.8% increase. Other markets such as Changsha, Guangzhou, Chengdu, Shenzhen and Hangzhou posted a 1.0 to 2.0 percentage points decline in occupancy YOY. Among these markets, Guangzhou was the only market to record a decline in average rate (-1.8%). Hangzhou posted the strongest average rate growth (14.7%) in quarter two, starting from a relatively low base; Changsha, Chengdu and Shenzhen recorded 0.4%, 3.5% and 6.5% growth YOY, respectively. The Qingdao market is relatively mature as occupancy rate remained flat in the low 70s whereas average rate increased by 5.9% to RMB403. Xiamen welcomed a number of new hotels to the market in the first half of 2012, such as Westin Xiamen, Hotel Indigo, Xiamen Pullman and the newest Xiamen Kempinski. As a result, marketwide occupancy dropped by 4.3% YOY in the second quarter (excluding the new properties that are yet to be rated by China National Tourism Administration CNTA).
However, the opening of quality hotels supported growth in the marketwide average rate for Xiamen of 9.5% YOY. Occupancy levels in Sanya saw the biggest decline YOY, as the market is oversupplied and the airport is already operating above capacity. Construction of the second airport is rumoured to be on the way, but it is still two to three years (minimum) before the additional capacity will be added. The average rate for Sanya slipped by 1.5% YOY, resulting in a RevPAR decline of 15.8% YOY.
In the five-star hotel market, Jinan outperformed all other markets in the second quarter in terms of RevPAR, predominantly driven by average rate growth (14.1%). This is attributable to the limited supply of five-star hotels (three properties) and the
opening of Hyatt Regency Jinan that prompted other properties to increase prices to catch up. Shanghai is still experiencing the post-Expo effect, with average rate slipping by 7.8% YOY in the second quarter on softer demand. Similar to the overall market, occupancy for the Beijing market gained 3.8 percentage points YOY whereas the average rate increased by 13.0%. Demand for Harbin softened as travel activities from Russia (a key source market for Harbin) declined due to the slowing economy. Guangzhou and Chengdu are relatively mature markets and their five-star hotels are largely supported by the MICE industry and various trade shows. Occupancy and average rate saw downward correction in Guangzhou, attributable to increased supply and softer demand. Chengdu also experienced a minor decline in RevPAR levels, as demand softens and travel budgets contract. Taiyuan and Lanzhou are small markets and showed healthy performance in the second quarter. Occupancy level for five-star hotels in Qingdao remained stable YOY. However, the average rate dropped by 9.2% YOY as hoteliers adopted aggressive pricing strategies to maintain occupancy. As Sanya entered the slow season in the second quarter, the market experienced increasing pressure from the oversupply situation. Occupancy dropped by 10 percentage points YOY whereas the average rate declined by 5.0%, resulting in a RevPAR decline of 20.3%.
TOP 10 HOTEL MARKETS – Q2 2012
Source: China National Tourism Administration
0%
10%
20%
30%
40%
50%
60%70%
80%
90%
100%
0
100
200
300
400
500
600
700
RMB
Average Room Rate RevPAR Occupancy
TOP 10 FIVE-STAR HOTEL MARKETS – Q2 2012
Source: China National Tourism Administration
0%10%20%30%40%50%60%70%80%90%100%
0
200
400
600
800
1,000
1,200
RMB
Average Room Rate RevPAR Occupancy
An HVS Quarterly Hotel Market Update — Hotel Market Performance PAGE 8
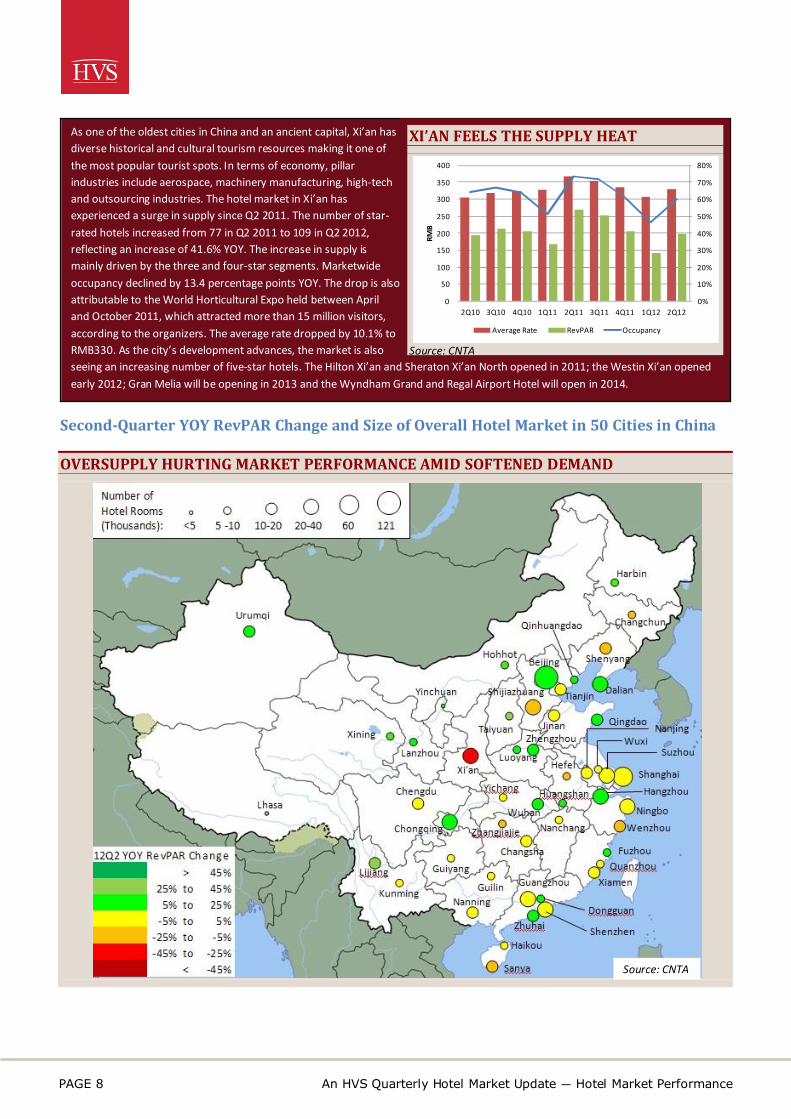
Second-Quarter YOY RevPAR Change and Size of Overall Hotel Market in 50 Cities in China
OVERSUPPLY HURTING MARKET PERFORMANCE AMID SOFTENED DEMAND
As one of the oldest cities in China and an ancient capital, Xi’an has diverse historical and cultural tourism resources making it one of the most popular tourist spots. In terms of economy, pillar industries include aerospace, machinery manufacturing, high-tech and outsourcing industries. The hotel market in Xi’an has experienced a surge in supply since Q2 2011. The number of star-rated hotels increased from 77 in Q2 2011 to 109 in Q2 2012, reflecting an increase of 41.6% YOY. The increase in supply is mainly driven by the three and four-star segments. Marketwide occupancy declined by 13.4 percentage points YOY. The drop is also attributable to the World Horticultural Expo held between April and October 2011, which attracted more than 15 million visitors, according to the organizers. The average rate dropped by 10.1% to RMB330. As the city’s development advances, the market is also seeing an increasing number of five-star hotels. The Hilton Xi’an and Sheraton Xi’an North opened in 2011; the Westin Xi’an opened early 2012; Gran Melia will be opening in 2013 and the Wyndham Grand and Regal Airport Hotel will open in 2014.
XI’AN FEELS THE SUPPLY HEAT
Source: CNTA
0%
10%
20%
30%
40%
50%
60%
70%
80%
0
50
100
150
200
250
300
350
400
2Q10 3Q10 4Q10 1Q11 2Q11 3Q11 4Q11 1Q12 2Q12
RMB
Average Rate RevPAR Occupancy
Source: CNTA
PAGE 9 An HVS Quarterly Hotel Market Update — Hotel Market Performance
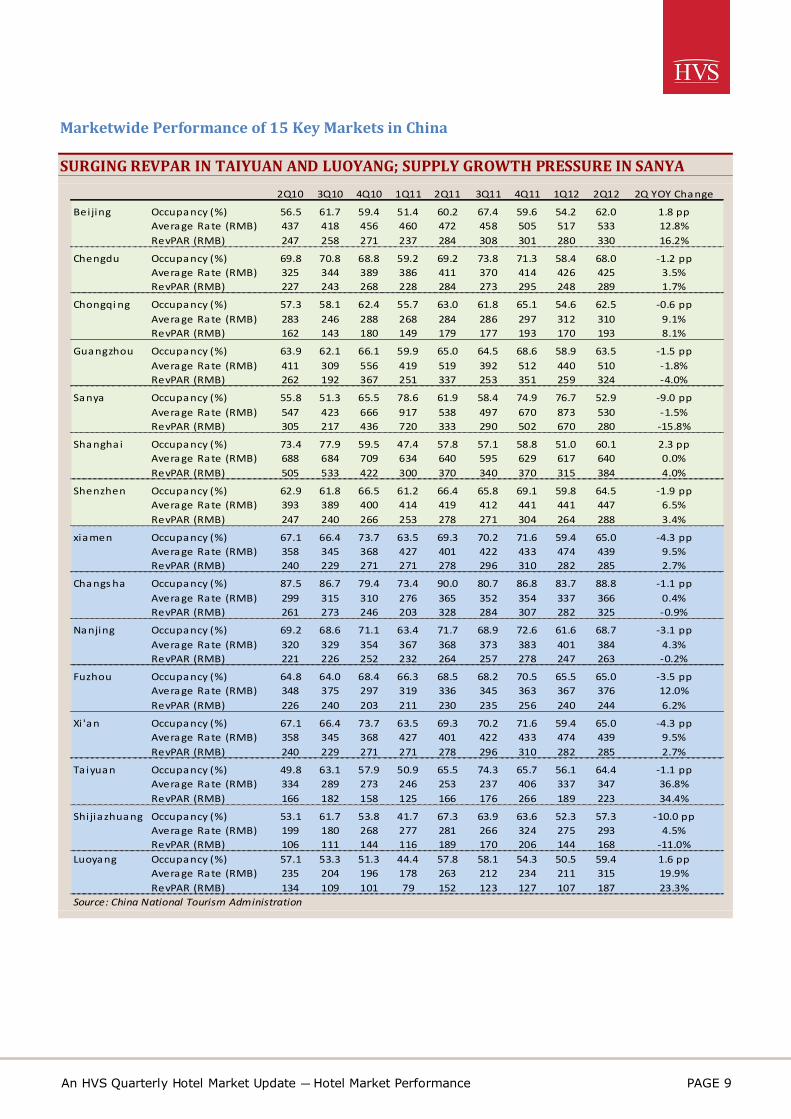
Marketwide Performance of 15 Key Markets in China
SURGING REVPAR IN TAIYUAN AND LUOYANG; SUPPLY GROWTH PRESSURE IN SANYA
2Q10 3Q10 4Q10 1Q11 2Q11 3Q11 4Q11 1Q12 2Q12 2Q YOY Change
Bei jing Occupancy (%) 56.5 61.7 59.4 51.4 60.2 67.4 59.6 54.2 62.0 1.8 ppAverage Rate (RMB) 437 418 456 460 472 458 505 517 533 12.8%RevPAR (RMB) 247 258 271 237 284 308 301 280 330 16.2%
Chengdu Occupancy (%) 69.8 70.8 68.8 59.2 69.2 73.8 71.3 58.4 68.0 -1.2 ppAverage Rate (RMB) 325 344 389 386 411 370 414 426 425 3.5%RevPAR (RMB) 227 243 268 228 284 273 295 248 289 1.7%
Chongqi ng Occupancy (%) 57.3 58.1 62.4 55.7 63.0 61.8 65.1 54.6 62.5 -0.6 ppAverage Rate (RMB) 283 246 288 268 284 286 297 312 310 9.1%RevPAR (RMB) 162 143 180 149 179 177 193 170 193 8.1%
Guangzhou Occupancy (%) 63.9 62.1 66.1 59.9 65.0 64.5 68.6 58.9 63.5 -1.5 ppAverage Rate (RMB) 411 309 556 419 519 392 512 440 510 -1.8%RevPAR (RMB) 262 192 367 251 337 253 351 259 324 -4.0%
Sanya Occupancy (%) 55.8 51.3 65.5 78.6 61.9 58.4 74.9 76.7 52.9 -9.0 ppAverage Rate (RMB) 547 423 666 917 538 497 670 873 530 -1.5%RevPAR (RMB) 305 217 436 720 333 290 502 670 280 -15.8%
Shanghai Occupancy (%) 73.4 77.9 59.5 47.4 57.8 57.1 58.8 51.0 60.1 2.3 ppAverage Rate (RMB) 688 684 709 634 640 595 629 617 640 0.0%RevPAR (RMB) 505 533 422 300 370 340 370 315 384 4.0%
Shenzhen Occupancy (%) 62.9 61.8 66.5 61.2 66.4 65.8 69.1 59.8 64.5 -1.9 ppAverage Rate (RMB) 393 389 400 414 419 412 441 441 447 6.5%RevPAR (RMB) 247 240 266 253 278 271 304 264 288 3.4%
xiamen Occupancy (%) 67.1 66.4 73.7 63.5 69.3 70.2 71.6 59.4 65.0 -4.3 ppAverage Rate (RMB) 358 345 368 427 401 422 433 474 439 9.5%RevPAR (RMB) 240 229 271 271 278 296 310 282 285 2.7%
Changs ha Occupancy (%) 87.5 86.7 79.4 73.4 90.0 80.7 86.8 83.7 88.8 -1.1 ppAverage Rate (RMB) 299 315 310 276 365 352 354 337 366 0.4%RevPAR (RMB) 261 273 246 203 328 284 307 282 325 -0.9%
Nanjing Occupancy (%) 69.2 68.6 71.1 63.4 71.7 68.9 72.6 61.6 68.7 -3.1 ppAverage Rate (RMB) 320 329 354 367 368 373 383 401 384 4.3%RevPAR (RMB) 221 226 252 232 264 257 278 247 263 -0.2%
Fuzhou Occupancy (%) 64.8 64.0 68.4 66.3 68.5 68.2 70.5 65.5 65.0 -3.5 ppAverage Rate (RMB) 348 375 297 319 336 345 363 367 376 12.0%RevPAR (RMB) 226 240 203 211 230 235 256 240 244 6.2%
Xi 'an Occupancy (%) 67.1 66.4 73.7 63.5 69.3 70.2 71.6 59.4 65.0 -4.3 ppAverage Rate (RMB) 358 345 368 427 401 422 433 474 439 9.5%RevPAR (RMB) 240 229 271 271 278 296 310 282 285 2.7%
Taiyuan Occupancy (%) 49.8 63.1 57.9 50.9 65.5 74.3 65.7 56.1 64.4 -1.1 ppAverage Rate (RMB) 334 289 273 246 253 237 406 337 347 36.8%RevPAR (RMB) 166 182 158 125 166 176 266 189 223 34.4%
Shijiazhuang Occupancy (%) 53.1 61.7 53.8 41.7 67.3 63.9 63.6 52.3 57.3 -10.0 ppAverage Rate (RMB) 199 180 268 277 281 266 324 275 293 4.5%RevPAR (RMB) 106 111 144 116 189 170 206 144 168 -11.0%
Luoyang Occupancy (%) 57.1 53.3 51.3 44.4 57.8 58.1 54.3 50.5 59.4 1.6 ppAverage Rate (RMB) 235 204 196 178 263 212 234 211 315 19.9%RevPAR (RMB) 134 109 101 79 152 123 127 107 187 23.3%
Source: China National Tourism Administration
An HVS Quarterly Hotel Market Update — Boutique Hotels – Still a Fuzzy Term PAGE 10
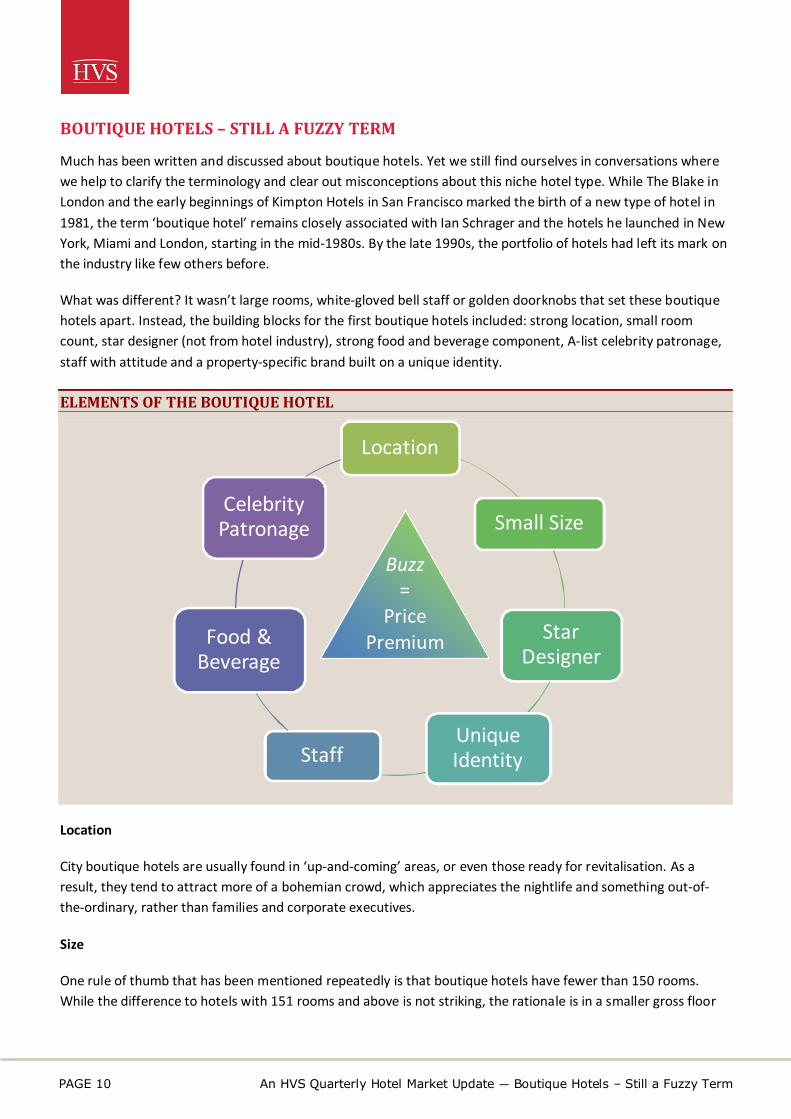
BOUTIQUE HOTELS – STILL A FUZZY TERM
Much has been written and discussed about boutique hotels. Yet we still find ourselves in conversations where we help to clarify the terminology and clear out misconceptions about this niche hotel type. While The Blake in London and the early beginnings of Kimpton Hotels in San Francisco marked the birth of a new type of hotel in 1981, the term ‘boutique hotel’ remains closely associated with Ian Schrager and the hotels he launched in New York, Miami and London, starting in the mid-1980s. By the late 1990s, the portfolio of hotels had left its mark on the industry like few others before.
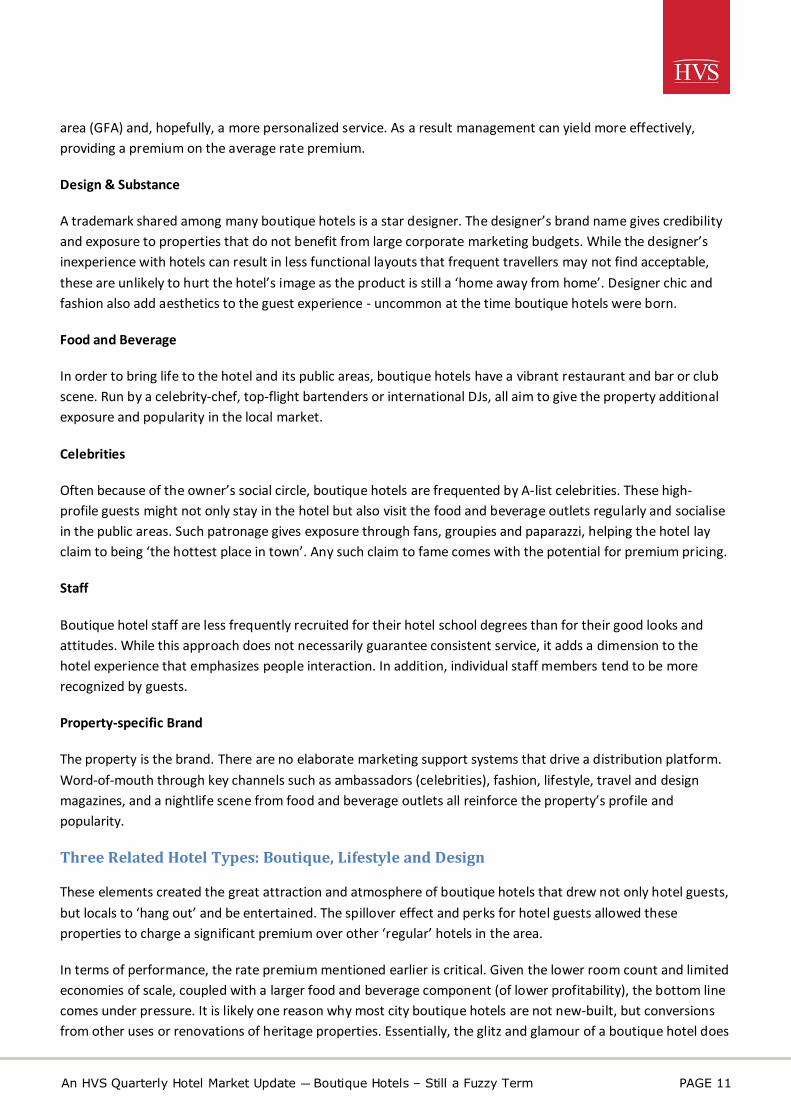
What was different? It wasn’t large rooms, white-gloved bell staff or golden doorknobs that set these boutique hotels apart. Instead, the building blocks for the first boutique hotels included: strong location, small room count, star designer (not from hotel industry), strong food and beverage component, A-list celebrity patronage, staff with attitude and a property-specific brand built on a unique identity.
ELEMENTS OF THE BOUTIQUE HOTEL
Location
City boutique hotels are usually found in ‘up-and-coming’ areas, or even those ready for revitalisation. As a result, they tend to attract more of a bohemian crowd, which appreciates the nightlife and something out-of-the-ordinary, rather than families and corporate executives.
Size
One rule of thumb that has been mentioned repeatedly is that boutique hotels have fewer than 150 rooms. While the difference to hotels with 151 rooms and above is not striking, the rationale is in a smaller gross floor
Location
Small Size
Star Designer
Unique IdentityStaff
Food & Beverage
Celebrity Patronage
Buzz =
Price Premium
PAGE 11 An HVS Quarterly Hotel Market Update — Boutique Hotels – Still a Fuzzy Term
area (GFA) and, hopefully, a more personalized service. As a result management can yield more effectively, providing a premium on the average rate premium.
Design & Substance
A trademark shared among many boutique hotels is a star designer. The designer’s brand name gives credibility and exposure to properties that do not benefit from large corporate marketing budgets. While the designer’s inexperience with hotels can result in less functional layouts that frequent travellers may not find acceptable, these are unlikely to hurt the hotel’s image as the product is still a ‘home away from home’. Designer chic and fashion also add aesthetics to the guest experience - uncommon at the time boutique hotels were born.
Food and Beverage
In order to bring life to the hotel and its public areas, boutique hotels have a vibrant restaurant and bar or club scene. Run by a celebrity-chef, top-flight bartenders or international DJs, all aim to give the property additional exposure and popularity in the local market.
Celebrities
Often because of the owner’s social circle, boutique hotels are frequented by A-list celebrities. These high-profile guests might not only stay in the hotel but also visit the food and beverage outlets regularly and socialise in the public areas. Such patronage gives exposure through fans, groupies and paparazzi, helping the hotel lay claim to being ‘the hottest place in town’. Any such claim to fame comes with the potential for premium pricing.
Staff
Boutique hotel staff are less frequently recruited for their hotel school degrees than for their good looks and attitudes. While this approach does not necessarily guarantee consistent service, it adds a dimension to the hotel experience that emphasizes people interaction. In addition, individual staff members tend to be more recognized by guests.
Property-specific Brand
The property is the brand. There are no elaborate marketing support systems that drive a distribution platform. Word-of-mouth through key channels such as ambassadors (celebrities), fashion, lifestyle, travel and design magazines, and a nightlife scene from food and beverage outlets all reinforce the property’s profile and popularity.
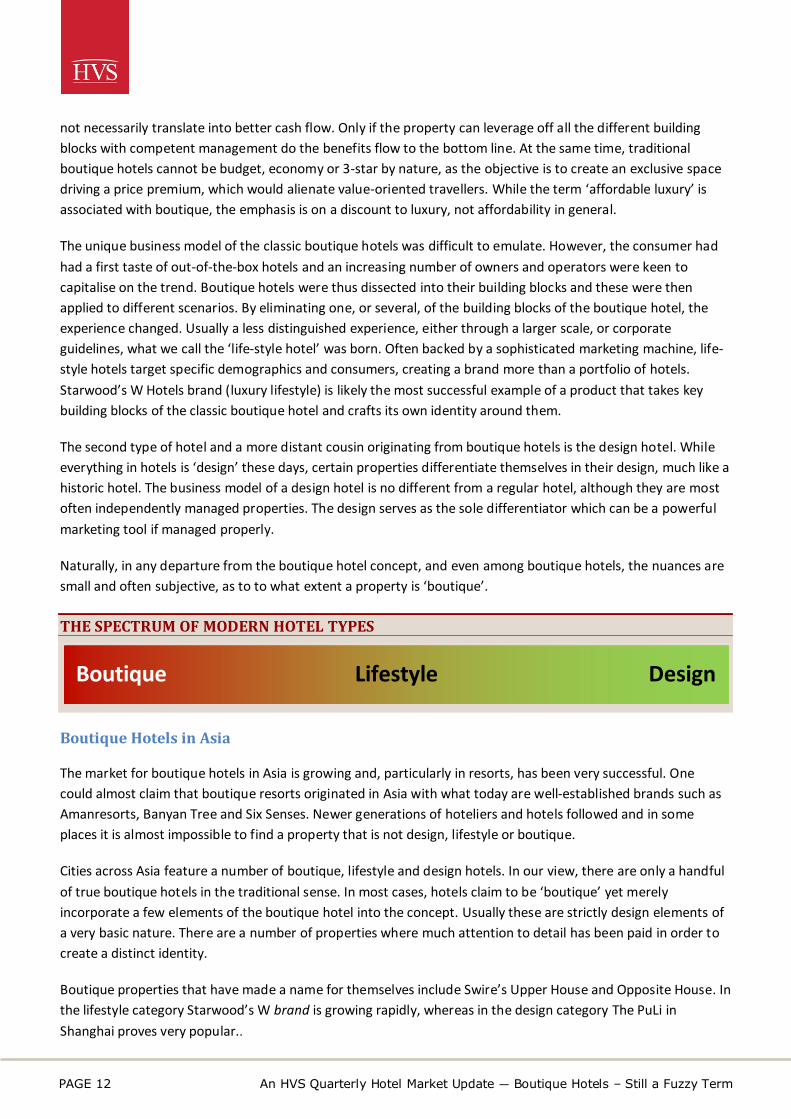
Three Related Hotel Types: Boutique, Lifestyle and Design
These elements created the great attraction and atmosphere of boutique hotels that drew not only hotel guests, but locals to ‘hang out’ and be entertained. The spillover effect and perks for hotel guests allowed these properties to charge a significant premium over other ‘regular’ hotels in the area.
In terms of performance, the rate premium mentioned earlier is critical. Given the lower room count and limited economies of scale, coupled with a larger food and beverage component (of lower profitability), the bottom line comes under pressure. It is likely one reason why most city boutique hotels are not new-built, but conversions from other uses or renovations of heritage properties. Essentially, the glitz and glamour of a boutique hotel does
An HVS Quarterly Hotel Market Update — Boutique Hotels – Still a Fuzzy Term PAGE 12
not necessarily translate into better cash flow. Only if the property can leverage off all the different building blocks with competent management do the benefits flow to the bottom line. At the same time, traditional boutique hotels cannot be budget, economy or 3-star by nature, as the objective is to create an exclusive space driving a price premium, which would alienate value-oriented travellers. While the term ‘affordable luxury’ is associated with boutique, the emphasis is on a discount to luxury, not affordability in general.
The unique business model of the classic boutique hotels was difficult to emulate. However, the consumer had had a first taste of out-of-the-box hotels and an increasing number of owners and operators were keen to capitalise on the trend. Boutique hotels were thus dissected into their building blocks and these were then applied to different scenarios. By eliminating one, or several, of the building blocks of the boutique hotel, the experience changed. Usually a less distinguished experience, either through a larger scale, or corporate guidelines, what we call the ‘life-style hotel’ was born. Often backed by a sophisticated marketing machine, life-style hotels target specific demographics and consumers, creating a brand more than a portfolio of hotels. Starwood’s W Hotels brand (luxury lifestyle) is likely the most successful example of a product that takes key building blocks of the classic boutique hotel and crafts its own identity around them.
The second type of hotel and a more distant cousin originating from boutique hotels is the design hotel. While everything in hotels is ‘design’ these days, certain properties differentiate themselves in their design, much like a historic hotel. The business model of a design hotel is no different from a regular hotel, although they are most often independently managed properties. The design serves as the sole differentiator which can be a powerful marketing tool if managed properly.
Naturally, in any departure from the boutique hotel concept, and even among boutique hotels, the nuances are small and often subjective, as to to what extent a property is ‘boutique’.
THE SPECTRUM OF MODERN HOTEL TYPES
Boutique Hotels in Asia
The market for boutique hotels in Asia is growing and, particularly in resorts, has been very successful. One could almost claim that boutique resorts originated in Asia with what today are well-established brands such as Amanresorts, Banyan Tree and Six Senses. Newer generations of hoteliers and hotels followed and in some places it is almost impossible to find a property that is not design, lifestyle or boutique.
Cities across Asia feature a number of boutique, lifestyle and design hotels. In our view, there are only a handful of true boutique hotels in the traditional sense. In most cases, hotels claim to be ‘boutique’ yet merely incorporate a few elements of the boutique hotel into the concept. Usually these are strictly design elements of a very basic nature. There are a number of properties where much attention to detail has been paid in order to create a distinct identity.
Boutique properties that have made a name for themselves include Swire’s Upper House and Opposite House. In the lifestyle category Starwood’s W brand is growing rapidly, whereas in the design category The PuLi in Shanghai proves very popular..
Boutique Lifestyle Design

www.hvs.com HVS Hong Kong | Level 21, The Centre, 99 Queen’s Road Central, Hong Kong
ABOUT HVS HVS is the world’s leading consulting and services organization focused on the hotel, restaurant, shared ownership, gaming, and leisure industries. Established in 1980 by President and CEO Steve Rushmore, MAI, FRICS, CHA, the company offers a comprehensive scope of services and specialized industry expertise to help you enhance the economic returns and value of your hospitality assets.
Over the past three decades, HVS has expanded both its range of services and its geographical boundaries. The company’s global reach, through a network of 30 offices staffed by 400 seasoned industry professionals, gives you access to an unparalleled range of complementary services for the hospitality industry. The company performs more than 2,000 assignments per year for virtually every major industry participant. HVS principals are regarded as the leading professionals in their respective regions of the globe.
In Asia-Pacific, HVS is represented by six offices in Hong Kong, Shanghai, Beijing, New Delhi, Mumbai and Singapore. HVS hosts two of the main annual industry events in the region, namely the China Hotel Investment Conference (CHIC) in Shanghai and Hotel Investment Conference South Asia (HICSA). HVS publishes a wide range of leading research, which can be found in our online library.
The Hong Kong team has worked on a wide range of projects that include economic studies, hotel valuations, operator search and management contract negotiation, development strategies for new brands, asset management, research reports and investment advisory for hotels, resorts, serviced residences and branded residential development projects. HVS Hong Kong’s clients include New World Development, The Wharf, Sun Hung Kai, Samsung, SK, Lotte, Taj Hotels and Resorts, Agile Property Holdings, Citibank, LaSalle Investment Management, amongst others.
Cathy Luo is an associate of HVS Hong Kong, working primarily on hotel consulting assignments, including market studies and feasibility studies in the Asia-Pacific region. Graduating with a Bachelor of Arts (Honours) degree in Hospitality Finance and Revenue Management from Glion Institute of Higher Education, Cathy has accumulated a number of working experiences in various hotel operation departments and has a
solid understanding of hotel operations. Her previous experience in revenue management with Marriott International further enhanced her knowledge of hotel strategy planning and management. With experience working in Dubai, Hong Kong and China, Cathy brings a comprehensive knowledge of the hospitality industry to HVS.
For further information, please contact [email protected].
To sign up for this or other HVS newsletters, please visit www.hvs.com/register/
Daniel J Voellm, Managing Director of HVS Hong Kong, has provided advice in major markets including China, South Korea, Hong Kong SAR, Taiwan, Thailand, Vietnam, Cambodia, Singapore, Indonesia and Maldives. Prior to heading the Hong Kong office, Daniel Voellm was Vice President at HVS’ global headquarters in New York conducting a wide range of appraisals, market studies and underwriting due diligence
services in 22 states as well as Canada. Daniel brings a strong understanding of the hospitality industry to HVS. His experience in hotel and food and beverage operations in Germany, Switzerland, England and the United States is complemented by an Honours Bachelor of Science degree from Ecole hôtelière de Lausanne in Switzerland. Daniel works closely with key institutional and private owners of hotel properties, financiers, developers and investors, and has gained a strong understanding of their investment requirements and approaches to assessing market values of investment properties. Daniel further advises on property and concept development and strategy.
NEWSLETTER 3RD QUARTER, 2012