Embed Size (px)
Citation preview

StudieS
360 Public Finance Quarterly 2016/3
TThe economic policy since 2010 induced mostly critical publications that rhymed with each other and generated a latent consensus among Hungarian economists. Namely that there is no coherent economic policy strategy in Hungary since 2010. Opinions appeared not only in daily, weekly and monthly periodicals addressed to the public (among others Békesi, 2014; Chikán, 2015; Mell-ár, 2015), but in scientific journals (Kornai, 2012) and renowned institutions’ country reports (among others european Commission, 2014, 2015; iMF, 2014).
We must note though that recent opinions from the european Commission (2016), the iMF (2016) and some private global financial
service companies such as Morgan Stanely (2016)1 at least partially acknowledge the suc-cesses of the Hungarian economic policy after 2010.
The aim of this study is to introduce the challenges of Hungarian economic policy after the 2008 financial world crisis and to evaluate any given solutions to the particular challenges in the context of the post–2010 pe-riod. The paper argues that current challenges of the Hungarian economy are deeply rooted in the past decisions and that the Hungarian economic policy model after 2010 aims to ad-dress these challenges.
Our hypothesis is that Hungary’s unique foreign debt position in the region and the necessity for foreign debt financing combined with mismanaged economic transformation caused tremendous external and internal
László György – József Veress
The Hungarian Economic Policy Model After 2010Summary: The aim of this paper is to understand and provide reasoning for the strategic changes in Hungarian economic policy after
2010. High levels of foreign indebtedness and internal imbalances have necessitated the strategic changes in economic policy in
Hungary after 2010. Due to the strategic changes results have been reached as follows. Decreasing internal imbalances: employment
rate increased by 9 precentage points, tax burden of SMEs decreased by 9.1 percentage points; wage ratio increased due to income
redistribution from sectoral taxes to wage tax allowances; as a result net wages and minimum wage increased in real terms by
10% and 14% between 2010–2015. Decreasing external imbalances: NFL decreased by 40% of GDP between 2010–2015; foreign
currency denominated state debt declined from 49% to 30% of GDP; state-owned shareholding increased by an estimated 5% of GDP
between 2010 and 2014 mostly in utilities, critical infrastructure and oligopolistic and monopolistic sectors. Following the diagnosis
of this paper, the measures after 2010 constitute a coherent economic policy strategy. The paper argues that current challenges of
the Hungarian economy are deeply rooted in the past decisions and that the economic policy model after 2010 aims to address these
challenges.
KeywordS: Transformation, Transition Economies, Unorthodoxy, Foreign Indebtedness, Internal Imbalance
JeL codeS: 057, P52, E60
E-mail address: [email protected] [email protected]

StudieS
Public Finance Quarterly 2016/3 361
imbalances in the Hungarian economy that called for the change in economic policy strat-egy after 2010.
Section 2 contains a historical analysis of the most important strategic economic policy decisions between 1970 and 2010 that led to the external and internal imbalances of the economy. Section 3 is a summary of chal-lenges that were created by previous strategic decisions, which manifested themselves dur-ing the 2007–08 financial world crisis. Sec-tion 4 is a summary of measures and results that the economic policy has achieved in the post–2010 period. in section 5, we discuss the future outlook of Hungarian economic policy.
HISTorIcaL aNaLySIS oF THE HUNGarIaN EcoNoMIc PoLIcy 1970–2010
tripling GdP per employee and 28% increase in net real wages between 1970–2010in 1970, (calculated in HuF, 2010) the average employee contributed 198,000 HuF per month to the production of GdP, with an average net real wage of 103,600 HuF.2 By 2010, the GdP produced by the average employee had nearly tripled (586,400 HuF), but the average net real wage increased by only 28% to 132,600 HuF (Figure 1), moreover, the net wage ratio dropped to 23% from 52%. in 2010, 90% of total capital incomes were realised by the highest income decile, and annually 5–7% of the GdP left the country in the form of income transferred to foreigners.3,4,,5 From the point of view of the average employee the growth of GdP has literally no effect. Why is this the case? On the one hand, at the transition 1.5 million jobs, 30 percent of workplaces ceased. The employment increased a little more than houndred thousand between 1995 and 2010. The average employee therefore have to cover the social expenses of more inactive citizen
from their gross wages, and consequently they receive less from the value of their work. The phenomenon is represented by Figure 1.
Hungarian state debt increased from 14% to 80% of GdP between 1970–1989until economic transition, the state owned a majority of productive assets. Although this is an ineffective solution to managing an economy, the government covered the expenses of large distributive systems (such as education, health care and pensions funds) from the revenues of State Owned enterprises (SOes). However, the impending bankruptcy of the Hungarian state began unfolding in 1974 and the oil shocks of the 70s also had a serious impact on the Hungarian trade balance. even so, internal economic policy chose not to restructure the economy and curb consumption, but rather turned to foreign currency loans to cover the resulting trade deficits (Bekker, 1995). These foreign currency loans only became public knowledge during the economic transition when it became evident that state debt had increased from 18 to 62% of GdP between 1974 and 1979 and subsequently to 80% by 1989 (Figure 2).6
it is also important to emphasize that the Hungarian state found itself in a debt trap by 1979. it’s not overconsumption, as profes-sional opinions suggest, but the accumulated interest payments and exchange rate loss that caused the majority of indebtedness in the 70s and 80s. While net state debt increased by 14 billion uSd, call for funds was only between 1–1.5 billion uSd between 1974–1989. (For more detailed analysis see Oblath, 1992; Lóránt, 2009; Szabó, 2015.)
Huge foreign indebtedness led to preference for external sources of capital during privatisationThe symptoms of previous wasteful economic resource allocation became immediately

StudieS
362 Public Finance Quarterly 2016/3
evident. The economic transition process was burdened by external financial pressure, resorted to a large share of the banking sector and utility companies, among other sectors, be-ing privatised to foreign owners to ease capital constraints. Sectors which in mixed economies (Switzerland, France, Germany and Singapo-re among others) and in transition economies would normally remain in government or national ownership, were sold off to foreigners. As privatisation and foreign direct investment (Fdi) could only cover the short-term financial problems of the Hungarian economy, the symptoms of external indebtedness were temporarily remedied (Mihályi, 2010; László, 2004), this conclusion is also confirmed by Oblath and Pula (2000); Czeti and Hoffmann (2006), and see also detailed information about the effect of Fdi in transition economies given
in Muraközy (2007); Kaderják (1996); Hunya (1995).
At the time of the economic transforma-tion, economists in decision-making positions saw the opportunity to repay the state’s ex-ternal debt through the privatisation process arguing that the sale of half of the state’s pro-ductive assets would be sufficient to repay the debts. State-owned assets earmarked for priva-tisation had a value of 1.670 billion HuF at 1990 prices or 27.18 billion uSd.7 This was roughly double the value of net government debt of 15 billion uSd that existed in 1989. Following cautious estimates, the government sold state-owned assets at 28.7% of their book value between 1990 and 2008.8 Hungary did not ask for debt relief being afraid of loss in confidence of the financial markets. Without detailing the debates dealing with the effects
Figure 1
The mosT imporTanT income indicaTors and The sTaTe of employmenT, 1970–2010 (calculaTed in huf, 2010)
Source: figures calculated based on HcSo statistics included data concerning the changes in real wages and minimum wages between 1992–2015; national accounts, 1960–2010; The development of Hungarian labour market, 1998–2010; consumer price index, 1960–2010; Statistical pocketbook of Hungary, 1956–1995.
Thou
sand
HU
F
Thou
sand
Number of employedNet real wage/employed/month (right axis)
Real GDP/employed/month (right axis)

StudieS
Public Finance Quarterly 2016/3 363
of a debt reduction, we just signal the fact Po-land appealed to its creditors for debt relief and reached 50–50 percent debt reduction from its state and private creditors during the 90s. After a short transitional financial impacts of the Polish debt relief, Poland’s international assessment and credit rating was steadily simi-lar, or almost identical to Hungary’s from the end of 90s until the financial crisis of 2008.
As a consequence of these actions, Hungary is now facing an enormous debt burden. debt service cost was 4.4% in Hungary in 2013 com-pared to 2.6% in Poland, 2% in Slovakia and 1.4% in the Czech Republic. Between 1995–2015 the average annual debt service in Hunga-ry was 4.05 percentage points higher in terms of GdP compared to the Czech Republic.9 Poland was the only country that faced a higher state debt at the time of economic transition, howev-er the Polish governments came to an agreement
with their creditors during the 90s and wrote off 50% of their debt.10 in Hungary, between 1993 and 1999 debt service expenditures were higher than the expenditures on education, culture and health service (Figure 3).11
An average Hungarian employee experienced a huge public productive asset loss between 1970–2010The public productive asset almost completely disappeared during the twenty years following the transition. This has two consequences. in 1970, (calculated in HuF, 2010) the productive public assets per average citizen reached 1.6 million HuF and the government debt amounted to 51,000 HuF, which means that the net public financial position of a citizen was 1,549,000 HuF.12,13 By 2010, the state-owned assets per capita decreased to 106,000 HuF while the government debt increased to
Figure 2
The developmenT of gross governmenT debT as a percenTage of The gdp
Source: 1970–1995: HcSo Statistical book of Hungary, 1956–1995. 1996–2015: Eurostat General government gross debt (% of GDP)

StudieS
364 Public Finance Quarterly 2016/3
1,634,000 HuF. As such, the public financial position of an average citizen became negative, and instead of having more liabilities than assets, he was indebted to an amount of 1,528,000 HuF (cca. 5,000 euR; figure 4).
Consequence of hurried liberalisation and deregulation: collapsing employment and industrial outputeconomic transformation is an extremely complex and far-reaching process, and we cannot deal with each field extensively.14 We concentrate on policies that in our opinion established the conditions for a later lag in economic performance in Hungary as compared to the Czech Republic and Poland.
Hungary was the front-runner in the region when establishing the institutional frame-work of the market economy (Györffy, 2006,
Kolodko, 2000). The process of changing the economic system began in the 80s, with the enactment of new and modern company and bankruptcy laws. Regulations to ensure the protection of direct foreign investments and to establish a two-tier banking system were also created before the change of the regime. By 1992, 90% of foreign trade was liberalised by Hungarian economic policy governance (Nagy, 1995).15
The rapid liberalisation without any signifi-cant protective measures, with the exception of a few products, and the non-devaluation of the Forint (compared to Polish zloty and Czech koruna) significantly contributed to the collapse of the Hungarian industry lead-ing to a disappearance of jobs and the reduc-tion in export volumes versus imports (Nagy, 1995). during the economic transition in
Figure 3
expendiTures spenT on debT service paymenTs, educaTion and culTure as well as healTh service as a percenTage of The gdp
Source: 1974–1995: data series of HcSo on health service, education and culture
1996–2014: data series of Eurostat on general government expenditure by function.
Debt service Health care Education, culture

StudieS
Public Finance Quarterly 2016/3 365
Hungary, nearly 30% of the workplaces disap-peared, while only 20% disappeared in Poland and 10% in Czechoslovakia. it is important to note that, although liberalisation occurred faster in Poland and Czechoslovakia than in Hungary, it went along with the abolish-ment of quotas, higher protective tariffs and subsequent devaluations (Csaba, 1998; Gács, 1993).16
The social effects of economic transforma-tion were aggravated by hurried liberalisation, deregulation and a too rigorous bankruptcy law. By the disintegration of Comecon, Hun-gary’s markets not only ceased but further market share was lost due to wrong economic policy decisions. The economic policy makers did not realize that while Hungarian market players had to face world market prices due to deregulation, east Asian competitors with
subsidized raw material and energy prices, and heavily subsidized european agricultural play-ers entered our liberalized markets.
Also, the most important export sector, the food industry collapsed partly due to mis-managed compensation. The 2,300 uSd per capita output of the agricultural industry in the mid 80s decreased to below 800 uSd per capita by the mid 90s and fluctuated between 540–782 uSd per capita between 2000 and 2012 (calculated in uSd PPP, 2005). The subsidy intensity of Hungarian agriculture never reached the intensity levels of the eu and OeCd countries through the 80s – which fluctuated between 40 and 48% – and dropped to 5% in the beginning of the 90s (for further information see Adam, 1995; Benet, 1997; Oblath, 2009; Penczner, 2010; Szabó 2010).
Figure 4
The developmenT of The public financial posiTion of an average ciTizen, 1970–2010 (Thousand huf, calculaTed in huf, 2010)
Source: own calculation based on data from Lóránt (2009): Net government debt/citizen: 1970-2007, cBH Quarterly and annual data on Balance
of Payments, HcSo: Population and information on mobility. The continuous line facilitates the clarity only and has no further meaning.
Tho
usan
d H
UF
Public productive assets per citizenNet public financial position of a citizen
Government dept per citizen

StudieS
366 Public Finance Quarterly 2016/3
Furthermore, many companies went bankrupt between 1992 and 1996 because of extensive trade liberalisation accompanied by an extremely strict bankruptcy law (Adam, 1995; Lóránt, 2009). The lack of resources and the circular debt of state-owned compa-nies during the transition period resulted in an abnormally high number of bankruptcies due to the severity of the bankruptcy laws, this conclusion is confirmed by Bonin and Schaffer (1995); Ábel (1995), who provide more in-depth analysis in different perspec-tive about the hidden motivation, the process and the short-term results of the above-men-tioned Hungarian bankruptcy law. Between 1992 and 1996 five times more companies went bankrupt in Hungary than in the Czech Republic and twice as many as in the four times more populist Poland (Antal, 2004; see Figure 5).17
Liberal economic policies combined with an unwise structure of social expenditures lead to low activityHungarian social policy expenditure is not high compared to the eu, however, it is high compared to its most developed regional coun-terparts.18 According to the eurostat COFOG database, Hungarian social expenditure in the 2 decades after the transition was 3 percentage points lower than the eu15 average. Apart from the period between 2004 and 2009, this was similar to that in the uK, a country that pursues a liberal economic policy. it is true, however, that it was still 3–6% higher than in the Czech Republic during the same period. Compared to the eu-average the social ex-penditures are therefore not too high, but it is compared to Hungary’s most developed re-gional competitor, which might be explained by the differences in employment as a conse-
Figure 5
number of recenTly closed companies (1992–1996)
Source: antal (2004)
Hungary Poland Czech Republic

StudieS
Public Finance Quarterly 2016/3 367
quence of differences in transition economic policies.19 The combination of liberal econom-ic policies (hurried liberalisation, deregulation and privatisation) and generous social policies including lavish early retirement schemes (see also Csaba, 2000) led to the early retirement of approximately 800,000 employees by the time of the economic transition and inspired inactivity in the long run, these facts are also supported by more in-depth analysis in work-ing papers by Blanchard (1994); Mihályi (2008, 4th chapter); Köllő (2001). if employ-ment was proportionally as high and debt ser-vice as low in Hungary in 2010 as it was in the Czech Republic, Hungarian net real wages would, theoretically, be 23% higher.20
2002–2010: new wave of indebtedness21
to finance consumption between 2002 and 2010, the country accumulated debt over and above that of the 70s. Gross government debt rose by 25.4%; this debt quadrupled in foreign currencies (its ratio in government debt in-creased from 25 to 48%). Private sector debt increased by 30% of GdP because of retail foreign currency borrowing and the weakening Forint (see also Oblath, 2014; eeAG, 2012).
Consumption growth was fuelled by credits, only partly backed by economic performance, and after 2008, the GdP dropped significantly. For the whole period of 2002–2010, economic growth only reached 12% while private sector and state debt increased by 55%.
coNSEQUENcES oF EcoNoMIc TraNSForMaTIoN aND DILaTory EcoNoMIc PoLIcy IN HUNGary: ProBLEM oF INTErNaL aND ExTErNaL BaLaNcES IN 2010
The consequences of the above-mentioned economic transition and dilatory economic policy are summarised in Figures 1–7.
Firstly, there is a noticeable internal imbal-ance in the economy (Figure 1.) The average employee contributes to a social welfare sys-tem based on inactivity (Cseres, 2007; Orbán, 2006). in this system, staying at home and receiving subsidies is more economical than working. This system is partly the result of the mismanaged economic transition, which in itself is a structural problem, but it is largely due to attitude which promotes inactivity and which is culturally embedded in the Hungar-ian society. The structural and cultural factors reinforced each other in the 20 years after the economic transition (Kovács, 2008; Kornai, 2005; Muraközy, 2008). This problem can be verbalised either as one million employees are missing, or as one million jobs are missing from the labour market.
Further problems related to the internal bal-ance include the dual economy and the tax structure. The allowances given to foreign di-rect investments and revenue losses from the sale of state-owned monopolies and oligopolies should be compensated in some way. This com-pensation is only possible by placing an extraor-dinary tax burden on the SMe sector, wages and consumption. earnings resulting from pri-vatisation were spent on repaying the govern-ment debt instead of improving the economy as it was originally planned. That was one of the main reasons for the development of the dual structure of the Hungarian economy by 1996. in other words, there is a mostly foreign-owned enterprise sector that enjoys considerable tax allowances. in this sector, the profitability is double, and it has triple available assets of its Hungarian-owned counterpart (Lóránt, 2009; Papp, 2012; Pitti, 2010). For many years, the tax burden on foreign companies was 10–18% (Papp, 2012), while our calculations and data of World Bank show that the Hungarian SMes faced a tax burden of 57.5%. Therefore, many of these small- and medium-sized companies chose to evade taxes, which was detrimental
StudieS
368 Public Finance Quarterly 2016/3
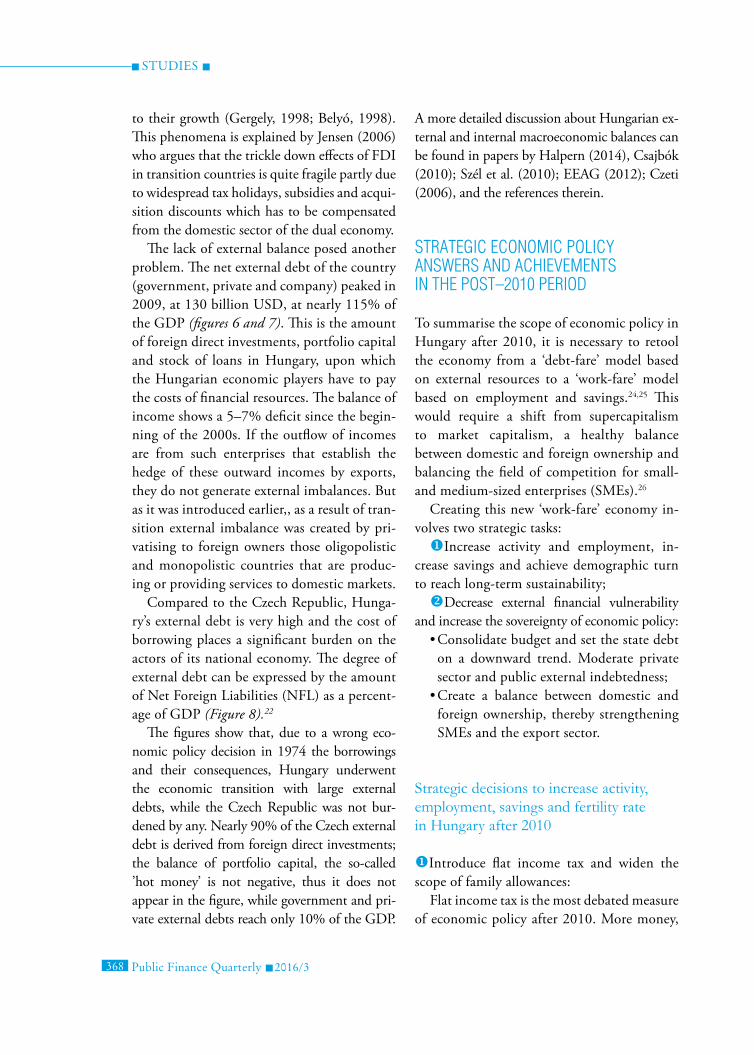
to their growth (Gergely, 1998; Belyó, 1998). This phenomena is explained by Jensen (2006) who argues that the trickle down effects of Fdi in transition countries is quite fragile partly due to widespread tax holidays, subsidies and acqui-sition discounts which has to be compensated from the domestic sector of the dual economy.
The lack of external balance posed another problem. The net external debt of the country (government, private and company) peaked in 2009, at 130 billion uSd, at nearly 115% of the GdP (figures 6 and 7). This is the amount of foreign direct investments, portfolio capital and stock of loans in Hungary, upon which the Hungarian economic players have to pay the costs of financial resources. The balance of income shows a 5–7% deficit since the begin-ning of the 2000s. if the outflow of incomes are from such enterprises that establish the hedge of these outward incomes by exports, they do not generate external imbalances. But as it was introduced earlier,, as a result of tran-sition external imbalance was created by pri-vatising to foreign owners those oligopolistic and monopolistic countries that are produc-ing or providing services to domestic markets.
Compared to the Czech Republic, Hunga-ry’s external debt is very high and the cost of borrowing places a significant burden on the actors of its national economy. The degree of external debt can be expressed by the amount of Net Foreign Liabilities (NFL) as a percent-age of GdP (Figure 8).22
The figures show that, due to a wrong eco-nomic policy decision in 1974 the borrowings and their consequences, Hungary underwent the economic transition with large external debts, while the Czech Republic was not bur-dened by any. Nearly 90% of the Czech external debt is derived from foreign direct investments; the balance of portfolio capital, the so-called ’hot money’ is not negative, thus it does not appear in the figure, while government and pri-vate external debts reach only 10% of the GdP.
A more detailed discussion about Hungarian ex-ternal and internal macroeconomic balances can be found in papers by Halpern (2014), Csajbók (2010); Szél et al. (2010); eeAG (2012); Czeti (2006), and the references therein.
STraTEGIc EcoNoMIc PoLIcy aNSwErS aND acHIEvEMENTS IN THE PoST–2010 PErIoD
to summarise the scope of economic policy in Hungary after 2010, it is necessary to retool the economy from a ‘debt-fare’ model based on external resources to a ‘work-fare’ model based on employment and savings.24,25 This would require a shift from supercapitalism to market capitalism, a healthy balance between domestic and foreign ownership and balancing the field of competition for small- and medium-sized enterprises (SMes).26
Creating this new ‘work-fare’ economy in-volves two strategic tasks:uincrease activity and employment, in-
crease savings and achieve demographic turn to reach long-term sustainability;vdecrease external financial vulnerability
and increase the sovereignty of economic policy:•Consolidate budget and set the state debt
on a downward trend. Moderate private sector and public external indebtedness;
•Create a balance between domestic and foreign ownership, thereby strengthening SMes and the export sector.
Strategic decisions to increase activity, employment, savings and fertility rate in Hungary after 2010
uintroduce flat income tax and widen the scope of family allowances:
Flat income tax is the most debated measure of economic policy after 2010. More money,

StudieS
Public Finance Quarterly 2016/3 369
Figure 6
The currenT accounT and The balance of foreign Trade as a percenTage of The gdp
Source: Hungarian Statistical yearbooks of HcSo, 1956–1995; cBH Quarterly and annual data on Balance of Payments from 1995 on
Figure 7
The developmenT of hungary’s exTernal debTas a percenTage of The gdp*
*NFDI – Net Foreign Direct Investment; Pri. NDL – Private Net Debt Liability (private sector + companies); Pub. NDL – Public Net Debt Liability
(government + central bank); PE + SD – Portfolio Equity + Short Debt
Source: calculations based on Balance of Payments Statistics of cBH and IMF
(X–IM) (GDP%) Curent account balance (GDP%)

StudieS
370 Public Finance Quarterly 2016/3
the equivalent of 2–2.5% of the GdP remains with the households, especially with the top 20% of wage earners and families. The launch of a flat tax was misinterpreted as income redistribution from low-income employees to middle and high-income employees, however, it was a form of redistribution towards a fairer sharing of the burden by charging less tax on wage earners and levying higher taxes on capital gains of oligopolistic and monopolistic market players. Special taxes were levied on oligopolies and monopolies (banks, utilities, mobile service providers, retail chains) and the VAt was increased by 2% to improve the balance of the budget. it is also worth mentioning the fact that in the lack of competition taxes on transactions and consumption can be easily passed onto consumers. Changes in wage income taxation contributed to a decrease in marginal tax
wedge of the average wage from 71% to 49% between 2009–2013 (OeCd statistics)27. Partly due to the income redistribution from sectoral taxes to decreasing personal income taxes, net wage and minimum real wage increased by 10 and 14% respectively between 2010–201528.vCreate a flexible labour market policy:Hungary’s new labour law made the Hun-
garian labour market among europe’s most flexible labour markets (OeCd, 2013).wAReform of the education system to
disseminate more valuable knowledge to the economy29:
•increase the ratio of vocational training at secondary level.
•Centralise the public education system first and foremost to decrease inequality.
•increase teachers’ salaries and introduce a teacher career model.
Figure 8
The developmenT of The exTernal debT of The czech republic as a percenTage of The gdp23
Source: calculations based on the data of the Česká Národní Banka (czech National Bank) Quarterly statistics on balance of payments.

StudieS
Public Finance Quarterly 2016/3 371
•increase tertiary education quotas in the fields of science and technical education and decrease them in social sciences.
•Finance the costs of higher education only for those who graduate and work in the country for a certain period.
•However, we must add that these changes are far from over and while intending to solve the most important deep-rooted challenges of the Hungarian educational policy, they have resulted in the creation of a set of new challenges, whose effects are yet to be felt.xReform the social benefit system in order
to facilitate employment:Public work programs were launched to
lead inactive people back into the labour mar-ket. The reform established a healthy relation between social benefits, public work wage and minimum wages, thus incentivising inac-tive people to enter the labour market. Public work programs should not be seen as compet-ing with private employment, but should be considered as the first step towards private em-ployment for those who lacked employment opportunities in the previous 15–20 years.
The aim of restructuring the social ben-efit system was to create a financial incentive mechanism to help inactive people back to the employment market: the social benefits to inac-tive people tend to be lower than public work wage which is lower than minimum wage. in the light of above mentioned context, public work programs generated from a greater chal-lenge (inactivity) a smaller challenge problem (not efficient work) in an area where there was no progress in the last two decades.yRevise early retirement allowances.zdecrease utility costs:As a result of the 2008 crisis significant
wage increases were not possible and eco-nomic policy looked for areas to reduce costs in order to increase the disposable income of households. utility costs were rising at an ex-
ceptionally fast pace between 1996 and 2010, especially until 2007, and a viable solution seemed to be to decrease approved utility prices by 20–25%. This equated to a 6.3% real wage increase for people earning below median wages who spent one-third of their income on utility costs.30,31
As a result, from 2010 to 2015, the em-ployment rate increased by 9.0% to 63.9% and activity rate by 6.7% to 68.6%. This sur-passed the employment rates of Poland and Slovakia, but was still 9–12 percentage points below the developed eurozone countries’ em-ployment and activity statistics.32 The results were still tenuous and 42% due to the public work program (that is considered as a mean and not an end), the initial step towards mar-ket employment.
decrease external financial vulnerability and increase economic policy sovereignty
Consolidating the budget and setting the state debt and external debt on a decreasing path�After 2010, the first and primary task was
to increase the sovereignty of economic policy decision-making. Nationalizing mandatory private pension funds played an important role in reducing the budget deficit to below 3% in the first year. 2015 was the fourth consecutive year when Hungary’s economy matched the Maast-richt criteria.�Reduce implicit state debt by creating the
balance of big distributive systems such as the pension system and the financing of local governments.�decrease foreign currency denominated
household debt ratio.As a result, state debt decreased from
81.3 to 75.3% of GdP between 2010–2015 and the foreign currency denominated state debt declined from 49% to 30% of GdP be-

StudieS
372 Public Finance Quarterly 2016/3
tween 2010–2015, the net foreign liabilities ratio also decreased from 111.73 to 71.51% of GdP between 2010–2015, representing a 40.22 percentage point decrease in 5 years. Further factors included the trade surplus and the measures taken to decrease foreign cur-rency denominated household debts.
excessive deficit procedure was subsequent-ly suspended in May 2013, after nine years, and the fear of losing eu development funds decreased.
Moving toward a balance between domestic and foreign ownership, strengthening small- and medium-sized enterprises and the export sectorThe extensive sale of public utility services in the 90s (gas and electricity providers, waterworks) to foreign investors is uniquely Hungarian. This practice was very rare even in the developed countries of continental europe. Similarly, the privatisation of banks, national telecommunication and oil companies was carried out with the inclusion of foreign investors. One reason for this phenomenon was that domestic capital was not available for the purchase of valuable companies sold through competition (László, 2004), while the other was the extremely high need for foreign financing of the Hungarian government’s foreign currency denominated debt service.�Based on calculations by Lóránt (2009),
foreign ownership in the banking sector rose above 80% due to privatisation in the 90s and the strategic goal to increase domestic ownership to 50% was achieved by 2014. The economic reason, besides power-political reasoning, was to create an even field for financing for local companies, mostly SMes.�The government increased domestic
ownership in oligopolistic and mono-polistic utility companies. The aim of
these re-nationalisation measures were to decrease profitability and move toward the balance between domestic and foreign ownership as it is recognised among the majority of developed countries and the successfully developing southeast Asian economies such as Singapore, South Korea, Japan and taiwan. Although it is a conventional wisdom in the field of economics that private ownership is more efficient than public, there is evidence in the economic literature that government-owned enterprises can also be as efficient as privately run enterprises (Feng et al., 2004), and can even outperform their privately owned competitors (Ang–ding, 2006). Therefore we’d rather focus on the balance of owning oligopolistic and monopolistic companies by foreign and domestic investors including the state.�A company in the weapons industry sector
(Rába) and some other manufacturing companies were nationalised for national security and solvency reasons.�Measures were taken to level the playing
field for SMes and large, oligopolistic and monopolistic companies. ! The Central Bank of Hungary launched
the Funding for Growth Scheme offer-ing credit to SMes at a 2.5% rate in July, 2013. its effect on investments is around 1.7% of GdP (500 billion HuF) with a GdP growth of 0.8–1.6% by the end of 2014. (CBH calculated a 1% growth effect to Funding for Growth Scheme in 2014.)
Corporate tax on SMes decreased from 19 to 10%.
The Hungarian National trading House was established to help SMes to gain export markets on traditional and newly emerging export markets. it is the ques-tion of present and future whether the structure can be filled with content.

StudieS
Public Finance Quarterly 2016/3 373
taxes were increased or special taxes were levied on specific, mostly oligopo-listic and monopolistic sectors (for de-tailed analysis see Voszka, 2013).
to increase stability, by mid–2014 the government signed strategic partner-ship agreements with around 50 com-panies or groups of companies. The main reason was to increase predict-ability for the strategically important export-oriented investors and employ-ers in the economy.
it is important to emphasise that the gov-ernment does not want to bypass market and private property (Voszka, 2013) but rather restore mixed economic circumstances. As a result of renationalisation, the state ownership doubled between 2010–2014 with an estimat-ed increase of 5% of the GdP. As a result of strengthening small- and medium-sized enter-prises, the tax burden of SMes decreased from 57.5% to 48.4% between 2010–201533.
wHaT’S NExT?
The changes targeting the internal and external imbalance of the economy were implemented during the aftermath of the 2007–08 financial world crisis, which had a dual effect on Hungary. First, because of the high external indebtedness of the economy, second, because of the high budget deficit and increasing state debt, which led to an excessive deficit Procedure against Hungary by the eu Commission in 2004.
the results must be measured accordingly. Critical opinions stating that the Hungarian
economic policy after 2010 is unpredictable are only partially true. if one follows the diagnosis of this paper, the measures after 2010 constitute a coherent economic policy strategy.
it is a cliché that the realisation of strategic plans can easily go awry and that strategic changes create new problems. The new rules and goals are set, but the transformation of the public and the higher education system, and the innovation system is far from over. The future of the Hungarian economy are dependent on whether efficiency enhancers start to work or their volatility burdens the economy further. Not going into the decom-position of GdP growth, it is important to remark that 2014 and 2015 were the first years since the early 1990s when significant growth was measured without adding to indebtedness, therefore implying that the budget was balanced and the current account recorded a surplus – not forgetting that eu development sources, which are implicitly foreign sources, but technically do not in-crease the foreign liability ratio, played an important role in this GdP growth. However the sustainability of this growth is highly de-pendent on Hungary’s external markets and the success of Hungary’s external economic policy strategy which aims to increase export share on faster developing export markets, and the quality of the most important effi-ciency enhancers of Hungarian economic de-velopment: vocational and adult education, tertiary education, the innovation system, coordination mechanisms of the economy and the bureaucratic, administrative burdens on market players.
1 For more detailed information about the mentioned analysis, see: Ministry for National economy (2016).
2 Own calculations of the Hungarian Central Statistical Office (Központi Statisztikai Hivatal,
Notes

StudieS
374 Public Finance Quarterly 2016/3
HCSO); changes in real wages and salaries 1992–2015; consumer price index, 1960–2010 statistics.
3 See balance of payments statistics of the Central Bank of Hungary (Magyar Nemzeti Bank, CBH; Hungarian abbreviation: MNB)
4 in this study, we do not deal with non-productive private assets. However, we note that it also increased unequally. in the period examined, the income differences between the lowest and the highest income decile increased from the level of 4–4.5 times to the level of 7–7.5 times, and along with these changes in income the asset differences multiplied.
5 More detailed data analysis and empirical investigations are available in the working paper Cserháti i(2009); tóth (2005); Kornai (2005).
6 For more detailed analysis see Bod, P. A. (2000); er-dős, t. (1987).
7 in this study the value of privatised state-owned companies and incomes from privatisation have been determined in accordance with the assets managed by the state-owned asset management companies based on the work of Horváth and his co-authors (2008). (Horváth, dóczi és Lehmann Law Office (2008). We get just the same results by using the asset estimates of Mihályi (2010).
8 Our calculation is a simple present value calculation of 1990 book value compared to the price paid for the SOes during the privatization process. The calculation is available upon request. Mihályi gives 10 interrelated explanations for the asset devaluation (see more in Mihályi, 2010), from which we ment-ion only one: the most generally valid explanation for the devaluation is that during the selling process that lasted for several years the asset manage-ment companies were not able to compensate the continuous devaluation of the Forint by the increase in Forint prices (in the same place, pp. 202–205).
9 Source: eurostat General government expenditure by function (COFOG).
10 This conclusion is confirmed by Halpern (2014); Oblath and Palócz (2012), who give more detailed analysis and comparision between Hungary and the other Cee countries about this issue.
11 For more detailed analysis see Pogátsa Z. (2013).
12 in this study the value of privatised state-owned companies and earnings from privatisation have been determined in accordance with the assets managed by the state-owned asset management companies based on the work of Horváth et al. (2008). We get just the same results by using the asset estimates of Mihályi (2010).
13 Net government debt per capita: 1970–2007: Lóránt (2009), 2008–2010: CBH Quarterly and annual data on balance of payments, HCSO: Population and information on mobility.
14 More detailed data analysis and complex empirical investigations are available in working paper by Kornai (2005); Oblath and Pula (2000); Csaba (2007); eeAG (2012), and the references therein.
15 About liberalisation in practice see more details in Michaely–Papageorgiou–Choksi (1991); Oblath (1987); Köves–Lányi–Oblath (1993).
16 We are aware of the fact that the different monetary policy strategy caused higher inflation and worse turbulences in domestic consumption and real wages in the Czech Republic and Poland, but in the long run export and domestic production oriented trade and monetary policy paid off for Hungary’s peers.
17 For detailed description of the four most important radical laws affecting the financial sector see Csaba (1998)

StudieS
Public Finance Quarterly 2016/3 375
Literature
18 See Kármán (1998); Benedek (2006); World Bank (2006) for more information about the composition of Hungarian public expenditure in international comparison.
19 For more detailed analysis about the international comparison of the structures of the Hungarian public expenditures, see: Kármán (1998); Benedek (2006); World Bank (2006).
20 Own calculations based on data from eurostat Annual net earnings. Calculations are available upon request.
21 HCSO National Accounts, 1960–2010 and CBH Quarterly and annual data on Balance of Payments statistics
22 For more detailed analysis, see Komáromi (2008).
23 There is reliable information available about Hun-gary since our accession to the iMF in 1982, while about the Czech Republic only since 1993. it is related to the interpretation of the figure that foreign exchange reserves are explicitly illustrated, they reduce external debts. Therefore it is possible that in 1993 the total amount of the net external debt of the government, companies and the private sector reached a little more than 10% of the GdP in the Czech Republic, but because of reserves of nearly 20%, the Czech Republic was in a demand position.
24 Lack of savings contributed to the extremely high demand for external financing during the economic transition. For further analysis, see Csillag, i. (2009); Palócz, É. (2008).
25 The analysis about the differences between the debt-fare and work-fare model were published first in the Financial times by György Barcza: http://blogs.ft.com/beyond-brics/2013/02/18/guest-post-in-defense-of-hungarys-economic-policy/
26 For more expensive description about the term of supercapitalism, see: Reich, R. B. (2008).
27 OeCd taxing Wages.
28 HCSO statistics on changes in real wages and salaries, 1992–2015.
29 On challenges of the Hungarian education system in 2010 see György (2014) and OeCd education at a Glance statistics.
30 eurostat National Accounts statistics (2010-).
31 Own calculations based on HCSO data on household spendings distribution.
32 eurostat Labour Market statistics. Population ages 15–64.
33 World Bank doing Business Statistics
Adam, J. (1995): The transition to a Market economy in Hungary. Europe-Asia Studies, 47, 6, September, pp. 989–1006.
Aghion, P. – Blanchard, O. J. (1994): On the Speed of transition in Central europe. NBER Macroeconomics Annual, 1994, Volume 9.
Ang, J. S. – ding, d. K. (2006): Government ownership and the performance of government-linked companies: The case of Singapore. Journal of Multinational Financial Management. 16, 1, February, pp. 64–88.
Antal, L. (2004): The Hungarian economic policy in the 90s, in Veress J. (ed.): Fejezetek a gazdaságpoliti-

StudieS
376 Public Finance Quarterly 2016/3
kából (Chapters from the economic policy, Budapest, Aula).
Ábel, i. – Szakadát, L. (1995): Csõd a piacgazda-sági átmenetben (The failure of transition to market economy).economic Review, vol. XLii., issue 10., pp. 942–954.
Bekker, Zs. (1995): Rendszerválság (System crisis). Aula, Budapest.
Belyó P. (1998): The hidden economy in Hungary. in: Hungarian statistical review, No. 13, pp. 125–133.
Benedek, d. – Lelkes, O. – Scharle, Á. – Szabó, M. (2006): The structure of Hungarian public revenue and expenditure, 1991–2004. Economic Review, vol. Liii, issue 2, pp. 119–143.
Benet, i. (1997): Az új magyar agrárpolitika előz-ményei és jellemzői, ii. rész (The antecedents and characteristics of the new Hungarian agricultural poli-cy, part ii.). Statisztikai szemle (Statistical Review)
Bhagwati, J. (1978): Foreign trade Regimes and economic development: Anatomy and Consequences of exchange Control Regimes. NBeR, New York view), 75, pp. 311–325. Bod, P. A. (2000): About the external indebtedness of Hungary. Part from the author’s soon-to-be-released book, Hungarian Journal, 13, pp. 78–85.
Bonin, J. – Schaffer, M. (1995): Banks, Firms, Bad Debts and Bankruptcy in Hungary 1991–1994. Centre for economic Performance.
Chikán, A. (2015): Gazdasági fordulat nélkül folytatódhat Magyarország lecsúszása – interjú (The Hungarian falling behind can continue without economic turnaround – An interview). Online: http://www.portfolio.hu/unios_forrasok/gazdasagfejlesztes/gazdasagi_fordulat_nelkul_folytatodhat_magyarorszag _lecsuszasa_interju.1.210835.
Csaba, L. (1998): A decade of transformation in
Hungarian economic Policy: dynamics, Constraints and Prospects. Europe-Asia Studies, 50, 8, december, pp. 1381–1391.
Csaba, L. (2000): Between transition and eu Accession: Hungary at the Millennium. Europe-Asia Studies, 52, 5, July, pp. 805–827.
Csaba, L. (2007): Átmenet vagy spontán rend(etlenség)? (transition or spontaneous order/disorder?). Economic Review, vol. LiV., September, 2007, pp. 757–773.
Csajbók, A. – Hudecz, A. – tamási, B. (2010): Foreign Currency Borrowing of Households in New eu member states. MNB Occasional Papers 87, Natio-nal Bank of Hungary, Budapest.
Cseres-Gergely, Zs. (2007): inactivity in Hunga-ry – the persistent effect of the pension system. Buda-pest Working Papers on the Labour Market, 2007/1, ins-titute of economics, Hungarian Academy of Sciences, Budapest.
Cserháti, i. – Péter, i. – Varga, Zs. (2009): trends in Household income Stratification in 2008–2009. Development and Finance, No. 3, pp. 70–78.
Csillag, i. (2009): Ahonnét nincs visszatérés? (From where there is no return?) in: Veress, J. (ed.): Gazdaságpolitika a globalizált világban (economic policy in the globalised world). typotex Publishing House, Budapest.
Czeti, t. – Hoffmann, M. (2006): A magyar ál-lamadósság dinamikája: elemzés és szimulációk (The dynamics of Hungarian public debt: analysis and simulations). MNB Tanulmányok 50., Pénzügyi elem-zések, Magyar Nemzeti Bank (National Bank of Hun-gary Working Paper 50, Financial Analysis).
earle, J. S. – Wörgötter, A. (1994): Monopoly power, import Competition, and Price Liberalization in the CSFR., in: János Gács and Georg Winckler: Inter-

StudieS
Public Finance Quarterly 2016/3 377
national Trade and Restructuring in Eastern Europe. inter-national institute for Applied Systems Analysis, Luxem-burg, Austria, Physica-Verlag, 1994, pp., 321–341.
erdős, t. (1987): The development of the Hungarian economy and economic policy in the period of 1968–1986. Conclusions for the long-run planning. Manuscript, pp. 53–54.
Feng, F. – Sun, Q. – tong, W. H. S. (2004): do government-linked companies underperform? Jour-nal of Banking & Finance 28, October 10, 2004, pp. 2461–2492.
Gács, J. (1993): trade Liberalization in the CSFR, Hungary, and Poland: Rush and Reconsideration. in: International Trade and Restructuring in Eastern Europe, 1994, pp 123–153.
Györffy, d. (2006): Governance in a Low-trust environment: The difficulties of Fiscal Adjustment in Hungary, Europe-Asia Studies, 58, March 2, pp. 239–259.
György, L. (2014): Main challenges of Hungarian public education with special focus on inequality: An international comparison., Acta Oeconomica, Volume 64, issue 1, pp. 1–26.
Halpern L. – Muraközy L. (2007): does distance Matter in Spillover?, economics of transition 15(4), pp. 781–805.
Halpern, L. – Oblath, G. (2014): “The bright” and gloomy side of economic stagnation, Economic Review, vol. LXi, issue 7, pp. 757–800.
Hegedűs, Á. (2004): Nemzetközi gazdasági és pénz-ügyi intézmények a magyarországi privatizációról (in-ternational economic and financial institutions about the Hungarian privatisation). in: Báger, G. (ed.): Pri-vatizáció Magyarországon (Privatisation in Hungary), vol ii. (State Audit Office of Hungary, development and Methodological institute, Budapest).
Honvári, J. (2005): Magyarország iMF csatlako-zásának előtörténete (The preludes of Hungary’s iMF accession). Valóság (Reality), 48, pp. 82–102.
Horváth, Cs. – Krekó, J. – Naszódi A. (2006): is There a Bank Lending Channel in Hungary? evidence form Bank Panel data. National Bank of Hungary Working Paper, No. 7, May.
Horváth, dóczi and Lehmann Law Office (2008): Jelentés az ÁPV Zrt. és jogelődei – mint a privatizáció lebonyolítására létrehozott célszervezetek – tevékeny-ségéről és a teljes privatizációs folyamatról a Vagyon-törvény 71. paragrafus (2) bekezdése alapján (Report on the activities of ÁPV Zrt. and its predecessors – as the as institutions established to conduct privatisation – well as the entire process of privatisation pursuant to Section 71 (2) of the Property Act). Manuscript, Bu-dapest.
Hunya, G. (1995): Foreign direct investment in Central and Eastern European countries? Why is Hun-gary attractive? The Vienna institute for Comparative economic Studies.
Jensen, C. (2006): Foreign direct investment and economic transition: Panacea or Pain Killer? Europe-Asia Studies, 58, 6, September, pp. 881–902.
Kaderják, P. (1996): On the factors determining direct foreign investment in Hungary a quantitative analysis. Economic Review, vol. XLiii, issue 12, pp. 1072–1087.
Kármán, A. (2008): Structure of Hungarian State Budget Compared with international Standards. Cre-dit Institution Review, 2008, 7/6.
Kemény, i. – Janky, B. (2006): Roma Population of Hungary 1971–2003.in: Kemény i. (ed.): Roma of Hungary East European Monoraphs (New York, CO – Atlantic Research and Publications).
Kolodko, G. W. (2000): ten Years of Post socialist

StudieS
378 Public Finance Quarterly 2016/3
transition: Lessons for Policy Reform. Journal for Institutional Innovation, Development and Transition, vol. 4.
Komáromi, A. (2008): The structure of external financing: is there a reason to worry about financing through debt? National Bank of Hungary Review, issue No. 4.
Kornai, J. (2006): The great transformation of Central eastern europe Success and disappointment. Economics of Transition, 14, pp. 207– 244.
Kornai, J. (2012): Centralisation and the capitalist market economy. Economics of Transition, 20. pp. 569–591.
Kornai, J. (2015): Hungary’s u-turn. Society and Economy, 37, 3, pp. 279–329.
Kovács, Á. (2009): A magyar államháztartás a rend-szerváltozástól 2008-ig (The Hungarian public finance from transition to 2008). in: Magyarország politikai évhuszadkönyve: A magyar demokrácia kormányzati rendszere, 1988–2008. Budapest.
Köllő, J. (2001): The patterns of non-employment in Hungary’s least developed regions. Budapest Working Papers on the Labour Market, 2001/1.
Köves, A. – Lányi, K. – Oblath, G. (1993): Az exportorientált gazdaságpolitika feltételei és eszközei 1993-ban (The conditions and tools of the export-oriented economic policy in 1993). Külgazdaság (Foreign economy), 26, pp. 29–49.
Krueger, A. O. (1978): Foreign trade Regimes and economic development: Liberalisation Attempts and Consequences., New York, Ballinger.
László, t. (2004): A privatizáció folyamata, az alkalmazott módszerek és technikák (The process of privatisation, the applied methods and techniques). in: Báger, G. (ed.): Privatizáció Magyarországon, ii. kötet
(Privatisation in Hungary, vol. ii. State Audit Office of Hungary, development and Methodological institute, Budapest).
Lóránt, K. (2009): A magyar gazdasági válság háttere, a kiút lehetőségei (The background of the Hungarian economic crisis and the ways out). in: Veress J. (ed.): Gazdaságpolitika a globalizált világban (economic policy in the globalised world). typotex Publishing House, Budapest.
Mellár, t. (2015): A magyar “csoda” (The Hungarian miracle). Népszabadság, Opinion, January 3, 2015. Online: http://nol.hu/velemeny/a-magyar-csoda–1507555?utm_source=mandiner&utm_medium=link&utm_campaign=mandiner_201605
Michaely, M. – Papageorgiou, d. – Choksi, A. (1991): Lessons of experience in the developing World. in: Michaely, M., Papageorgiou, d. and Choksi, A. (ed.): Liberalizing Foreign Trade (Oxford, Blackwell).
Mihályi, P. (2010): A magyar privatizáció enciklopé-diája (The encyclopedia of the Hungarian privatisation, vol. 1–2). Pannon egyetemi Könyvkiadó–MtA Köz-gazdaságtudományi intézet (Pannon university Pub-lishing – HAS Centre for economic and Regional Studies), Budapest.
Muraközy, B. (2007): Spillovers From FDI in Hun-gary. Phd dissertation, Budapest, Central european university.
Muraközy, L. (2008): Magyarország felemelkedé-se és hanyatlása (The rise and fall of Hungary – the Britain of east-Central europe). Economic Review, vol. LV., pp. 149–168.
Myant, M. – drahokoupil (2013): transition economies after the Crisis of 2008: Actors and Policies. europe-Asia Studies., Vol. 65, No. 3, Special issue: transition economies after the Crisis of 2008: Actors and Policies (May 2013), pp. 373–382.

StudieS
Public Finance Quarterly 2016/3 379
Nagy, A. (1995): A behozatal liberalizálása Magyar-országon (The liberalisation of imports in Hungary). Közgazdasági szemle, 42, pp. 454–470.
Oblath, G. (1987): importliberalizálás és vámcsök-kentés? (import liberalisation and tariff reduction?) Fi-gyelő (Observer), december, pp. 21.
Oblath, G. (1992): Külső adósságfelhalmozás és az adósságkezelés makroökonómiai problémái Magyar-országon – i. és ii. rész (Foreign debt accumulation and macroeconomic problems of debt management in Hungary – vol. i and ii). Közgazdasági Szemle, 1992. issues 7–8. and 9.
Oblath, G. (1994): economic transition, exchange rate policy – real exchange rate changes in Central eastern europe. in: Gács János-Winckler, G. (ed.): In-ternational Trade and Restructuring in Eastern Europe. international institute for Applied Systems Analysis, Luxemburg, Austria, Physica-Verlag, Heidelberg.
Oblath, G. (1998): Makrogazdasági folyamatok, külső és belső egyensúlyhiányok Magyarországon az 1990-es évtizedben (Macroeconomic processes, external and internal imbalances in Hungary during the 1990s). in: Kurtan–Sándor–Vas (1998): Magyar-ország Évtized Könyve – A rendszerváltás, 1988–1998 (The book of the decade in Hungary 1988–1998). demokrácia Kutatások Magyar Központja Alapítvány, Budapest.
Oblath, G. (2013): Hány év múlva vezethetők ki a válságadók és vezethető be az euró? (After how many year can be the crisis tax withdrawn, and the euro introduced?). Online: http://blog.mtakti.hu/blog_cikk/?cikk[cikk][keyvalue]=345
Oblath, G. – Palócz, É. (2012): Sérülékeny gazdaság: sérülékeny állam, sérülékeny háztartások (Vulnerable economy, vulnerable state, vulnerable households). in: Kolosi, t. – tóth, i. Gy. (ed.): Tár-sadalmi riport (Social Report). tárki, Budapest, pp. 93–114.
Oblath, G. – Pula G. (2000): Makrogazdasági folyamatok és szerkezeti átalakulás a kilencvenes évek-ben Magyarországon (Macroeconomic processes and structural change in Hungary during the 1990s). in: Kolosi, t.– tóth, i. Gy.–Vukovich, Gy. (ed.): Társadal-mi riport (Social Report), pp.46–78, tárki, Budapest.
Orbán, G. – Szapáry, Gy. (2006): Hungarian fiscal policy: quo vadis?, Economic Review, vol. Liii. pp. 293–309.
Palócz, É. (2008): The origins of the Hungarian money market crisis. Analyst, 4, pp. 13–15.
Papp, J. (2012): tax incidence and corruption, Jour-nal of Auditors, 1, pp. 13–16.
Penczner, R. (2010): A mezőgazdaság szerke-zeti változásai (The structural change of Hungarian agriculture). in: Két válság között – A Magyar Gaz-daság Wargabetűje – 1990–2010 (Between two crisis – detours of Hungarian economy between 1990 and 2010). ecostat, Budapest.
Pitti, Z. (2010): Economic performances versus social expectations (Budapest, daylight).
Pogátsa, Z. (2013): Rosszabbul élünk, mint 20 éve? (Are we worse off than we were 20 years ago?) Élet és Irodalom (Life and Literature), 57, February.
Reich, R. B. (2008): Supercapitalism: The Transformation of Business, Democracy, and Everyday Life (New York, Vintage).
Sőreg, Á. P. (2012): The reasons for external imbalance crises and the solution attempts of these in an international comparison/With a special attention to the circumstances of Hungary’s external indebtedness. Thesis.
Szabó, L. (2010): The development of domestic economic structure, in: ecostat: Between two crisis (detours of Hungarian economy between 1990 and 2010), ecostat, Budapest.

StudieS
380 Public Finance Quarterly 2016/3
Szabó, G. (2015): A magyar államadósság keletke-zése (Origins of Hungarian state debt). Online: http://www.penzriport.hu/letoltes/Magyar_allamadossag_ke-letkezese_1973_1989.pdf (downloaded: 20.05.2016)
Szél, K. – tóth, G. Cs. – dani, Á. (2010): The development of the country’s internal and external balance, in: ecostat: Between two crisis (detours of Hungarian economy between 1990 and 2010), ecostat, Budapest.
tardos, M. (1998): Sikeres-e a privatizáció? Ma-gyarországi tapasztalatok (1990–1997) (is privatisation successful? Hungarian experiences (1990–1997). Köz-gazdasági Szemle (economic Review), 45, April, pp. 317–332.
tóth, i. Gy. (2005): Jövedelemeloszlás. A gazda-sági rendszerváltástól az uniós csatlakozásig (income distribution. From the systemic change to the joining of the eu). Andorka Rudolf társadalomtudományi társaság–Századvég Kiadó, Budapest.
Voszka, É. (2003): Fakó minden teória, a privatizáció és a verseny kapcsolatáról (All theories are faded. About the relation of privatisation and competition). Külgazda-ság (Foreign economy), 47, November, pp. 4–23.
Voszka, É. (2013): Államosítás, privatizáció, államo-sítás (Nationalisation, privatisation, nationalisation). Közgazdasági szemle (economic Review), 60, decem-ber, pp. 1289–1317.
european economic Advisory Group (2012): The Hungarian Crisis. in: The EEAG Report on the Europe-an Economy, CeSifo, Munich, pp. 115–130.
european Commission – Mi (2014): Macroecnomic Imbalances Hungary 2014. directorate-General for economic and Financial Affaires unit Communication, Brussels.
european Commission (2015): Country Report Hungary 2015. european Commission, Brussels.
european Commission (2016): Country Report Hungary 2016. european Commission, Brussels.
international Monetary Found (2014): IMF Count-ry Report. No. 14/155, Washington d.C.
international Monetary Found (2016): IMF Count-ry Report, No. 16/107.
Ministry for National economy (2016): Internatio-nal recognition of remarkable improvement in Hungary’s economic vulnerability. February 2016. Online: http://www.kormany.hu/download/d/08/a0000/Outlo-ok%202016%207%20%20h%C3%A9t%20(inter-national%20recognition%20of%20remarkable%20improvement%20in%20Hungarys%20economic%20vulnerability.pdf
OeCd (2013): OeCd employment Outlook 2013: Protecting jobs, enhancing flexibility: A new look at employment protection legislation. Online: http://www.oecd-ilibrary.org/employment/oecd-employment-outlook–2013/protecting-jobs-enhancing-flexibility-a-new-look-at-employment-protection-legislation_empl_outlook–2013–6-en, accessed March 4, 2015.
Price Waterhouse Coopers (2010): Paying Taxes 2010: The global picture. Online: https://www.pwc.com/gx/en/paying-taxes/assets/paying-taxes–2010.pdf
Price Waterhouse Coopers (2015): Paying taxes 2015: The global picture, online: https://www.pwc.com/gx/en/paying-taxes/pdf/pwc-paying-taxes–2015-low-resolution.pdf
World Bank (2006): Current Issues in Fiscal Reform in Central Europe and the Baltic States 2005.
Main statistical sources
Central Bank of Hungary:• Annual reports, 1988–1997.• exchange rates, 1960–2014.• Quarterly reports, 1983–1989.

StudieS
Public Finance Quarterly 2016/3 381
• Quarterly and annual data on balance of payments, foreign direct investment, international investment position. Available at: http://www.mnb.hu/statisztika/statisztikai-adatok-informaciok/adatok-idosorok/viii-fizetesi-merleg-kozvetlen-tokebefektetesek-kulfolddel-szembeni-allomanyok
Czech National Bank: Quarterly statistics on the balance of payments. Available at http://www.cnb.cz/en/statistics/bop_stat/
eurostat: • Activity rates by sex, age and citizenship (%) (last
updated: April 26, 2016). Available at eurostat/employment and unemployment (Labour Force Survey).
• Annual national accounts (eSA 2010). Available at eurostat/economy and finance/National Accounts (eSA 2010).
• Annual net earnings. Available at eurostat/earnings/Net earnings and tax rates.
• employment rates by sex, age and citizenship (%) (last updated: April 26, 2016). Available at eurostat/employment and unemployment (Labour Force Survey)
• General government expenditure by function (COFOG). Available at eurostat/Annual government statistics/ Government revenue, expenditure and main aggregates
• General government gross debt (% of GdP). Available at eurostat/Government deficit and debt/
government deficit/surplus, debt and associated data.
Hungarian Central Statistical Office:• Central Government expenditures, 2005–2015.
Available at HCSO/Financial statistics/Central Go-vernment expenditures/time series of annual data
• Changes in real wages and salaries 1992–2015. Available at HCSO/Labour market/Minimum wages, real wages
• Consumer price index, 1960–2010. Available at HSCO/ Price statistics/Consumer prices/Long time series
• National Accounts, 1960–2010/2010–2014. Availab-le at HCSO/National Accounts, GdP/long time series.
• Population and information on mobility, 1998–2010. Available at HSCO/Population and vitality/Long time series
• Statistical yearbooks of Hungary, 1956–1995.• The development of Hungarian labour market,
1998–2010. Available at HSCO/Population and vitality/Long time series.
international Monetary Fund (iMF): Balance of Payments and international investment Position Statistics, April, 2015. Available at iMF eLibrary data/ BOP, iiP dataset.
OeCd: taxing wages. Available at OeCd statistics/Public sector, taxation and Market regulation/taxation/taxing wages/Country tables.