Embed Size (px)
Citation preview

The Human Side of ProductivityPreliminary results on skills
with a special focus on Portugal
Peter GalOECD Global Forum on Productivity
Joint with Chiara Criscuolo, Timo Leidecker and Giuseppe Nicoletti
and supported by researchers from participating institutions
Portugal NPB webinar | 2 February 2021
AcknowledgementsBelgium Central Bank Emmanuel Dhyne, Gert Bijnens
Costa Rica Central BankAlonso Alfaro Urena, Catalina Sandoval Alvarado, Evelyn Munoz
DenmarkMinistry of Industry, Business and Financial Affairs
Søren Gaard, Katrine Bagge Thorball, Magnus Skafte-Larsen, Louis Konstantyner
France CASD
Germany IAB Nuremberg / HU Berlin Alfred Garloff
Hungary Ministry of FinancePeter Toth, Istvan Szabo, Andras Svraka, Katalin Horvath, Balint Van, Tibor Keresztely
Italy INAPP and University of Milan Giorgio Barba Navareti, Anna Rosso, Camilla Andretta
JapanInstitute of Economic Research,Hitotsubashi University
Ryo Kambayashi
Portugal Ministry of Economy Ricardo Alves
Sweden Growth analysis Mattsson Pontus
OECD colleaguesPatrick Lenain, Alexander Hijzen, Mariagrazia Squicciarini, Lea Samek, Glenda Quintini, Oliver Denk, Wouter Zwysen
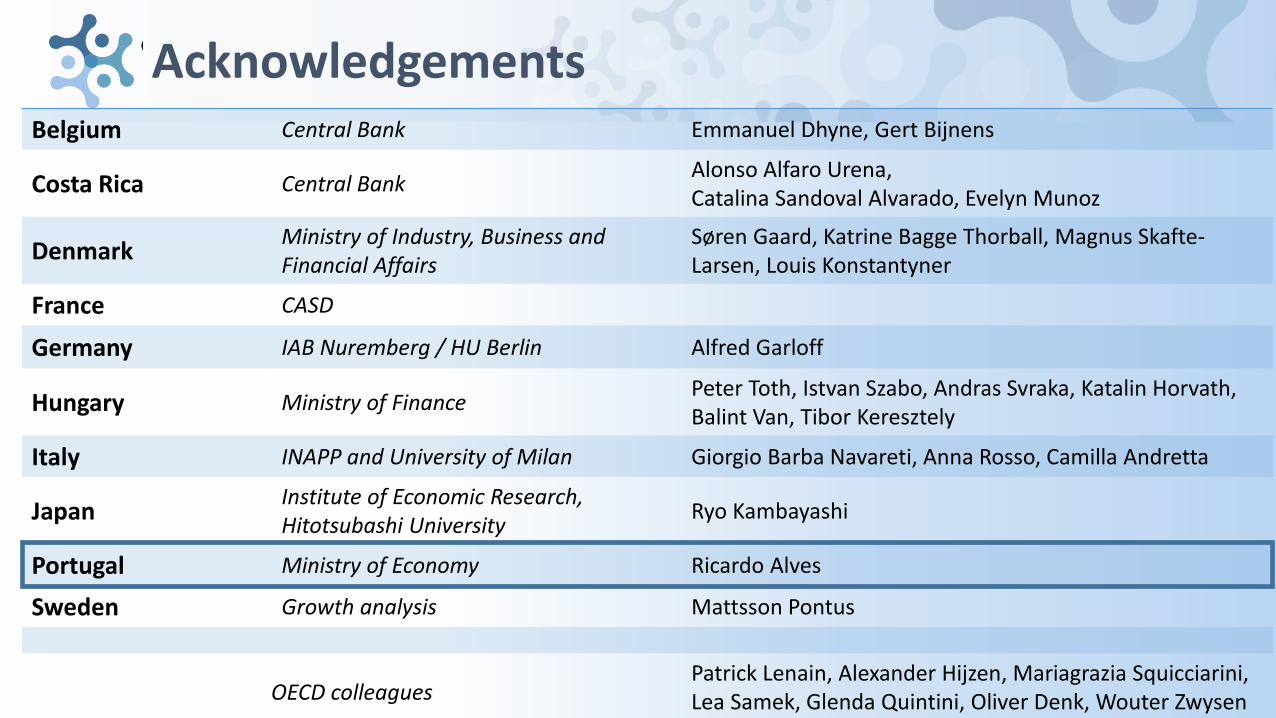
The productivity of a typical firm lags way behind the frontier…even within the same country & industry
Log-differences from the top 10% of firms with the highest productivity levels (VA/L) within detailed industries
• These differences are persistent and present in manufacturing and servicesalike
• See previous GFP and OECD work: Andrews et al (2015, 2016); Berlingieri et al (2017)
• … and academic literature focusing on the USBartelsman and Doms(2001); Syverson (2011);
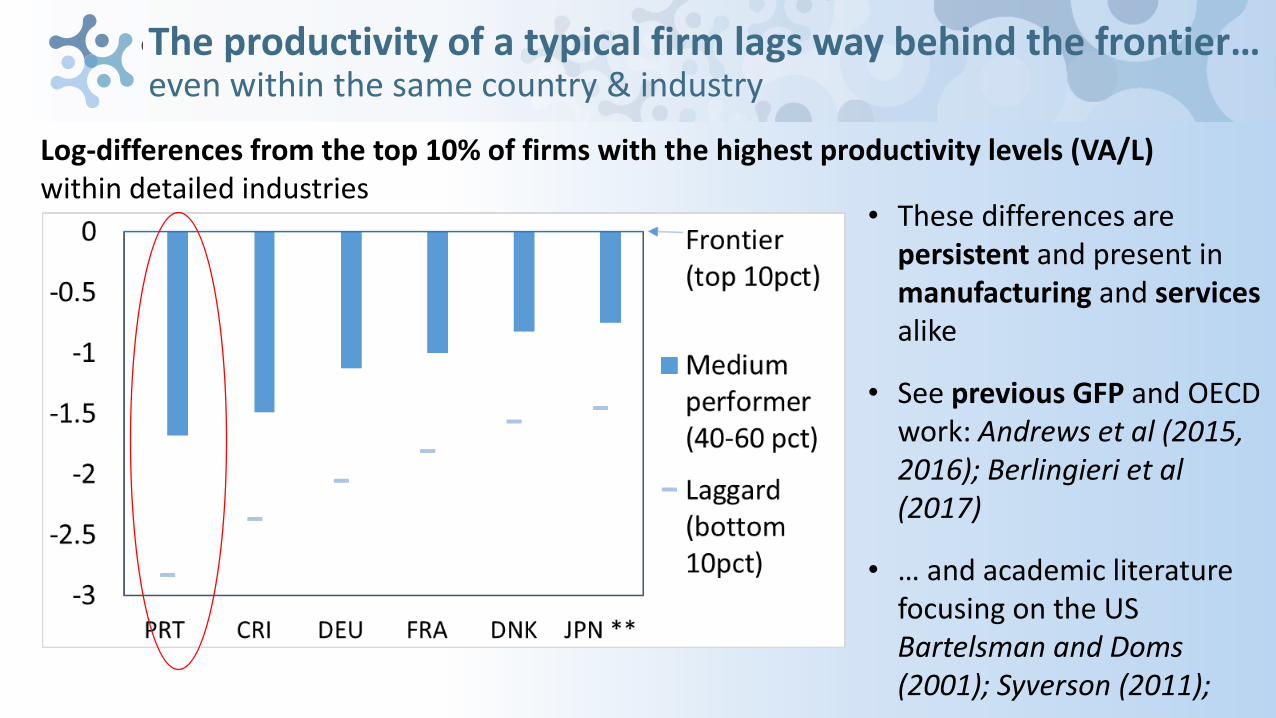
How do productive firms look like in terms of their human side?
By looking at workers and managers, we learn about 1. Skills (of managers and
workers)
2. Diversity (gender, age, cultural background)
3. Organisation(management layers, diversification of tasks, wage structure, work arrangements)
Firms
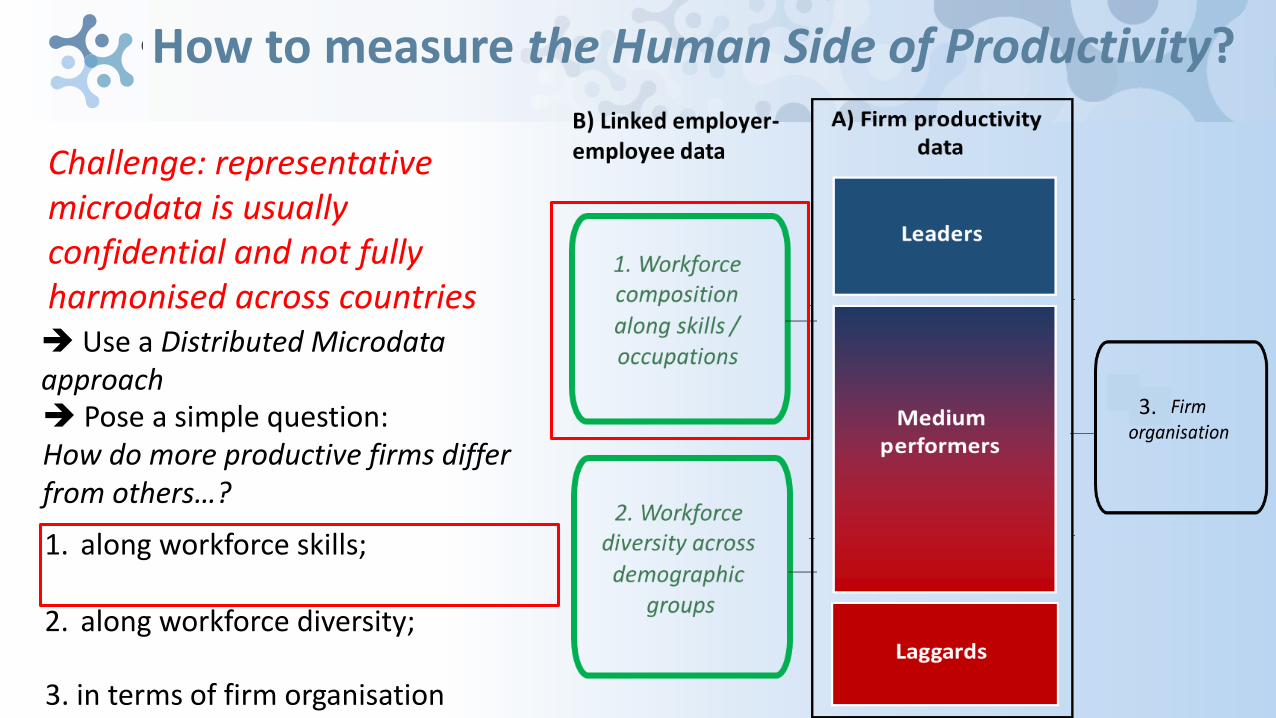
1. along workforce skills;
2. along workforce diversity;
How to measure the Human Side of Productivity?
3. in terms of firm organisation
Pose a simple question: How do more productive firms differ from others…?
Challenge: representative microdata is usually confidential and not fully harmonised across countries Use a Distributed Microdata approach
3.
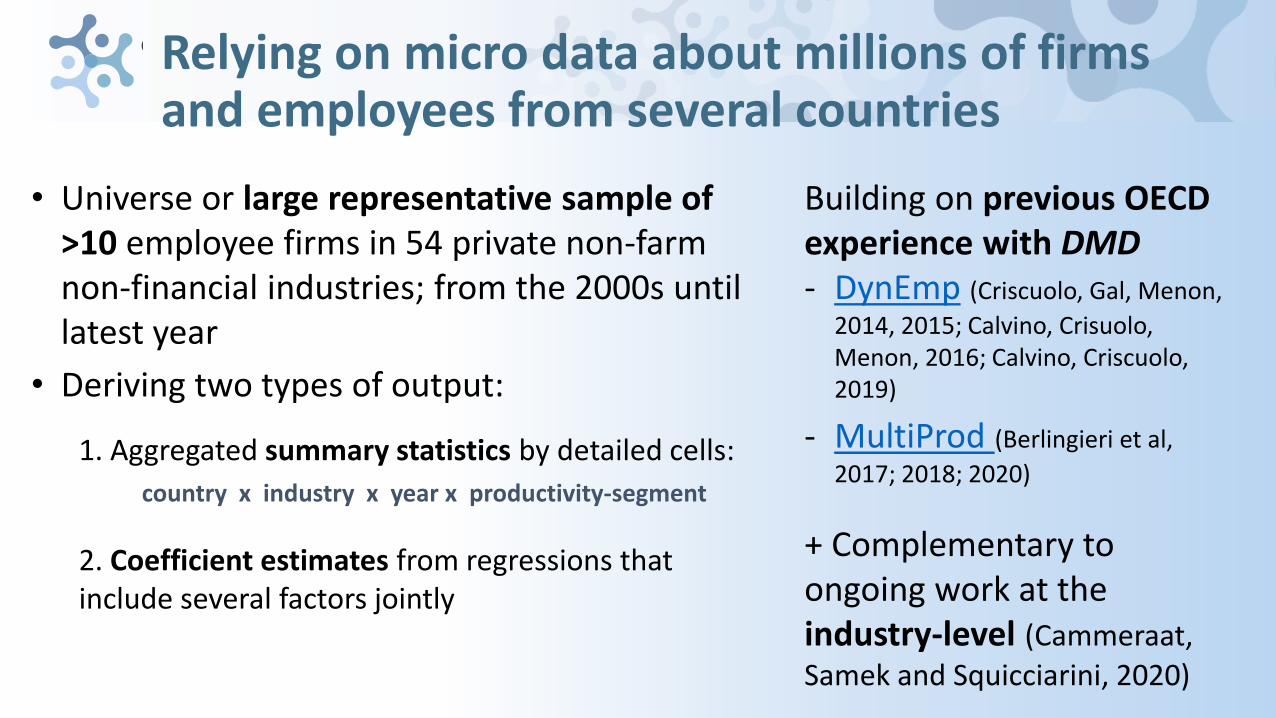
Relying on micro data about millions of firms and employees from several countries
• Universe or large representative sample of >10 employee firms in 54 private non-farm non-financial industries; from the 2000s until latest year
• Deriving two types of output:
1. Aggregated summary statistics by detailed cells:
country x industry x year x productivity-segment
2. Coefficient estimates from regressions that include several factors jointly
Building on previous OECD experience with DMD- DynEmp (Criscuolo, Gal, Menon,
2014, 2015; Calvino, Crisuolo, Menon, 2016; Calvino, Criscuolo, 2019)
- MultiProd (Berlingieri et al,
2017; 2018; 2020)
+ Complementary to ongoing work at the industry-level (Cammeraat, Samek and Squicciarini, 2020)
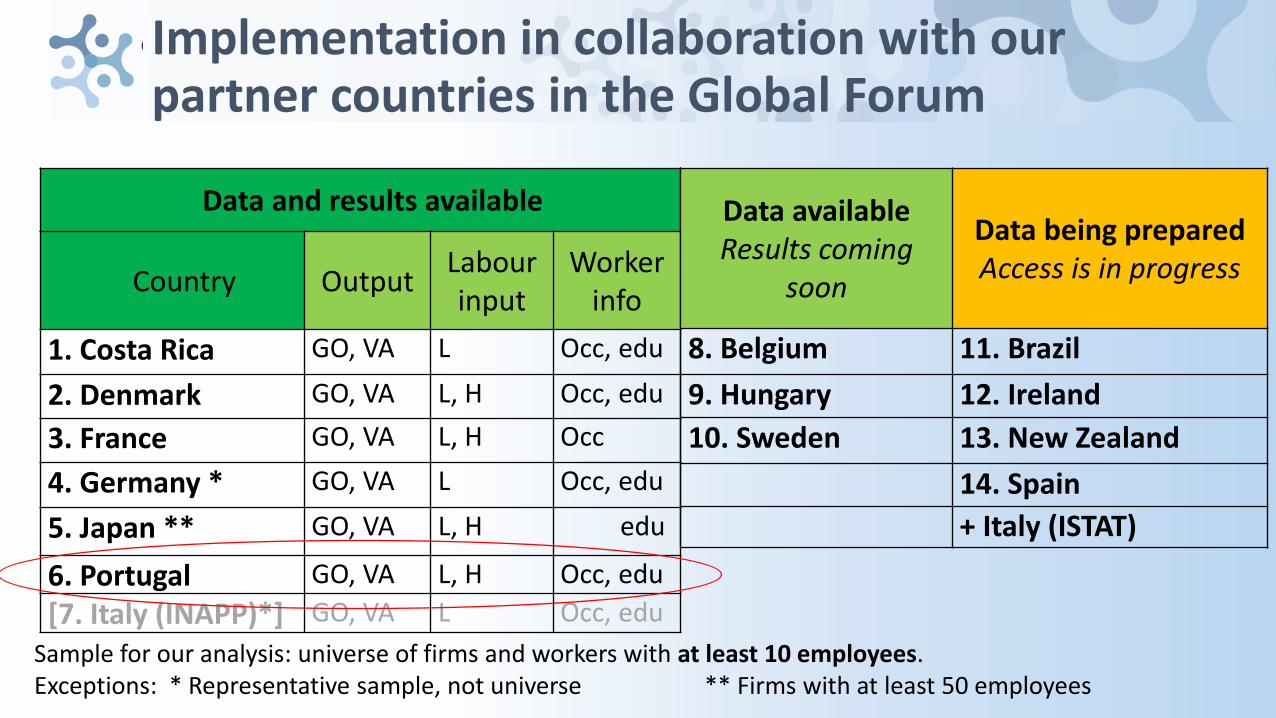
Implementation in collaboration with our partner countries in the Global Forum
Data and results available
Country OutputLabour input
Workerinfo
1. Costa Rica GO, VA L Occ, edu
2. Denmark GO, VA L, H Occ, edu
3. France GO, VA L, H Occ
4. Germany * GO, VA L Occ, edu
5. Japan ** GO, VA L, H edu
6. Portugal GO, VA L, H Occ, edu
[7. Italy (INAPP)*] GO, VA L Occ, edu
Data available Results coming
soon
Data being prepared Access is in progress
8. Belgium 11. Brazil
9. Hungary 12. Ireland
10. Sweden 13. New Zealand
14. Spain
+ Italy (ISTAT)
Sample for our analysis: universe of firms and workers with at least 10 employees. Exceptions: * Representative sample, not universe ** Firms with at least 50 employees
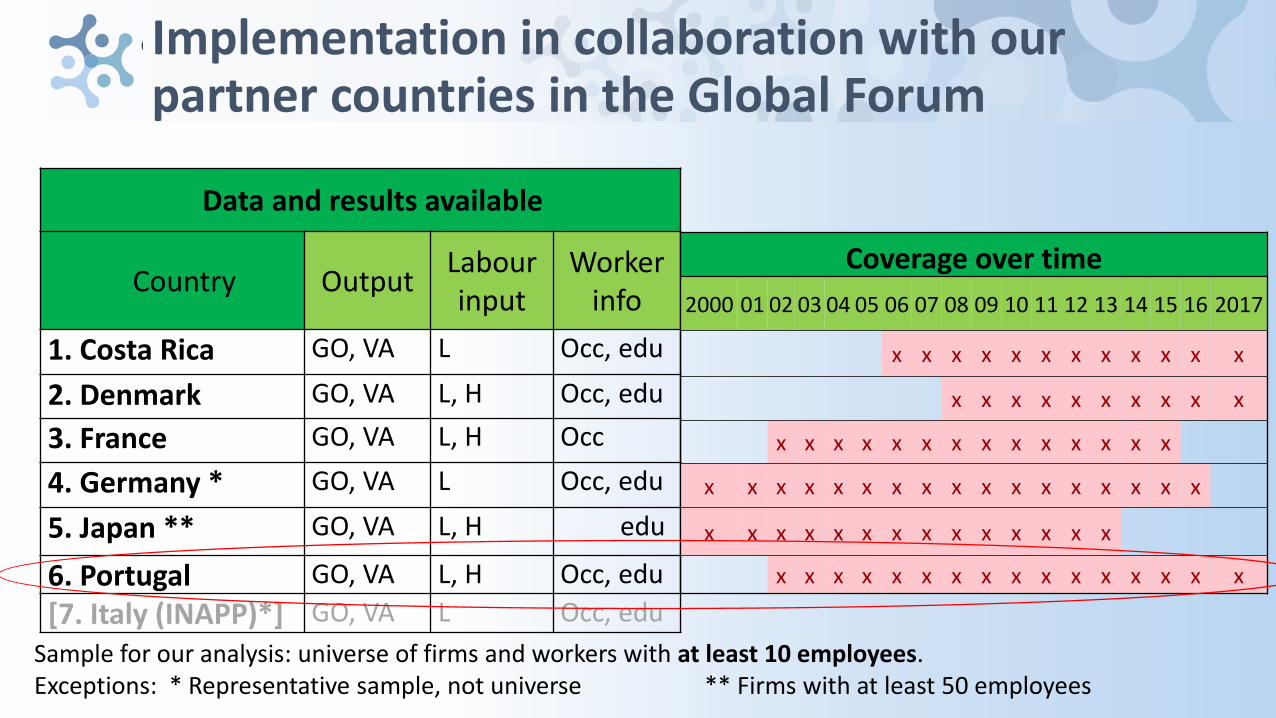
Implementation in collaboration with our partner countries in the Global Forum
Data and results available
Country OutputLabour input
Workerinfo
1. Costa Rica GO, VA L Occ, edu
2. Denmark GO, VA L, H Occ, edu
3. France GO, VA L, H Occ
4. Germany * GO, VA L Occ, edu
5. Japan ** GO, VA L, H edu
6. Portugal GO, VA L, H Occ, edu
[7. Italy (INAPP)*] GO, VA L Occ, edu
Sample for our analysis: universe of firms and workers with at least 10 employees. Exceptions: * Representative sample, not universe ** Firms with at least 50 employees
Coverage over time
2000 01 02 03 04 05 06 07 08 09 10 11 12 13 14 15 16 2017
x x x x x x x x x x x x
x x x x x x x x x x
x x x x x x x x x x x x x x
x x x x x x x x x x x x x x x x x
x x x x x x x x x x x x x x
x x x x x x x x x x x x x x x x
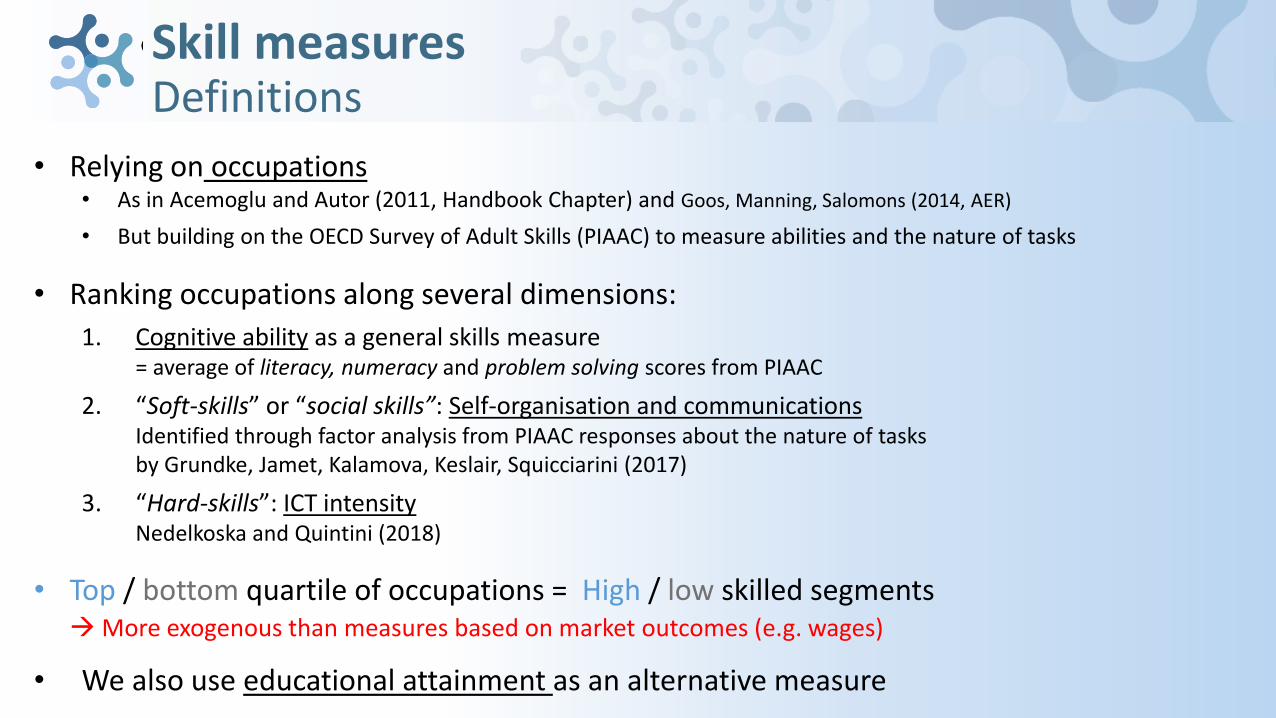
Skill measuresDefinitions
• Relying on occupations• As in Acemoglu and Autor (2011, Handbook Chapter) and Goos, Manning, Salomons (2014, AER)
• But building on the OECD Survey of Adult Skills (PIAAC) to measure abilities and the nature of tasks
• Ranking occupations along several dimensions:
1. Cognitive ability as a general skills measure= average of literacy, numeracy and problem solving scores from PIAAC
2. “Soft-skills” or “social skills”: Self-organisation and communications Identified through factor analysis from PIAAC responses about the nature of tasksby Grundke, Jamet, Kalamova, Keslair, Squicciarini (2017)
3. “Hard-skills”: ICT intensityNedelkoska and Quintini (2018)
• Top / bottom quartile of occupations = High / low skilled segmentsMore exogenous than measures based on market outcomes (e.g. wages)
• We also use educational attainment as an alternative measure

- PRELIMINARY RESULTS -
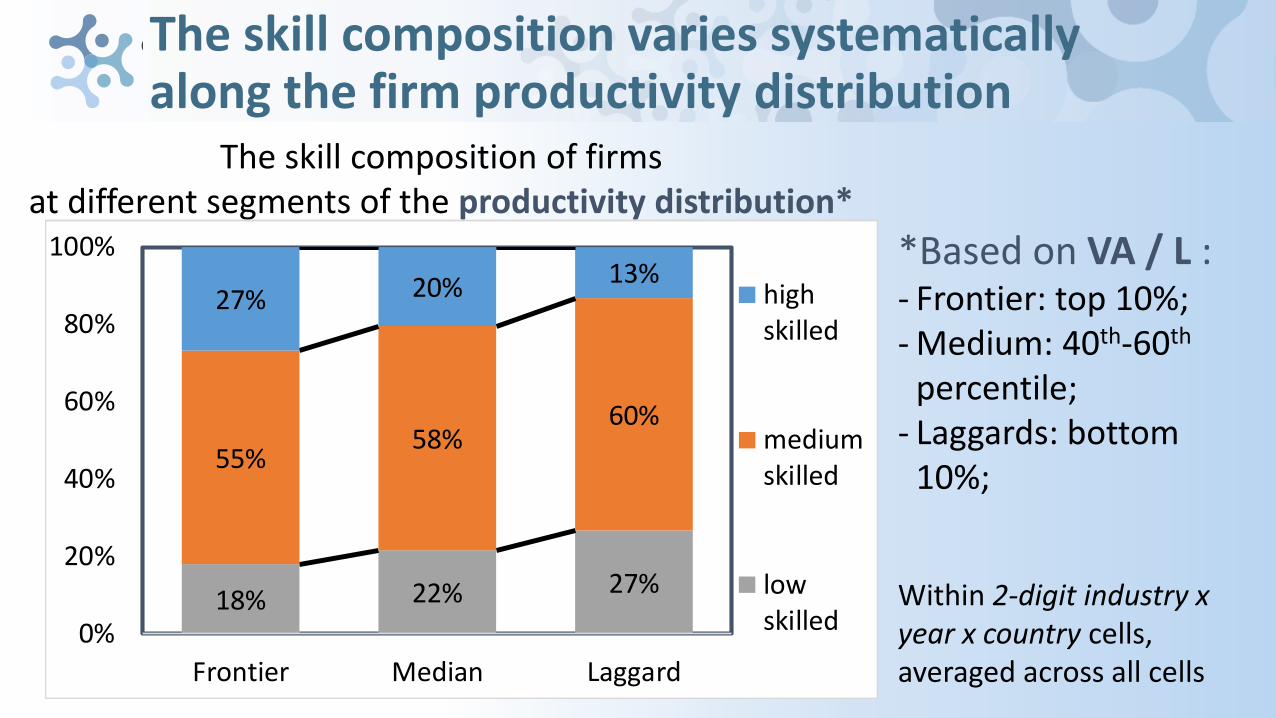
The skill composition varies systematicallyalong the firm productivity distribution
The skill composition of firms at different segments of the productivity distribution*
*Based on VA / L : - Frontier: top 10%; - Medium: 40th-60th
percentile;- Laggards: bottom
10%;
Within 2-digit industry x year x country cells, averaged across all cells
18% 22% 27%
55%58%
60%
27% 20% 13%
0%
20%
40%
60%
80%
100%
Frontier Median Laggard
highskilled
mediumskilled
lowskilled
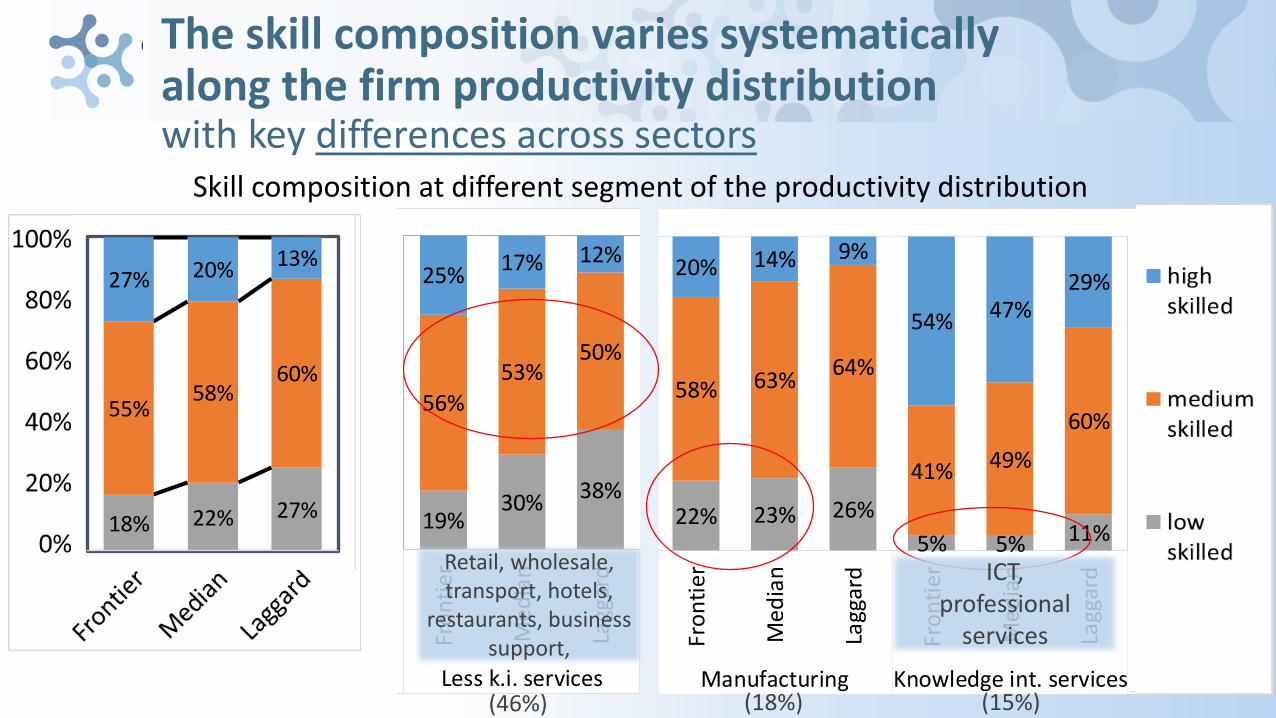
19%30% 38%
22% 23% 26%
5% 5% 11%
56%
53%50%
58% 63%64%
41% 49%
60%
25%17% 12% 20% 14% 9%
54% 47%29%
0%
20%
40%
60%
80%
100%
Fro
nti
er
Med
ian
Lagg
ard
Fro
nti
er
Med
ian
Lagg
ard
Fro
nti
er
Med
ian
Lagg
ard
Less k.i. services Manufacturing Knowledge int. services
highskilled
mediumskilled
lowskilled
19%30% 38%
22% 23% 26%
5% 5% 11%
56%
53%50%
58% 63%64%
41% 49%
60%
25%17% 12% 20% 14% 9%
54% 47%29%
0%
20%
40%
60%
80%
100%
Fro
nti
er
Me
dia
n
Lagg
ard
Fro
nti
er
Med
ian
Lagg
ard
Fro
nti
er
Me
dia
n
Lagg
ard
Less k.i. services Manufacturing Knowledge int. services
highskilled
mediumskilled
lowskilled
The skill composition varies systematicallyalong the firm productivity distributionwith key differences across sectors
(18%)(46%) (15%)
ICT, professional
services
Retail, wholesale, transport, hotels,
restaurants, business support,
Skill composition at different segment of the productivity distribution
18% 22% 27%
55%58%
60%
27% 20% 13%
0%
20%
40%
60%
80%
100%
Frontier Median Laggard
19%30% 38%
22% 23% 26%
5% 5% 11%
56%
53%50%
58% 63%64%
41% 49%
60%
25%17% 12% 20% 14% 9%
54% 47%29%
0%
20%
40%
60%
80%
100%
Fro
nti
er
Me
dia
n
Lagg
ard
Fro
nti
er
Me
dia
n
Lagg
ard
Fro
nti
er
Me
dia
n
Lagg
ard
Less k.i. services Manufacturing Knowledge int. services
highskilled
mediumskilled
lowskilled
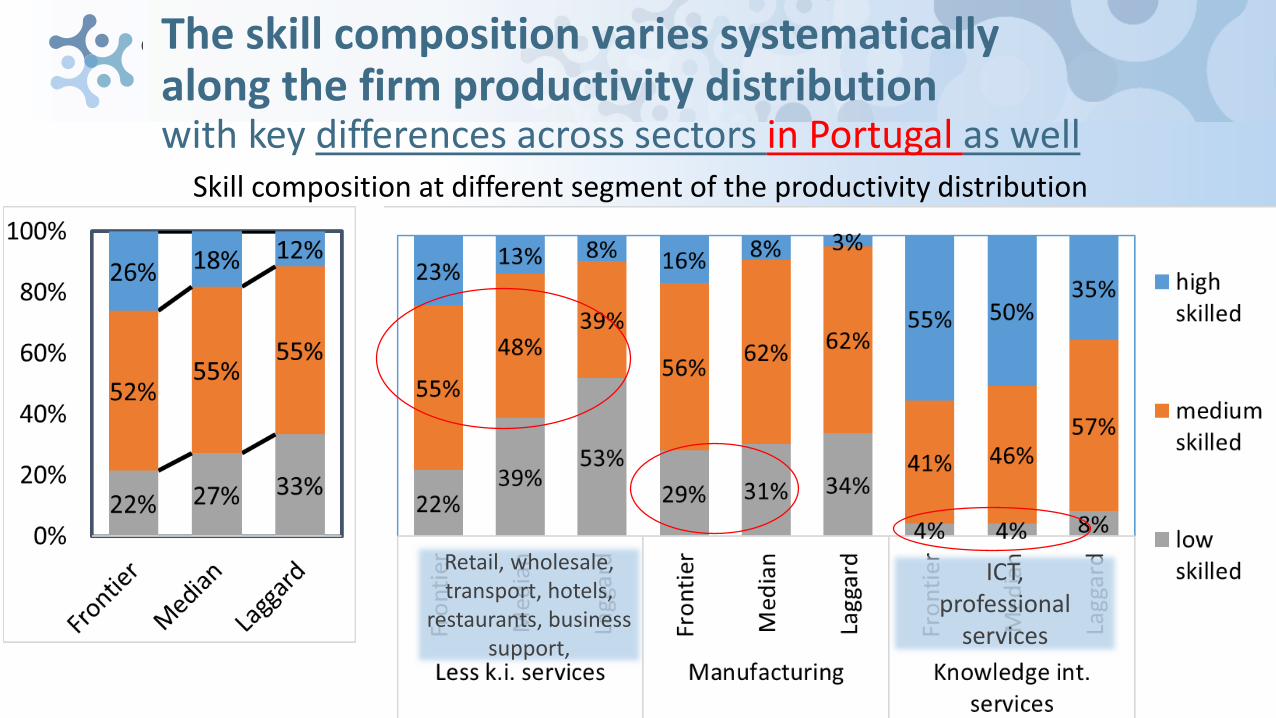
The skill composition varies systematicallyalong the firm productivity distributionwith key differences across sectors in Portugal as well
ICT, professional
services
Retail, wholesale, transport, hotels,
restaurants, business support,
Skill composition at different segment of the productivity distribution
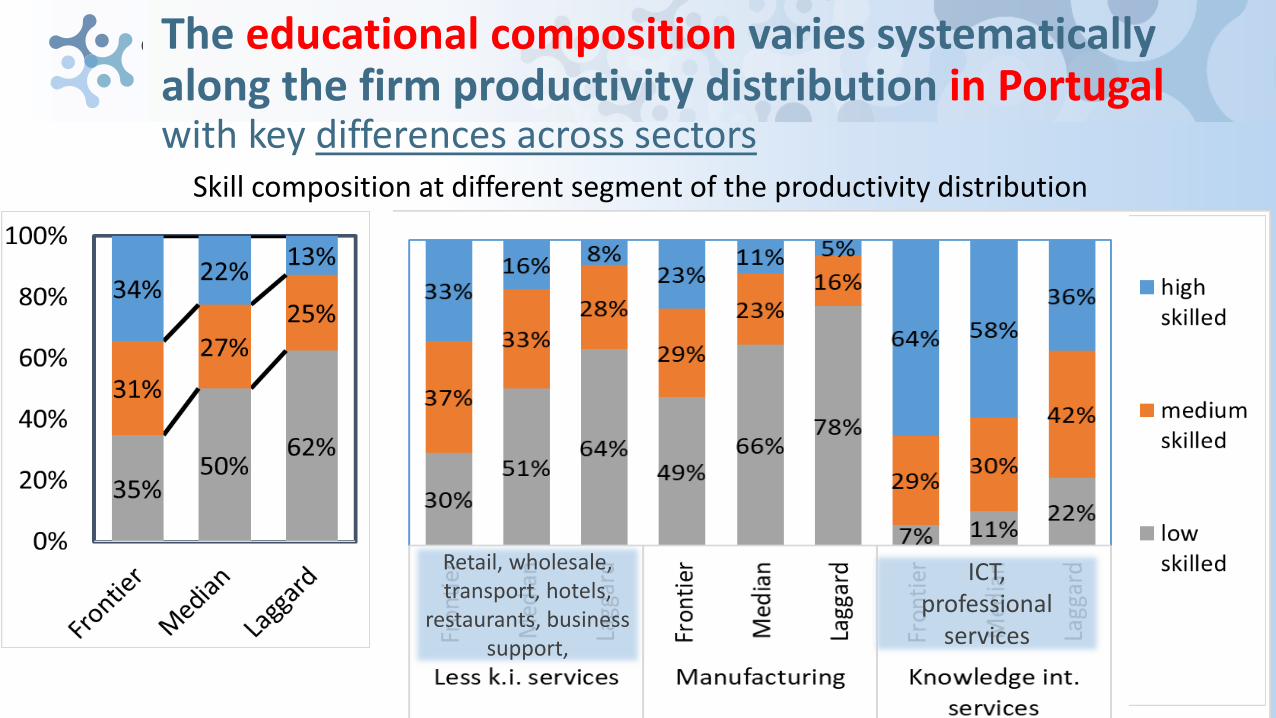
The educational composition varies systematicallyalong the firm productivity distribution in Portugalwith key differences across sectors
ICT, professional
services
Retail, wholesale, transport, hotels,
restaurants, business support,
Skill composition at different segment of the productivity distribution
-15%
-10%
-5%
0%
5%
10%
15%
hig
h
med
ium
low
hig
h
med
ium
low
hig
h
med
ium
low
Less k.i. services Manufacturing Knowledge int.services
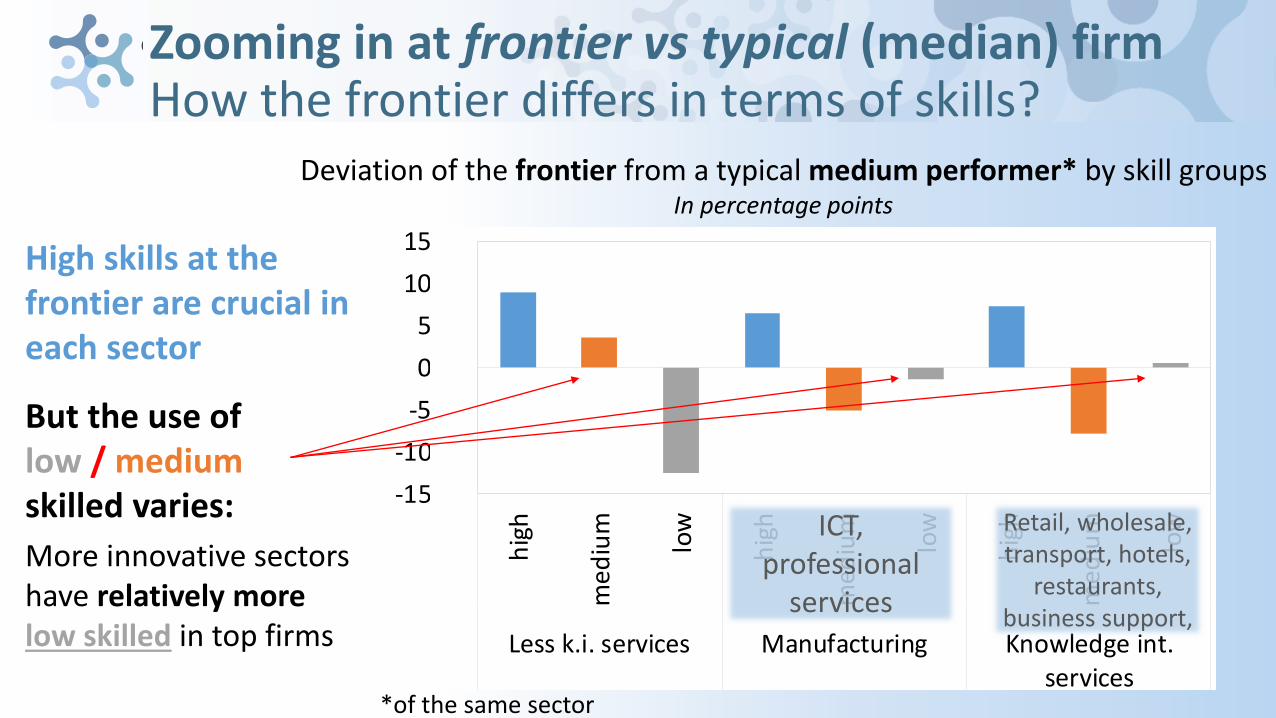
Zooming in at frontier vs typical (median) firmHow the frontier differs in terms of skills?
High skills at the frontier are crucial in each sector
Deviation of the frontier from a typical medium performer* by skill groupsIn percentage points
*of the same sector
ICT, professional
services
Retail, wholesale, transport, hotels,
restaurants, business support,
But the use of low / mediumskilled varies:
More innovative sectors have relatively more low skilled in top firms
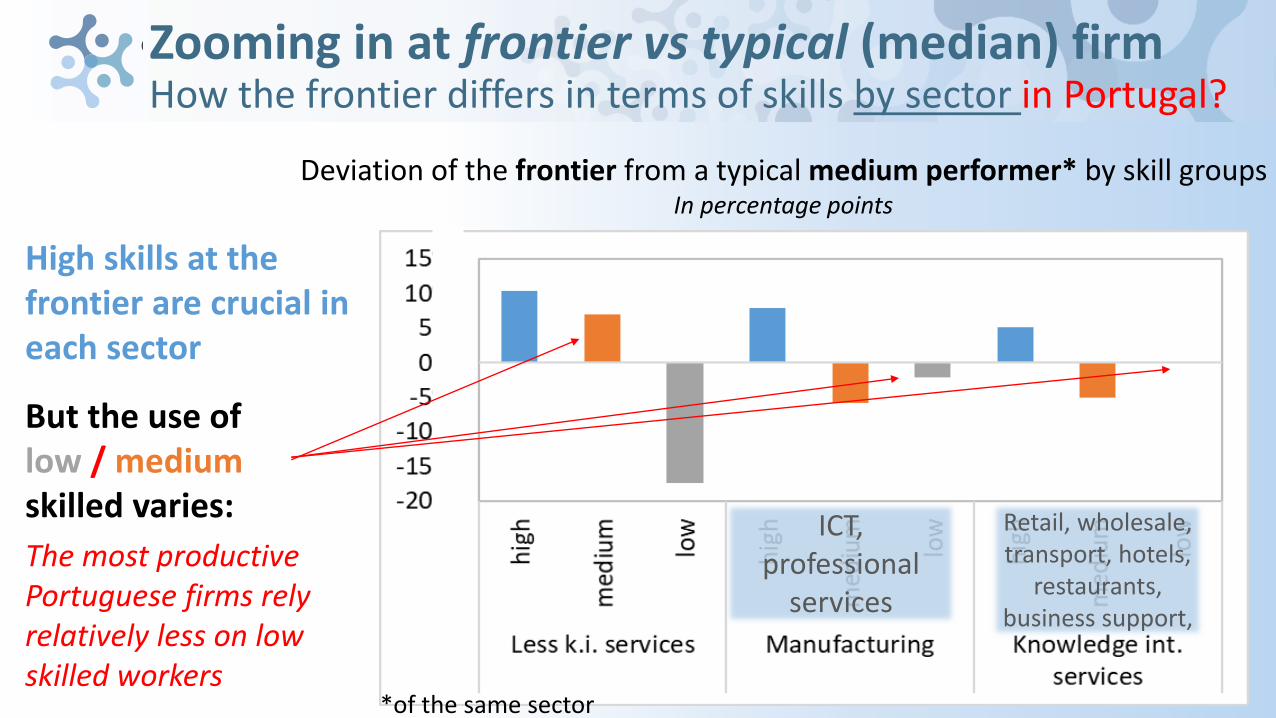
Zooming in at frontier vs typical (median) firmHow the frontier differs in terms of skills by sector in Portugal?
High skills at the frontier are crucial in each sector
Deviation of the frontier from a typical medium performer* by skill groupsIn percentage points
*of the same sector
ICT, professional
services
Retail, wholesale, transport, hotels,
restaurants, business support,
But the use of low / mediumskilled varies:
The most productive Portuguese firms rely relatively less on low skilled workers
0%
2%
4%
6%
8%
10%
12%
14%
DEU JPN DNK PRT CRI FRA
high skilled
-10%
-8%
-6%
-4%
-2%
0%
2%
DEU JPN DNK PRT CRI FRA
medium skilled low skilled
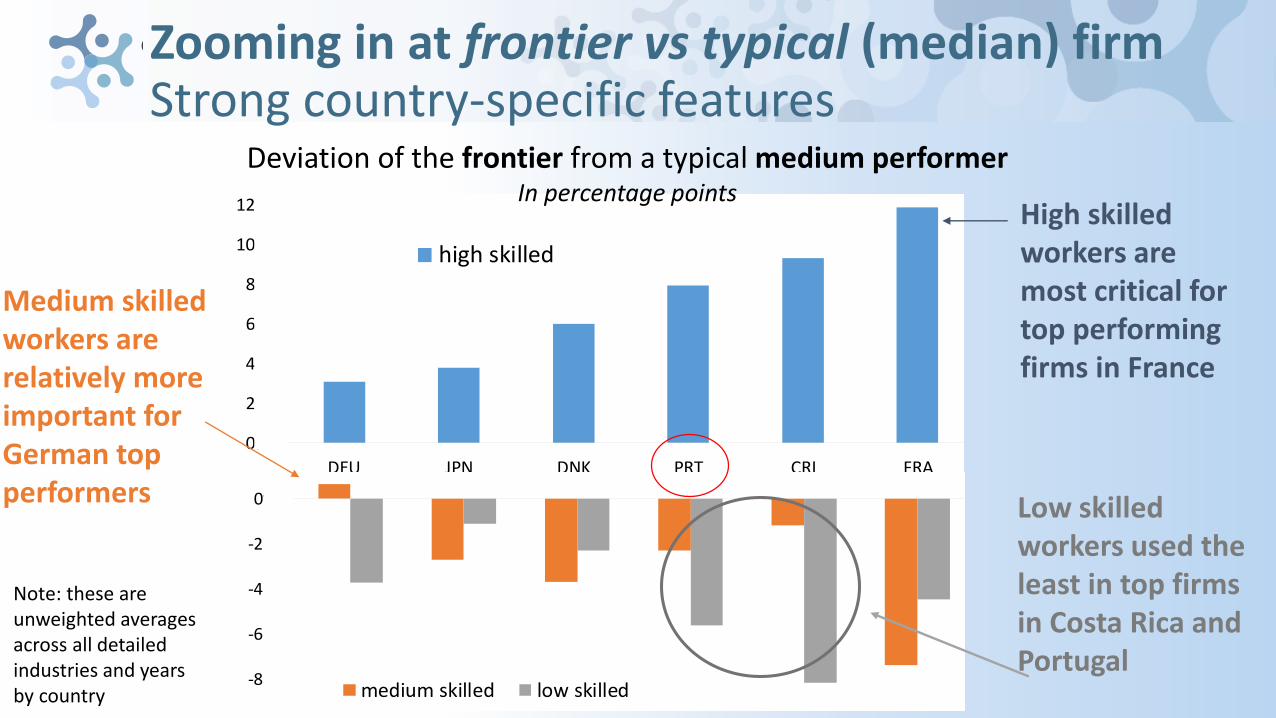
Zooming in at frontier vs typical (median) firm Strong country-specific features
Deviation of the frontier from a typical medium performerIn percentage points
Medium skilled workers are relatively more important for German top performers
High skilled workers are most critical for top performing firms in France
Low skilled workers used the least in top firms in Costa Rica and Portugal
Note: these are unweighted averages across all detailed industries and years by country
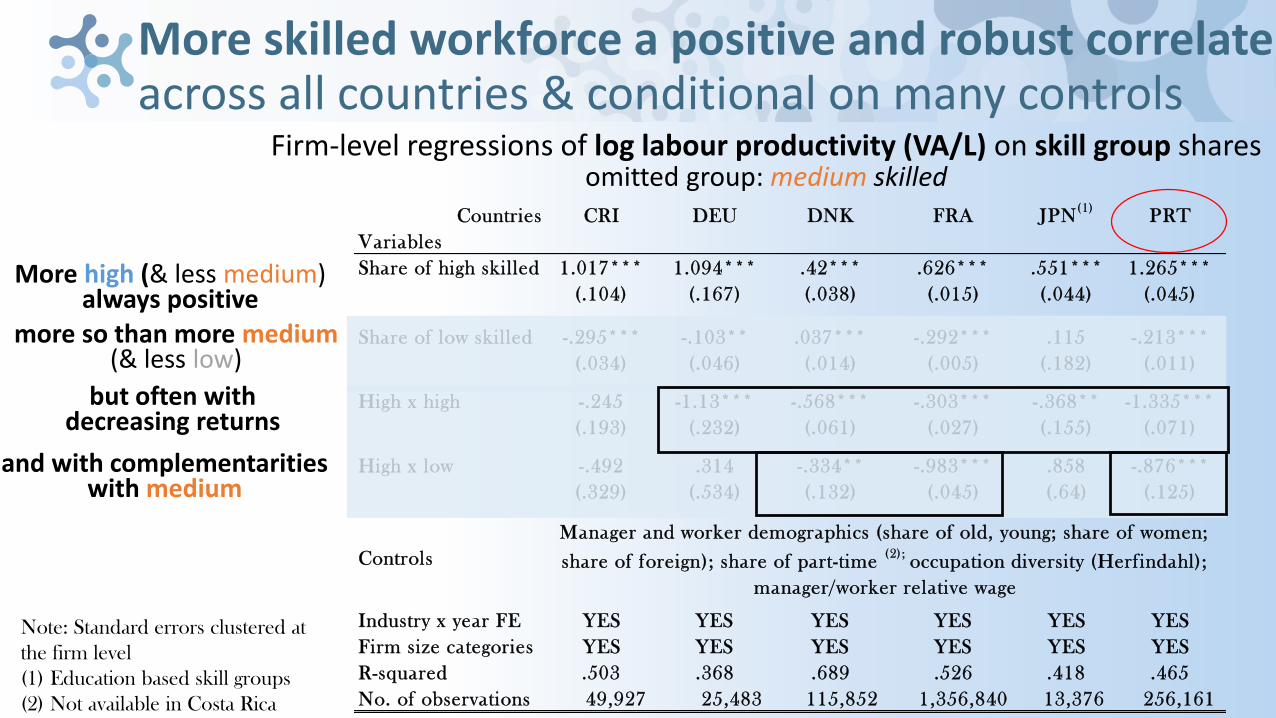
Countries CRI DEU DNK FRA JPN(1)
PRT
Variables
Share of high skilled 1.017*** 1.094*** .42*** .626*** .551*** 1.265***
(.104) (.167) (.038) (.015) (.044) (.045)
Share of low skilled -.295*** -.103** .037*** -.292*** .115 -.213***
(.034) (.046) (.014) (.005) (.182) (.011)
High x high -.245 -1.13*** -.568*** -.303*** -.368** -1.335***
(.193) (.232) (.061) (.027) (.155) (.071)
High x low -.492 .314 -.334** -.983*** .858 -.876***
(.329) (.534) (.132) (.045) (.64) (.125)
Controls
Industry x year FE YES YES YES YES YES YES
Firm size categories YES YES YES YES YES YES
R-squared .503 .368 .689 .526 .418 .465
No. of observations 49,927 25,483 115,852 1,356,840 13,376 256,161
Manager and worker demographics (share of old, young; share of women;
share of foreign); share of part-time (2) ;
occupation diversity (Herfindahl);
manager/worker relative wage
More skilled workforce a positive and robust correlateacross all countries & conditional on many controls
Firm-level regressions of log labour productivity (VA/L) on skill group sharesomitted group: medium skilled
More high (& less medium) always positive
more so than more medium(& less low)
but often with decreasing returns
and with complementarities with medium
Note: Standard errors clustered at
the firm level
(1) Education based skill groups
(2) Not available in Costa Rica
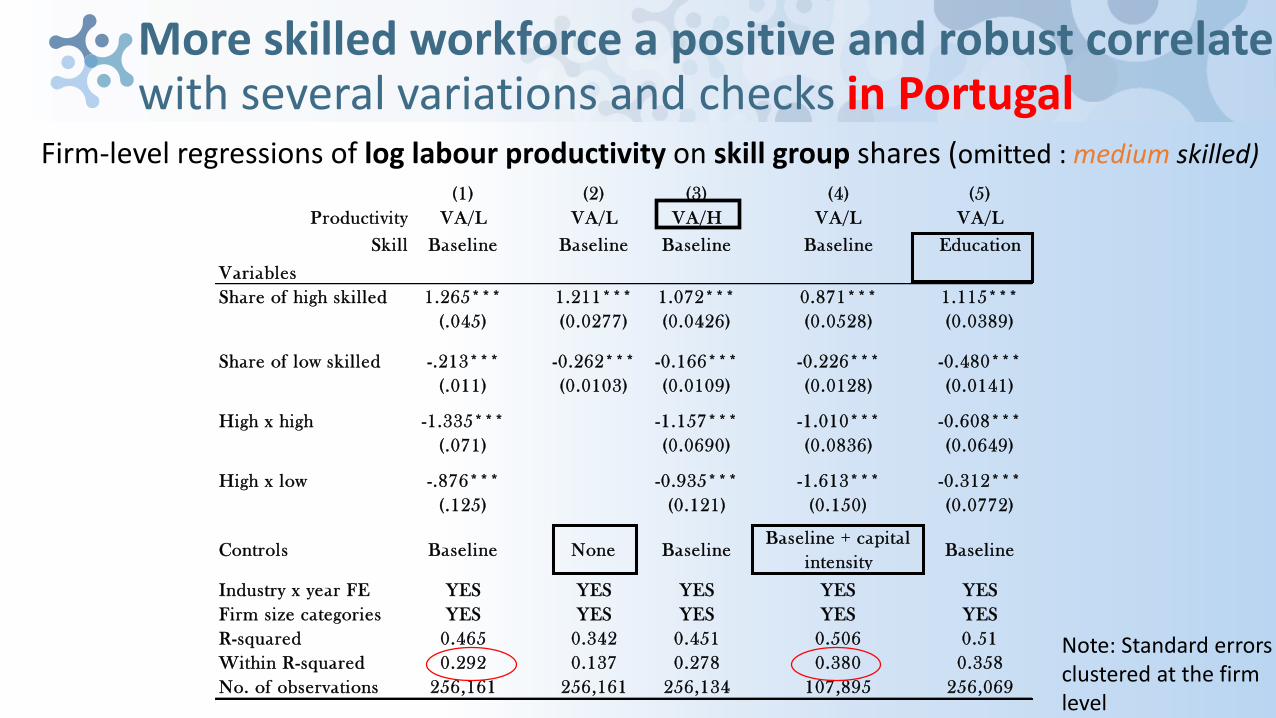
More skilled workforce a positive and robust correlatewith several variations and checks in Portugal
Firm-level regressions of log labour productivity on skill group shares (omitted : medium skilled)
Note: Standard errors clustered at the firm level
(1) (2) (3) (4) (5)
Productivity VA/L VA/L VA/H VA/L VA/L
Skill Baseline Baseline Baseline Baseline Education
Variables
Share of high skilled 1.265*** 1.211*** 1.072*** 0.871*** 1.115***
(.045) (0.0277) (0.0426) (0.0528) (0.0389)
Share of low skilled -.213*** -0.262*** -0.166*** -0.226*** -0.480***
(.011) (0.0103) (0.0109) (0.0128) (0.0141)
High x high -1.335*** -1.157*** -1.010*** -0.608***
(.071) (0.0690) (0.0836) (0.0649)
High x low -.876*** -0.935*** -1.613*** -0.312***
(.125) (0.121) (0.150) (0.0772)
Controls Baseline None BaselineBaseline + capital
intensityBaseline
Industry x year FE YES YES YES YES YES
Firm size categories YES YES YES YES YES
R-squared 0.465 0.342 0.451 0.506 0.51
Within R-squared 0.292 0.137 0.278 0.380 0.358
No. of observations 256,161 256,161 256,134 107,895 256,069
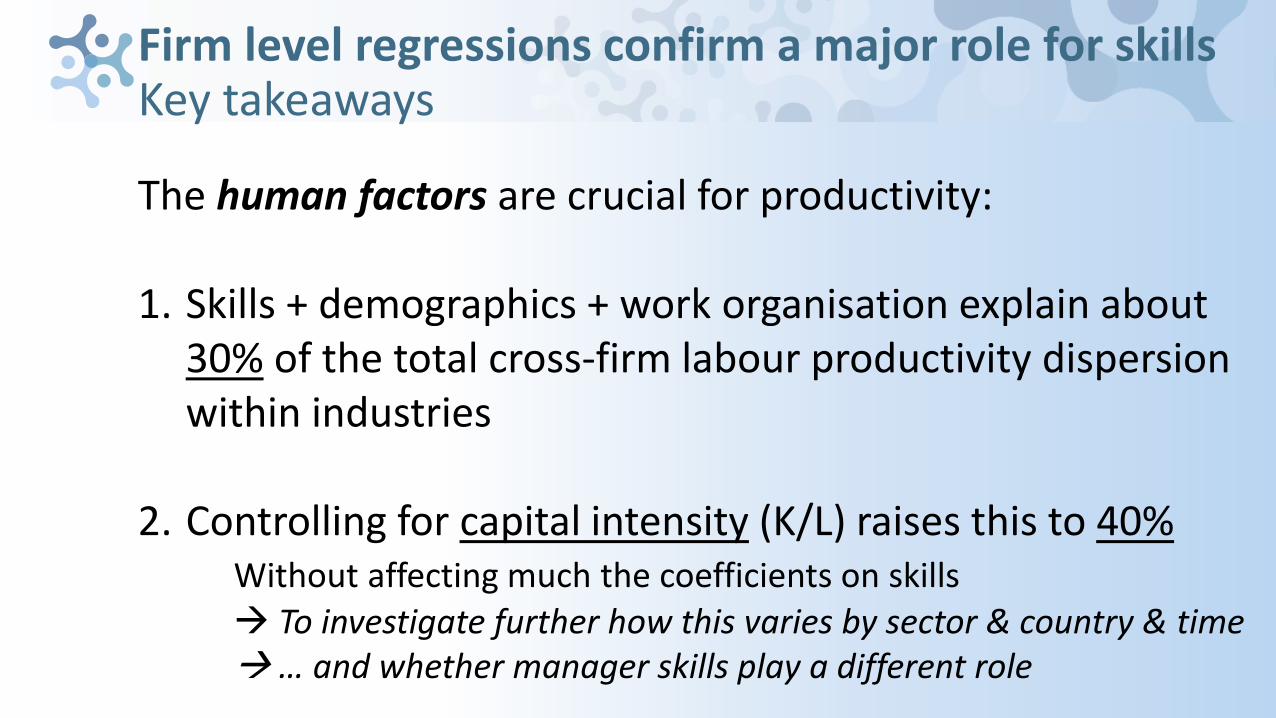
Firm level regressions confirm a major role for skillsKey takeaways
The human factors are crucial for productivity:
1. Skills + demographics + work organisation explain about 30% of the total cross-firm labour productivity dispersion within industries
2. Controlling for capital intensity (K/L) raises this to 40%Without affecting much the coefficients on skills To investigate further how this varies by sector & country & time … and whether manager skills play a different role
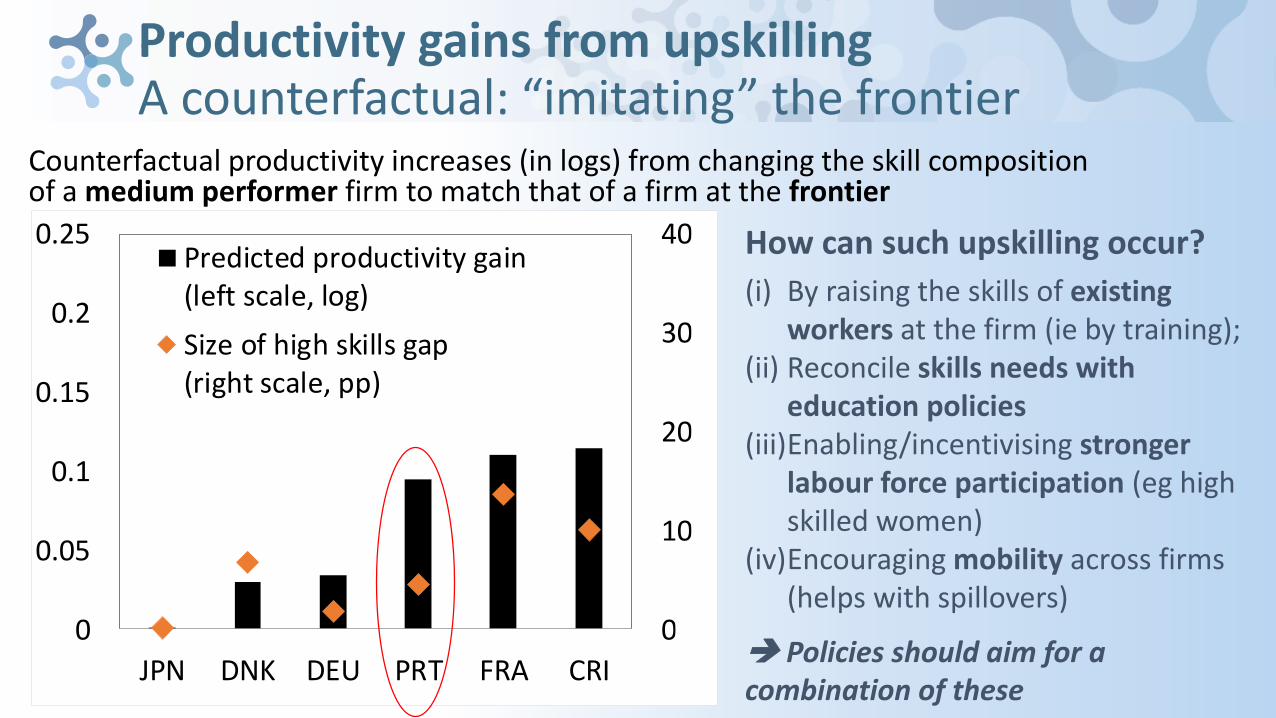
Productivity gains from upskillingA counterfactual: “imitating” the frontier
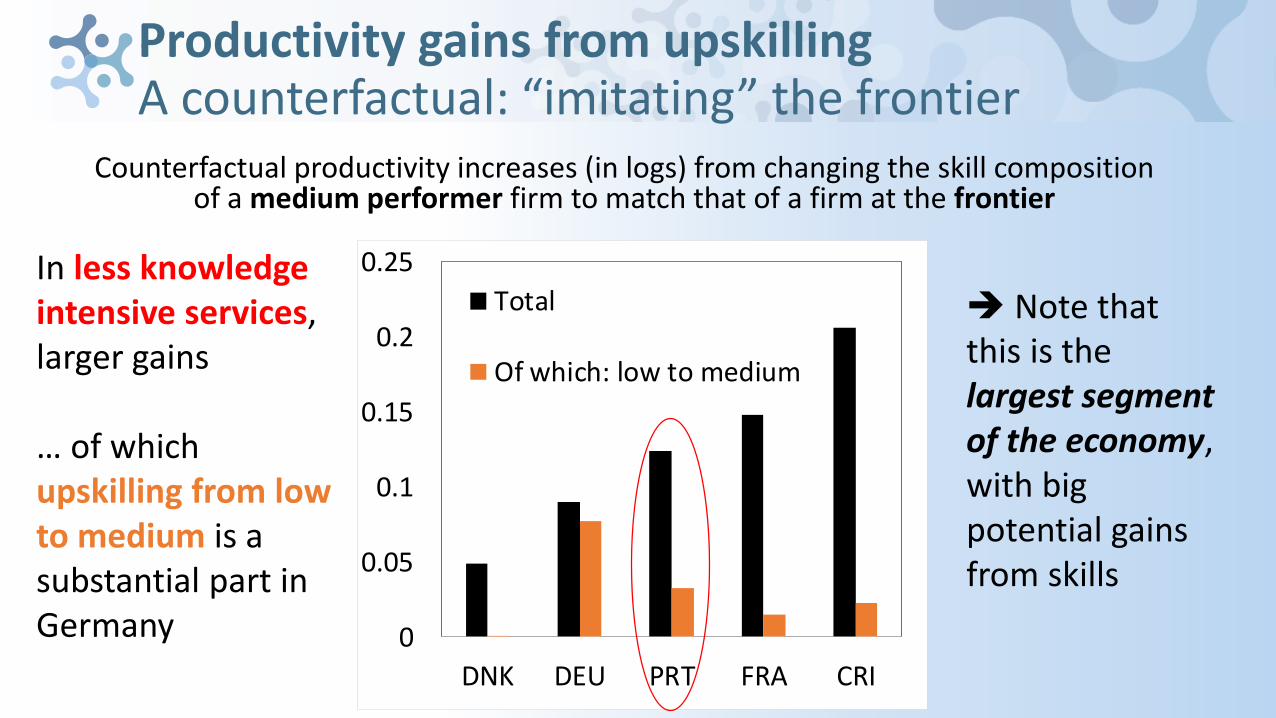
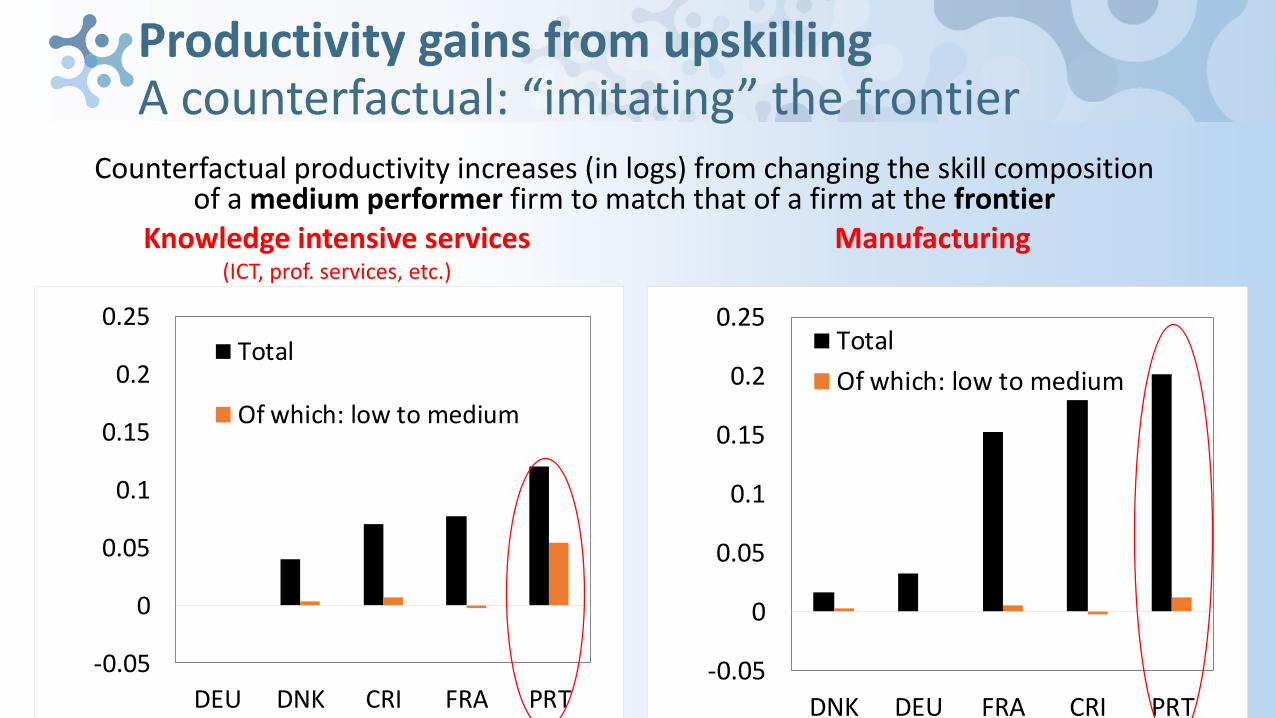
Counterfactual productivity increases (in logs) from changing the skill composition of a medium performer firm to match that of a firm at the frontier
How can such upskilling occur?
(i) By raising the skills of existing workers at the firm (ie by training);
(ii) Reconcile skills needs with education policies
(iii)Enabling/incentivising stronger labour force participation (eg high skilled women)
(iv)Encouraging mobility across firms (helps with spillovers)
Policies should aim for a combination of these
0%
10%
20%
30%
40%
0
0.05
0.1
0.15
0.2
0.25
JPN DNK DEU PRT FRA CRI
Predicted productivity gain(left scale, log)
Size of high skills gap(right scale, pp)
Counterfactual productivity increases (in logs) from changing the skill composition of a medium performer firm to match that of a firm at the frontier
Productivity gains from upskillingA counterfactual: “imitating” the frontier
0
0.05
0.1
0.15
0.2
0.25
DNK DEU PRT FRA CRI
Total
Of which: low to medium
In less knowledge intensive services, larger gains
… of which upskilling from low to medium is a substantial part in Germany
Note that this is the largest segment of the economy, with big potential gains from skills
Counterfactual productivity increases (in logs) from changing the skill composition of a medium performer firm to match that of a firm at the frontier
Knowledge intensive services(ICT, prof. services, etc.)
Productivity gains from upskilling A counterfactual: “imitating” the frontier
Manufacturing
-0.05
0
0.05
0.1
0.15
0.2
0.25
DEU DNK CRI FRA PRT
Total
Of which: low to medium
-0.05
0
0.05
0.1
0.15
0.2
0.25
DNK DEU FRA CRI PRT
Total
Of which: low to medium
Summary and next steps
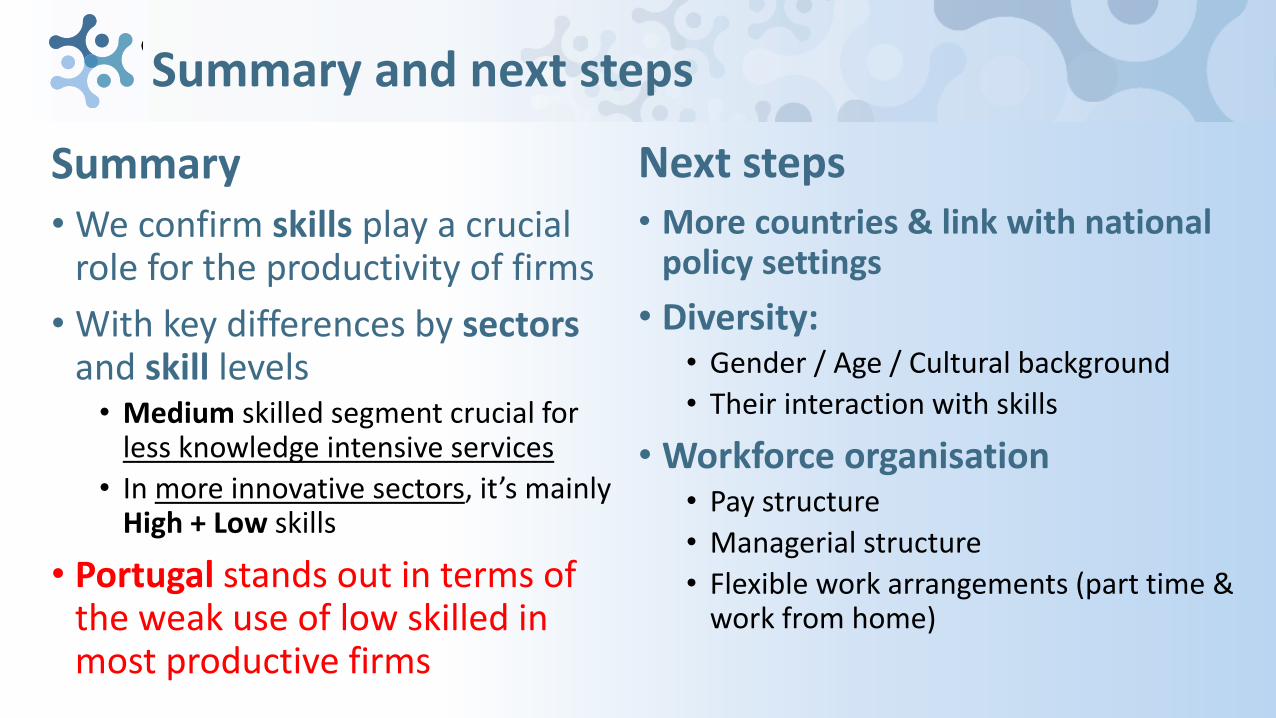
Summary• We confirm skills play a crucial
role for the productivity of firms
• With key differences by sectors and skill levels• Medium skilled segment crucial for
less knowledge intensive services
• In more innovative sectors, it’s mainly High + Low skills
• Portugal stands out in terms of the weak use of low skilled in most productive firms
Next steps• More countries & link with national
policy settings
• Diversity: • Gender / Age / Cultural background
• Their interaction with skills
• Workforce organisation• Pay structure
• Managerial structure
• Flexible work arrangements (part time & work from home)
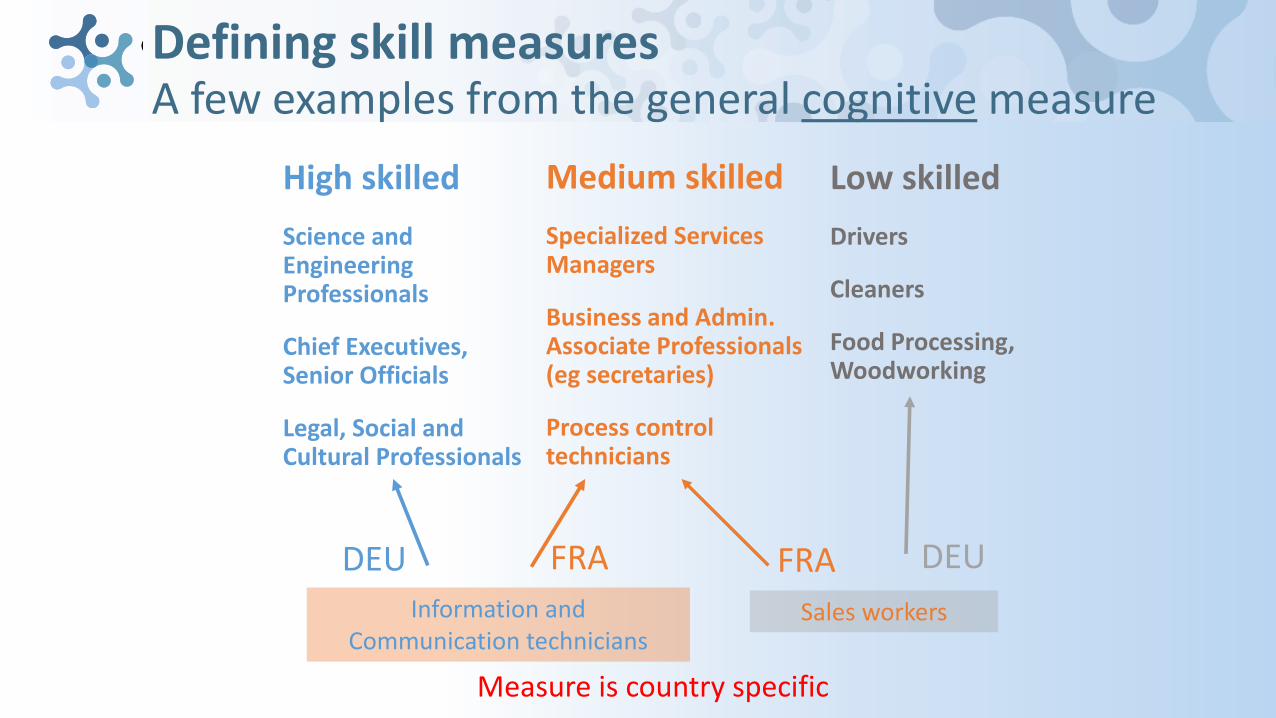
Defining skill measures
High skilled
Science and Engineering Professionals
Chief Executives, Senior Officials
Legal, Social and Cultural Professionals
Low skilled
Drivers
Cleaners
Food Processing, Woodworking
Medium skilled
Specialized Services Managers
Business and Admin. Associate Professionals (eg secretaries)
Process control technicians
A few examples from the general cognitive measure
Information and Communication technicians
FRADEU
Sales workers
FRA DEU
Measure is country specific
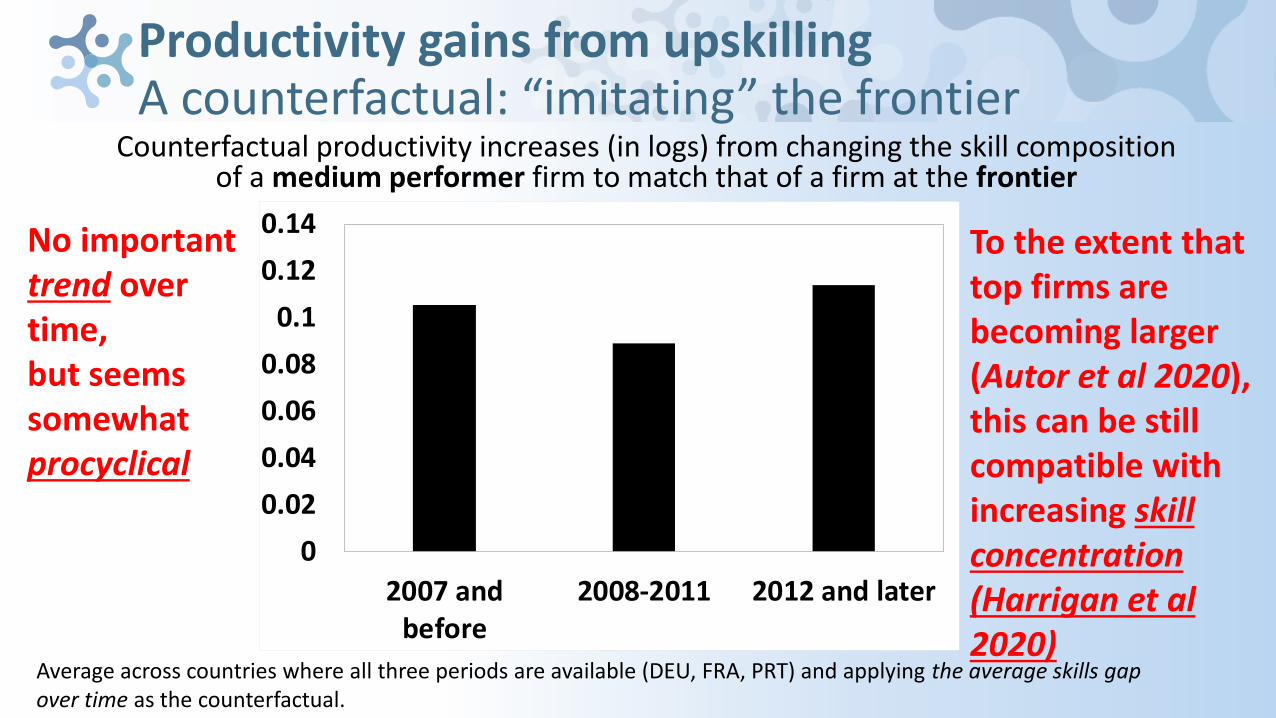
Productivity gains from upskillingA counterfactual: “imitating” the frontier
Counterfactual productivity increases (in logs) from changing the skill composition of a medium performer firm to match that of a firm at the frontier
Average across countries where all three periods are available (DEU, FRA, PRT) and applying the average skills gap over time as the counterfactual.
No important trend over time, but seems somewhat procyclical
To the extent that top firms are becoming larger (Autor et al 2020), this can be still compatible with increasing skill concentration (Harrigan et al 2020)
0
0.02
0.04
0.06
0.08
0.1
0.12
0.14
2007 andbefore
2008-2011 2012 and later