Embed Size (px)
Citation preview
SSP Paper
The Human Core of the SSPs: Population Scenarios by Age, Sex and Level of Education for all Countries to 2100
Samir KCa and Wolfgang Lutzb
aCorresponding Author, Wittgenstein Centre for Demography and Global Human Capital (IIASA, VID/ÖAW, WU), International Institute for Applied Systems Analysis, Schlossplatz 1, 2361 Laxenburg, Austria, [email protected], Tel: +43 (0)2236 807 424, Fax: +43 (0) 2236 71 313
bWittgenstein Centre for Demography and Global Human Capital (IIASA, VID/ÖAW, WU), International Institute for Applied Systems Analysis, Schlossplatz 1, 2361 Laxenburg, Austria, [email protected]
Acknowledgment: Partial support for this work was provided by the European Research Council (ERC) Advanced Investigator Grant focusing on “Forecasting Societies’ Adaptive Capacities to Climate Change” (ERC-2008-AdG 230195-FutureSoc).
Abstract: This paper applies the methods of multi-dimensional mathematical demography to project national populations based on alternative assumptions on future, fertility, mortality, migration and educational transitions that correspond to the five SSP storylines. In doing so it goes a significant step beyond past population scenarios in the IPCC context which considered only total population size. By differentiating the human population not only by age and sex – as is conventionally done in demographic projections – but also by different levels of educational attainment the most fundamental aspects of human development and social change are being explicitly addressed through modeling the changing composition of populations by these three important individual characteristics. The definitions of assumptions about future fertility, mortality, migration and education trends are based on a major new projections effort by the Wittgenstein Centre for Demography and Global Human Capital (IIASA, Austrian Academy of Sciences and WU-Vienna University of Economics) involving more than 600 experts from around the world.
Keywords: World Population, Education, Age Structure, Scenarios, Country Level, SSP
1. Introduction
The number of human beings on this planet has changed greatly over the past millennia and was in many aspects linked to changes in the natural environment – both in terms of being driven by changes in the environment and also of inducing such changes – as well as the evolution of technologies and human cultures. It is estimated that from the appearance of modern Homo sapiens some 200,000 years ago in Africa until around 35,000 years ago the total world population was well under one million and our species was seriously threatened by extinction (Biraben, 2002). Only after the Neolithic revolution which introduced agriculture the world population surpassed 100 million roughly 7000 years ago. But it was only in the 19th century that population growth really started to take off in the now industrialized countries as a consequence of a decline in death rates which was the result of better nutrition, improvements in hygiene and public fresh water supply and other advances in early preventive medicine. Right after the end of World War II death rates then started to fall precipitously in almost all parts of the world which at this time was also the result of modern medicine including the invention of antibiotics. But for several decades birth rates remained very high (and in some cases even increased due to a better health status of women) since high fertility norms had been deeply imbedded in most traditional cultures and religions and such norms tend to change only slowly. As a consequence, world population size started to “explode” from 2.5 billion in 1950 to somewhat above 7 billion today. But over the past decades birth rates have also started to decline in many parts of the world – most dramatically in populous East Asia – giving rise to the expectation that over the course of the 21st century there is a high probability that world population will reach a peak and then start to decline (Lutz et al., 2001). The scientific discipline of demography has a rather elaborate and powerful toolbox for studying population dynamics and produces detailed population projections according to different assumptions about the future trend in fertility, mortality, migration and other drivers of changing population composition. While population growth has been a topic of scientific enquiry and discussion for centuries and at least since Thomas Malthus entered the field of structured quantitative analysis, the first modern global population projection, which explicitly considered the age- and sex-structure of the population (the so-called cohort component method), was carried out by Frank Notestein of the Princeton Office of Population Research in 1945 (Notestein, 1945) (Part of the text in this section draws heavily on Lutz and KC, 2010). At the national level, several population projections precede this first comprehensive global projection. Hajnal (1955) provides a good overview of these early population projections. Between 1951 and 2011, the UN published 22 sets of estimates (past and current conditions) and projections (future) for all countries and territories of the world. Before 1978 these projections were revised approximately every 5 years; since then new revisions (called assessments and published in their World Population Prospects series) have been made every 2 years. So far the UN assessments have provided projections by age and sex for a medium scenario, and alternative scenarios that are based on alternative fertility assumptions combined with identical mortality and migration assumptions. The World Bank started to produce independent population projections in 1978. These were always meant primarily for internal use in the Bank’s development planning and were published as part of the World Development Report series. After 1984, the World Bank projections were revised approximately every two years and in most cases only one updated variant was published but with a long time horizon to 2150. Around 1995, the World Bank stopped publishing separate projections but presumably continued to use them for internal purposes for a number of years. The Washington-based Population Reference Bureau (PRB) publishes independent world population projections (population size only and a single scenario) every year as part of its annual World Population Data Sheet. The US Census Bureau (USCB) also produces single scenario projections for all countries in the world as of 1985 with a varying time horizon. The World Population Program of the International Institute for Applied Systems Analysis (IIASA) based outside Vienna (Austria) began producing global population projections at the level of 13 world regions in 1994. One of the purposes was to produce
population projections as part of the Special Report on Emissions Scenarios (SRES) (Nakicenovic et al., 2000) that underlie the global emission scenarios used by the Intergovernmental Panel for Climate Change (IPCC). This was followed by three rounds of probabilistic projections at the level of 13 world regions (Lutz et al., 2008b, 2001, 1997). 2. Key Dimensions Considered in Population Projections For most users of population projections clearly the most important piece of information is the future total size of the population. For this reason population size was the only demographic/social variable considered in the SRES scenarios complemented only by GDP per capita as an economic variable. Hence, for many practical purposes population size served primarily the function of a scaling factor in the calculation of per capita indicators. There are two important reasons for population projections to go beyond the consideration of population size alone, one methodological and the other substantive. Human populations are not homogeneous and this heterogeneity greatly matters for the likely future growth of the population. Populations that are selective in a way that they have only a small proportion of women or more elderly people than young adults are likely to have lower birth rates than population of comparable size but with a larger proportion of women in reproductive age. In this sense future population growth is a direct function of the age- and sex-structure of the population and for this reason all modern population projections do explicitly incorporate these two sources of population heterogeneity and define their assumptions in the form of age-specific fertility, mortality and migrations rates. The age- and sex-composition of the population is also of interest in its own right. Population ageing is considered a highly important socioeconomic issue which can only be quantitatively addressed if the age-structure of populations is explicitly incorporated in the projection model. But the same is true for other highly relevant individual characteristics such as level of education and rural/urban place of residence. Both are of dual significance: They are important sources of population heterogeneity, influencing its dynamics, and their changing composition in the population is directly relevant for anticipating socioeconomic challenges for mitigation as well as adaptation to unavoidable climate change. In this paper we will explicitly address the changing educational structure of populations while the following paper will deal with the modeling of urbanization. The methods of multi-dimensional population dynamics are able to deal with populations that are stratified by further demographic dimensions in addition to age and sex. IIASA – where these methods were originally developed during the 1970s – has recently applied them to produce reconstructions and projections of populations by age, sex and level of educational attainment for most countries in the world (KC et al., 2010; Lutz et al., 2007). Like age and sex, education is also an important source of population heterogeneity and bears a significant weight of its own. Almost universally more educated people have lower mortality, and there is sufficient evidence that this is a real effect and not just owing to selectivity (Lutz and KC, 2011). Also, in all populations that are still in the process of demographic transition, more educated women have lower fertility. These educational differentials can be very significant. The Demographic and Health Survey for Ethiopia, for instance, shows that women without any formal education have on average six children, whereas those with secondary education have only two (DHS Ethiopia, 2012). Because of the strong association between female education and fertility, future changes in the composition of the female population by educational attainment make a big difference. Lutz and KC (2011) have recently shown that alternative education scenarios alone (assuming identical education-specific fertility and mortality levels) lead to a difference of more than one billion people in the world population sizes projected for 2050.
In addition to its effects on population dynamics, the changing educational composition of the population is also of great importance for a broad range of social and economic development concerns. Based on a newly reconstructed set of educational attainment distributions by age and sex (Lutz et al., 2007) for most countries back to 1970, it has recently been shown that indeed the improvement of educational attainment in the working age population has been the most consistent and significant driver of economic growth around the world (Lutz et al., 2008a). In the context of the SSPs this empirically established relationship will also be used to define GDP growth scenarios that are consistent with the education-specific population scenarios described here. Beyond economic growth, education as a basic force of empowering people and providing access to information has been shown to matter to a large range of important aspect in the context of sustainable development. There is overwhelming evidence that education is a key determinant of both infant mortality (Pamuk et al., 2011) and adult health and mortality (KC and Lentzner, 2010). But beyond individual benefits, improving education by age and sex has also been shown to matter for countries in transition to modern democracies and the rule of law (Abbasi-Shavazi et al., 2008; Lutz, 2009; Lutz et al., 2010). For the question of food security, it has long been shown that the basic education of the agricultural labor force is a key factor in agricultural production (Hayami and Ruttan, 1971). As the set of Population–Education–Development–Agriculture (PEDA) models commissioned by the UN Economic Commission for Africa for a number of African countries shows, when including education in an agricultural production function, it turns out to be one of the key determinants in reducing malnutrition and food insecurity (Lutz et al., 2004). Finally, in the context of adaptation to climate change, a series of empirical studies on differential vulnerability to various kinds of natural disasters in different parts of the world have confirmed the dominating role of education as an empowering factor that tends to reduce vulnerability and enhance the adaptive capacity to the negative consequences of climate change (Frankenberg et al., 2013; Helgeson et al., 2013; KC, 2013; Sharma et al., 2013; Striessnig et al., 2013; Wamsler et al., 2012). Hence, it seems very appropriate for socioeconomic scenarios, which are supposed to capture the socioeconomic challenges of both mitigation and adaptation, to enrich the conventional demographic focus on population size as well as on the age- and sex-structure of the population through adding education attainment as an additional demographic dimension. Since these dimensions together comprehensively describe key characteristics of people, with respect to their mitigative and adaptive capacities, this set of scenarios may appropriately be called the human core of the SSPs. In 2011 IIASA’s World Population Program in collaboration with the Vienna Institute of Demography of the Austrian Academy of Sciences and Oxford University launched a major new effort of expert argument solicitation for defining new assumptions for a comprehensive new set of population projections by age, sex and level of education for all countries in the world. This new approach was funded by an ERC Advanced Grant awarded to Wolfgang Lutz on the topic of “Forecasting Societies’ Adaptive Capacities to Climate Change”. More than 600 population experts from around the world participated in this effort. It consisted of an online questionnaire that assessed in peer review manner the validity of alternative arguments that would impact the future trends of fertility, mortality and migration. In a series of five meta-expert meetings held on five different continents the survey findings were evaluated and ultimately translated into numerical assumptions for the actual projections for all countries. This elaborate process was concluded in late 2012 – just in time to inform the final population scenarios for the SSPs that are being presented in this paper. All the parameter choices and justifications of assumptions that underlie the projections presented here as well as detailed country-specific results are documented in the forthcoming “Oxford Handbook of World Population and Human Capital in the 21st Century” (Lutz et al., 2013). The medium variant of this new set of projections is identical to SSP2 as it is presented in this paper. All other SSPs have been derived from the storylines and are defined in a way that is described in the following section.
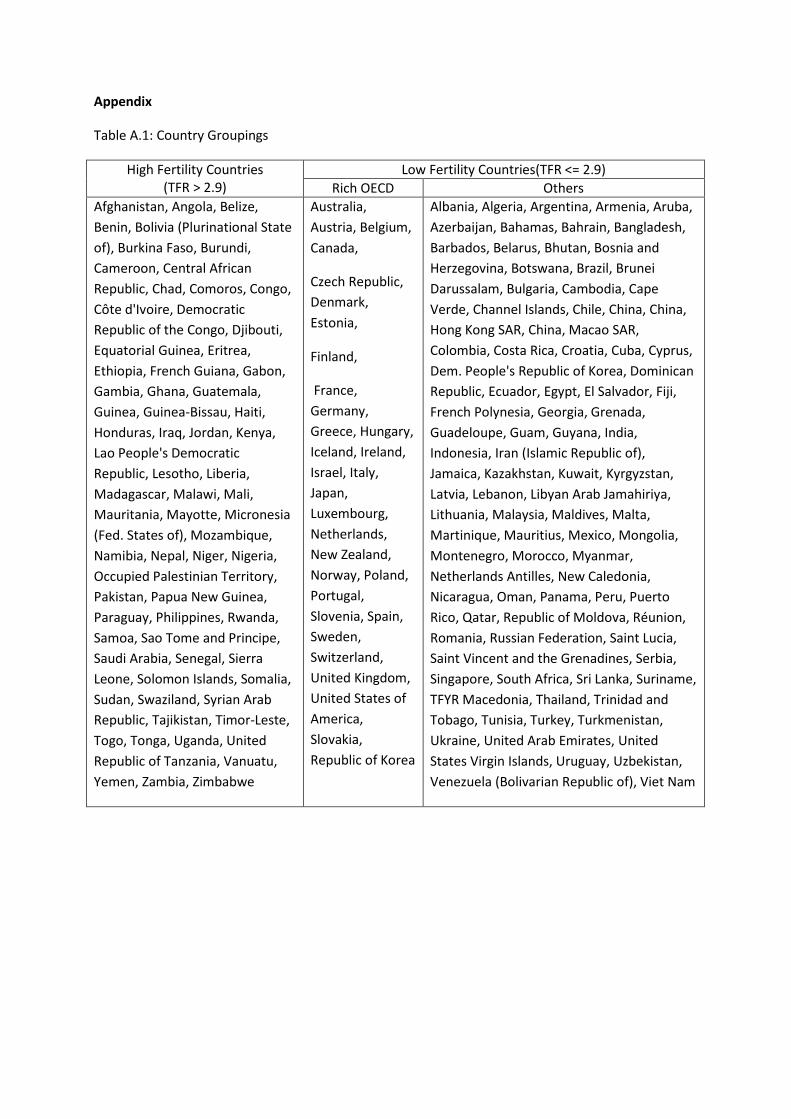
3. Translation of SSP Storylines into Population and Education Scenarios The general SSP rationale as well as the storylines underlying the individual SSPs have been extensively discussed and documented in the previous papers and need not be repeated here. In the following we will only focus on the specific way these storylines are translated into alternative fertility, mortality, migration and education scenarios for different groups of countries. Three groups of countries have been distinguished: “High fertility countries” as defined by a Total Fertility Rate of more than 2.9 in 2005-2010; “Low fertility countries” including all countries with a Total Fertility Rate of 2.9 and below that are not included in the third category of “Rich-OECD countries”, the latter being defined by OECD membership and the World Bank category of high income country (see Appendix). It is important to note that for this set of general SSPs countries are assumed to stay in the grouping that they start out. This may be unsatisfactory for countries that e.g. are in the midst of a fertility decline and are expected to soon move in the low fertility group or countries such as Singapore that a very rich but at this moment not part of the OECD. But since there is an almost infinite number of ways and times at which countries could change the groupings it was decided that this should be left to users who want to define their country-specific SSPs.
In the following Table 1 these choices for scenario definitions are summarized, and justified in the following text. The specific choices made result from a lengthy interactive discussing process among the persons and institutes involved in these SSP efforts. For fertility, mortality and migration assumptions, the “medium” refers directly to the “most likely” national level trajectories assumed and extensively documented in the forthcoming book (Lutz et al., 2013). There is no space here to even summarize these assumptions in any comprehensive way. It suffices to say that with respect to fertility, the assumed country-specific trajectories result from a model that samples from the collective experience of all countries that once were in a similar standing, with respect to the fertility transition, and then adjusts these modeled values somewhat through the country-specific information, derived from the expert argument evaluation exercise and the conclusions of the meta-expert meetings. While typically the resulting trajectories are not very different from those assumed in the UN 2010 assessment, a significant difference lies in the fact that the long term convergence level for low fertility countries is assumed to be 1.75 (rather than 2.1 as in United Nations, 2011). The “high” and “low” fertility scenarios were essentially defined as being 20 percent higher and lower than the medium by 2030 and 25 percent different by 2050 and thereafter. Differentials in education-specific fertility levels started with those empirically observed in individual countries and then were generally assumed to converge to a global pattern over the coming decades.
“Medium” mortality assumptions were made on the basis of a global conditional convergence model, under which it was assumed that life expectancies in all countries progressively approach those in regional forerunner countries. These regional champions themselves would slowly approach the global forerunner (Japan), which is assumed to experience a constant increase of two years in life expectancy per decade. For the “high” and “low” scenarios it was generally assumed that life expectancy would increase one year per decade faster or slower than in the “medium” case. For AIDS effected countries in Sub-Saharan Africa special assumptions were made with larger uncertainty intervals in the nearer term. Again, the specific numerical assumptions for each country result from extensive expert argumentation as documented in Lutz et al. (2013).
The migration assumptions are based on a new global level estimate of the full matrix of in- and out-migration flows as derived primarily from migrant stock data (Abel, 2013). The medium scenario then
assumes constant in- and out-migration rates for the coming half century followed by a slow convergence to zero net migration. It is worth noting that the assumption of constant rates, rather than constant absolute flows, can over time produce changes in the absolute flows as a function of changing national population size (for out-migration) or world population size (for in-migration). The high migration scenarios essentially assume 50 percent higher and the low migration 50 percent lower migration than in the medium scenario.
Finally, the different education scenarios require a word of clarification. The Global Education Trend (GET) scenario is based on a Bayesian model that estimates the most likely future trajectory in education-specific progression rates to higher levels from the cumulative experience of all countries over the past 40 years. The resulting education trajectories for each country are not only considered to be the “medium”, but they are also used as the standard against which all the future education-specific fertility and mortality trajectories are being derived from, assumptions of overall fertility and mortality levels. There are two other benchmark scenarios with respect to future education trends: The Constant Enrollment Rates (CER) simply assumes that in each country the most recently observed level of school enrollment, and hence education progression, are frozen at their current levels. Since in many countries the younger age groups are much better educated than the older ones, even this scenario can lead to some improvements in adult education levels over the coming decades, but in the longer run implies stagnation. On the other extreme, there is the Fast Track (FT) scenario which assumes that the country will shift gears and follow the most rapid education expansion experienced in recent history, namely that of South Korea. Some of the education scenario choices presented in Table 1 for different SSPs are combinations of the above described stylized scenarios: FT-GET for SSP1 and SSP5 has been calculated for each country by taking the arithmetic mean of the education progression rates implied under the GET and FT scenarios. For SSP4 a more complex combination was chosen in order to reflect the increasing within-country inequality that storyline implies: “CER-10%/GET” implies that the educational attainment progression ratio (EAPR) is further reduced by 10%, as compared to CER (and hence still more pessimistic), for the transitions from no education to incomplete primary, incomplete primary to completed primary and from completed primary to completed lower secondary. The GET transition ratios are assumed for the higher educational categories which will produce larger groups of elites in these countries. Under “CER/CER-20%”, for the high income OECD countries, it is assumed that for these higher education groups the transition rates are 20 percent lower than under CER and hence also produce a more polarized society.
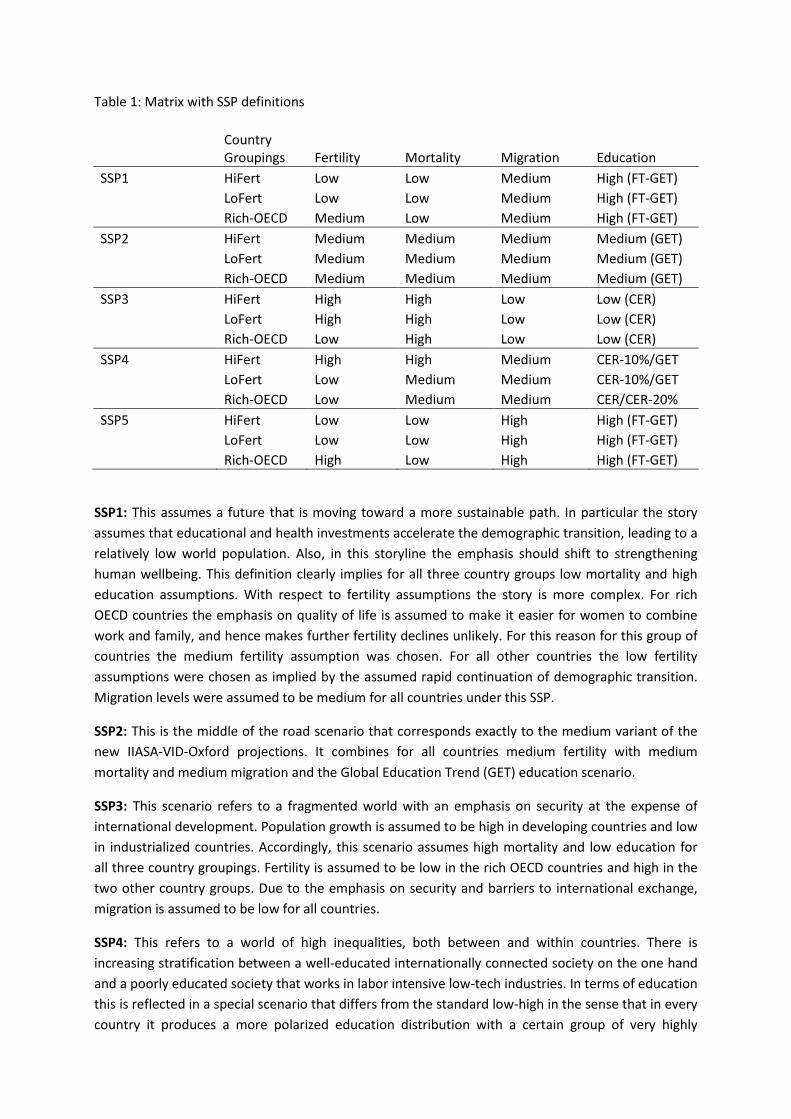
Table 1: Matrix with SSP definitions
Country Groupings Fertility Mortality Migration Education
SSP1 HiFert Low Low Medium High (FT-GET)
LoFert Low Low Medium High (FT-GET)
Rich-OECD Medium Low Medium High (FT-GET) SSP2 HiFert Medium Medium Medium Medium (GET)
LoFert Medium Medium Medium Medium (GET)
Rich-OECD Medium Medium Medium Medium (GET) SSP3 HiFert High High Low Low (CER)
LoFert High High Low Low (CER)
Rich-OECD Low High Low Low (CER) SSP4 HiFert High High Medium CER-10%/GET
LoFert Low Medium Medium CER-10%/GET
Rich-OECD Low Medium Medium CER/CER-20% SSP5 HiFert Low Low High High (FT-GET)
LoFert Low Low High High (FT-GET)
Rich-OECD High Low High High (FT-GET)
SSP1: This assumes a future that is moving toward a more sustainable path. In particular the story assumes that educational and health investments accelerate the demographic transition, leading to a relatively low world population. Also, in this storyline the emphasis should shift to strengthening human wellbeing. This definition clearly implies for all three country groups low mortality and high education assumptions. With respect to fertility assumptions the story is more complex. For rich OECD countries the emphasis on quality of life is assumed to make it easier for women to combine work and family, and hence makes further fertility declines unlikely. For this reason for this group of countries the medium fertility assumption was chosen. For all other countries the low fertility assumptions were chosen as implied by the assumed rapid continuation of demographic transition. Migration levels were assumed to be medium for all countries under this SSP.
SSP2: This is the middle of the road scenario that corresponds exactly to the medium variant of the new IIASA-VID-Oxford projections. It combines for all countries medium fertility with medium mortality and medium migration and the Global Education Trend (GET) education scenario.
SSP3: This scenario refers to a fragmented world with an emphasis on security at the expense of international development. Population growth is assumed to be high in developing countries and low in industrialized countries. Accordingly, this scenario assumes high mortality and low education for all three country groupings. Fertility is assumed to be low in the rich OECD countries and high in the two other country groups. Due to the emphasis on security and barriers to international exchange, migration is assumed to be low for all countries.
SSP4: This refers to a world of high inequalities, both between and within countries. There is increasing stratification between a well-educated internationally connected society on the one hand and a poorly educated society that works in labor intensive low-tech industries. In terms of education this is reflected in a special scenario that differs from the standard low-high in the sense that in every country it produces a more polarized education distribution with a certain group of very highly
educated (which is bigger in the rich OECD countries) and large groups with low education. In terms of fertility at the national averages this implies continued high fertility in today’s high fertility countries and continued low fertility in both groups of low fertility countries. For mortality the high fertility countries are assumed to suffer from high levels whereas the other two groups have medium mortality. Migration is assumed to be at the medium level for all countries.
SSP5: This refers to a world that stresses technological progress and where economic growth is fostered by rapid development of human capital. This is reflected in high education assumptions and low mortality assumptions across all countries. For fertility again the pattern is strongly differentiated, with relatively high fertility assumed for the rich OECD countries (as a consequence of high tech and a very high standard of living that allows for easier combination of work and family, and possibly for immigrant domestic assistants) and low fertility assumed for all other countries. The emphasis on market solutions and globalization also implies the assumption of high migration for all countries.
4. Results
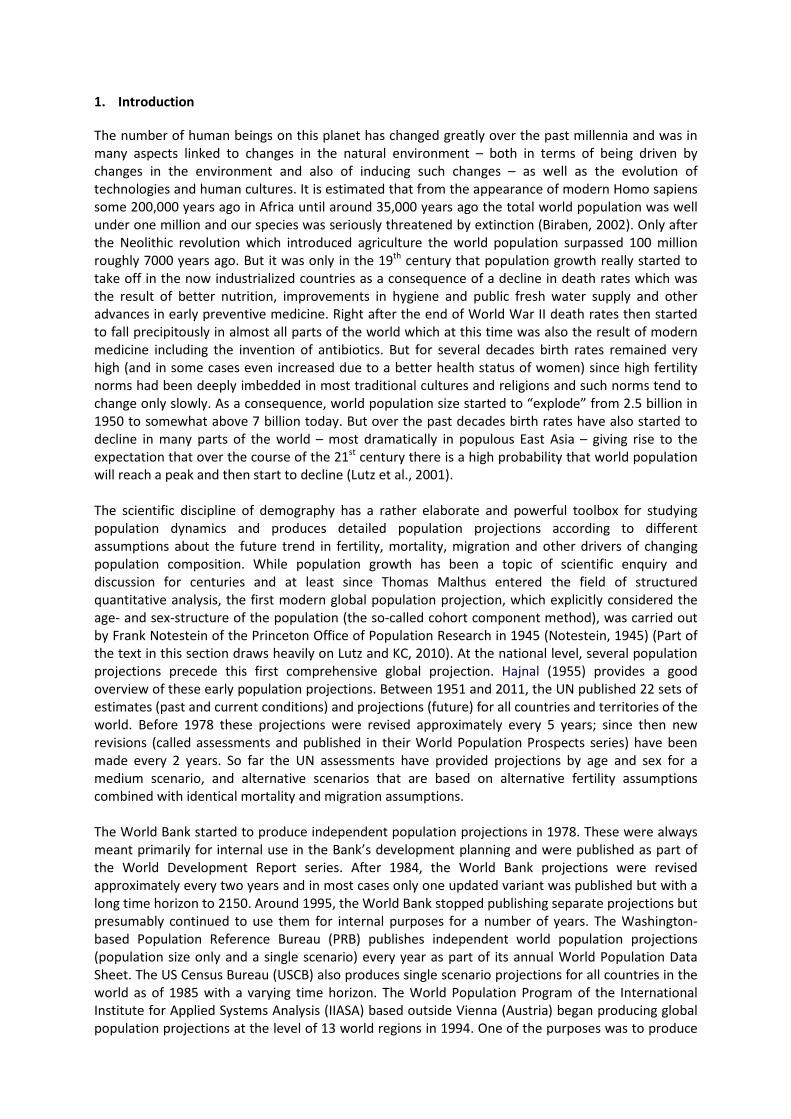
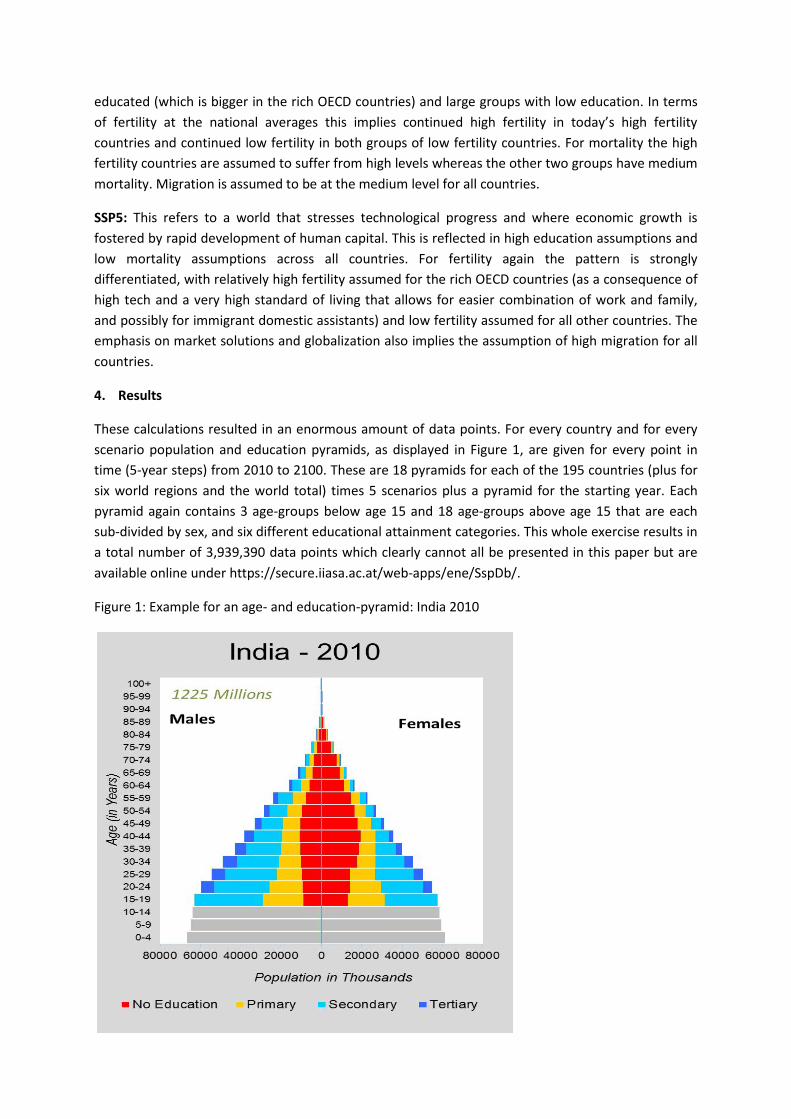
These calculations resulted in an enormous amount of data points. For every country and for every scenario population and education pyramids, as displayed in Figure 1, are given for every point in time (5-year steps) from 2010 to 2100. These are 18 pyramids for each of the 195 countries (plus for six world regions and the world total) times 5 scenarios plus a pyramid for the starting year. Each pyramid again contains 3 age-groups below age 15 and 18 age-groups above age 15 that are each sub-divided by sex, and six different educational attainment categories. This whole exercise results in a total number of 3,939,390 data points which clearly cannot all be presented in this paper but are available online under https://secure.iiasa.ac.at/web-apps/ene/SspDb/.
Figure 1: Example for an age- and education-pyramid: India 2010
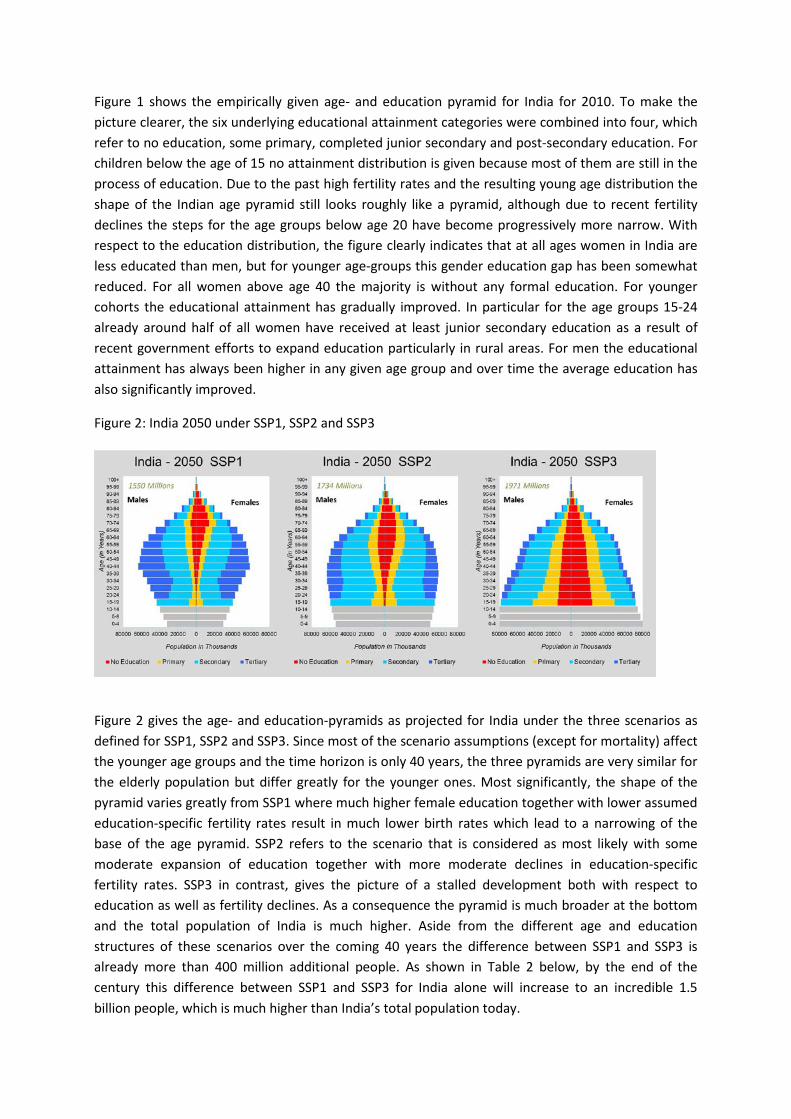
Figure 1 shows the empirically given age- and education pyramid for India for 2010. To make the picture clearer, the six underlying educational attainment categories were combined into four, which refer to no education, some primary, completed junior secondary and post-secondary education. For children below the age of 15 no attainment distribution is given because most of them are still in the process of education. Due to the past high fertility rates and the resulting young age distribution the shape of the Indian age pyramid still looks roughly like a pyramid, although due to recent fertility declines the steps for the age groups below age 20 have become progressively more narrow. With respect to the education distribution, the figure clearly indicates that at all ages women in India are less educated than men, but for younger age-groups this gender education gap has been somewhat reduced. For all women above age 40 the majority is without any formal education. For younger cohorts the educational attainment has gradually improved. In particular for the age groups 15-24 already around half of all women have received at least junior secondary education as a result of recent government efforts to expand education particularly in rural areas. For men the educational attainment has always been higher in any given age group and over time the average education has also significantly improved.
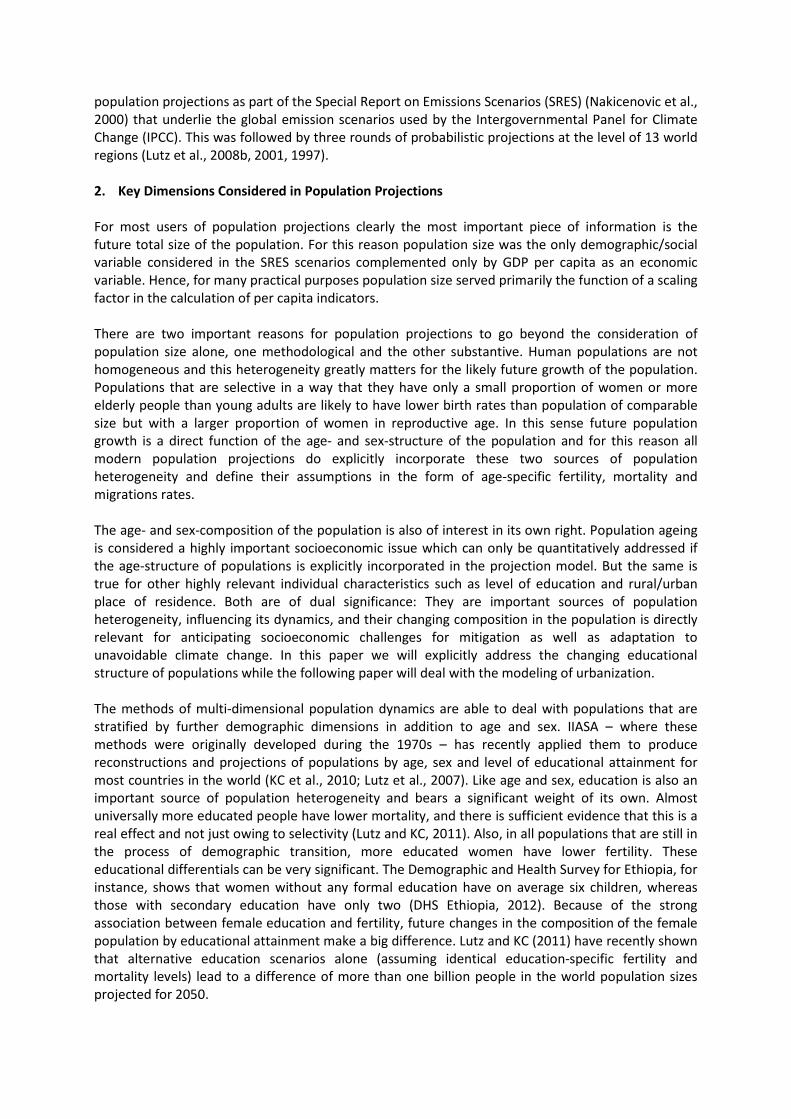
Figure 2: India 2050 under SSP1, SSP2 and SSP3
Figure 2 gives the age- and education-pyramids as projected for India under the three scenarios as defined for SSP1, SSP2 and SSP3. Since most of the scenario assumptions (except for mortality) affect the younger age groups and the time horizon is only 40 years, the three pyramids are very similar for the elderly population but differ greatly for the younger ones. Most significantly, the shape of the pyramid varies greatly from SSP1 where much higher female education together with lower assumed education-specific fertility rates result in much lower birth rates which lead to a narrowing of the base of the age pyramid. SSP2 refers to the scenario that is considered as most likely with some moderate expansion of education together with more moderate declines in education-specific fertility rates. SSP3 in contrast, gives the picture of a stalled development both with respect to education as well as fertility declines. As a consequence the pyramid is much broader at the bottom and the total population of India is much higher. Aside from the different age and education structures of these scenarios over the coming 40 years the difference between SSP1 and SSP3 is already more than 400 million additional people. As shown in Table 2 below, by the end of the century this difference between SSP1 and SSP3 for India alone will increase to an incredible 1.5 billion people, which is much higher than India’s total population today.

The following figures and tables provide summary indicators for the different SSPs and different points in time that have been derived from the fuller age-sex-education-specific projections as described above. This information will be presented in the form of aggregates for major world regions, the world as a whole as well as for 12 selected countries. The more detailed information for all countries is provided in the on-line appendix.
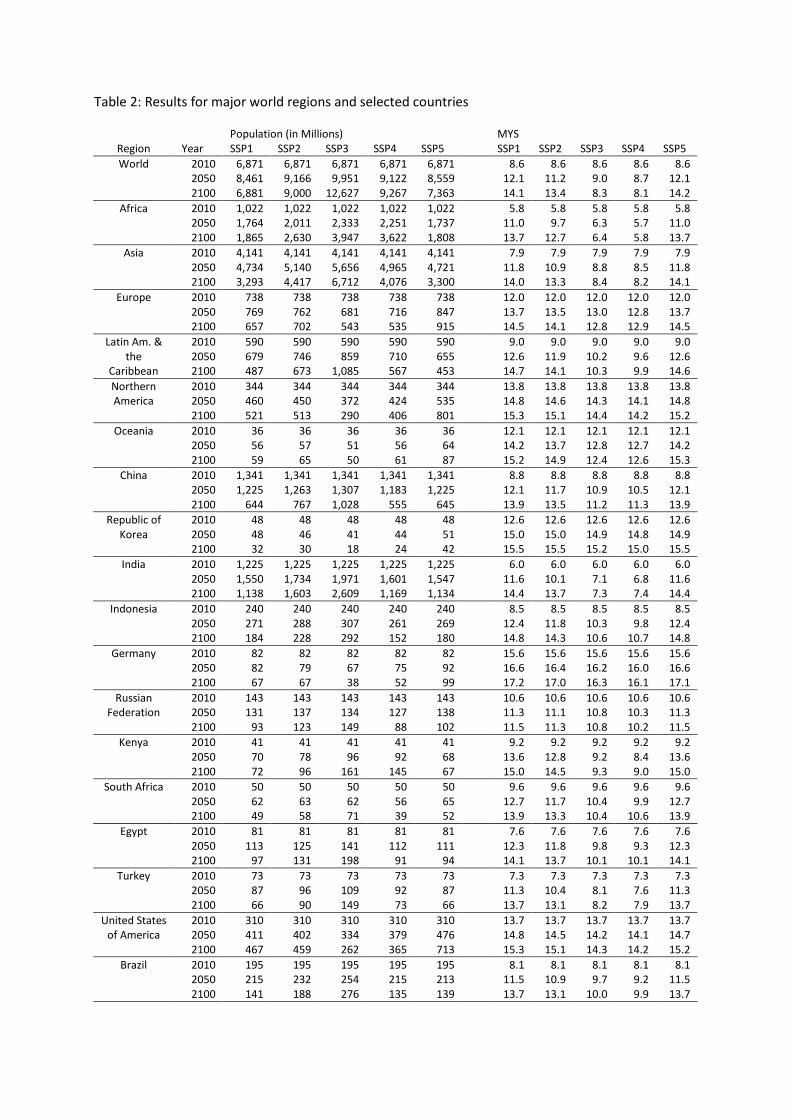
Table 2: Results for major world regions and selected countries
Population (in Millions)
MYS Region Year SSP1 SSP2 SSP3 SSP4 SSP5 SSP1 SSP2 SSP3 SSP4 SSP5 World 2010 6,871 6,871 6,871 6,871 6,871
8.6 8.6 8.6 8.6 8.6
2050 8,461 9,166 9,951 9,122 8,559
12.1 11.2 9.0 8.7 12.1 2100 6,881 9,000 12,627 9,267 7,363
14.1 13.4 8.3 8.1 14.2
Africa 2010 1,022 1,022 1,022 1,022 1,022
5.8 5.8 5.8 5.8 5.8 2050 1,764 2,011 2,333 2,251 1,737
11.0 9.7 6.3 5.7 11.0
2100 1,865 2,630 3,947 3,622 1,808
13.7 12.7 6.4 5.8 13.7 Asia 2010 4,141 4,141 4,141 4,141 4,141
7.9 7.9 7.9 7.9 7.9
2050 4,734 5,140 5,656 4,965 4,721
11.8 10.9 8.8 8.5 11.8 2100 3,293 4,417 6,712 4,076 3,300
14.0 13.3 8.4 8.2 14.1
Europe 2010 738 738 738 738 738
12.0 12.0 12.0 12.0 12.0 2050 769 762 681 716 847
13.7 13.5 13.0 12.8 13.7
2100 657 702 543 535 915
14.5 14.1 12.8 12.9 14.5 Latin Am. &
the Caribbean
2010 590 590 590 590 590
9.0 9.0 9.0 9.0 9.0 2050 679 746 859 710 655
12.6 11.9 10.2 9.6 12.6
2100 487 673 1,085 567 453
14.7 14.1 10.3 9.9 14.6 Northern America
2010 344 344 344 344 344
13.8 13.8 13.8 13.8 13.8 2050 460 450 372 424 535
14.8 14.6 14.3 14.1 14.8
2100 521 513 290 406 801
15.3 15.1 14.4 14.2 15.2 Oceania 2010 36 36 36 36 36
12.1 12.1 12.1 12.1 12.1
2050 56 57 51 56 64
14.2 13.7 12.8 12.7 14.2 2100 59 65 50 61 87
15.2 14.9 12.4 12.6 15.3
China 2010 1,341 1,341 1,341 1,341 1,341
8.8 8.8 8.8 8.8 8.8 2050 1,225 1,263 1,307 1,183 1,225
12.1 11.7 10.9 10.5 12.1
2100 644 767 1,028 555 645
13.9 13.5 11.2 11.3 13.9 Republic of
Korea 2010 48 48 48 48 48
12.6 12.6 12.6 12.6 12.6
2050 48 46 41 44 51
15.0 15.0 14.9 14.8 14.9 2100 32 30 18 24 42
15.5 15.5 15.2 15.0 15.5
India 2010 1,225 1,225 1,225 1,225 1,225
6.0 6.0 6.0 6.0 6.0 2050 1,550 1,734 1,971 1,601 1,547
11.6 10.1 7.1 6.8 11.6
2100 1,138 1,603 2,609 1,169 1,134
14.4 13.7 7.3 7.4 14.4 Indonesia 2010 240 240 240 240 240
8.5 8.5 8.5 8.5 8.5
2050 271 288 307 261 269
12.4 11.8 10.3 9.8 12.4 2100 184 228 292 152 180
14.8 14.3 10.6 10.7 14.8
Germany 2010 82 82 82 82 82
15.6 15.6 15.6 15.6 15.6 2050 82 79 67 75 92
16.6 16.4 16.2 16.0 16.6
2100 67 67 38 52 99
17.2 17.0 16.3 16.1 17.1 Russian
Federation 2010 143 143 143 143 143
10.6 10.6 10.6 10.6 10.6
2050 131 137 134 127 138
11.3 11.1 10.8 10.3 11.3 2100 93 123 149 88 102
11.5 11.3 10.8 10.2 11.5
Kenya 2010 41 41 41 41 41
9.2 9.2 9.2 9.2 9.2 2050 70 78 96 92 68
13.6 12.8 9.2 8.4 13.6
2100 72 96 161 145 67
15.0 14.5 9.3 9.0 15.0 South Africa 2010 50 50 50 50 50
9.6 9.6 9.6 9.6 9.6
2050 62 63 62 56 65
12.7 11.7 10.4 9.9 12.7 2100 49 58 71 39 52
13.9 13.3 10.4 10.6 13.9
Egypt 2010 81 81 81 81 81
7.6 7.6 7.6 7.6 7.6 2050 113 125 141 112 111
12.3 11.8 9.8 9.3 12.3
2100 97 131 198 91 94
14.1 13.7 10.1 10.1 14.1 Turkey 2010 73 73 73 73 73
7.3 7.3 7.3 7.3 7.3
2050 87 96 109 92 87
11.3 10.4 8.1 7.6 11.3 2100 66 90 149 73 66
13.7 13.1 8.2 7.9 13.7
United States of America
2010 310 310 310 310 310
13.7 13.7 13.7 13.7 13.7 2050 411 402 334 379 476
14.8 14.5 14.2 14.1 14.7
2100 467 459 262 365 713
15.3 15.1 14.3 14.2 15.2 Brazil 2010 195 195 195 195 195
8.1 8.1 8.1 8.1 8.1
2050 215 232 254 215 213
11.5 10.9 9.7 9.2 11.5 2100 141 188 276 135 139
13.7 13.1 10.0 9.9 13.7
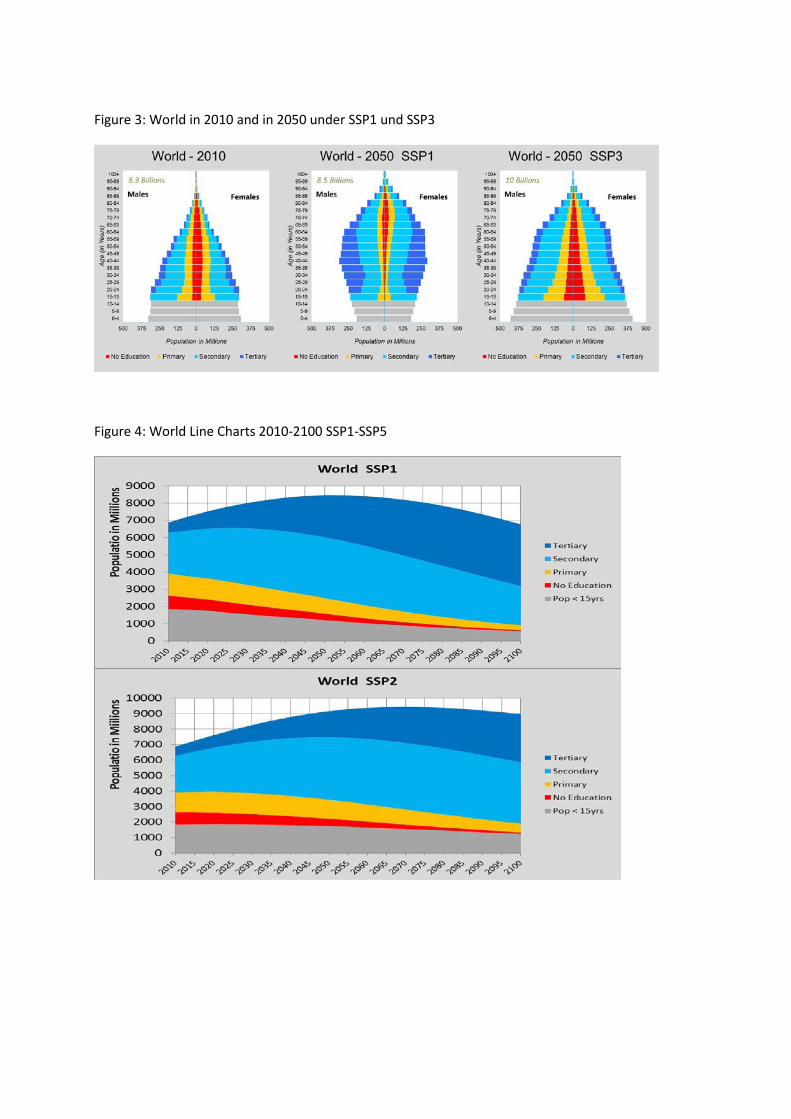
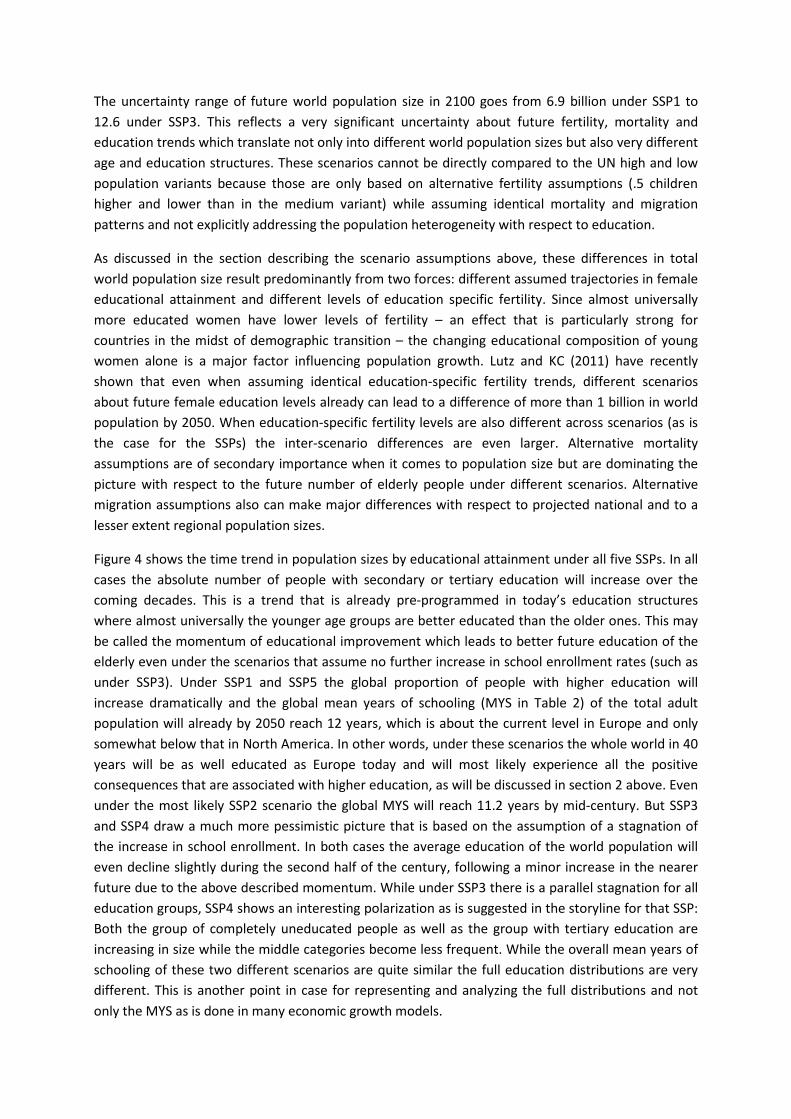
Figure 3: World in 2010 and in 2050 under SSP1 und SSP3
Figure 4: World Line Charts 2010-2100 SSP1-SSP5
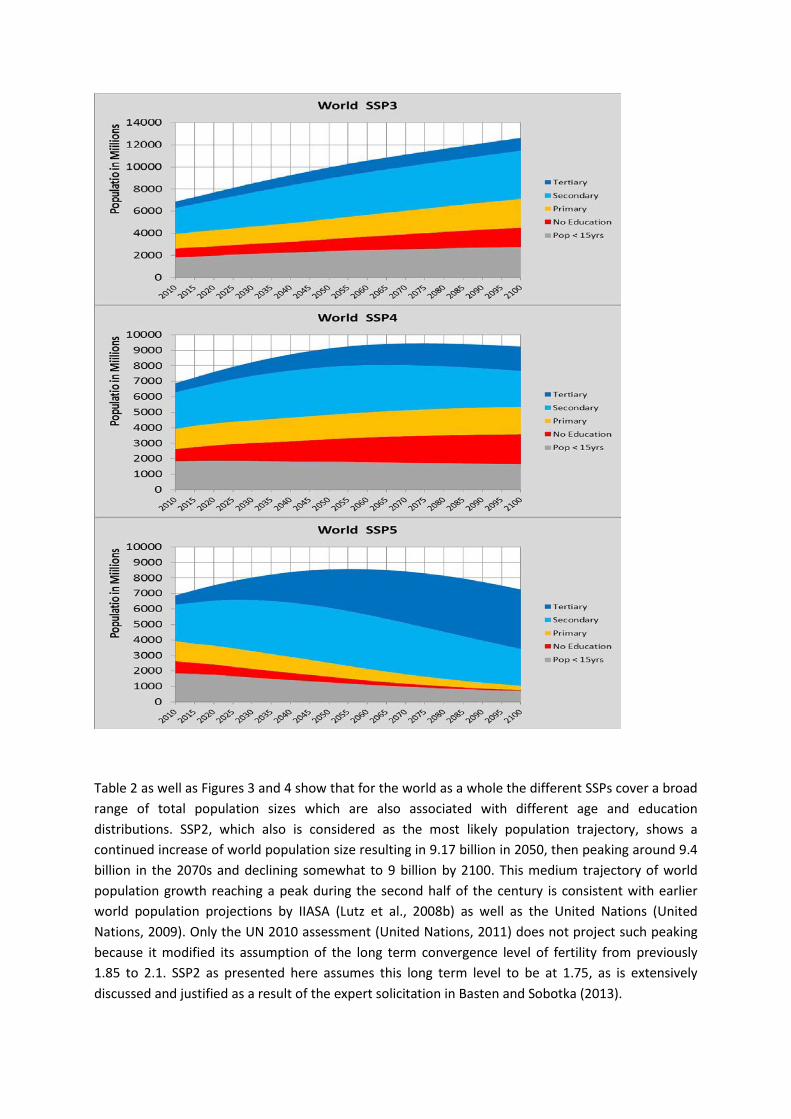
Table 2 as well as Figures 3 and 4 show that for the world as a whole the different SSPs cover a broad range of total population sizes which are also associated with different age and education distributions. SSP2, which also is considered as the most likely population trajectory, shows a continued increase of world population size resulting in 9.17 billion in 2050, then peaking around 9.4 billion in the 2070s and declining somewhat to 9 billion by 2100. This medium trajectory of world population growth reaching a peak during the second half of the century is consistent with earlier world population projections by IIASA (Lutz et al., 2008b) as well as the United Nations (United Nations, 2009). Only the UN 2010 assessment (United Nations, 2011) does not project such peaking because it modified its assumption of the long term convergence level of fertility from previously 1.85 to 2.1. SSP2 as presented here assumes this long term level to be at 1.75, as is extensively discussed and justified as a result of the expert solicitation in Basten and Sobotka (2013).
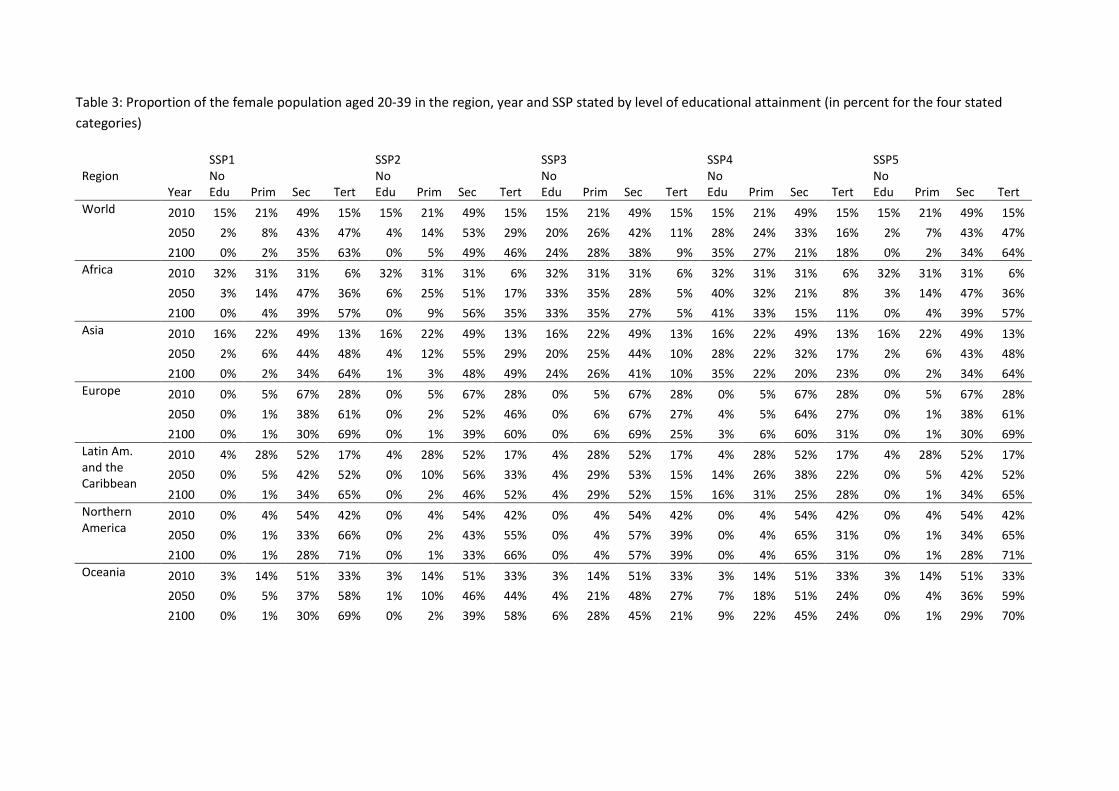
Table 3: Proportion of the female population aged 20-39 in the region, year and SSP stated by level of educational attainment (in percent for the four stated categories)
SSP1
SSP2
SSP3
SSP4
SSP5 Region
Year No Edu Prim Sec Tert
No Edu Prim Sec Tert
No Edu Prim Sec Tert
No Edu Prim Sec Tert
No Edu Prim Sec Tert
World 2010 15% 21% 49% 15% 15% 21% 49% 15% 15% 21% 49% 15% 15% 21% 49% 15% 15% 21% 49% 15% 2050 2% 8% 43% 47% 4% 14% 53% 29% 20% 26% 42% 11% 28% 24% 33% 16% 2% 7% 43% 47% 2100 0% 2% 35% 63% 0% 5% 49% 46% 24% 28% 38% 9% 35% 27% 21% 18% 0% 2% 34% 64%
Africa 2010 32% 31% 31% 6% 32% 31% 31% 6% 32% 31% 31% 6% 32% 31% 31% 6% 32% 31% 31% 6% 2050 3% 14% 47% 36% 6% 25% 51% 17% 33% 35% 28% 5% 40% 32% 21% 8% 3% 14% 47% 36% 2100 0% 4% 39% 57% 0% 9% 56% 35% 33% 35% 27% 5% 41% 33% 15% 11% 0% 4% 39% 57%
Asia 2010 16% 22% 49% 13% 16% 22% 49% 13% 16% 22% 49% 13% 16% 22% 49% 13% 16% 22% 49% 13% 2050 2% 6% 44% 48% 4% 12% 55% 29% 20% 25% 44% 10% 28% 22% 32% 17% 2% 6% 43% 48% 2100 0% 2% 34% 64% 1% 3% 48% 49% 24% 26% 41% 10% 35% 22% 20% 23% 0% 2% 34% 64%
Europe 2010 0% 5% 67% 28% 0% 5% 67% 28% 0% 5% 67% 28% 0% 5% 67% 28% 0% 5% 67% 28% 2050 0% 1% 38% 61% 0% 2% 52% 46% 0% 6% 67% 27% 4% 5% 64% 27% 0% 1% 38% 61% 2100 0% 1% 30% 69% 0% 1% 39% 60% 0% 6% 69% 25% 3% 6% 60% 31% 0% 1% 30% 69%
Latin Am. and the Caribbean
2010 4% 28% 52% 17% 4% 28% 52% 17% 4% 28% 52% 17% 4% 28% 52% 17% 4% 28% 52% 17% 2050 0% 5% 42% 52% 0% 10% 56% 33% 4% 29% 53% 15% 14% 26% 38% 22% 0% 5% 42% 52% 2100 0% 1% 34% 65% 0% 2% 46% 52% 4% 29% 52% 15% 16% 31% 25% 28% 0% 1% 34% 65%
Northern America
2010 0% 4% 54% 42% 0% 4% 54% 42% 0% 4% 54% 42% 0% 4% 54% 42% 0% 4% 54% 42% 2050 0% 1% 33% 66% 0% 2% 43% 55% 0% 4% 57% 39% 0% 4% 65% 31% 0% 1% 34% 65% 2100 0% 1% 28% 71% 0% 1% 33% 66% 0% 4% 57% 39% 0% 4% 65% 31% 0% 1% 28% 71%
Oceania 2010 3% 14% 51% 33% 3% 14% 51% 33% 3% 14% 51% 33% 3% 14% 51% 33% 3% 14% 51% 33% 2050 0% 5% 37% 58% 1% 10% 46% 44% 4% 21% 48% 27% 7% 18% 51% 24% 0% 4% 36% 59% 2100 0% 1% 30% 69% 0% 2% 39% 58% 6% 28% 45% 21% 9% 22% 45% 24% 0% 1% 29% 70%
The uncertainty range of future world population size in 2100 goes from 6.9 billion under SSP1 to 12.6 under SSP3. This reflects a very significant uncertainty about future fertility, mortality and education trends which translate not only into different world population sizes but also very different age and education structures. These scenarios cannot be directly compared to the UN high and low population variants because those are only based on alternative fertility assumptions (.5 children higher and lower than in the medium variant) while assuming identical mortality and migration patterns and not explicitly addressing the population heterogeneity with respect to education.
As discussed in the section describing the scenario assumptions above, these differences in total world population size result predominantly from two forces: different assumed trajectories in female educational attainment and different levels of education specific fertility. Since almost universally more educated women have lower levels of fertility – an effect that is particularly strong for countries in the midst of demographic transition – the changing educational composition of young women alone is a major factor influencing population growth. Lutz and KC (2011) have recently shown that even when assuming identical education-specific fertility trends, different scenarios about future female education levels already can lead to a difference of more than 1 billion in world population by 2050. When education-specific fertility levels are also different across scenarios (as is the case for the SSPs) the inter-scenario differences are even larger. Alternative mortality assumptions are of secondary importance when it comes to population size but are dominating the picture with respect to the future number of elderly people under different scenarios. Alternative migration assumptions also can make major differences with respect to projected national and to a lesser extent regional population sizes.
Figure 4 shows the time trend in population sizes by educational attainment under all five SSPs. In all cases the absolute number of people with secondary or tertiary education will increase over the coming decades. This is a trend that is already pre-programmed in today’s education structures where almost universally the younger age groups are better educated than the older ones. This may be called the momentum of educational improvement which leads to better future education of the elderly even under the scenarios that assume no further increase in school enrollment rates (such as under SSP3). Under SSP1 and SSP5 the global proportion of people with higher education will increase dramatically and the global mean years of schooling (MYS in Table 2) of the total adult population will already by 2050 reach 12 years, which is about the current level in Europe and only somewhat below that in North America. In other words, under these scenarios the whole world in 40 years will be as well educated as Europe today and will most likely experience all the positive consequences that are associated with higher education, as will be discussed in section 2 above. Even under the most likely SSP2 scenario the global MYS will reach 11.2 years by mid-century. But SSP3 and SSP4 draw a much more pessimistic picture that is based on the assumption of a stagnation of the increase in school enrollment. In both cases the average education of the world population will even decline slightly during the second half of the century, following a minor increase in the nearer future due to the above described momentum. While under SSP3 there is a parallel stagnation for all education groups, SSP4 shows an interesting polarization as is suggested in the storyline for that SSP: Both the group of completely uneducated people as well as the group with tertiary education are increasing in size while the middle categories become less frequent. While the overall mean years of schooling of these two different scenarios are quite similar the full education distributions are very different. This is another point in case for representing and analyzing the full distributions and not only the MYS as is done in many economic growth models.
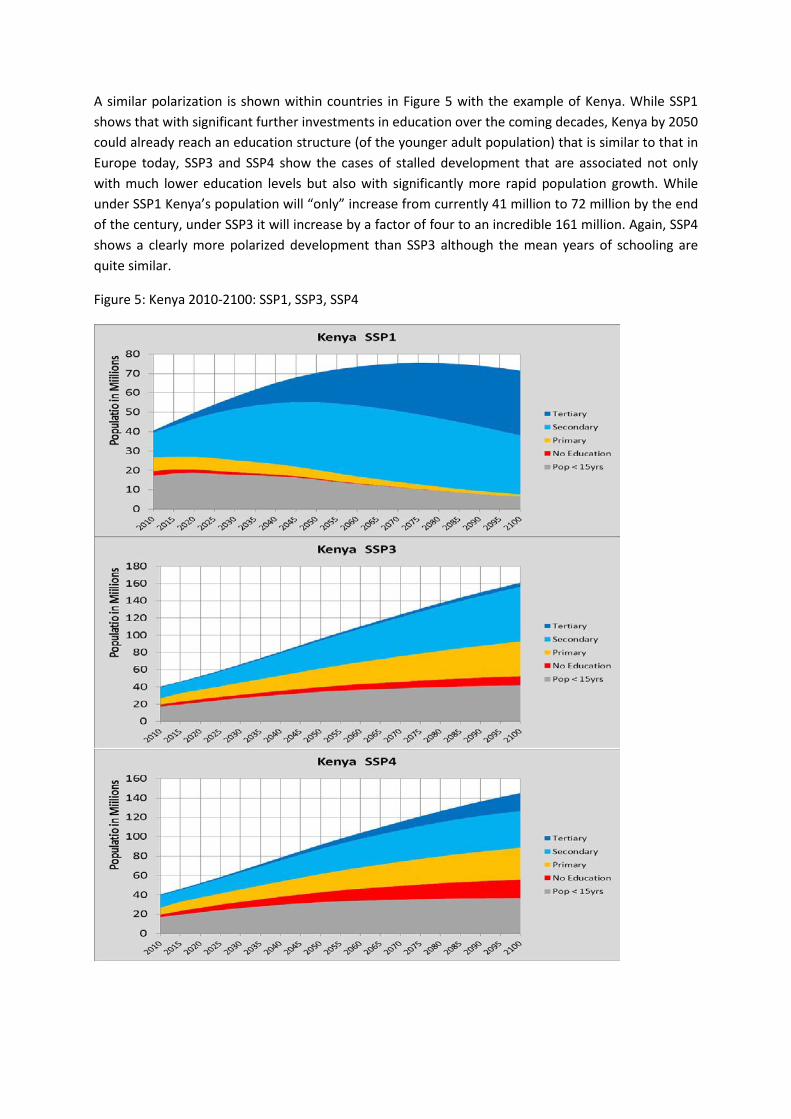
A similar polarization is shown within countries in Figure 5 with the example of Kenya. While SSP1 shows that with significant further investments in education over the coming decades, Kenya by 2050 could already reach an education structure (of the younger adult population) that is similar to that in Europe today, SSP3 and SSP4 show the cases of stalled development that are associated not only with much lower education levels but also with significantly more rapid population growth. While under SSP1 Kenya’s population will “only” increase from currently 41 million to 72 million by the end of the century, under SSP3 it will increase by a factor of four to an incredible 161 million. Again, SSP4 shows a clearly more polarized development than SSP3 although the mean years of schooling are quite similar.
Figure 5: Kenya 2010-2100: SSP1, SSP3, SSP4
Finally, several of the studies about the effects of education discussed in section 2 show that the educational attainment distribution of younger adult women (aged 20-39) is of specific critical importance. This is evidently the case with respect to fertility because it covers the prime childbearing ages. It has also been shown to be the key factor for health and mortality (in particular of children but also other household members) because women tend to make decisive household decisions. Hence, female education is also closely related to household choices with respect to energy consumption and adaption. Lutz et al. (2010) even showed that for quality of governance and democracy female education tends to be somewhat more relevant than male. Several of these studies show that indeed the distribution matters and not only the means. Table 3 gives these distributions at the level of major world regions. They illustrate for instance the significant differences between SSP2, 3 and 4 for 2100 in Africa where the proportion of women without any schooling is 0 percent, 33 percent and 41 percent respectively. As discussed above, this can have far reaching implications.
5. Conclusions
The above described new population scenarios by age, sex and level of educational attainment present a major step forward as compared to the earlier SRES scenarios that only considered total population size (Nakicenovic et al., 2000). From a social science perspective they provide a much richer picture of major social changes as described along the three key dimensions age, gender and level of education. These three dimensions as explicitly and quantitatively modeled and projected in the above described scenarios can also be directly related to many of the Millennium Development Goals and to the main components of the Human Development Index (HDI). Level of educational attainment by gender as well as health and mortality by age and for men and women separately (which form two of the three components of HDI) are explicitly included in the set of indicators that shape the above described human core of the SSPs. As a next step these alternative pathways of population and human capital will be translated into alternative trajectories of future economic growth in individual countries. This will help to project the third component of the HDI (in addition to the education and life expectancy components given here) and to derive several of the other technology and environment related dimensions of the SSPs.
References
Abbasi-Shavazi, M.J., Lutz, W., Hosseini-Chavoshi, M., KC, S., 2008. Education and the World’s most rapid Fertility Decline in Iran (Interim Report No. IR-08-010). International Institute for Applied Systems Analysis, Laxenburg, Austria.
Abel, G.J., 2013. Estimating global migration flow tables using place of birth data. Demographic Research, forthcoming.
Basten, S., Sobotka, T., 2013. Future Fertility in Low Fertility Countries, in: World Population and Human Capital in the 21st Century. Oxford University Press, forthcoming.
Biraben, J.-N., 2002. Évolution du nombre des hommes. INED. DHS Ethiopia, 2012. Ethiopia Demographic and Health Survey 2011. Central Statistical Agency, ICF
International, Addis Ababa, Calverton. Frankenberg, E., Sikoki, B., Sumantri, C., Suriastini, W., Duncan, T., 2013. Education, vulnerability, and
resilience after a natural disaster. Ecology and Society, forthcoming. Hajnal, J., 1955. The prospects for population forecasts. JASA 50, 309–322. Hayami, Y., Ruttan, V.W., 1971. Agricultural Development: An International Perspective. Johns
Hopkins University Press, Baltimore, MD. Helgeson, J., Dietz, S., Hochrainer, C., 2013. Vulnerability to weather disasters: the choice of coping
strategies in rural Uganda. Ecology and Society, forthcoming. KC, S., 2013. Community vulnerability to floods and landslides in Nepal. Ecology and Society 18. KC, S., Barakat, B., Goujon, A., Skirbekk, V., Sanderson, W.C., Lutz, W., 2010. Projection of populations
by level of educational attainment, age, and sex for 120 countries for 2005-2050. Demographic Research 22, 383–472.
KC, S., Lentzner, H., 2010. The effect of education on adult mortality and disability: A global perspective. Vienna Yearbook of Population Research 8, 201–235.
Lutz, W., 2009. Sola schola et sanitate: Human capital as the root cause and priority for international development? Phil. Trans. R. Soc. B 364, 3031–3047.
Lutz, W., Butz, W.P., KC, S. (Eds.), 2013. Oxford Handbook of World Population and Human Capital in the 21st Century. Oxford University Press, forthcoming.
Lutz, W., Crespo Cuaresma, J., Abbasi-Shavazi, M.J., 2010. Demography, education, and democracy: Global trends and the case of Iran. Population and Development Review 36, 253–281.
Lutz, W., Crespo Cuaresma, J., Sanderson, W.C., 2008a. The demography of educational attainment and economic growth. Science 319, 1047–1048.
Lutz, W., Goujon, A., KC, S., Sanderson, W.C., 2007. Reconstruction of populations by age, sex and level of educational attainment for 120 countries for 1970-2000, in: Vienna Yearbook of Population Research 2007. Verlag der Österreichischen Akademie der Wissenschaften, Vienna, Austria, pp. 193–235.
Lutz, W., KC, S., 2010. Dimensions of global population projections: what do we know about future population trends and structures? Phil. Trans. R. Soc. B 365, 2779–2791.
Lutz, W., KC, S., 2011. Global human capital: Integrating education and population. Science 333, 587–592.
Lutz, W., Sanderson, W., Scherbov, S., 1997. Doubling of world population unlikely. Nature 387, 803–805.
Lutz, W., Sanderson, W., Scherbov, S., 2001. The end of world population growth. Nature 412, 543–545.
Lutz, W., Sanderson, W., Scherbov, S., 2008b. The coming acceleration of global population ageing. Nature 451, 716–719.
Lutz, W., Scherbov, S., Makinwa-Adebusoye, P.K., Reniers, G., 2004. Population–environment–development–agriculture interactions in Africa: A case study on Ethiopia, in: Lutz, W., Sanderson, W.C., Scherbov, S. (Eds.), The End of World Population Growth in the 21st Century: New Challenges for Human Capital Formation and Sustainable Development. Earthscan, London. UK, pp. 187–225.
Nakicenovic, N., Alcamo, J., Grubler, A., Riahi, K., Roehrl, R.A., Rogner, H.-H., Victor, N., 2000. Special Report on Emissions Scenarios (SRES), A Special Report of Working Group III of the Intergovernmental Panel on Climate Change, IPCC Special Reports on Climate Change. Cambridge University Press, Cambridge, UK.
Notestein, F.W., 1945. Population: The long view, in: Schultz, T.W. (Ed.), Food for the World. University of Chicago Press, Chicago, IL, pp. 36–69.
Pamuk, E.R., Fuchs, R., Lutz, W., 2011. Comparing relative effects of education and economic resources on infant mortality in developing countries. Population and Development Review 37, 637–664.
Sharma, U., Patwardhan, A., Patt, A.G., 2013. Education as a determinant of response to cyclone warnings: Evidence from coastal zones in India. Ecology and Society, forthcoming.
Striessnig, E., Lutz, W., Patt, A.G., 2013. Effects of educational attainment on climate risk vulnerability. Ecology and Society, forthcoming.
United Nations, 2009. World Population Prospects: The 2008 Revision. United Nations Department of Economic and Social Affairs, Population Division, New York, NY.
United Nations, 2011. World Population Prospects: The 2010 Revision. United Nations Department of Economic and Social Affairs, Population Division, New York, NY.
Wamsler, C., Brink, E., Rantala, O., 2012. Climate change, adaptation, and formal education: The role of schooling for increasing societies adaptive capacities in El Salvador and Brazil. Ecology and Society 17.
Appendix
Table A.1: Country Groupings
High Fertility Countries (TFR > 2.9)
Low Fertility Countries(TFR <= 2.9) Rich OECD Others
Afghanistan, Angola, Belize, Benin, Bolivia (Plurinational State of), Burkina Faso, Burundi, Cameroon, Central African Republic, Chad, Comoros, Congo, Côte d'Ivoire, Democratic Republic of the Congo, Djibouti, Equatorial Guinea, Eritrea, Ethiopia, French Guiana, Gabon, Gambia, Ghana, Guatemala, Guinea, Guinea-Bissau, Haiti, Honduras, Iraq, Jordan, Kenya, Lao People's Democratic Republic, Lesotho, Liberia, Madagascar, Malawi, Mali, Mauritania, Mayotte, Micronesia (Fed. States of), Mozambique, Namibia, Nepal, Niger, Nigeria, Occupied Palestinian Territory, Pakistan, Papua New Guinea, Paraguay, Philippines, Rwanda, Samoa, Sao Tome and Principe, Saudi Arabia, Senegal, Sierra Leone, Solomon Islands, Somalia, Sudan, Swaziland, Syrian Arab Republic, Tajikistan, Timor-Leste, Togo, Tonga, Uganda, United Republic of Tanzania, Vanuatu, Yemen, Zambia, Zimbabwe
Australia, Austria, Belgium, Canada,
Czech Republic, Denmark, Estonia,
Finland,
France, Germany, Greece, Hungary, Iceland, Ireland, Israel, Italy, Japan, Luxembourg, Netherlands, New Zealand, Norway, Poland, Portugal, Slovenia, Spain, Sweden, Switzerland, United Kingdom, United States of America, Slovakia, Republic of Korea
Albania, Algeria, Argentina, Armenia, Aruba, Azerbaijan, Bahamas, Bahrain, Bangladesh, Barbados, Belarus, Bhutan, Bosnia and Herzegovina, Botswana, Brazil, Brunei Darussalam, Bulgaria, Cambodia, Cape Verde, Channel Islands, Chile, China, China, Hong Kong SAR, China, Macao SAR, Colombia, Costa Rica, Croatia, Cuba, Cyprus, Dem. People's Republic of Korea, Dominican Republic, Ecuador, Egypt, El Salvador, Fiji, French Polynesia, Georgia, Grenada, Guadeloupe, Guam, Guyana, India, Indonesia, Iran (Islamic Republic of), Jamaica, Kazakhstan, Kuwait, Kyrgyzstan, Latvia, Lebanon, Libyan Arab Jamahiriya, Lithuania, Malaysia, Maldives, Malta, Martinique, Mauritius, Mexico, Mongolia, Montenegro, Morocco, Myanmar, Netherlands Antilles, New Caledonia, Nicaragua, Oman, Panama, Peru, Puerto Rico, Qatar, Republic of Moldova, Réunion, Romania, Russian Federation, Saint Lucia, Saint Vincent and the Grenadines, Serbia, Singapore, South Africa, Sri Lanka, Suriname, TFYR Macedonia, Thailand, Trinidad and Tobago, Tunisia, Turkey, Turkmenistan, Ukraine, United Arab Emirates, United States Virgin Islands, Uruguay, Uzbekistan, Venezuela (Bolivarian Republic of), Viet Nam