Embed Size (px)
Citation preview
Jour
nal o
f Cel
l Sci
ence
RESEARCH ARTICLE
The human CFTR protein expressed in CHO cells activatesaquaporin-3 in a cAMP-dependent pathway: study by digitalholographic microscopy
Pascal Jourdain1,*, Frederic Becq2,*, Sylvain Lengacher1, Clement Boinot2, Pierre J. Magistretti1,3,4,* andPierre Marquet3
ABSTRACT
The transmembrane water movements during cellular processes
and their relationship to ionic channel activity remain largely
unknown. As an example, in epithelial cells it was proposed that
the movement of water could be directly linked to cystic fibrosis
transmembrane conductance regulator (CFTR) protein activity
through a cAMP-stimulated aqueous pore, or be dependent on
aquaporin. Here, we used digital holographic microscopy (DHM)
an interferometric technique to quantify in situ the transmembrane
water fluxes during the activity of the epithelial chloride channel,
CFTR, measured by patch-clamp and iodide efflux techniques. We
showed that the water transport measured by DHM is fully
inhibited by the selective CFTR blocker CFTRinh172 and is absent
in cells lacking CFTR. Of note, in cells expressing the mutated
version of CFTR (F508del-CFTR), which mimics the most
common genetic alteration encountered in cystic fibrosis, we
also show that the water movement is profoundly altered but
restored by pharmacological manipulation of F508del-CFTR-
defective trafficking. Importantly, whereas activation of this
endogenous water channel required a cAMP-dependent
stimulation of CFTR, activation of CFTR or F508del-CFTR by
two cAMP-independent CFTR activators, genistein and MPB91,
failed to trigger water movements. Finally, using a specific small-
interfering RNA against the endogenous aquaporin AQP3, the
water transport accompanying CFTR activity decreased. We
conclude that water fluxes accompanying CFTR activity are
linked to AQP3 but not to a cAMP-stimulated aqueous pore in
the CFTR protein.
KEY WORDS: Digital holographic microscopy, CFTR protein,
Aquaporin AQP3, Water transport, cAMP pathway, F508del-CFTR
INTRODUCTIONThe cystic fibrosis transmembrane conductance regulator (CFTR;
also known as ATP-binding cassette subfamily C, member 7;
ABCC7) protein is an apical membrane protein functioning as a
chloride channel regulating anion transport in secretory
epithelial cells. A dysfunction of this protein in cystic fibrosis
affects the transport of chloride, bicarbonate, sodium and water
in epithelial tissue, leading to thick and viscous secretions.
Although the features of chloride transport by CFTR protein are
well defined (review by Hanrahan et al., 1995), studies directly
addressing water transport in epithelial physiology and in human
pathologies (such as cystic fibrosis) are still at an early stage.
One of the reasons for this area still being under-explored is the
lack of reliable measurement techniques to directly quantify
the transmembrane water flux, at a cellular scale, during a
physiological (and pathological) situation. Among the
transmembrane conduction pathways, chloride channels are
generally poorly permeable to water molecules (Bormann
et al., 1987) but it was proposed that in epithelia the
movement of water could be directly linked to CFTR activity
through a cAMP-stimulated aqueous pore (Hasegawa et al.,
1992) or be dependent on water channels (Schreiber et al.,
1997), in particular the aquaporin AQP3 (Schreiber et al., 1999;
Schreiber et al., 2000).
Imaging techniques using the measurement of specific
fluorophore concentration such as confocal microscopy
(Crowe et al., 1995) or total internal reflection (TIR)
microfluorimetry (Farinas et al., 1995) allow estimation of
the variation of intracellular water content by sampling of
fluorescence. Other imaging techniques defined as
interferometry are also used to measure some biophysical
parameters in relation to membrane water permeability
(Farinas and Verkman, 1996; Farinas et al., 1997). However,
all of these imaging techniques (fluorescence or
interferometric) only detect large water movements in
response to osmotic shocks of several hundred milliosmol,
unrepresentative of fine water movements involved in many
biological processes forming part of the normal cellular
activity, such as transport of osmotically active substances,
cell metabolism and cell volume regulation.
Recently, we have developed a new imaging technique called
digital holographic microscopy (DHM), which can be used to
non-invasively visualise cell structure and dynamics and/or study
various biological processes without using dye or contrast agent
[for reviews of the subject (Depeursinge et al., 2007; Marquet
et al., 2013), and for some processes in relation to water transport
(Rappaz et al., 2005; Jourdain et al., 2011; Jourdain et al., 2012;
Boss et al., 2013)].
Here, we used the DHM quantitative phase signal to directly
study the activity of the CFTR protein and, for the first time to
analyse its impact on transmembrane water fluxes. Our data show
1Brain Mind Institute, Ecole Polytechnique Federale de Lausanne (EPFL), 1015Lausanne, Switzerland. 2Institut de Physiologie et Biologie Cellulaires, CNRS,Universite de Poitiers, 1 rue Georges Bonnet, 86022 Poitiers, France.3Department of Psychiatry DP-CHUV, Center for Psychiatric Neuroscience, 1008Prilly-Lausanne, Switzerland. 4King Abdullah University of Science andTechnology (KAUST), Thuwal, Kingdom of Saudi Arabia.
*Authors for correspondence ([email protected]; [email protected];[email protected])
Received 22 April 2013; Accepted 6 November 2013
� 2014. Published by The Company of Biologists Ltd | Journal of Cell Science (2014) 127, 546–556 doi:10.1242/jcs.133629
546

Jour
nal o
f Cel
l Sci
ence
that cAMP-dependent activation of the CFTR transport functionis required to trigger water flux through the cAMP-stimulated
aquaporin, AQP3, a mechanism of regulation that is inhibited inthe presence of the selective CFTR blocker CFTRinh172 and that isabsent in CFTR-deficient cells or in cells expressing the ER-sequestered mutant form, F508del, of CFTR. Restoring the
function of F508del-CFTR is also associated with a recovery ofwater transport. These observations are of particular relevance forour understanding of the molecular mechanisms controlling the
passage of water and ions in healthy and dehydrated airwaysurfaces and for the screening of compounds potentially able torestore water transport in cells affected by the human disease
cystic fibrosis.
RESULTSForskolin and 8Br-cAMP triggered a phase response in CHO cellsexpressing CFTR protein, which was associated to the activation ofthe CFTR proteinDHM quantitative phase signal (QPS), resulting from its high
sensitivity to the intracellular refractive index, directly measuresthe net transmembrane water fluxes accompanying the ionicmovement (Rappaz et al., 2005; Jourdain et al., 2012; Boss et al.,
2013). In CHO cells stably expressing CFTR protein (CHOcftr)that were treated with the adenylate cyclase activator forskolin(1 mM; 5 minutes), which stimulates CFTR channel activity
through an increase of cellular cAMP concentrations, there was atransient increase of the phase shift reflected by a peak amplitudeof 5.4860.5˚ (ncell5644; Fig. 1A; Table 1), whereas superfusion
of control solution (0.1–1% DMSO) had no effect on the signalphase (Fig. 1B). The effect of forskolin on the QPS wasconcentration dependent between 500 pM and 10 mM with anEC50 of 0.8560.08 mM (ncell5126; Fig. 1C). In parallel, we
performed iodide efflux experiments to monitor anionic transportactivity of the CFTR protein (Norez et al., 2004). Our results alsoshowed that increasing concentrations of forskolin stimulates the
iodide efflux response in CHOcftr cells with an EC50 of 1 mM(data not shown), a value similar to that obtained by DHM.
Such an increased QPS corresponds to an exit of water
accompanying the exit of an ion (Jourdain et al., 2012). Todetermine the nature of the involved ion, we recorded the membranecurrent in parallel. Application of forskolin (1 mM, 5 minutes)activated an inward current in CHOcftr cells (I520.2260.04 nA;
ncell525; Fig. 1D). Furthermore, analysis of the curve I/Vrelationship for the current activated by forskolin indicated areversal potential of 227.462.3 mV (Fig. 1D), a value similar to
the theoretical reversal potential of Cl2 (around 230 mV) calculatedfrom the Nernst equation. Thus, this first set of experiments identifiedan optical phase response resulting from an activation of a cAMP-
dependent Cl2 conductance mediated by forskolin.To further characterize the Cl2 conductance activated by
forskolin, we applied various Cl2 channel inhibitors. First we
tested 4,49-diisothiocyanato-stilbene-2,29-disulfonic acid (DIDS;100 mM), a broad-spectrum anion transport blocker, whichinhibits chloride conductances, except for those mediated byCFTR. Our data show that there was no significant difference
between the optical response triggered by forskolin alone and thatin the presence of DIDS (+28%; P.0.05; ncell5112; Fig. 1E). Incontrast, in the presence of 10 mM CFTRinh172, a selective CFTR
blocker (Ma et al., 2002), the optical response evoked byforskolin was dramatically reduced (280%; P,0.05; ncell5252;Fig. 1E; Table 1). Application of 8Br-cAMP (1 mM), a
membrane permeant and non-degradable analogue of cAMP, to
CHOcftr cells triggered a strong increase in the QPS, whichreached a plateau value of ,18.5563.29˚ (ncell5252; Fig. 2A;
Table 1). In parallel, iodide efflux experiments showed thatincreasing concentrations of 8Br-cAMP (100 mM–3 mM)stimulated the efflux response in CHOcftr cells (Fig. 2B)clearly confirming the cAMP dependence of the QPS
observed in CHOcftr cells. The blockade of QPS (Fig. 2A;Table 1) or iodide efflux (not shown) by CFTRinh172 was alsofound when we stimulated CHOcftr cells with 8Br-cAMP.
Finally, in mock-transfected CHO cells, which contained theempty pNUT vector (CHOpNUT), we observed a residual QPSwhen we applied forskolin (1.8560.13 ; ncell5448; Fig. 1B). Its
amplitude was significantly weaker than in CHOcftr cells(P.0.005; Fig. 1B) and not modified by CFTRinh172
(Table 1), suggesting a non-CFTR origin for this residual
optical response. These findings were also confirmed byexperiments with 8Br-cAMP on CHOpNUT cells (Fig. 2C;Table 1). In conclusion, the optical response observed inCHOcftr cells after application of forskolin or 8Br-cAMP is
mainly due to activation of CFTR protein.
Optical response associated with CFTR activity corresponds toactivation of water channelsTo determine whether the optical signals recorded by DHM andassociated with the activation of CFTR in CHOcftr cells could
involve a water channel, we applied mercuric chloride (HgCl2) asa broad-spectrum blocker of aquaporins (Savage and Stroud,2007). We added 5 mM HgCl2 to the extracellular medium and
measured the optical response after the application of forskolin(1 mM, 5 minutes). The response was significantly lower thanthat of CHOcftr cells (1.8660.77 ; ncell5126; P,0.005; Fig. 3A)stressing the involvement of a water channel in the genesis of the
forskolin-associated optical signal.However, it has been previously shown that mercury affects
mitochondrial metabolism inducing an ATP depletion (Chen et al.,
2010), finally leading to the reduction in cAMP production byadenylate cyclase. In these conditions, we can hypothesize that thedecrease in the optical signal (reflecting a decrease of CFTR
activity) in the presence of mercury is not directly linked to ablockade of aquaporin but associated with a decrease in cAMPproduction. The above experiments involving 8Br-cAMPtreatment suggested that the effect of HgCl2 on CFTR activity
is independent of the cAMP production. Indeed when we treatedCHOcftr cells with HgCl2 (5 mM), the optical response recordedduring 8Br-cAMP application (1 mM) was also strongly and
significantly decreased when compared to the untreated CHOcftr
cells (5.061.6 ; ncell5126; P,0.005; Fig. 3B; Table 1)confirming the involvement of water channels in the genesis
of the optical signal and of the interrelationship between CFTRand water channels.
Finally, to be sure that the cAMP-dependent Cl2 conductance
was not modified by HgCl2, we performed a first set ofexperiments using the patch clamp technique. Our resultsindicated that current density in CHOcftr cells at 260 mV wasaround (3567 pA/pF; n56) when we applied forskolin (10 mM)
to the medium, a value significantly higher than in the basalcondition (762 pA/pF; P,0.005; n56; Fig. 4). In the presenceof HgCl2 (5 mM), this current density was slightly decreased but
significantly persistent in comparison with the control condition(2363 pA/pF; P,0.05; n56) and further blocked by CFTRinh172
(10 mM, n56; Fig. 4), suggesting that HgCl2 decreased the water
transport and not the Cl2 flux. This result is in agreement with the
RESEARCH ARTICLE Journal of Cell Science (2014) 127, 546–556 doi:10.1242/jcs.133629
547

Jour
nal o
f Cel
l Sci
ence
study of Weber et al. in which it was shown that the human CFTRprotein was weakly sensitive to mercury (Weber et al., 2006).
Stimulation of water transport is dependent on cAMP-activated CFTRchannel activityWe then focussed on the involvement of cAMP in the interactionbetween CFTR protein and the water channel. To understandwhether the activation of CFTR by cAMP is crucial for waterchannel activation, we used genistein, a direct activator of CFTR
protein with a cAMP-independent mechanism of action (Illeket al., 1995). Treatment of CHOcftr cells with genistein (30 mM;
5 minutes) triggered an inward current (20.1360.04 nA;ncell513; Fig. 5A), indicating activation of CFTR channels.
However, genistein was unable to modify the QPS of CHOcftr
cells (0.260.5 ; ncell5204; Fig. 5A), highlighting the importantrole of cAMP in the activation of the water channel. To confirm the
key role of cAMP in the interaction between CFTR protein andwater channels, we also used MPB-91, a benzo[c]quinoliziniumcompound activating the chloride channel activity of CFTRthrough a cAMP-independent mechanism (Becq et al., 1999;
Marivingt-Mounir et al., 2004). Similarly to genistein, a transientapplication of MPB-91 (50–100 mM; 5 minutes) was unable to
Fig. 1. Phase shift is associated with activation of CFTR channels expressed in CHOcftr cells. (A1) representative phase image of CHOcftr cells recordedby DHM. Ovals in the middle of the cells indicate the region of interest (ROI) where the phase signal was recorded. Scale bar: 5 mm. (A2) Application offorskolin (1 mM, 5 minutes; indicated by the bar) triggers a strong increase of the phase signal in all CHOcftr cells. (B1) Application of forskolin (1 mM, 5 minutes;indicated by the bar) triggers a transient increase of the phase signal (solid line; ncell5242). Control solution (DMSO 0.1%, 5 minutes; bar) is ineffective(dotted line). (B2) The bar chart shows the significant difference between different populations of CHO cells (*P,0.05, ***P,0.005, unpaired t-test) afterapplication of forskolin (1 mM, 5 minutes). Effects of forskolin are significantly higher for CHOcftr (ncell5644) and CHOF508del cells treated with miglustat(CHOF508del + Miglustat; ncell5462) than for CHOpNUT (ncell5448) and CHOF508del (ncell5784) cells. These data are also shown in Table 1. (C1) Example oftraces of phase shift obtained after the successive application of forskolin (from 500 pM to 10 mM, 5 minutes; bar) to the same CHOcftr cells. (C2) With theincrease in forskolin concentration, the phase shift increased until it reached a plateau (126 cells). The curve shown was the best fit of the data to thelogistic equation described in the Materials and Methods section. Fitting the data to the logistic equation yielded an EC50 of 0.85 mM. (D1) Phase image ofa patched CHOcftr cell recorded by DHM. Scale bar: 5 mm. (Middle): (D2) Application of forskolin (1 mM, 5 minutes) triggered an inward current concomitant to anincrease in the phase signal. (D3) The I/V curve obtained with forskolin (ncell55) indicated a reversal potential close to 230 mV, according to the followingequation: y50.0061x+0.1726 (R250.9611). (E) Example of optical trace showing the effect of forskolin (1 mM, 5 minutes, bars) in control condition (blackline) and with DIDS (100 mM, grey line; E1) and CFTRinh172 (10 mM, grey line; E2). (E3) Bar chart showing that DIDS is ineffective (P.0.05 vs forskolin, paired t-test; ncell5112) and CFTRinh172 (ncell5252) blocked significantly the optical response triggered by forskolin (*P,0.05, paired t-test).
RESEARCH ARTICLE Journal of Cell Science (2014) 127, 546–556 doi:10.1242/jcs.133629
548

Jour
nal o
f Cel
l Sci
ence
induce a phase response in CHOcftr cells (0.0860.4 ; ncell5126)
compared with that to forskolin (1 mM; 5 minutes; Fig. 5B).Therefore, activation of water channels cannot be solely triggeredby opening the CFTR pores but requires cAMP-dependent
activation of the CFTR channel.We next determined whether the activated state of CFTR protein
is required to maintain the activation of the water channel. The factthat a transient application of forskolin (1 mM; 5 minutes) triggered
a transient increase in the QPS and not a sustained plateau response,
as shown in Fig. 1, is in favour of a dependence on the CFTRactivity. Nevertheless, to clarify this, we applied CFTRinh172 toCHOcftr cells pre-stimulated with 8Br-cAMP (1 mM). We reasoned
that if such delayed application of CFTRinh172 has no effect on theoptical response amplitude, the activity of water channels would beindependent of CFTR. However, our data show that activity ofwater channels requires a constant activation of CFTR protein
Fig. 2. 8Br-cAMP mimicked the effect of forskolin on different CHO cell populations. (A1) Another representative phase image of CHOcftr cells recorded byDHM with ROIs in the middle of the cells. Scale bar: 5 mm. (A2) Application of 8Br-cAMP (1 mM, bar) triggers a sustained increase of the phase signal in allCHOcftr cells. (A3) Bar chart showing the averaged phase shift response after application of 8Br-cAMP alone (ncell5252) or in presence of CFTRinh172
(ncell5130). Note that CFTRinh172 blocks significantly the optical response triggered by 8Br-cAMP (**P,0.05, unpaired t-test). (B) Activation of CFTR-mediated 125I efflux by forskolin (10 mM) and increasing concentrations of 8Br-cAMP (from 0 to 3 mM). Rate of iodide efflux are plotted as a function of time.(C) Bar chart showing the significant differences between different populations of CHO cells (***P,0.005, unpaired t-test) after application of 8Br-cAMP(1 mM). As with forskolin, effects of 8Br-cAMP are significantly higher for CHOcftr (ncell5252) and CHOF508del + Miglustat (ncell5154) than for CHOpNUT
(ncell5140) and CHOF508del (ncell5140).
Table 1. Summary of phase shift amplitude obtained from different populations of CHO cell lines after treatments
Treatment CHOpNUT CHOcftr CHOF508del CHOF508del + Miglust.
Forsk. 1.8560.13˚ (n5448) 5.4860.5˚ (n5664) 2.3160.54˚ (n5784) 4.560.15˚ (n5462)Forsk. + CFTRinh172 1.8860.23˚ (n5140; P50.97) 1.2160.81˚ (n5252; P50.000) 1.8160.72˚ (n5126; P50.42) 0.5160.46˚ (n570; P50.002)Forsk. + HgCl2 1.8660.77˚ (n5126; P50.000) 1.7860.96˚ (n5154; P50.52) 1.496 0.17˚ (n5112; P50.001)
8Br-cAMP 5.4360.93˚ (n5140) 18.5563.29˚ (n5252) 5.6260.38˚ (n5154) 14.1563.62˚ (n5154)8Br-cAMP + CFTRinh172 3.8661.23˚ (n5126; P50.27) 6.6761.66˚ (n5130; P50.009) 4.9260.44˚ (n5140; P50.70) 4.0760.33˚ (n5126; P50.001)8Br-cAMP + HgCl2 5.061.61˚ (n5126; P50.002) 6.3460.35˚ (n5154; P50.70) 3.2160.17˚ (n5140; P50.001)
Treatments were transient application of forskolin (Forsk., 1 mM, 5 minutes) and continuous application 8Br-cAMP (1 mM) with (or without) CFTRinh172 orHgCl2. Values are means6s.e.m. Statistical data are from an unpaired Student’s t-test between control (forskolin or 8br-cAMP alone) and test situations(CFTRinh172 or HgCl2 with forskolin or 8Br-cAMP).
RESEARCH ARTICLE Journal of Cell Science (2014) 127, 546–556 doi:10.1242/jcs.133629
549

Jour
nal o
f Cel
l Sci
ence
because delayed application of CFTRinh172 (10 mM; delay 3 or5 minutes) also stopped the optical signal normally obtained by anapplication of 8Br-cAMP (1 mM; Fig. 5C).
Water transport is associated with an aquaporin, AQP3The above data with genistein and MBP-91 indicated that Cl2
and water molecules are transported by two distinct channels.
Thus, we could have two distinct situations: either a functionalcoupling between the CFTR protein and an endogenousaquaporin, or a cAMP-stimulated aqueous pore within the
CFTR protein. Quantitative information concerning theexpression of endogenous proteins by CHO cells is scarce(Wlaschin and Hu, 2007). However, we have focussed our study
on two aquaporins, AQP3 and AQP9, because it has been shownthey are both cAMP-dependent ‘aquaglycoporins’, indirectly andpositively activated by the CFTR protein (Schreiber et al., 1999;Pietrement et al., 2008).
We quantified by qPCR analysis the mRNA copy numbers forthe endogenous aquaporins (AQP3 and AQP9) simultaneouslywith the human form of the CFTR gene in CHOcftr and
CHOpNUT cells. As expected, only CHOcftr cells expressed themRNA for the human form of CFTR (1.5660.046108 copies;Fig. 6A). For CHOpNUT cells, we did not detect CFTR mRNA(Fig. 6A), which is correlated to the fact that CHOpNUT cells
contained only the empty pNUT vector. Concerning the waterchannels, CHOcftr and CHOpNUT cells were found to expressmore than 66105 copies per ng of mRNA for AQP3
(respectively 6.9560.96105 versus 6.2060.196105; P.0.05;Fig. 6A), which is not significantly different in terms of mRNAexpression (Fig. 6A). The mRNA copy number for AQP9 was
below the level required for selection (,5000 copies per ng ofmRNA; Fig. 6A), indicating than these cells are not expressingAQP9 significantly. For this reason, the rest of our study was
focussed only on AQP3 expression.To determine a putative functional relationship with the CFTR
protein, we measured and compared the amplitude of the opticalresponse triggered by a transient application of forskolin (1 mM;
5 minutes) from four categories of CHOcftr cells cultures: (1)untreated; (2) transfected with a specific siRNA against AQP3(active siRNA); (3) transfected with scramble siRNA (inactive
Fig. 3. Optical responses associated with CFTR activity are sensitive to mercury. (A1) Characteristic optical traces triggered by forskolin (1 mM,5 minutes, arrowhead) in control condition (black line) and with HgCl2 (5 mM, dotted line) recorded from CHOcftr (left), CHOF508del (middle) and CHOF508del +Miglustat (right) cells. (A2) Bar chart showing that HgCl2 blocks significantly the optical responses triggered by forskolin on CHOcftr (***P,0.005, unpairedt-test) and CHOF508del + Miglustat (***P,0.005, unpaired t-test) but is ineffective on the residual optical response displayed by CHOF508del (P.0.05 unpairedt-test) cells. (B1) Example of optical trace triggered by 8Br-cAMP (1 mM; continuous application, arrowhead) in control condition (black line) and with HgCl2(5 mM, dotted line) obtained from CHOcftr (left), untreated CHOF508del (middle) and CHOF508del + Miglustat (right) cells. (B2) Bar chart showing that HgCl2blocks significantly the optical responses triggered by 8Br-cAMP on CHOcftr (***P,0.005, unpaired t-test) and CHOF508del + Miglustat (***P,0.005, unpairedt-test) but is ineffective on the residual optical response displayed by CHOF508del (P.0.05 unpaired t-test). Numbers in brackets correspond to ncell foreach sample.
RESEARCH ARTICLE Journal of Cell Science (2014) 127, 546–556 doi:10.1242/jcs.133629
550

Jour
nal o
f Cel
l Sci
ence
siRNA); (4) treated with Lipofectamine (vehicle control). Inuntreated CHOcftr cells, application of forskolin (1 mM; 5 minutes)triggered a strong optical response (7.0860.67 ; ncell5128). With a
similar application of forskolin, CHOcftr cells transfected with siRNAagainst AQP3 displayed an optical response (4.6860.47 ; ncell5174)significantly lower than for normal CHOcftr cells (P,0.006; Fig. 6B).
In parallel, the quantification of AQP3 mRNA from the same cultureindicated a significant decrease of mRNA copy number per ng ofmRNA for AQP3 between untreated CHOcftr cells (6.9560.096105
copies; ncult515) and CHOcftr cells treated with siRNA against AQP3(1.5160.76105 copies; ncult511; P,0.005).
This reduction in AQP3 copy number expression (1.5160.76105 copies; ncult511) needs also to be compared with cells
treated using same conditions, namely, with scramblesiRNA (3.9261.966105 copies; ncult58; P,0.001) or with
Lipofectamine alone (4.5760.986105 copies; ncult57; P,0.001).In addition, CHOcftr cells treated with scramble siRNA or withLipofectamine alone were not significantly different from
untreated CHOcftr cells for both the optical response (Fig. 6B1)(scramble mRNA: 6.1860.25 ; ncell5130; P.0.05. Lipofect:6.2260.50 ; ncell5141; P.0.05) (Fig. 6B) and the quantity of
mRNA for AQP3 (scramble siRNA: 3.9261.966105; ncult58;P.0.05. Lipofect: 4.5760.986105; ncult57; P.0.05; Fig. 6B2).
All of these results identify that a part of movement of water
associated with activation of CFTR protein is linked to thepresence of AQP3.
Abnormal optical signal recorded in F508del-CFTR expressing cellsAmong the numerous mutated forms of the CFTR protein, themost common one is the deletion of phenylalanine at position 508
Fig. 4. The Cl2 conductance of CFTR protein is weakly sensitive to mercury. (A) Whole-cell recording of membrane currents from the same CHOcftr cellin (A1) basal condition, (A2) with forskolin (10 mM), (A3) with forskolin (10 mM) + HgCl2 (5 mM) and (A4) forskolin (10 mM) + HgCl2 (5 mM) + CFTRinh172 (10 mM).(B) The current density/voltage relationships corresponding to each set of experiments described in A (ncell56). (C) Bar chart showing the efficiency offorskolin (10 mM) to increase the current density (P.0.005 vs basal condition, paired t-test; ncell56). This effect persisted significantly even in presence of HgCl2(5 mM; P.0.05 vs basal condition, paired t-test). Finally, CFTRinh172 (10 mM) blocked significantly the optical response triggered by forskolin + HgCl2.
RESEARCH ARTICLE Journal of Cell Science (2014) 127, 546–556 doi:10.1242/jcs.133629
551

Jour
nal o
f Cel
l Sci
ence
(F508del). According to the literature, this deletion results in a
processing defect leading to ER sequestration of the F508del-CFTR protein at the origin of the observed epithelial Cl–
impermeability measured in CF cells (Cheng et al., 1990). Applicationof forskolin (1 mM; 5 minutes) to CHO cells expressing this mutated
form of CFTR protein (CHOF508del), triggered a QPS with anamplitude (2.3160.54 ; P,0.005; ncell5784; Fig. 1B; Table 1)significantly lower than that measured in CHOcftr cells using the
same experimental protocol. This difference was even morepronounced with 8Br-cAMP (Fig. 2C). The peak amplitude of theoptical signal was 5.6260.38˚ (ncell5154; Fig. 2C; Table 1), a 70%
decrease compared with optical signals measured for CHOcftr cells(P,0.005; Fig. 2C). In the presence of CFTRinh172 in the bath
medium, the amplitude of the optical response in CHOF508del cells was
not significantly altered following either forskolin (1.8160.72;ncell5126; P50.42; Table 1) or 8Br-cAMP (4.9260.44; ncell5140;P50.70; Table 1) application indicating that the residual opticalresponses recorded in CHOF508del cells are not associated with CFTR
activity. Furthermore, the fact that there were no significantdifferences between the optical responses measured in CHOF508del
and CHOpNUT cells after application of forskolin (Fig. 1B) or 8Br-
cAMP (Fig. 2C) confirmed that the optical responses developed byCHOF508del cells are not due to CFTR. Finally, HgCl2 (5 mM) did notmodify the residual phase shift recorded from CHOF508del cells
(Fig. 3; Table 1) indicating that water channels are also notresponsible for the genesis of this residual optical response.
Fig. 5. Optical responses associated with CFTR activity are linked to active CFTR protein and cAMP stimulation. (A1) Application of genistein (30 mM,5 minutes, bar) triggered an inward current but no detectable optical signal. (A2) The top bar chart shows this significant absence of optical response withgenistein (white bar; ***P,0.005; ncell5204) in comparison with forskolin application (black bar; ncell5644). In contrast, the bar chart below indicates that there isno difference in terms of current amplitude between forskolin (ncell525) and genistein (ncell513) treatment. (B1) Representative optical traces obtained aftersuccessive application of forskolin (1 mM, thick line) and MPB-91 (100 mM, thin line) for 5 minutes (bar) to the same CHOcftr cell. (B2) Bar chart showingthat MPB-91 is ineffective at triggering an optical signal (***P.0.005 vs forskolin, paired t-test; ncell5126). (C1) Three representative optical traces obtainedafter application of 8Br-cAMP alone (1 mM, left), and the addition of CFTRinh172 to the bath medium after a 5-minute (middle) or 3-minute (right) delay. (C2)Bar chart showing that application of CFTRinh172 is effective in significantly blocking the 8Br-cAMP-dependent optical response after a delay of 5 minutes(**P,0.01 vs 8Br-cAMP alone, unpaired t-test; ncell5112) or 3 minutes (** P,0.005 vs 8Br-cAMP alone, unpaired t-test; ncell5126). The phase shift responseobtained with 8Br-cAMP alone (CFTRinh172 Free) was used as the control.
RESEARCH ARTICLE Journal of Cell Science (2014) 127, 546–556 doi:10.1242/jcs.133629
552

Jour
nal o
f Cel
l Sci
ence
Miglustat restores an optical signal from F508del-CFTR-expressing cellsThe results above suggested that water movement is abnormal inCHOF508del cells. Because it is known that several transportproperties of CF cells are also affected, including calcium
(Antigny et al., 2009), sodium (Sheridan et al., 2005) andbicarbonate (Choi et al., 2001) transport, we further studied theeffect on water movement of correcting the abnormal trafficking
of F508del-CFTR. We used the corrector miglustat, known torestore a functional cAMP-dependent F508del-CFTR activity(Norez et al., 2006; Norez et al., 2009). After treatment ofCHOF508del cells with miglustat (100 mM; 4–6 hours), application
of forskolin (1 mM, 5 minutes) triggered an increase of phaseshift (4.560.58 ; ncell5462) significantly higher than foruntreated CHOF508del cells (P,0.05; Fig. 1B). Comparable
results were obtained when we substituted 8Br-cAMP (1 mM)for forskolin, with a peak of maximum amplitude reaching
14.1563.62˚ (ncell5154), a value again significantly higher thanthat obtained for untreated CHOF508del cells (P,0.005; Fig. 2C;Table 1). This rescue of optical response is dependent on CFTRactivity, because the optical responses stimulated by either
forskolin or 8Br-cAMP were both fully blocked by the selectiveCFTR inhibitor CFTRinh172 (Table 1). Finally, after perfusingmiglustat-treated CHOF508del cells with an extracellular medium
containing HgCl2 (5 mM), the optical responses normallyobtained after stimulation with forskolin or 8Br-cAMP werealso strongly decreased (Fig. 3; Table 1).
DISCUSSIONResults reported here indicate that the QPS from CHOcftr cells
stimulated with the cAMP-agonists forskolin and 8Br-cAMP arelinked to CFTR activity, highlighting a functional couplingbetween the CFTR protein and the water channel. Evidence forthis functional coupling is supported by results obtained in
CHOF508del cells, because the absence of operative CFTR proteinat the plasma membrane (due to the deletion F508del) did nottrigger optical responses sensitive to mercury whereas the
reinsertion of CFTR proteins into the plasma membrane aftertreatment with miglustat (Norez et al., 2006; Norez et al., 2009)restored this mercury sensitivity. Otherwise, the coupling
mechanism between CFTR protein and a water channel iscAMP-dependent but not functional when CFTR is activated bycAMP-independent agonists (genistein, MPB-91) or inhibited by
the selective CFTR blocker CFTRinh172. Importantly, the rescueof F508del-CFTR activity by the pharmacological correctormiglustat leads to the re-establishment of the CFTRinh172-sensitive cAMP-dependent functional coupling between CFTR
and the water channel. In conclusion, we propose that a functionalCFTR protein activated through a cAMP-dependent pathway isrequired for water molecules to pass out of the cell.
Another central question of this paper is whether this waterchannel is an integral part of the CFTR protein as suggested bythe study of Hasegawa et al. (Hasegawa et al., 1992) or a separate
entity of the CFTR protein, similar to an endogenous aquaporin(Schreiber et al., 1999; Schreiber et al., 2000) expressed by CHOcells, but that would be functionally related to the human form ofthe CFTR protein. Indeed, the hypothesis of a cAMP-dependent
pore for water as an integral part of the CFTR protein mayexplain the water efflux during activation of CFTR protein. Thisis the main conclusion of the work by Hasegawa et al. performed
on Xenopus oocytes that expressed the human form of the CFTRprotein (Hasegawa et al., 1992). However, another study, alsoperformed on Xenopus oocytes expressing the human form of the
CFTR protein, has shown that both Cl– conductance and waterchannels were inhibited through different pathways (Schreiberet al., 1997). The authors, in contrast to the conclusion of
Hasegawa et al. concluded that the two fluxes, water and Cl–, areassociated with two different proteins, respectively, anendogenous aquaporin and the CFTR protein (Hasegawa et al.,1992). Even though several reports have shown that wild-type
CHO cells express few or no endogenous aquaporins (Farinaset al., 1997; Schreiber et al., 1999), our results are clearly infavour of the second hypothesis because the experiment using
siRNA against the endogenous AQP3 led to a significant decreasein both the forskolin-induced phase signal and the quantity ofAQP3 mRNA. At the same time, the scrambled siRNA (or
Lipofectamine treatment) was inefficient at decreasing both the
Fig. 6. Optical responses associated with CFTR activity are coupled toendogenousAQP3. (A) The bar chart represents themeasurement ofmRNA (byqPCR) for AQP3, AQP9 and CFTR genes in CHOcftr or CHONUT cells. Note theabsence of CFTR mRNA in CHOpNUT cells. Both CHOcftr and CHONUT cellsexpressedAQP9below the level required for quantification (dashed line). (B1) Barchart showing the optical response to forskolin application of CHOcftr cellsuntreated or treated with an siRNA against AQP3 or with a scrambled siRNA ascontrol, or treated with Lipofectamine as vehicle control. The optical responseinduced by forskolin (1 mM, 5 minutes) decreases significantly (***P,0.005,unpaired t-test) by comparison with all the other conditions. (B2) Bar chartshowing the AQP3 mRNA copy number in CHOcftr cells treated as in B1.Numbers in brackets are the number of cells in each sample. As for opticalmeasurements, the AQP3 mRNA copy number decreased significantly only inCHOcftr cells treated with a siRNA against AQP3 (***P,0.005, unpaired t-test).Numbers in brackets are the number of wells in each sample.
RESEARCH ARTICLE Journal of Cell Science (2014) 127, 546–556 doi:10.1242/jcs.133629
553
Jour
nal o
f Cel
l Sci
ence
optical signal induced by forskolin and the quantity of AQP3
mRNA. Thus, we can conclude that the Cl2 and water fluxesassociated with CFTR activity involve two distinct proteins, theCFTR protein (for Cl2 transport) and AQP3 (for water transport).However, the nature of this interaction remains to be determined.
Although a direct physical interaction between CFTR protein andthe epithelial sodium channel has been shown (Berdiev et al.,2007), such interaction between CFTR protein and AQP3 has,
however, not yet been demonstrated.An important point also concerns the pharmacological corrector
miglustat and its mechanism of action. We have seen that the mRNA
copy number for both CFTR and AQP3 in CHOF508del cells wassignificantly lower compared with the levels in CHOcftr cells (notshown) indicating that the machinery for Cl2 and water transport wasless abundant in CHOF508del than in CHOcftr cells. This is consistent
with the fact that forskolin and 8Br-cAMP triggered a phase responsesignificantly lower than that of CHOcftr cells. Although the treatmentof CHOF508del cells with miglustat (100 mM; 4–6 hours) did not
modify the mRNA copy number for both CFTR and AQP3 (notshown), forskolin (and 8Br-cAMP) did significantly restore an opticalresponse, both indicating that the action of miglustat did not involve
synthesis of new proteins but rather mobilized proteins most probablyresiding in the endoplasmic reticulum.
In conclusion, taking advantage of the DHM technique to
monitor net flux of water during CFTR activity coupled to ionflux and electrophysiological experiments, we explored thehypothesis that CFTR and water transport could be coupled.Here, we provided evidence for the existence of a direct
functional coupling between the epithelial chloride channelCFTR, an endogenous HgCl-sensitive water channel and/or theaquaporin AQP3. These results open the field for new types of
pharmacological investigation (notably the screening of drugsacting on water transporter molecules) and therapeutic approachsuch as rehydration of airway surface of F508del-CFTR-
expressing cells.
MATERIALS AND METHODSEthics statementThis study was carried out in compliance with the Public Health Service
(PHS) Policy on Human Care and Use of Laboratory Animals (Animal
Welfare Assurance no. A5692-01). Experimental procedures were
approved by the Cantonal Veterinary Authorities (Vaud, Switzerland).
Cell cultureCHO cells stably transfected containing wild-type CFTR (CHOcftr),
cultured at 37 C in 5% CO2 were maintained in MEM containing 7%
foetal bovine serum, 0.5% antibiotics (50 IU/ml penicillin and 50 mg/ml
streptomycin) and 150 mM, 100 mM or 20 mM methotrexate respectively
for CHOF508del, CHOcftr and CHOpNUT cells. For detailed procedures see
elsewhere (Bulteau et al., 2000; Derand et al., 2001).
For optical and electrical recordings, all cell cultures were perfused in
a fluid containing (in mM): NaCl 150, KCl 3, D-glucose 5, HEPES 10,
CaCl2 3, and MgCl2 2 (pH 7.4; room temperature). All drugs were
dissolved and applied by bath perfusion (for 5 minutes) after a minimum
of 2 minutes of stable baseline recording of the optical signal.
Quantitative phase imagingDHM is an interferometric imaging technique that can measure the wave
front phase retardation of a transmitted wave induced by a transparent
specimen including living cells in culture. Practically, this QPS depends
mainly on two parameters, the intracellular refractive index (RI) and the
thickness of the observed specimen according to equation:
~2p
l(�nc{nm)h, ð1Þ
where l is the wavelength of the light source, h the cell thickness, nc the
mean intracellular refractive index (along the path length corresponding
to the thickness h), and nm is the RI of the perfusion solution. As far as
living cells are concerned, phase shifts are highly sensitive to variation
of intracellular RI. Consequently, transmembrane water movements,
modifying the intracellular RI through a dilution or concentration
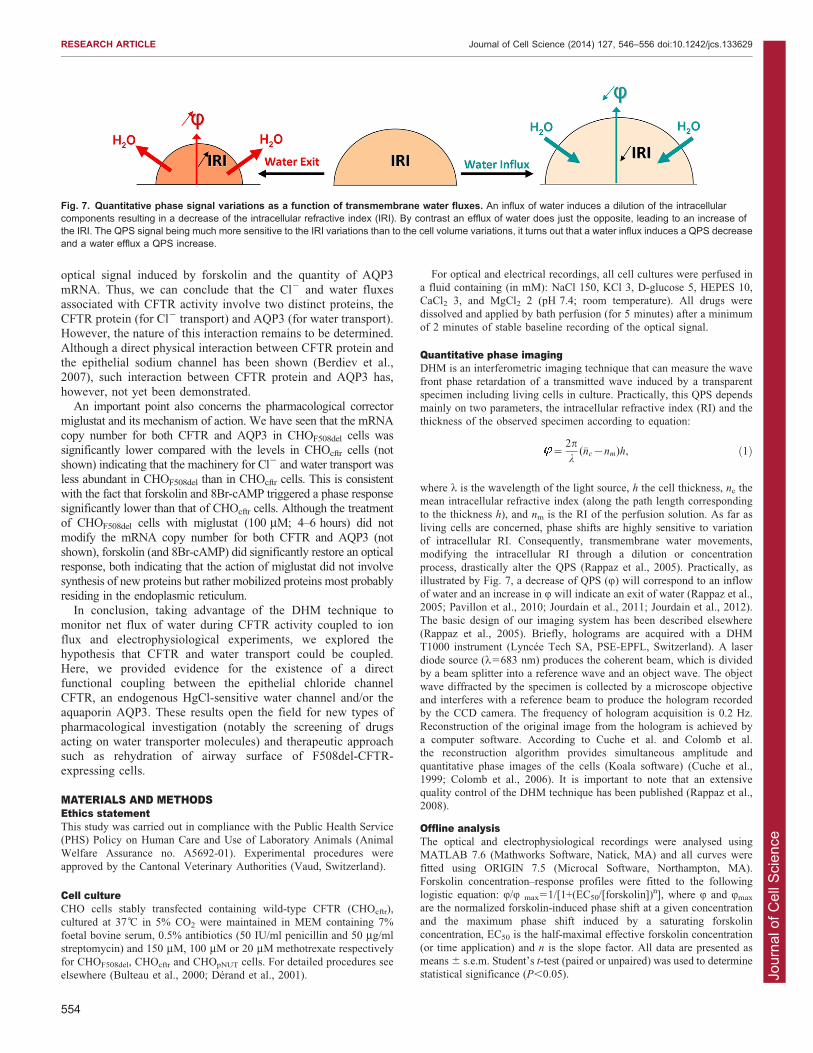
process, drastically alter the QPS (Rappaz et al., 2005). Practically, as
illustrated by Fig. 7, a decrease of QPS (Q) will correspond to an inflow
of water and an increase in Q will indicate an exit of water (Rappaz et al.,
2005; Pavillon et al., 2010; Jourdain et al., 2011; Jourdain et al., 2012).
The basic design of our imaging system has been described elsewhere
(Rappaz et al., 2005). Briefly, holograms are acquired with a DHM
T1000 instrument (Lyncee Tech SA, PSE-EPFL, Switzerland). A laser
diode source (l5683 nm) produces the coherent beam, which is divided
by a beam splitter into a reference wave and an object wave. The object
wave diffracted by the specimen is collected by a microscope objective
and interferes with a reference beam to produce the hologram recorded
by the CCD camera. The frequency of hologram acquisition is 0.2 Hz.
Reconstruction of the original image from the hologram is achieved by
a computer software. According to Cuche et al. and Colomb et al.
the reconstruction algorithm provides simultaneous amplitude and
quantitative phase images of the cells (Koala software) (Cuche et al.,
1999; Colomb et al., 2006). It is important to note that an extensive
quality control of the DHM technique has been published (Rappaz et al.,
2008).
Offline analysisThe optical and electrophysiological recordings were analysed using
MATLAB 7.6 (Mathworks Software, Natick, MA) and all curves were
fitted using ORIGIN 7.5 (Microcal Software, Northampton, MA).
Forskolin concentration–response profiles were fitted to the following
logistic equation: Q/Q max51/[1+(EC50/[forskolin])n], where Q and Qmax
are the normalized forskolin-induced phase shift at a given concentration
and the maximum phase shift induced by a saturating forskolin
concentration, EC50 is the half-maximal effective forskolin concentration
(or time application) and n is the slope factor. All data are presented as
means 6 s.e.m. Student’s t-test (paired or unpaired) was used to determine
statistical significance (P,0.05).
Fig. 7. Quantitative phase signal variations as a function of transmembrane water fluxes. An influx of water induces a dilution of the intracellularcomponents resulting in a decrease of the intracellular refractive index (IRI). By contrast an efflux of water does just the opposite, leading to an increase ofthe IRI. The QPS signal being much more sensitive to the IRI variations than to the cell volume variations, it turns out that a water influx induces a QPS decreaseand a water efflux a QPS increase.
RESEARCH ARTICLE Journal of Cell Science (2014) 127, 546–556 doi:10.1242/jcs.133629
554

Jour
nal o
f Cel
l Sci
ence
Electrophysiology recordingWhole-cell recordings were made, and signals were amplified using
Multiclamp 700B amplifiers (Axon Instruments, Union City, CA) and
digitized by means of an ITC-1600 interface (Instrutech, Great Neck,
NY) to a PC computer running Igor Pro (Wavemetrics, Portland, OR).
All currents (sampling interval, 5 kHz) were low-pass filtered (2 kHz).
They were recorded with pipettes containing 95 mM potassium
gluconate, 40 mM KCl, 10 mM Hepes and 2 mM MgCl2 (pH 7.3). The
pipettes were pulled with a DMZ universal puller.
To measure the effect of mercury on CFTR channel activity, ionic
currents were recorded using the patch-ruptured whole-cell variant of the
patch-clamp technique and measured with an Axopatch 200B amplifier
(Molecular Devices, Union City, CA). Currents were filtered at 5 kHz
(23 dB; 4-pole Bessel filter). The holding potential was 240 mV in all
whole-cell experiments. Current/voltage (I/V) relationships were built by
clamping the membrane potential to 240 mV and by pulses from 2100
to +100 mV in 20 mV increments. Pipettes were prepared by pulling
borosilicate glass capillary tubes (GC150-T10; Harvard Apparatus,
Edenbridge, UK) using a two-step vertical puller (Narishige Tokyo,
Japan). They were filled with the following solution (in mM): 120
N-methyl-D-glucamine, 86 L-aspartic acid, 3 MgCl2, 1 CsEGTA, 5 TES,
and 3 MgATP ex temporane (titrated with NaOH to pH 7.2, the
osmolarity was 28565 mOsmol). The pipette solution was always
hypotonic (with respect to the bath solution) to prevent cell swelling and
activation of the volume-sensitive chloride channels. The stilbene
derivative 4,49-diisothiocyanatostilbene-2,29-disulfonic acid disodium
salt hydrate (DIDS) was also used to block non-CFTR Cl2
conductance. Pipettes were connected to the head of the patch-clamp
amplifier through an Ag–AgCl pellet (pipette resistance of 10–20 MV).
The external bath solution contained (in mM): 140 NaCl, 1.2 CaCl2, 1
MgSO4, 10 dextrose, and 10 TES (titrated with NaOH to pH 7.4, the
osmolarity was 31565 mOsmol). Pipette capacitance was electronically
compensated in cell-attached mode. Membrane capacitance and series
resistances were measured in the whole-cell mode by fitting capacitance
currents obtained in response to a hyperpolarisation of 40 mV, with a
first-order exponential and by integrating the surface of the capacitance
current. Voltage clamp signals were recorded using a microcomputer
equipped with an analogue/digital–digital/analogue conversion board
(Digidata 1440A interface, Molecular Devices). All experiments were
performed at room temperature (20–25 C) and drugs were applied by
using a gravity-fed perfusion system. All Cl2 currents were analysed
with the pCLAMP version 10.2 package software (Molecular Devices).
Iodide efflux assaysThe CFTR Cl2 channel activity was assayed by measuring the
rate of iodide (125I) efflux from CHO cells as described previously
(Norez et al., 2004). The CFTR activator benzo[c]quinolizinium
compound MPB-91 (5-butyl-10-chloro-6-hydroxybenzo[c]quinolizinium
chloride) was synthesised in our laboratory as previously described
(Marivingt-Mounir et al., 2004). Forskolin was purchased from LC
Laboratories (PKC Pharmaceuticals, Woburn, MA). The F508del-CFTR
corrector, miglustat (or NB-DNJ) was purchased from Toronto Chemical
Research and dissolved in water (Norez et al., 2006). CFTRinh172
(3-[(3-trifluoromethyl)-phenyl]-5-[(4-carboxyphenyl)methylene]-2-thioxo-
4-thiazolidinone) a CFTR inhibitor (Ma et al., 2002) was from VWR
International (Fontenay-sous-bois, France). All other products were from
Sigma (St. Louis, MO). Stock solutions of MPB-91 and forskolin
(100 mM), CFTRinh172 (10 mM) were prepared in DMSO. Miglustat was
prepared freshly in water. Results are expressed as means 6 s.e.m. of n
observations. Sets of data were compared with a Student’s t-test.
Differences were considered statistically significant when P,0.05; ns,
non significant difference, *P,0.05, **P,0.01, ***P,0.001. All
statistical tests were performed using GraphPad Prism version 4.0 for
Windows (Graphpad Software) and Origin version 5.0.
RNA extractionRNA was extracted from 90–95% confluent CHO cell cultures grown in
35 mm dishes. We used the Maxwell 16 LEV simplyRNA kit (Promega)
to purify the mRNA following the provided protocol. We modified the
beginning of the procedure by adding the 400 ml of lysis solution (1:1
homogenisation solution and thioglycerol + lysis solution) directly to
each culture. Each dish was agitated slowly to lyse the cells.
Homogenates were then transferred to cartridge as described. With this
procedure we obtained between 2 and 8 mg of mRNA/dish of very pure
RNA (OD 260/280 above 2.1 and OD 260/230 above 2.0).
Reverse transcriptase500 ng of mRNA was used in each reverse transcription reaction. cDNA
was made using the High Capacity RNA-to-cDNA kit (Life
Technologies) following manufacturer’s instructions.
Quantitative polymerase chain reactions (QPCR) were performed
using an ABI 7900 system (Life Technologies). 10 ng of cDNA was
used for each reaction, performed in triplicate (technical replicates).
Settings of the machine were not modified using a temperature of
hybridisation and elongation of 60 C. We used the Power Sybr Green
Master Mix (Life Technologies) containing both Taq polymerase and
the fluorophore. To compare the expression difference between genes,
we converted the cycle threshold (CT) in copy number by applying the
rule that a CT510 is equivalent to 1E11 copies and a CT537.34 is
equivalent to 625 copies. A normalisation factor for each reference gene
was calculated by dividing each copy number obtained for the reference
gene by the geomean calculated with each sample of this reference gene.
This normalisation factor is centred on 1. We obtained a normalisation
factor for each reference gene used (actin beta and Cog1). The final
calibration number was obtained by calculating the average of these two
normalisation factors (actin beta and Cog1). We divided the copy
number calculated for each sample for CFTR, UCP3 and UCP9 by this
final calibration number. The result is a normalized value of gene
expression for the different genes that keeps the difference between
genes intact. The concentration of primers in the final reaction was
200 nM.
Primers sequence used in qPCRReference genes were chosen from Bahr et al. (Bahr et al., 2009). We
selected as reference genes actin beta and Cog1 (component of
oligomeric Golgi complex I). ChoActbFo (forward) 59-GCTCTTTTCC-
AGCCTTCCTT-39; choActbRe (reverse) 59-GAGCCAGAGCAGTGAT-
CTCC-39; choCog1Fo 59-ACTAGCCTCCAGCCAGATCA-39; choCog1Re
59-GCAGGTGAGTCGTCTTCCT-39.
For human CFTR (RefSeq NM_000492) we designed the following
primers: hCFTR_WT_Fo1628 59-CTGGCACCATTAAAGAAAATAT-
CATC-39; hCFTR_WT_Fo1628 59-CTGGCACCATTAAAGAAAATA-
TCATC-39.
For CHO sequences we designed primers sequences as follows:
choAQP3Fo167 59-TCCTCACCATCAACTTGGCT-39; choAQP3Re317
59-AGTGTGTAGATGGGCAGCTT-39; choAQP9Fo260 59-TAAGAA-
TTGGGGTGGGTGGG-39; choAQP9Re379 59-CAGTCAGTGCTGTT-
CTTGGG-39.
siRNA transfectionsCHO genomic sequences were found in the NCBI database
(NW_003615295.1). Stealth siRNA was designed using the BLOCK-
iTTM RNAi Designer (Lifetechnologies). Duplexes of siRNAs were made
with the following sequences: SiRNA against CHO AQP3: 59-CAUGG-
UGGCUUCCUCACCAUCAACU39; 59-AGUUGAUGGUGAGGAAG-
CCACCAUG-39. Scramble siRNA: 59-AGUCCUAGGUUGAGGGAAC-
GACAUG; 59-CAUGUCGUUCCCUCAACCUAGGACU-39.
Lipofectamine 2000 (Life Technologies) was used for transfections.
For each 35 mm dish, 9 ml of Lipofectamine 2000 and 300 nmol of
siRNA duplex was used for each transfection. DHM measurements were
made 24 to 48 hours after transfection, after which the CHO cells were
immediately lysed with the RNA lysis buffer.
AcknowledgementsThe authors thank Corinne Moratal and Sandra Borel, Mathilde Jolivet andLyncee Tech SA (www.lynceetec.com) for technological assistance. We alsothank Anne Cantereau for critical comments to the present manuscript.
RESEARCH ARTICLE Journal of Cell Science (2014) 127, 546–556 doi:10.1242/jcs.133629
555
Jour
nal o
f Cel
l Sci
ence
Competing interestsThe authors have the following conflicts: Pierre J. Magistretti and Pierre Marquet areco-founders of Lyncee Tec. The persons mentioned in this statement are part ofuniversity research groups, and have participated seven years ago in the foundationof the Lyncee Tec company, which commercializes products related to the technologyemployed in this study. However, the study has been performed independently ofLyncee Tec in the academic laboratories related to these three persons. This doesnot alter the authors’ adherence to all the Journal of Cell Science policies on sharingdata and materials.
Authors contributionsAll authors designed experiments and took the primary responsibility of writingthe manuscript. P.J. performed phase imaging and electrophysiology experiments.F.B. performed iodide efflux assays experiments. S.L. performed molecular biologyexperiments. C.B. performed electrophysiology experiments. All authors discussedthe results, commented on and edited the manuscript.
FundingThis work was supported by the Commission for Technology and Innovation/KTI[project number 9389.1] and the Swiss National Science Foundation [grantnumber CR3213_132993 to P.M. and P.J.M.].
ReferencesAntigny, F., Girardin, N., Raveau, D., Frieden, M., Becq, F. and Vandebrouck,C. (2009). Dysfunction of mitochondria Ca2+ uptake in cystic fibrosis airwayepithelial cells. Mitochondrion 9, 232-241.
Bahr, S. M., Borgschulte, T., Kayser, K. J. and Lin, N. (2009). Using microarraytechnology to select housekeeping genes in Chinese hamster ovary cells.Biotechnol. Bioeng. 104, 1041-1046.
Becq, F., Mettey, Y., Gray, M. A., Galietta, L. J., Dormer, R. L., Merten, M.,Metaye, T., Chappe, V., Marvingt-Mounir, C., Zegarra-Moran, O. et al. (1999).Development of substituted Benzo[c]quinolizinium compounds as novel activatorsof the cystic fibrosis chloride channel. J. Biol. Chem. 274, 27415-27425.
Berdiev, B. K., Cormet-Boyaka, E., Tousson, A., Qadri, Y. J., Oosterveld-Hut,H. M., Hong, J. S., Gonzales, P. A., Fuller, C. M., Sorscher, E. J., Lukacs,G. L. et al. (2007). Molecular proximity of cystic fibrosis transmembraneconductance regulator and epithelial sodium channel assessed by fluorescenceresonance energy transfer. J. Biol. Chem. 282, 36481-36488.
Bormann, J., Hamill, O. P. and Sakmann, B. (1987). Mechanism of anionpermeation through channels gated by glycine and gamma-aminobutyric acid inmouse cultured spinal neurones. J. Physiol. 385, 243-286.
Boss, D., Kuhn, J., Jourdain, P., Depeursinge, C., Magistretti, P. J. andMarquet, P. (2013). Measurement of absolute cell volume, osmotic membranewater permeability, and refractive index of transmembrane water and solute fluxby digital holographic microscopy. J. Biomed. Opt. 18, 036007.
Bulteau, L., Derand, R., Mettey, Y., Metaye, T., Morris, M. R., McNeilly, C. M.,Folli, C., Galietta, L. J., Zegarra-Moran, O., Pereira, M. M. et al. (2000).Properties of CFTR activated by the xanthine derivative X-33 in human airwayCalu-3 cells. Am. J. Physiol. Cell Physiol. 279, C1925-C1937.
Chen, Y. W., Huang, C. F., Yang, C. Y., Yen, C. C., Tsai, K. S. and Liu, S. H. (2010).Inorganic mercury causes pancreatic beta-cell death via the oxidative stress-inducedapoptotic and necrotic pathways. Toxicol. Appl. Pharmacol. 243, 323-331.
Cheng, S. H., Gregory, R. J., Marshall, J., Paul, S., Souza, D. W., White, G. A.,O’Riordan, C. R. and Smith, A. E. (1990). Defective intracellular transport andprocessing of CFTR is the molecular basis of most cystic fibrosis. Cell 63, 827-834.
Choi, J. Y., Muallem, D., Kiselyov, K., Lee, M. G., Thomas, P. J. and Muallem,S. (2001). Aberrant CFTR-dependent HCO3- transport in mutations associatedwith cystic fibrosis. Nature 410, 94-97.
Colomb, T., Montfort, F., Kuhn, J., Aspert, N., Cuche, E., Marian, A., Charriere,F., Bourquin, S., Marquet, P. and Depeursinge, C. (2006). Numericalparametric lens for shifting, magnification, and complete aberration compensationin digital holographic microscopy. J. Opt. Soc. Am. A Opt. Image Sci. Vis. 23,3177-3190.
Crowe, W. E., Altamirano, J., Huerto, L. and Alvarez-Leefmans, F. J. (1995).Volume changes in single N1E-115 neuroblastoma cells measured with afluorescent probe. Neuroscience 69, 283-296.
Cuche, E., Marquet, P. and Depeursinge, C. (1999). Simultaneous amplitude-contrast and quantitative phase-contrast microscopy by numerical reconstructionof Fresnel off-axis holograms. Appl. Opt. 38, 6994-7001.
Depeursinge, C., Colomb, T., Emery, Y., Kuhn, J., Charriere, F., Rappaz, B.and Marquet, P. (2007). Digital holographic microscopy applied to life sciences.Conf. Proc. IEEE Eng. Med. Biol. Soc. 2007, 6244-6247.
Derand, R., Bulteau-Pignoux, L., Mettey, Y., Zegarra-Moran, O., Howell, L. D.,Randak, C., Galietta, L. J., Cohn, J. A., Norez, C., Romio, L. et al. (2001).Activation of G551D CFTR channel with MPB-91: regulation by ATPase activityand phosphorylation. Am. J. Physiol. 281, C1657-C1666.
Farinas, J. and Verkman, A. S. (1996). Cell volume and plasma membraneosmotic water permeability in epithelial cell layers measured by interferometry.Biophys. J. 71, 3511-3522.
Farinas, J., Simanek, V. and Verkman, A. S. (1995). Cell volume measured bytotal internal reflection microfluorimetry: application to water and solute transportin cells transfected with water channel homologs. Biophys. J. 68, 1613-1620.
Farinas, J., Kneen, M., Moore, M. and Verkman, A. S. (1997). Plasmamembrane water permeability of cultured cells and epithelia measured by lightmicroscopy with spatial filtering. J. Gen. Physiol. 110, 283-296.
Hanrahan, J. W., Tabcharani, J. A., Becq, F., Mathews, C. J., Augustinas, O.,Jensen, T. J., Chang, X. B. and Riordan, J. R. (1995). Function anddysfunction of the CFTR chloride channel. Soc. Gen. Physiol. Ser. 50, 125-137.
Hasegawa, H., Skach, W., Baker, O., Calayag, M. C., Lingappa, V. andVerkman, A. S. (1992). A multifunctional aqueous channel formed by CFTR.Science 258, 1477-1479.
Illek, B., Fischer, H., Santos, G. F., Widdicombe, J. H., Machen, T. E. andReenstra, W. W. (1995). cAMP-independent activation of CFTR Cl channels bythe tyrosine kinase inhibitor genistein. Am. J. Physiol. 268, C886-C893.
Jourdain, P., Pavillon, N., Moratal, C., Boss, D., Rappaz, B., Depeursinge, C.,Marquet, P. and Magistretti, P. J. (2011). Determination of transmembranewater fluxes in neurons elicited by glutamate ionotropic receptors and by thecotransporters KCC2 and NKCC1: a digital holographic microscopy study.J. Neurosci. 31, 11846-11854.
Jourdain, P., Boss, D., Rappaz, B., Moratal, C., Hernandez, M. C.,Depeursinge, C., Magistretti, P. J. and Marquet, P. (2012). Simultaneousoptical recording in multiple cells by digital holographic microscopy of chloridecurrent associated to activation of the ligand-gated chloride channel GABA(A)receptor. PLoS ONE 7, e51041.
Ma, T., Thiagarajah, J. R., Yang, H., Sonawane, N. D., Folli, C., Galietta, L. J.and Verkman, A. S. (2002). Thiazolidinone CFTR inhibitor identified by high-throughput screening blocks cholera toxin-induced intestinal fluid secretion.J. Clin. Invest. 110, 1651-1658.
Marivingt-Mounir, C., Norez, C., Derand, R., Bulteau-Pignoux, L., Nguyen-Huy, D.,Viossat, B., Morgant, G., Becq, F., Vierfond, J. M. and Mettey, Y. (2004).Synthesis, SAR, crystal structure, and biological evaluation ofbenzoquinoliziniums asactivators of wild-type and mutant cystic fibrosis transmembrane conductanceregulator channels. J. Med. Chem. 47, 962-972.
Marquet, P., Depeursinge, C. and Magistretti, P. J. (2013). Exploring neural celldynamicswith digital holographicmicroscopy.Annu. Rev. Biomed. Eng. 15, 407-431.
Norez, C., Heda, G. D., Jensen, T., Kogan, I., Hughes, L. K., Auzanneau, C.,Derand, R., Bulteau-Pignoux, L., Li, C., Ramjeesingh, M. et al. (2004).Determination of CFTR chloride channel activity and pharmacology usingradiotracer flux methods. J. Cyst. Fibros. 3 Suppl. 2, 119-121.
Norez, C., Noel, S., Wilke, M., Bijvelds, M., Jorna, H., Melin, P., DeJonge, H.and Becq, F. (2006). Rescue of functional delF508-CFTR channels in cysticfibrosis epithelial cells by the alpha-glucosidase inhibitor miglustat. FEBS Lett.580, 2081-2086.
Norez, C., Antigny, F., Noel, S., Vandebrouck, C. and Becq, F. (2009). A cysticfibrosis respiratory epithelial cell chronically treated bymiglustat acquires a non-cysticfibrosis-like phenotype. Am. J. Respir. Cell Mol. Biol. 41, 217-225.
Pavillon, N., Benke, A., Boss, D., Moratal, C., Kuhn, J., Jourdain, P.,Depeursinge, C., Magistretti, P. J. and Marquet, P. (2010). Cell morphologyand intracellular ionic homeostasis exploredwith amultimodal approach combiningepifluorescence and digital holographic microscopy. J. Biophotonics 3, 432-436.
Pietrement, C., Da Silva, N., Silberstein, C., James, M., Marsolais, M., VanHoek, A., Brown, D., Pastor-Soler, N., Ameen, N., Laprade, R. et al. (2008).Role of NHERF1, cystic fibrosis transmembrane conductance regulator, andcAMP in the regulation of aquaporin 9. J. Biol. Chem. 283, 2986-2996.
Rappaz, B., Marquet, P., Cuche, E., Emery, Y., Depeursinge, C. andMagistretti, P.(2005). Measurement of the integral refractive index and dynamic cell morphometryof living cells with digital holographic microscopy. Opt. Express 13, 9361-9373.
Rappaz, B., Barbul, A., Emery, Y., Korenstein, R., Depeursinge, C.,Magistretti, P. J. and Marquet, P. (2008). Comparative study of humanerythrocytes by digital holographic microscopy, confocal microscopy, andimpedance volume analyzer. Cytometry A 73A, 895-903.
Savage, D. F. and Stroud, R. M. (2007). Structural basis of aquaporin inhibition bymercury. J. Mol. Biol. 368, 607-617.
Schreiber, R., Greger, R., Nitschke, R. and Kunzelmann, K. (1997). Cysticfibrosis transmembrane conductance regulator activates water conductance inXenopus oocytes. Pflugers Arch. 434, 841-847.
Schreiber, R., Nitschke, R., Greger, R. and Kunzelmann, K. (1999). The cysticfibrosis transmembrane conductance regulator activates aquaporin 3 in airwayepithelial cells. J. Biol. Chem. 274, 11811-11816.
Schreiber, R., Pavenstadt, H., Greger, R. and Kunzelmann, K. (2000).Aquaporin 3 cloned from Xenopus laevis is regulated by the cystic fibrosistransmembrane conductance regulator. FEBS Lett. 475, 291-295.
Sheridan, M. B., Fong, P., Groman, J. D., Conrad, C., Flume, P., Diaz, R.,Harris, C., Knowles, M. and Cutting, G. R. (2005). Mutations in the beta-subunit of the epithelial Na+ channel in patients with a cystic fibrosis-likesyndrome. Hum. Mol. Genet. 14, 3493-3498.
Weber, G. J., Mehr, A. P., Sirota, J. C., Aller, S. G., Decker, S. E., Dawson, D. C. andForrest, J.N., Jr (2006).Mercuryandzincdifferentially inhibit sharkandhumanCFTRorthologues: involvement of shark cysteine 102. Am. J. Physiol. 290, C793-C801.
Wlaschin, K. F. and Hu, W. S. (2007). A scaffold for the Chinese hamstergenome. Biotechnol. Bioeng. 98, 429-439.
RESEARCH ARTICLE Journal of Cell Science (2014) 127, 546–556 doi:10.1242/jcs.133629
556