Embed Size (px)
Citation preview
The Human Capital Effects of Hosting Refugees: Evidence
from Kagera
Chiara Kofol∗;
Maryam Naghsh Nejad †
Friday 27th October, 2017
Preliminary version, please do not cite or circulate.
Abstract
In the last decade the number of international child refugees significantly increased and in
2015 about half of the refugees were children. According to the available literature the impact of
forced migration on human capital in host countries has still to be explored. This paper estimates
both the short and the long term human capital consequences of hosting refugees fleeing from
the genocides of Rwanda and Burundi in the Kagera region of Tanzania between 1991 and
2004. The study uses longitudinal data from the Kagera Health and Development Survey and
the identification strategy relies on the fact that forced migration causes an exogenous shift in
human capital supply. Preliminary results suggest that the impact of hosting refugees on children
living in Kagera decreases child labor in the short run (between 1991 and 1994), but increases
it in the longer run (1991-2004). The results are heterogeneous across class ages. The study
aims at understanding the mechanisms behind the variation in human capital due to the forced
migration shock exploring different channels.
JEL classification: J13, O15, R23
Keywords: forced migration, child labor, school attendance, human capital
∗Centre for Development Research (ZEF); [email protected]†Institute of Labor Economics (IZA); [email protected]
1

1 Introduction
Unavoidable forced migration is one of the main consequences of any civil conflict
which is also a priority in the 2030 Agenda for Sustainable Development. The United
Nations Population Division and Affairs (2015) reports that in 2015 the total global
stock of international migrants was about 244 million, of which about 65.3 million
are forced migrants and about 21 million are refugees (half of whom are children
younger than 18 years old). While in the economic literature a large number of studies
analyze the impact of voluntary migration on host countries looking at a wide range of
immigrant outcomes (labor market outcomes, education, and health etc.), the stream
of the literature that focuses on the impact of forced migration in host countries is
scarce (Ruiz and Vargas-Silva, 2016), (Maystadt et al., 2012), (Alix-Garcia and Saah,
2010) and there are no studies that analyse the impact of forced migration on human
capital.
This paper contributes to the existing economic literature estimating the human
capital consequences of hosting refugees flewing from the civil conflict in Burundi and
Rwanda in Tanzania (Kagera region). In particular, it studies the short and long term
impact of the refugees influx on child labor. This study also seeks to explore which
mechanisms cause this variation in human capital accumulation.
About 1 million refugees moved to Tanzania in 1993-1998 due to the violent civil
conflict that spread in 1993-1994 in Burundi and Rwanda. These conflicts caused
hundreds of thousands of casualties in just a few months. In some regions of Tanzania,
refugees outnumbered natives five to one (Whitaker, 2002). The shock was exacerbated
by a series of natural topographic barriers (chain of mountains, natural reserves, lakes)
which separated the eastern part of northern Tanzania from the west. According to
Ruiz and Vargas-Silva (2016) these geographical barriers in addition to the proximity
to both Uganda and Rwanda borders effectively resulted in a natural experiment in
which the western region was heavily affected by the refugee inflow.
The Kagera region is located in the north-western corner of Tanzania bordered by
2
neighboring countries Uganda, Rwanda and Burundi. It is also the most remote region
from the capital Dar es Salaam. The region is typically rural with agriculture serving
as the main economic activities where it employs about 80 percent of the working
population (Baez, 2011). Its primary production include banana and coffee in com-
bination with rain-fed annual crops, maize, sorghum and cotton (Beegle et al., 2008).
Fishing and livestock farming are culturally important, but despite their potential they
contribute little to the regions’ economy and both sector remain underdeveloped.
According to the 2013 census the total population of Tanzania stood at 48 million of
which 44.8 % are under the age of 15. Despite existing regulations against child labour,
the phenomenon is still very widespread with about 34.5% (5,006,889) of children aged
5-17 involved in some form of economic activities. The incidence of child labour is also
very predominant in poor and rural areas. According to the 2014 Tanzania Child
Labour Survey report, child labour intensifies as one move away from the capital of
Dar er Salaam. How are children in Kagera affected by the sudden and large influx of
refugees?
We use this setting to address three research questions. First, does the influx of
refugees have an impact on the probability of a child to work and to go to school?
Second, is this variation due to a change in the household income and then in the
necessity of the household of sending children to work? Finally, is the impact of forced
migration lasting over time?
Exploiting the fact that forced migration causes an exogenous shift in human cap-
ital supply we find that the refugee influx decreases the probability of a child to work
as a farmer in the short run.
The paper is structured as follows. The next section reviews two strands of lit-
erature related to this study. Section 3 describes the theoretical framework, Section
4 describes the methodology, Section 5 presents the results, Section 6 discusses the
mechanisms, Section 7 shows the robustness checks and Section 8 concludes.
3
2 Relevant literature
This study contributes to the current stream of economic literature that studies the
impact of migration on human capital, and more in details to the literature that studies
the impact of forced migration on human capital of natives in host communities.
A large literature provides evidence of the impact of voluntary migration on school
attainments and education of those who migrated. In particular a few studies focused
on school attainments of second generation migrants. Gang and Zimmermann (2000)
using the German data find that both ethnicity and the size of diaspora affects the
school attainments of second generation migrants. Trejo (2003) using current popula-
tion survey in the US, finds that improvements in earnings for the second generation
Mexican in the US can be explained by the return to their human capital that was
acquired in the US. Algan, Dustmann, Glitz, and Manning, (2010) provide evidence
that Second-Generation Immigrants in France, Germany and the United Kingdom
have smaller gaps with natives in educational attainment compared to first genera-
tion migrants. In the case of Western European destination countries, Heath and
Cheung (2007) find that controlling for parental class and parental education, second-
generation minorities whose parents came from less-developed non-European origins
have substantially lower test scores or exam results during the period of compulsory
schooling than do the majority groups in the countries of destination. Betts and
Lofstrom (2000) find that the upper half of the immigrant population has been and
continues to be at least as highly educated as the upper half of the native population
and that educational attainment increased among immigrants in absolute terms but
declined in relative terms (compared to natives).
However, the literature studying the impact of forced migration (due to conflict)
on human capital of migrants is scarce and suggests that forced migration has negative
impacts on school attainment in the context of conflict (Chamarbagwala and Moran
(2011); Balcells and Justino (2014); Verwimp and Van Bavel (2014)). Moreover, the
impact of forced migration on human capital of natives in the host countries has still
4
to be explored. To the best of our knowledge the only paper that addresses this issue is
Baez (2011) finds that childhood exposure to this massive arrival of refugees in Kagera
reduces, schooling by 0.2 years (7.1%) and literacy by 7 percentage points (8.6%) and
undermines child health.
This paper contributes to the current literature estimating both the short and
the long-run human capital consequences (1991 and 2010) of hosting refugees in Tan-
zania (Kagera region) looking both at child labor and schooling and explores which
mechanisms cause this variation in human capital accumulation.
3 Theoretical Framework
4 Methodology
4.1 Data description
This study uses the Kagera Health and Development Survey (KHDS). The KHDS
survey is longitudinal and includes information about households in different areas
of Kagera before and after the forced migration shock (for 1991, 1994, 2004, 2010).
The attrition rate of the survey is quite low as at least one member of the household
interviewed in 1991 was re-interviewed in 89 percent of the cases in 2010 (Ruiz and
Vargas-Silva, 2016). The first round of the survey was conducted between September
1991 and May 1993. The Burundi conflict started on October 1993, so the 1991 round
of the survey was collected before the start of the conflict (Ruiz and Vargas-Silva,
2016). Table 1 shows the number of children between 6 and 14 years old in the
sample. In each year the gender of the sample is balanced.
The survey has detailed information on children labor outcomes as it specifies
if the child is enrolled in school and in which type of labor activity he is involved
(agricultural, non-agricultural self-employment, wage employment).
5
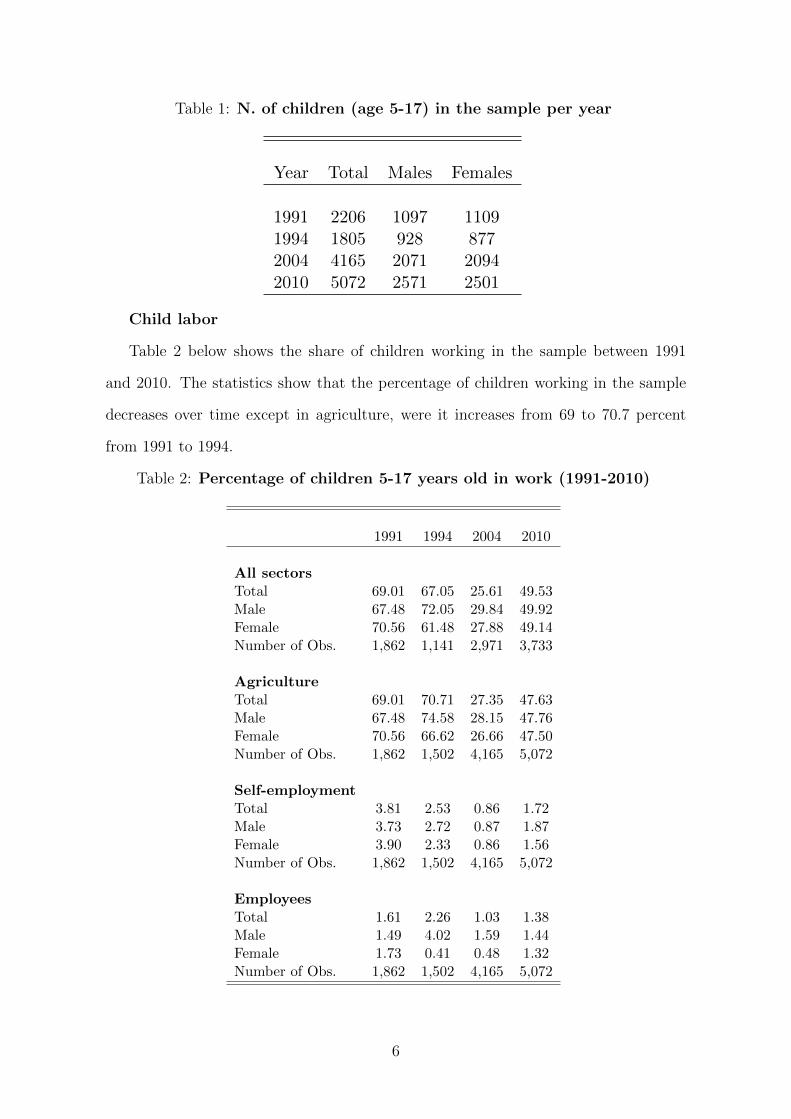
Table 1: N. of children (age 5-17) in the sample per year
Year Total Males Females
1991 2206 1097 11091994 1805 928 8772004 4165 2071 20942010 5072 2571 2501
Child labor
Table 2 below shows the share of children working in the sample between 1991
and 2010. The statistics show that the percentage of children working in the sample
decreases over time except in agriculture, were it increases from 69 to 70.7 percent
from 1991 to 1994.
Table 2: Percentage of children 5-17 years old in work (1991-2010)
1991 1994 2004 2010
All sectorsTotal 69.01 67.05 25.61 49.53Male 67.48 72.05 29.84 49.92Female 70.56 61.48 27.88 49.14Number of Obs. 1,862 1,141 2,971 3,733
AgricultureTotal 69.01 70.71 27.35 47.63Male 67.48 74.58 28.15 47.76Female 70.56 66.62 26.66 47.50Number of Obs. 1,862 1,502 4,165 5,072
Self-employmentTotal 3.81 2.53 0.86 1.72Male 3.73 2.72 0.87 1.87Female 3.90 2.33 0.86 1.56Number of Obs. 1,862 1,502 4,165 5,072
EmployeesTotal 1.61 2.26 1.03 1.38Male 1.49 4.02 1.59 1.44Female 1.73 0.41 0.48 1.32Number of Obs. 1,862 1,502 4,165 5,072
6

School enrolment
Table 3 below shows the school enrolment trends between 1991 and 2010. Primary
school enrolment in Table 3a decreases over time after the shock due to the influx of
refugees, especially in the long-run (2004-2010) of about 15 percentage points. Both
secondary and tertiary school enrolment instead steadily increase. This last pattern is
partly to due to the school reform that took place in Tanzania in 1994 and that will
be accounted for in the analysis controlling for year fixed effects.
Table 3: Percentage of children 5-17 years old in school
1991 1994 2004 2010
TotalAll 81.33 86.85 81.82 82.33Male 80.72 88.89 83.48 80.94Female 81.96 84.66 80.18 83.75
Primary school (7-13 years old)All 98.01 96.79 76.74 76.47Male 96.96 96.05 77.9 74.07Female 99.22 97.55 75.63 78.88
Secondary school (14-17 years old)All 68.95 79.23 89.87 96.84Male 67.66 83.58 91.99 97.47Female 70.21 74.43 87.68 96.16
7
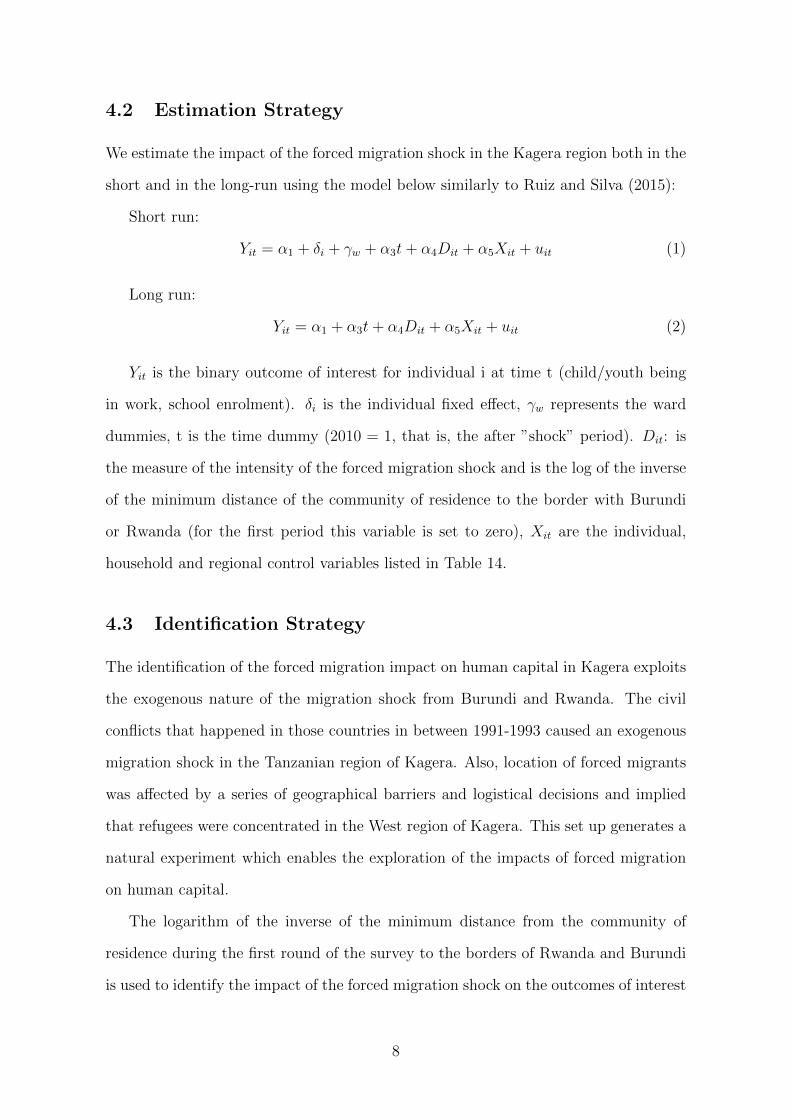
4.2 Estimation Strategy
We estimate the impact of the forced migration shock in the Kagera region both in the
short and in the long-run using the model below similarly to Ruiz and Silva (2015):
Short run:
Yit = α1 + δi + γw + α3t+ α4Dit + α5Xit + uit (1)
Long run:
Yit = α1 + α3t+ α4Dit + α5Xit + uit (2)
Yit is the binary outcome of interest for individual i at time t (child/youth being
in work, school enrolment). δi is the individual fixed effect, γw represents the ward
dummies, t is the time dummy (2010 = 1, that is, the after ”shock” period). Dit: is
the measure of the intensity of the forced migration shock and is the log of the inverse
of the minimum distance of the community of residence to the border with Burundi
or Rwanda (for the first period this variable is set to zero), Xit are the individual,
household and regional control variables listed in Table 14.
4.3 Identification Strategy
The identification of the forced migration impact on human capital in Kagera exploits
the exogenous nature of the migration shock from Burundi and Rwanda. The civil
conflicts that happened in those countries in between 1991-1993 caused an exogenous
migration shock in the Tanzanian region of Kagera. Also, location of forced migrants
was affected by a series of geographical barriers and logistical decisions and implied
that refugees were concentrated in the West region of Kagera. This set up generates a
natural experiment which enables the exploration of the impacts of forced migration
on human capital.
The logarithm of the inverse of the minimum distance from the community of
residence during the first round of the survey to the borders of Rwanda and Burundi
is used to identify the impact of the forced migration shock on the outcomes of interest
8
similarly to Baez (2011) and Ruiz and Vargas-Silva (2016). We provide the correlation
between the distance from the border and the number of refugees hosted in the camps
in order to prove that we use a good proxy for the intensity of the refugee influx.
A concern with our identification strategy could arise if the distance was capturing
other differences between communities. However, Ruiz and Vargas-Silva (2016) have
already showed that there is no significant linear relationship between the educational
level of individuals in the pre-shock period (a proxy for economic conditions) and the
distances from the borders.
A second issue with our identification strategy could be due to migration of natives
in Kagera because of the influx of refugees. This could be a source of selection bias
in our estimates if only households with certain characteristics (such as poorer/lower
educated households) stayed in Kagera after the immigration shock. However (Beegle
et al., 2008) shows that between 1991/1994 3792 individuals stayed in Kagera and just
324 moved elsewhere.
9
5 Results and discussion
5.1 Main Results
Short-Term Effects (1991-1994)
In this section we report some basic results that show the impact of the forced
migration shock on both child labor and youth employment in the short-run (1991-
1994), right after the exposure to the large influx of refugees in Kagera. All the
regressions include individual fixed effects and are run on children who were between
5 and 15 years old in that time period.
Table 4 shows the impact of the refugee shock on child labor using as an indicator
of the shock the log of the inverse of the minimum distance from Burundi and Rwanda.
The results suggest that right after the influx of refugees in Kagera, being closer to
the border decreased the probability of a child between 5 and 13 years old of being
working in the previous 7 days of 8.6 percentage points at the 1% level of significance.
The impact of the influx of refugees is instead positive for older children (between 14
and 17 years old) as their probability of being working in the previous 7 days increases
of 37 percentage points at the 1% level of significance when they are closer to the
border.
Table 5 shows the impact of the forced migration shock on the probability of a child
to work in a specific economic sector. The results suggest that children working in
agriculture are those who are mostly affected by the shock. Being closer to the border
decreased the probability of a child between 5 and 13 years old of being working in
the previous 7 days as a farm worker of 8.6 percentage points at the 1% level of
significance. The impact of the influx of refugees increases instead the probability of
older children (between 14 and 17 years old) of being farm workers in the previous 7
days of 19 percentage points at the 1% level of significance when they are closer to the
border.
Overall, the preliminary results show that the intense influx of refugees that affected
Burundi and Rwanda between 1991 and 1994 decreased child labor for younger children
10
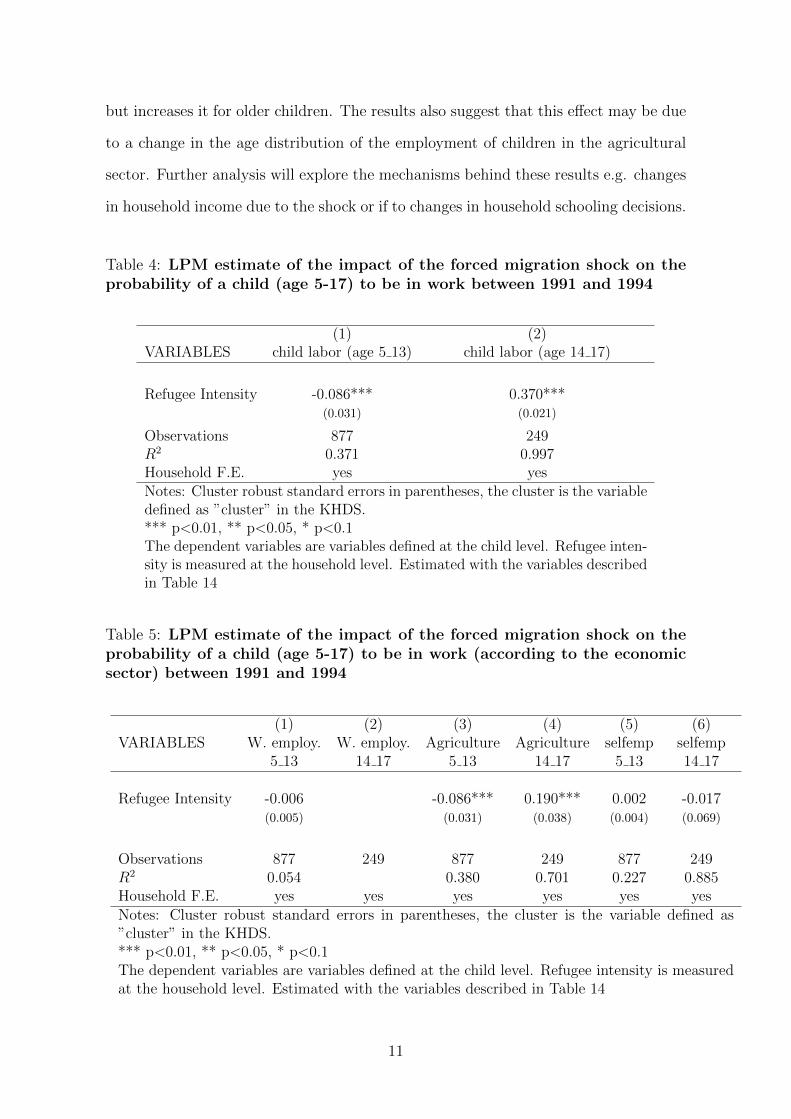
but increases it for older children. The results also suggest that this effect may be due
to a change in the age distribution of the employment of children in the agricultural
sector. Further analysis will explore the mechanisms behind these results e.g. changes
in household income due to the shock or if to changes in household schooling decisions.
Table 4: LPM estimate of the impact of the forced migration shock on theprobability of a child (age 5-17) to be in work between 1991 and 1994
(1) (2)VARIABLES child labor (age 5 13) child labor (age 14 17)
Refugee Intensity -0.086*** 0.370***(0.031) (0.021)
Observations 877 249R2 0.371 0.997Household F.E. yes yesNotes: Cluster robust standard errors in parentheses, the cluster is the variabledefined as ”cluster” in the KHDS.*** p<0.01, ** p<0.05, * p<0.1The dependent variables are variables defined at the child level. Refugee inten-sity is measured at the household level. Estimated with the variables describedin Table 14
Table 5: LPM estimate of the impact of the forced migration shock on theprobability of a child (age 5-17) to be in work (according to the economicsector) between 1991 and 1994
(1) (2) (3) (4) (5) (6)VARIABLES W. employ. W. employ. Agriculture Agriculture selfemp selfemp
5 13 14 17 5 13 14 17 5 13 14 17
Refugee Intensity -0.006 -0.086*** 0.190*** 0.002 -0.017(0.005) (0.031) (0.038) (0.004) (0.069)
Observations 877 249 877 249 877 249R2 0.054 0.380 0.701 0.227 0.885Household F.E. yes yes yes yes yes yesNotes: Cluster robust standard errors in parentheses, the cluster is the variable defined as”cluster” in the KHDS.*** p<0.01, ** p<0.05, * p<0.1The dependent variables are variables defined at the child level. Refugee intensity is measuredat the household level. Estimated with the variables described in Table 14
11

Long-Term Effects (1991-2004)
In this section we report some basic results that show the impact of the forced
migration shock on both child labor and youth employment in the short-run (1991-
2004), right after the exposure to the large influx of refugees in Kagera. All the
regressions are run on children who were between 5 and 15 years old in that time
period.
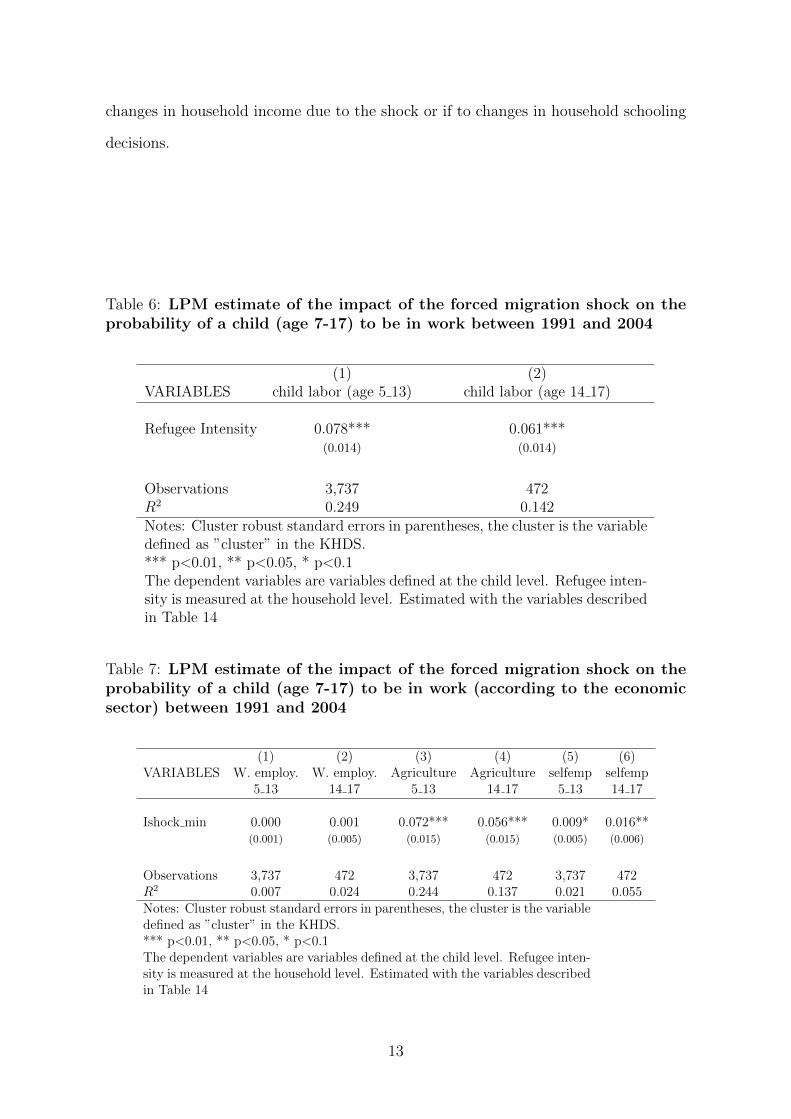
Table 6 shows the impact of the refugee shock on child labor using as an indicator
of the shock the log of the inverse of the minimum distance from Burundi and Rwanda.
The results suggest that right after the influx of refugees in Kagera, being closer to the
border increased the probability of a child between 5 and 13 years old of being working
in the previous 7 days of 7.8 percentage points at the 1% level of significance. The
impact of the influx of refugees is positive also for older children (between 14 and 17
years old) as their probability of being working in the previous 7 days increases of 6.1
percentage points at the 1% level of significance when they are closer to the border.
Table 7 shows the impact of the forced migration shock on the probability of a
child to work in a specific economic sector. The results suggest that children working
in agriculture are those who are mostly affected by the shock also in the longer run.
Being closer to the border increased the probability of a child between 5 and 13 years
old of being working in the previous 7 days as a farm worker of 7.2 percentage points
at the 1% level of significance. The impact of the influx of refugees increases also
the probability of older children (between 14 and 17 years old) of being farm workers
in the previous 7 days of 5.6 percentage points at the 1% level of significance when
they are closer to the border. Also the probability of being self-employed significantly
increases of about 1.6 percentage points for children between 14 and 17 years old (the
magnitude of the increase for younger children is negligible).
Overall, the preliminary results show that the intense influx of refugees that affected
Burundi and Rwanda between 1991 and 2004 increased the probability of children
in the agricultural sector across all the age classes and of being self-employed for
older children. Further analysis will explore the mechanisms behind these results e.g.
12
changes in household income due to the shock or if to changes in household schooling
decisions.
Table 6: LPM estimate of the impact of the forced migration shock on theprobability of a child (age 7-17) to be in work between 1991 and 2004
(1) (2)VARIABLES child labor (age 5 13) child labor (age 14 17)
Refugee Intensity 0.078*** 0.061***(0.014) (0.014)
Observations 3,737 472R2 0.249 0.142Notes: Cluster robust standard errors in parentheses, the cluster is the variabledefined as ”cluster” in the KHDS.*** p<0.01, ** p<0.05, * p<0.1The dependent variables are variables defined at the child level. Refugee inten-sity is measured at the household level. Estimated with the variables describedin Table 14
Table 7: LPM estimate of the impact of the forced migration shock on theprobability of a child (age 7-17) to be in work (according to the economicsector) between 1991 and 2004
(1) (2) (3) (4) (5) (6)VARIABLES W. employ. W. employ. Agriculture Agriculture selfemp selfemp
5 13 14 17 5 13 14 17 5 13 14 17
Ishock min 0.000 0.001 0.072*** 0.056*** 0.009* 0.016**(0.001) (0.005) (0.015) (0.015) (0.005) (0.006)
Observations 3,737 472 3,737 472 3,737 472R2 0.007 0.024 0.244 0.137 0.021 0.055Notes: Cluster robust standard errors in parentheses, the cluster is the variabledefined as ”cluster” in the KHDS.*** p<0.01, ** p<0.05, * p<0.1The dependent variables are variables defined at the child level. Refugee inten-sity is measured at the household level. Estimated with the variables describedin Table 14
13
6 Mechanisms
In this section we explore the mechanisms through which the influx of refugees could
have had an impact on child labor in Kagera both in the short and in the long run. In
particular, we look at how the influx of refugees affected schooling, household’s welfare
and food prices in the community.
6.1 Schooling
Table 8 shows the impact of the refugee shock on school enrollment using as an in-
dicator of the shock the log of the inverse of the minimum distance from Burundi
and Rwanda. The results suggest that right after the influx of refugees in Kagera,
being closer to the border decreased the probability of a child between 14 and 17 years
old of being enrolled in secondary school of 11.3 percentage points at the 5% level of
significance. No significant effects are found for younger children.
Table 9 shows the impact of the refugee shock on school enrollment using as an
indicator of the shock the log of the inverse of the minimum distance from Burundi
and Rwanda. No significant effects are found.
The impact of the influx of refugees on schooling seems to explain partially the
impact of the influx of refugees on the probability of a child of being working. In
particular, it suggests that the influx of refugees negatively affected secondary school-
ing, offering an explanation for the increase in probability of children between 14 and
17 years old of being farm-workers. However, it does not offer explanations for the
decrease of child labor of younf children in the shorter run and for the lon-run effects.
14
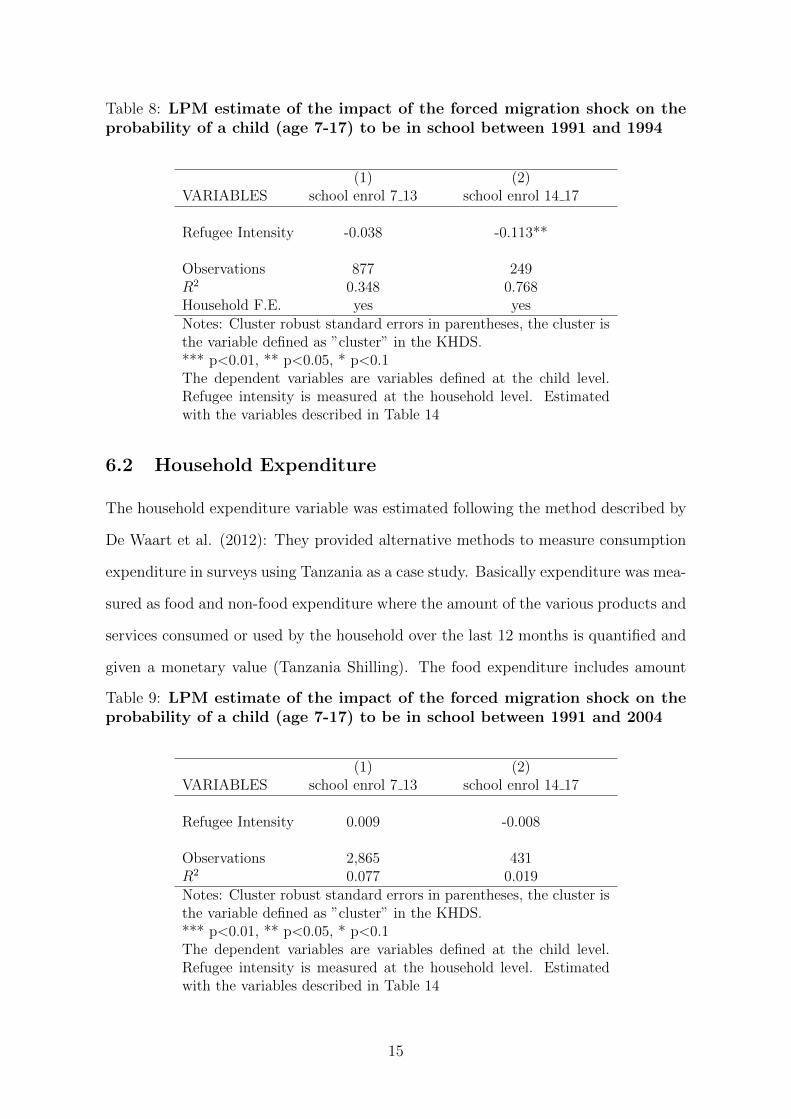
Table 8: LPM estimate of the impact of the forced migration shock on theprobability of a child (age 7-17) to be in school between 1991 and 1994
(1) (2)VARIABLES school enrol 7 13 school enrol 14 17
Refugee Intensity -0.038 -0.113**
Observations 877 249R2 0.348 0.768Household F.E. yes yesNotes: Cluster robust standard errors in parentheses, the cluster isthe variable defined as ”cluster” in the KHDS.*** p<0.01, ** p<0.05, * p<0.1The dependent variables are variables defined at the child level.Refugee intensity is measured at the household level. Estimatedwith the variables described in Table 14
6.2 Household Expenditure
The household expenditure variable was estimated following the method described by
De Waart et al. (2012): They provided alternative methods to measure consumption
expenditure in surveys using Tanzania as a case study. Basically expenditure was mea-
sured as food and non-food expenditure where the amount of the various products and
services consumed or used by the household over the last 12 months is quantified and
given a monetary value (Tanzania Shilling). The food expenditure includes amount
Table 9: LPM estimate of the impact of the forced migration shock on theprobability of a child (age 7-17) to be in school between 1991 and 2004
(1) (2)VARIABLES school enrol 7 13 school enrol 14 17
Refugee Intensity 0.009 -0.008
Observations 2,865 431R2 0.077 0.019Notes: Cluster robust standard errors in parentheses, the cluster isthe variable defined as ”cluster” in the KHDS.*** p<0.01, ** p<0.05, * p<0.1The dependent variables are variables defined at the child level.Refugee intensity is measured at the household level. Estimatedwith the variables described in Table 14
15
spent on various food items as well as a monetary value of consumption from own pro-
duction and gifts. Non-food expenditure covers amount spent on housekeeping items,
education, health and social contributions. This method has been used extensively in
the literature (Gebreselassie and Sharp, 2007; Deaton and Salman, 2002; Beegle et al.,
2012) to measure welfare differences between households.
Table 10 shows the impact of the refugee shock on the logarithm of household
expenditure per capita using as an indicator of the shock the log of the inverse of the
minimum distance from Burundi and Rwanda and household fixed effects. The results
suggest that right after the influx of refugees in Kagera, a 1 percent increase in the
distance to the border increased household expenditure per capita of 12.8 percent at
the 1% level of significance.
Table 11 suggests instead that about 10 years after the influx of refugees in Kagera,
a 1 percent increase in the distance to the border decreased household expenditure per
capita of 27.1 percent at the 1% level of significance.
The impact of the influx of refugees on household expenditure seems to offer an
explanation for the impact of the influx of refugees on the probability of a child of being
working. The influx of refugees positively affected household’s welfare in between 1991
and 1994 (markets?), offering an explanation for the decrease in the probability of
younger children of being working. The influx of refugees negatively affected instead
household’s welfare in between 1991 and 2004, offering an explanation for the increase
in the probability of children of being working.
16
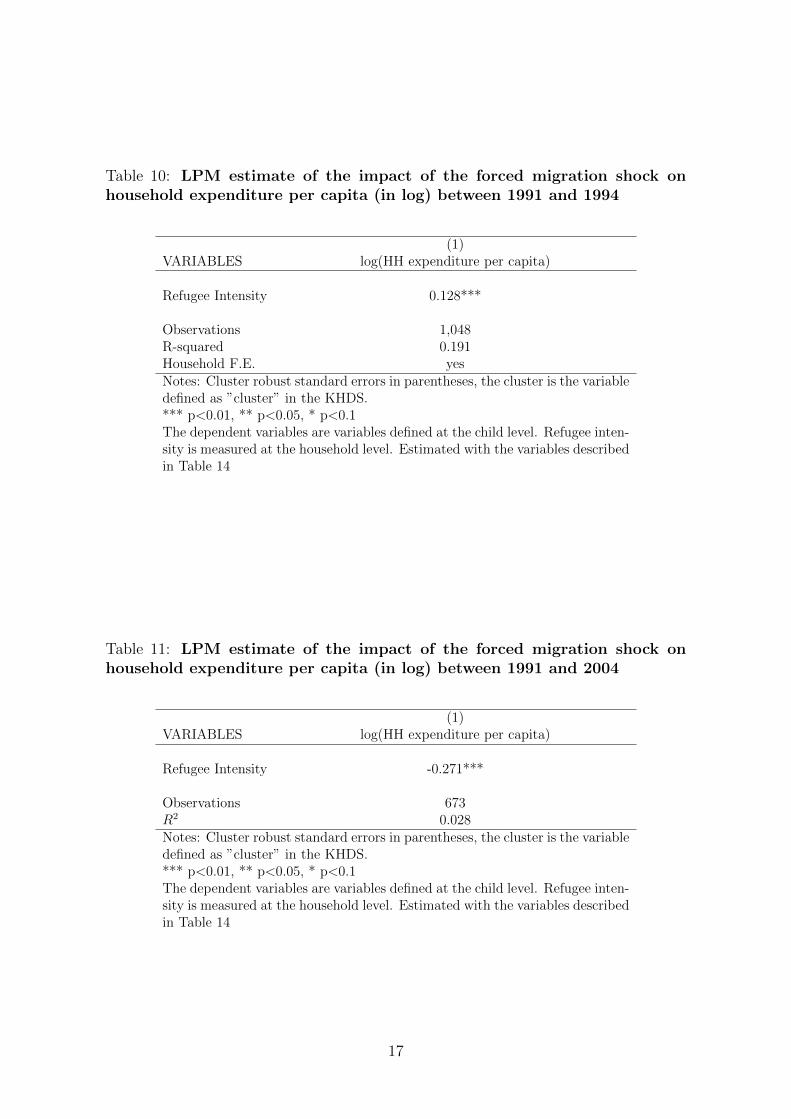
Table 10: LPM estimate of the impact of the forced migration shock onhousehold expenditure per capita (in log) between 1991 and 1994
(1)VARIABLES log(HH expenditure per capita)
Refugee Intensity 0.128***
Observations 1,048R-squared 0.191Household F.E. yesNotes: Cluster robust standard errors in parentheses, the cluster is the variabledefined as ”cluster” in the KHDS.*** p<0.01, ** p<0.05, * p<0.1The dependent variables are variables defined at the child level. Refugee inten-sity is measured at the household level. Estimated with the variables describedin Table 14
Table 11: LPM estimate of the impact of the forced migration shock onhousehold expenditure per capita (in log) between 1991 and 2004
(1)VARIABLES log(HH expenditure per capita)
Refugee Intensity -0.271***
Observations 673R2 0.028Notes: Cluster robust standard errors in parentheses, the cluster is the variabledefined as ”cluster” in the KHDS.*** p<0.01, ** p<0.05, * p<0.1The dependent variables are variables defined at the child level. Refugee inten-sity is measured at the household level. Estimated with the variables describedin Table 14
17

6.3 Food prices
The data from the Kagera Health and Development Survey (KHDS) reported in Table
12 below show that prices increased slightly from 1992 to 1994 and then, as expected,
increased sharply from 1994 to 2004. The literature confirms this trends.Alix-Garcia
and Saah (2010) shows that the refugee influx led to an increase in the prices of non-aid
food items whereas aid-related food items experienced modest changes in prices.
Table 12: Food prices
1991 1992 1993 1994 2004
Aid-related food 502.18 777.45 880.69 716.58 3264.08Non-aid related food 1404.51 1495.72 1733.71 1953.1 7600.51Total 1974.67 2325.28 2614.40 2769.68 10864.59
7 Robustness checks
In this section we check the robustness of our estimates clustering the standard errors
at the ward level rather than at the cluster (community) level. Table 13 shows the
results are robust to the different specification of the clustering.
18
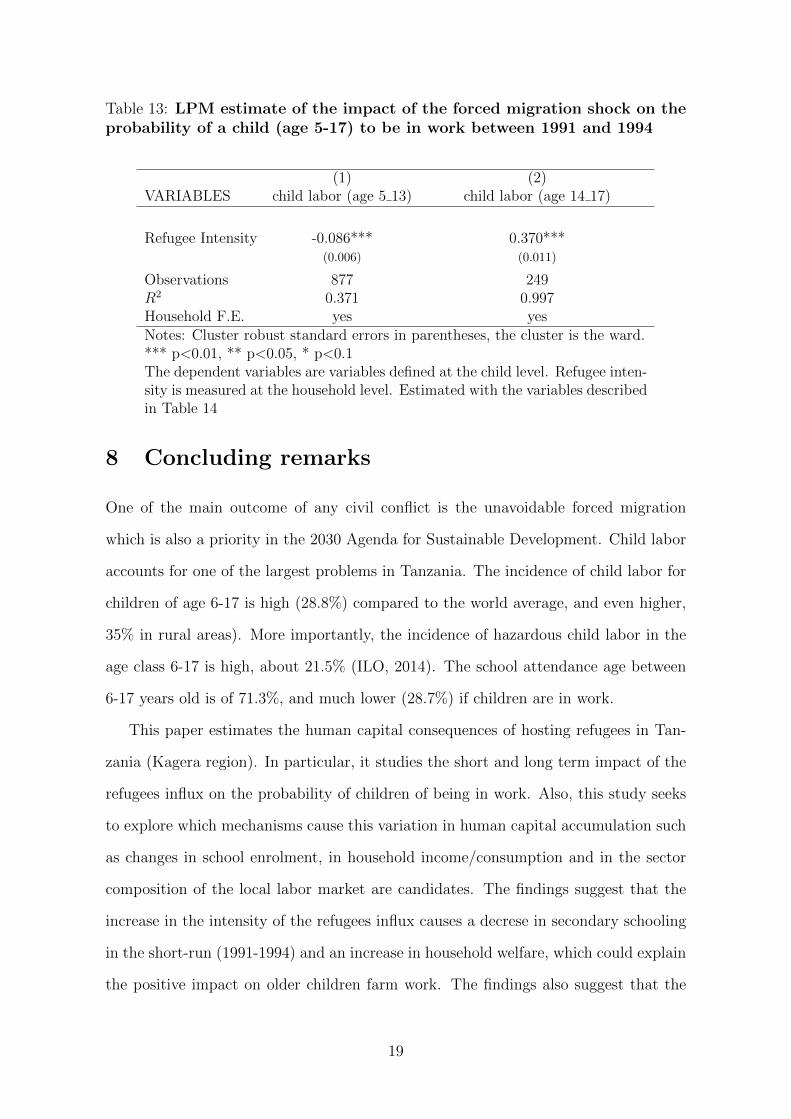
Table 13: LPM estimate of the impact of the forced migration shock on theprobability of a child (age 5-17) to be in work between 1991 and 1994
(1) (2)VARIABLES child labor (age 5 13) child labor (age 14 17)
Refugee Intensity -0.086*** 0.370***(0.006) (0.011)
Observations 877 249R2 0.371 0.997Household F.E. yes yesNotes: Cluster robust standard errors in parentheses, the cluster is the ward.*** p<0.01, ** p<0.05, * p<0.1The dependent variables are variables defined at the child level. Refugee inten-sity is measured at the household level. Estimated with the variables describedin Table 14
8 Concluding remarks
One of the main outcome of any civil conflict is the unavoidable forced migration
which is also a priority in the 2030 Agenda for Sustainable Development. Child labor
accounts for one of the largest problems in Tanzania. The incidence of child labor for
children of age 6-17 is high (28.8%) compared to the world average, and even higher,
35% in rural areas). More importantly, the incidence of hazardous child labor in the
age class 6-17 is high, about 21.5% (ILO, 2014). The school attendance age between
6-17 years old is of 71.3%, and much lower (28.7%) if children are in work.
This paper estimates the human capital consequences of hosting refugees in Tan-
zania (Kagera region). In particular, it studies the short and long term impact of the
refugees influx on the probability of children of being in work. Also, this study seeks
to explore which mechanisms cause this variation in human capital accumulation such
as changes in school enrolment, in household income/consumption and in the sector
composition of the local labor market are candidates. The findings suggest that the
increase in the intensity of the refugees influx causes a decrese in secondary schooling
in the short-run (1991-1994) and an increase in household welfare, which could explain
the positive impact on older children farm work. The findings also suggest that the
19
increase in the intensity of the refugees influx causes an increase in household’s welfare
in the short-run (1991-1994) and an increase in household welfare in the longer run
(1991-2004), which could explain the negative impact on young children work in the
short-run and the positive impact on all children’s probability to work in the longer
run. Food prices increased over time, which could be the reason why the increase in
child work over time was concentrated in the agricultural sector.
The policy implication of this study is to suggest that in rural areas where children
are more involved in farm work, micro-finance programs or government interventions
aimed to increase agricultural productivity are particulary relevant in order to prevent
the involvement of children in working activities when household income drops low or
when an increase in agricultural prices makes subsistance agriculture a priority for the
household.
20

References
Alix-Garcia, Jennifer and David Saah, “The effect of refugee inflows on host
communities: evidence from Tanzania,” The World Bank Economic Review, 2010,
24 (1), 148–170.
Baez, Javier E, “Civil wars beyond their borders: The human capital and health
consequences of hosting refugees,” Journal of Development Economics, 2011, 96 (2),
391–408.
Balcells, Laia and Patricia Justino, “Bridging Micro and Macro Approaches on
Civil Wars and Political Violence Issues, Challenges, and the Way Forward,” Journal
of Conflict Resolution, 2014, 58 (8), 1343–1359.
Beegle, Kathleen, Rajeev Dehejia, Roberta Gatti, Sofya Krutikova et al.,
The consequences of child labor: evidence from longitudinal data in rural Tanzania,
World Bank Washington, DC, 2008.
Betts, Julian R and Magnus Lofstrom, “The educational attainment of immi-
grants: trends and implications,” in “Issues in the Economics of Immigration,”
University of Chicago Press, 2000, pp. 51–116.
Chamarbagwala, Rubiana and Hilcıas E Moran, “The human capital conse-
quences of civil war: Evidence from Guatemala,” Journal of Development Eco-
nomics, 2011, 94 (1), 41–61.
Gang, Ira N and Klaus F Zimmermann, “Is child like parent? Educational
attainment and ethnic origin,” Journal of Human Resources, 2000, pp. 550–569.
Heath, Anthony and Sin Yi Cheung, “Unequal chances: Ethnic minorities in
Western labour markets,” 2007.
Maystadt, Jean-Francois et al., “Poverty Reduction in a Refugee-Hosting Econ-
omy. A Natural Experiment,” in “2012 Conference, August 18-24, 2012, Foz do
21
Iguacu, Brazil” number 126259 International Association of Agricultural Economists
2012.
of Economic United Nations Population Division, Department and Social
Affairs, “Trends in International Migrant Stock: The 2015 Revision,” Technical
Report, United Nations database, POP/DB/MIG/Stock/Rev.201 2015.
Ruiz, Isabel and Carlos Vargas-Silva, “The labour market consequences of hosting
refugees,” Journal of Economic Geography, 2016, 16 (3), 667–694.
Trejo, Stephen J, “Intergenerational progress of Mexican-origin workers in the US
labor market,” Journal of Human Resources, 2003, 38 (3), 467–489.
Verwimp, Philip and Jan Van Bavel, “Schooling, violent conflict, and gender in
Burundi,” The World Bank Economic Review, 2014, 28 (2), 384–411.
Whitaker, Beth Elise, “Refugees in Western Tanzania: The distribution of burdens
and benefits among local hosts,” Journal of Refugee Studies, 2002, 15 (4), 339–358.
A Variables description
22
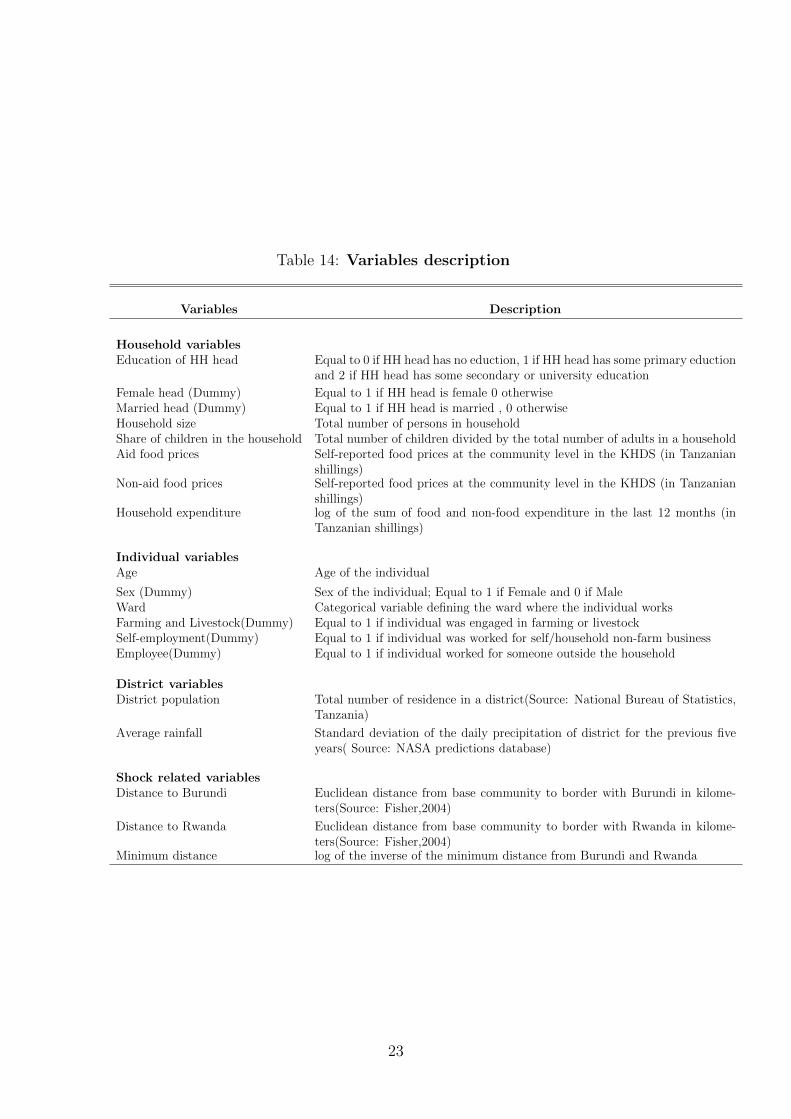
Table 14: Variables description
Variables Description
Household variablesEducation of HH head Equal to 0 if HH head has no eduction, 1 if HH head has some primary eduction
and 2 if HH head has some secondary or university education
Female head (Dummy) Equal to 1 if HH head is female 0 otherwiseMarried head (Dummy) Equal to 1 if HH head is married , 0 otherwiseHousehold size Total number of persons in householdShare of children in the household Total number of children divided by the total number of adults in a householdAid food prices Self-reported food prices at the community level in the KHDS (in Tanzanian
shillings)Non-aid food prices Self-reported food prices at the community level in the KHDS (in Tanzanian
shillings)Household expenditure log of the sum of food and non-food expenditure in the last 12 months (in
Tanzanian shillings)
Individual variablesAge Age of the individual
Sex (Dummy) Sex of the individual; Equal to 1 if Female and 0 if MaleWard Categorical variable defining the ward where the individual worksFarming and Livestock(Dummy) Equal to 1 if individual was engaged in farming or livestockSelf-employment(Dummy) Equal to 1 if individual was worked for self/household non-farm businessEmployee(Dummy) Equal to 1 if individual worked for someone outside the household
District variablesDistrict population Total number of residence in a district(Source: National Bureau of Statistics,
Tanzania)
Average rainfall Standard deviation of the daily precipitation of district for the previous fiveyears( Source: NASA predictions database)
Shock related variablesDistance to Burundi Euclidean distance from base community to border with Burundi in kilome-
ters(Source: Fisher,2004)
Distance to Rwanda Euclidean distance from base community to border with Rwanda in kilome-ters(Source: Fisher,2004)
Minimum distance log of the inverse of the minimum distance from Burundi and Rwanda
23

Table 15: Summary statistics
Variable Mean Std. Dev. Min. Max. N
Household levelEducation level of the HH head 1.027 0.114 0 2 16570HH head is married 0.134 0.072 0 1 16579HH head is female 0.065 0.044 0 1 16579Log(1/Distance to Burundi) -4.639 1.082 -5.335 0.511 15994Log(1/Distance to Rwanda) -4.193 0.902 -4.868 0.511 15994Household Size 8.149 4.383 1 34 16580Share of female 0.52 0.5 0 1 14321Child to adult ratio 1.237 1.022 0 7 15784Aid food pricesNon-aid food prices
Individual levelAge 25.082 19.57 0 110 14289Paid employment 0.074 0.261 0 1 11463Farm work 0.298 0.457 0 1 6950Self Employment 0.069 0.253 0 1 11900Child Labor 0.025 0.156 0 1 16580Youth Employment (15<Age<24) 0.068 0.252 0 1 16580School Enrolment (5<Age<17) 0.593 0.491 0 1 5036Ward 69.037 40.102 1 131 16580
District levelDistrict population per KM2 299.259 394.557 23.415 1010.85 16580Rain Sd 3.269 0.518 2.562 4.489 16574
24