Embed Size (px)
Citation preview
The Houston Economy, O&G Activity and the Implications for Commercial Real Estate
Harold Hunt, PhDReal Estate Center at Texas A&M
College Station, [email protected]
A Brief Economic Overview
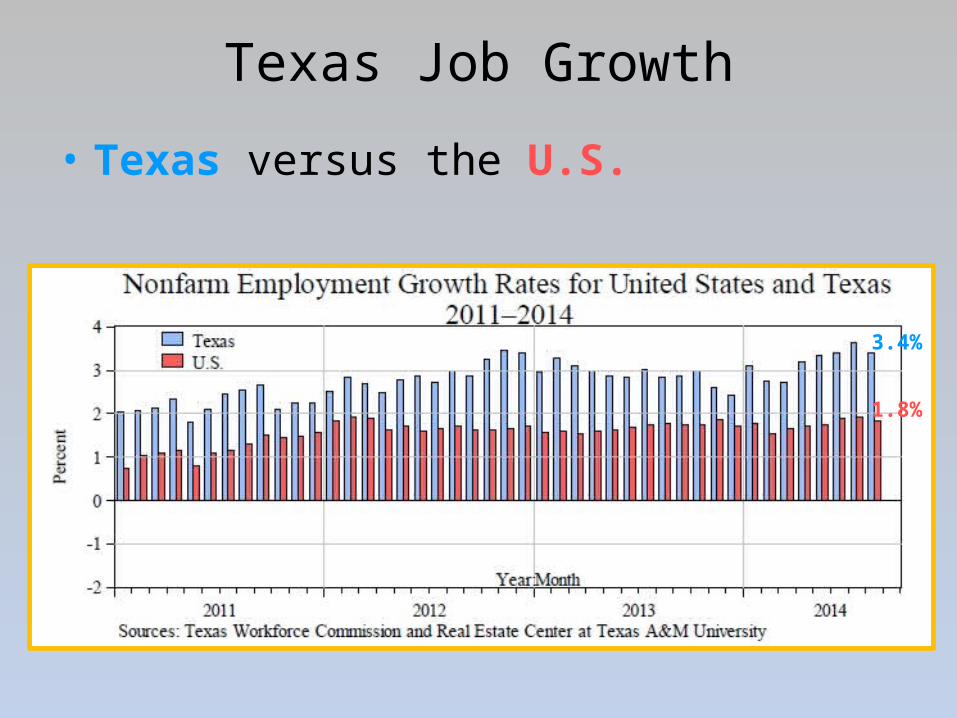
Texas Job Growth
• Texas versus the U.S.
3.4%
1.8%
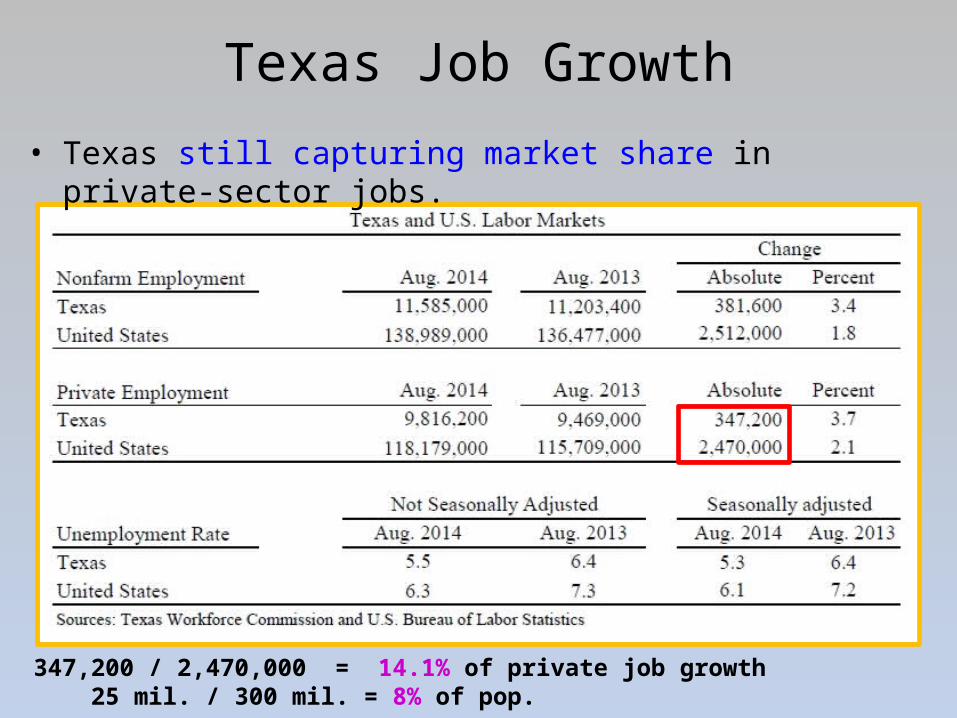
Texas Job Growth
• Texas still capturing market share in private-sector jobs.
347,200 / 2,470,000 = 14.1% of private job growth 25 mil. / 300 mil. = 8% of pop.
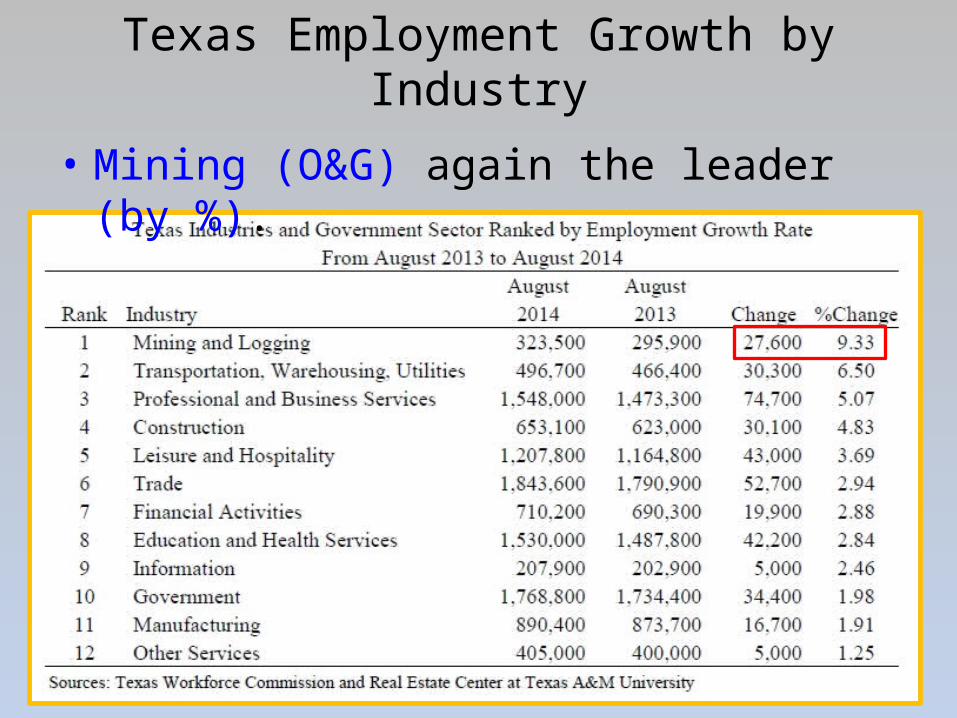
Texas Employment Growth by Industry
• Mining (O&G) again the leader (by %).

Texas Employment Growth by Industry
• Prof. & Bus. Services the absolute leader.

Fort WorthBryan/CSLongview
VictoriaDallasAustin
HoustonOdessa
Midland
0.0 1.0 2.0 3.0 4.0 5.0 6.0
2.9
3.1
3.3
3.3
3.4
3.7
3.9
4.6
5.6
Source: Texas Workforce Commission
Job Growth Past 12 MonthsEnding August, 2014
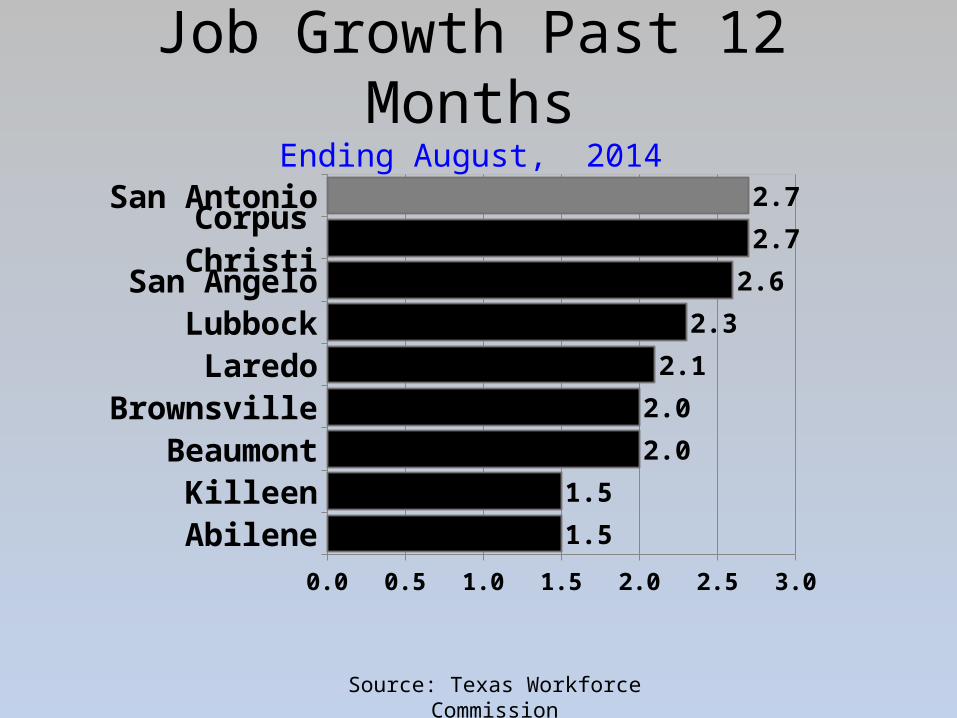
Job Growth Past 12 MonthsEnding August, 2014
AbileneKilleen
BeaumontBrownsville
LaredoLubbock
San AngeloCorpus Christi
San Antonio
0.0 0.5 1.0 1.5 2.0 2.5 3.0
1.5
1.5
2.0
2.0
2.1
2.3
2.6
2.7
2.7
Source: Texas Workforce Commission

Job Growth Past 12 MonthsEnding August, 2014
Wichita FallsAmarillo
TylerSherman
TexarkanaWaco
El PasoMcAllen
-1.0 -0.5 0.0 0.5 1.0 1.5 2.0
-0.5
0.3
0.4
0.7
0.9
1.4
1.4
1.5
Source: Texas Workforce Commission

Houston MSA Employment and Annual Employment Growth by Category
( August, 2014)
Source: Texas Workforce Commission
Biggest absolute increase in jobs
Biggest % increase in jobs
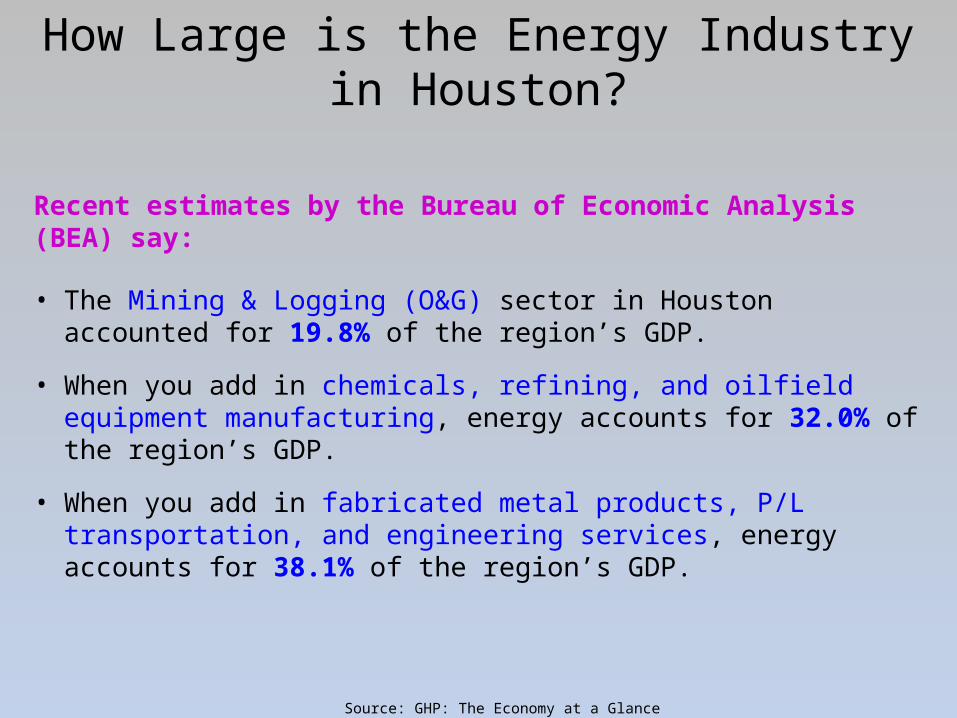
How Large is the Energy Industry in Houston?
Recent estimates by the Bureau of Economic Analysis (BEA) say:
• The Mining & Logging (O&G) sector in Houston accounted for 19.8% of the region’s GDP.
• When you add in chemicals, refining, and oilfield equipment manufacturing, energy accounts for 32.0% of the region’s GDP.
• When you add in fabricated metal products, P/L transportation, and engineering services, energy accounts for 38.1% of the region’s GDP.
Source: GHP: The Economy at a Glance Oct. 2014

So Where is the Energy Sector Headed?
The most critical question for real estate professionals still seems to be:
• How long will the drilling activity in Texas last?

First, a Quick Overview

Active Drilling Rigs in Texas(As of October 17th, 2014)
Source: Baker Hughes

Rig Counts(Land Rigs: October 17th, 2014 vs October 18th, 2013)
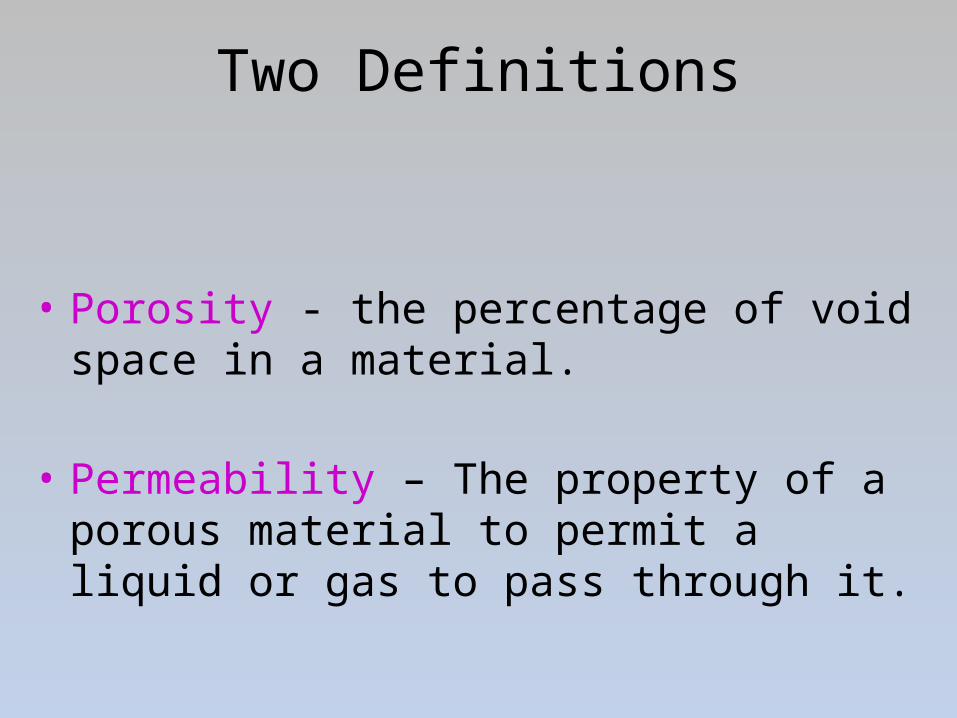
Two Definitions
• Porosity - the percentage of void space in a material.
• Permeability – The property of a porous material to permit a liquid or gas to pass through it.

Permeability of Shale
Source: SPE International
ShalesMid-East
Reservoirs
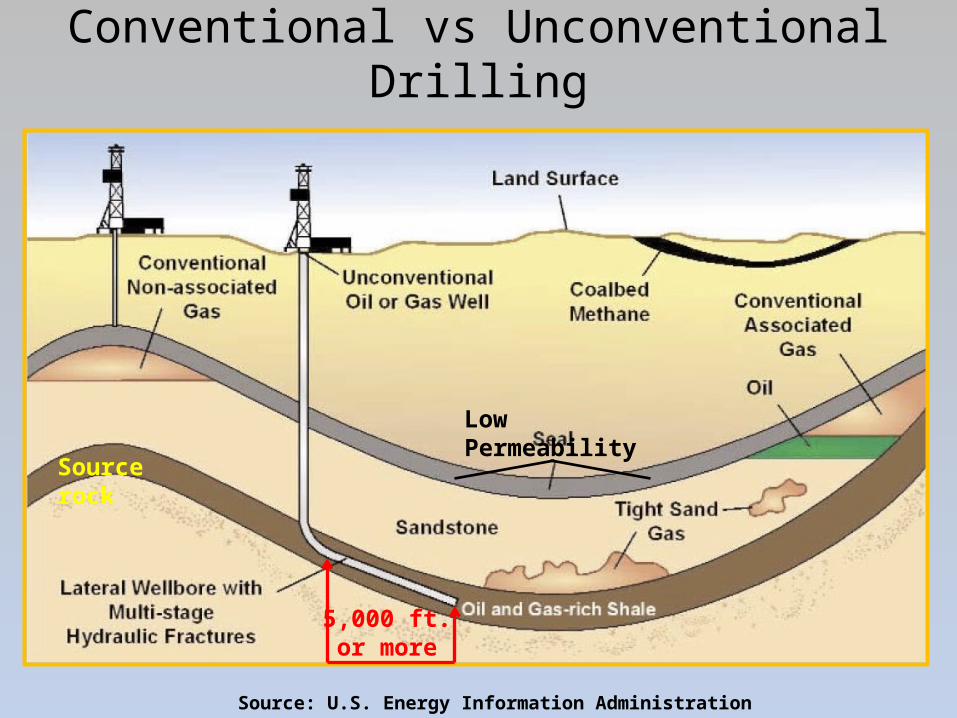
Conventional vs Unconventional Drilling
Source: U.S. Energy Information Administration
5,000 ft. or more
Source rock
Low Permeability

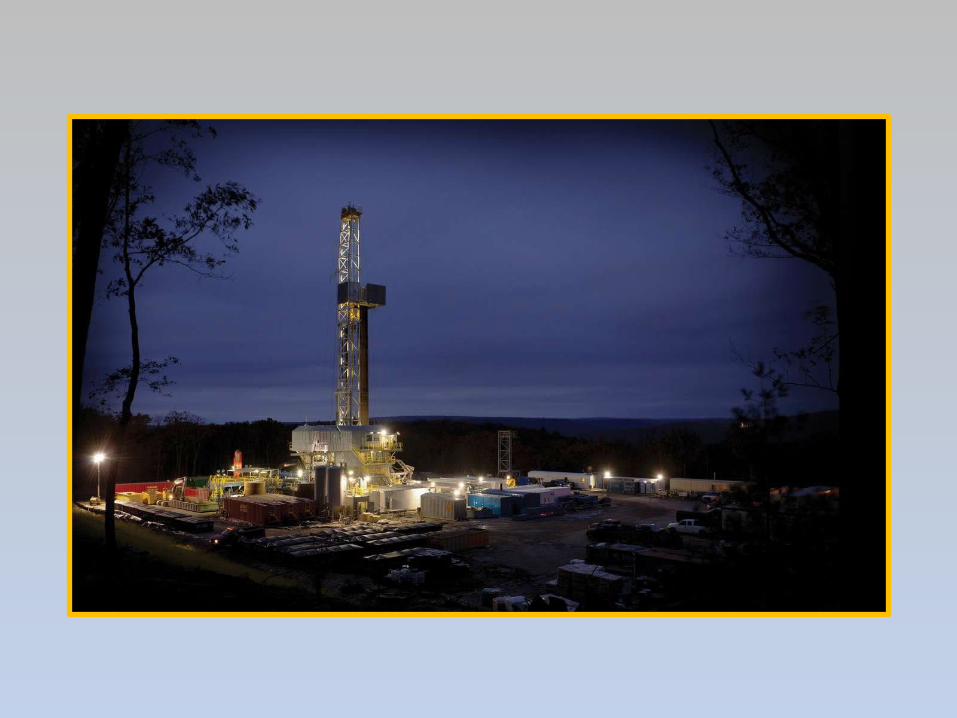
Equipment to Fracture a Well

My Early Prediction of the Length of Eagle Ford Drilling Activity
The Dallas Federal Reserve reported that 5 mil. acres of the Eagle Ford are under lease.
So I assumed:– 4 mil. acres/200 acres drained per well = 20k total wells
– 250 rigs x 5 wells drilled per yr. = 1,250 wells per yr.
– 20k wells needed/1,250 wells per yr. = 16 years to drill
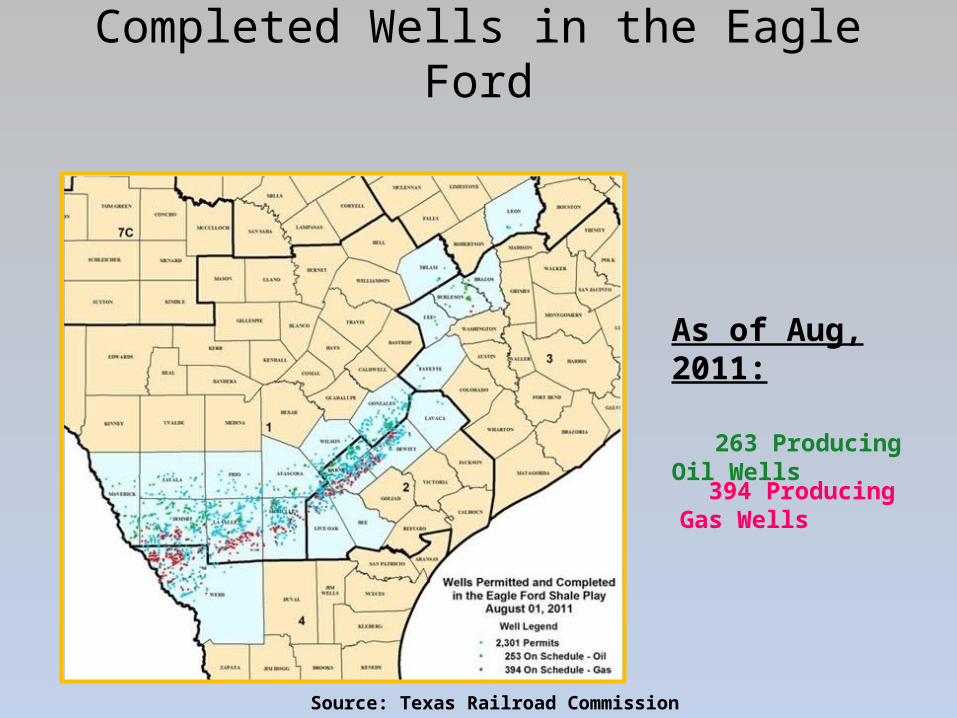
Completed Wells in the Eagle Ford
Source: Texas Railroad Commission
263 Producing Oil Wells
394 Producing Gas Wells
As of Aug, 2011:

Completed Wells in the Eagle Ford
Source: Texas Railroad Commission
1,690 Producing Oil Wells
710 Producing Gas Wells
As of July, 2012:
An Increase of:
1,427 Producing Oil Wells
316 Producing Gas Wells
Total Increase: 1,743 wells
11 Months Later…

Completed Wells in the Eagle Ford
Source: Texas Railroad Commission
3,868 Producing Oil Wells
1,681 Producing Gas Wells
As of July, 2013:
An Increase of:
2,178 Producing Oil Wells
971 Producing Gas Wells
Total Increase: 3,149 wells
12 Months Later…

Completed Wells in the Eagle Ford
Source: Texas Railroad Commission
6,414 Producing Oil Wells
3,214 Producing Gas Wells
As of July, 2014:
An Increase of:
2,546 Producing Oil Wells
1,533 Producing Gas Wells
Total Increase: 4,079 wells
12 Months Later…
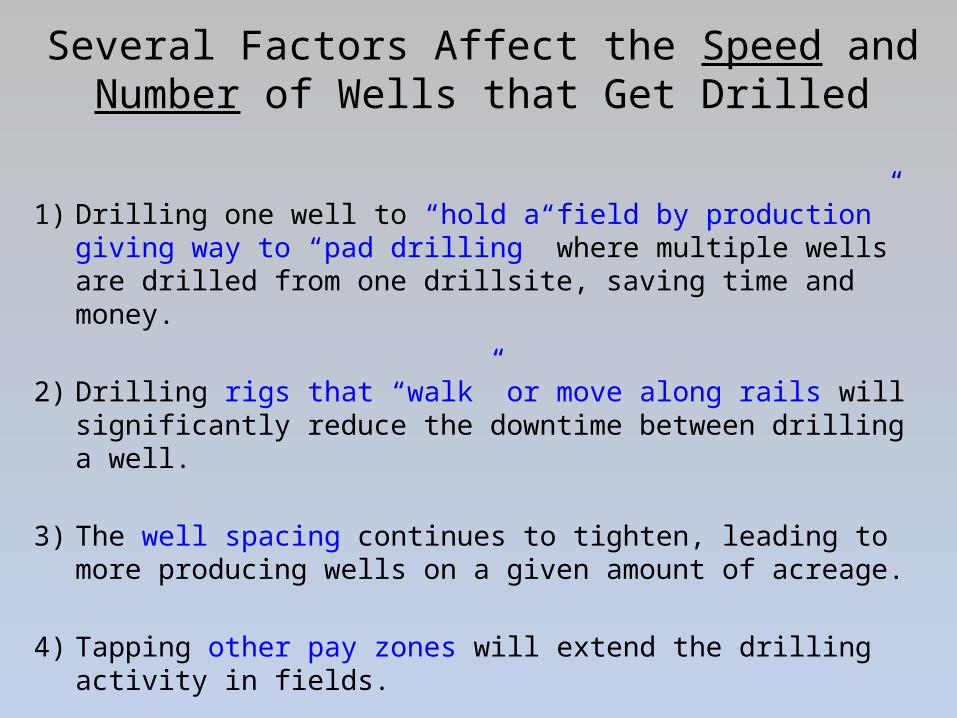
Several Factors Affect the Speed and Number of Wells that Get Drilled
1) Drilling one well to “hold a field by production” giving way to “pad drilling” where multiple wells are drilled from one drillsite, saving time and money.
2) Drilling rigs that “walk” or move along rails will significantly reduce the downtime between drilling a well.
3) The well spacing continues to tighten, leading to more producing wells on a given amount of acreage.
4) Tapping other pay zones will extend the drilling activity in fields.
1) Evolution to Pad Drilling

Pad Drilling Example

Karnes Co. Drilling Pads
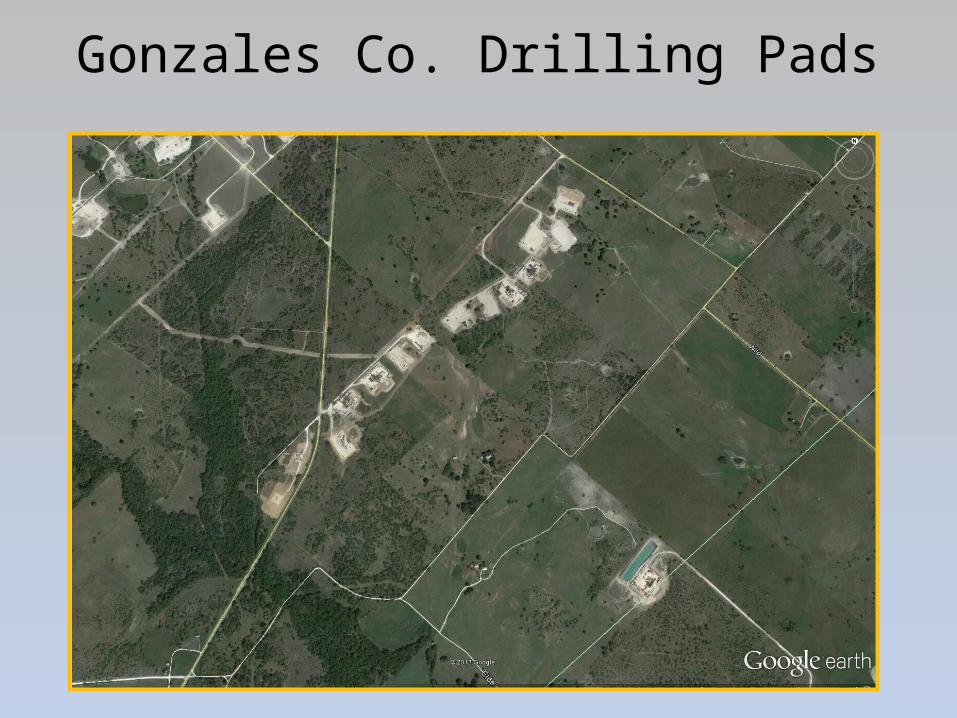
Gonzales Co. Drilling Pads

2 Wells On One Pad in Gonzales Co.

3 Wells On One Pad in Gonzales Co.

4 Wells Just Drilled by EOG in Gonzales Co. (using FracFocus.org)
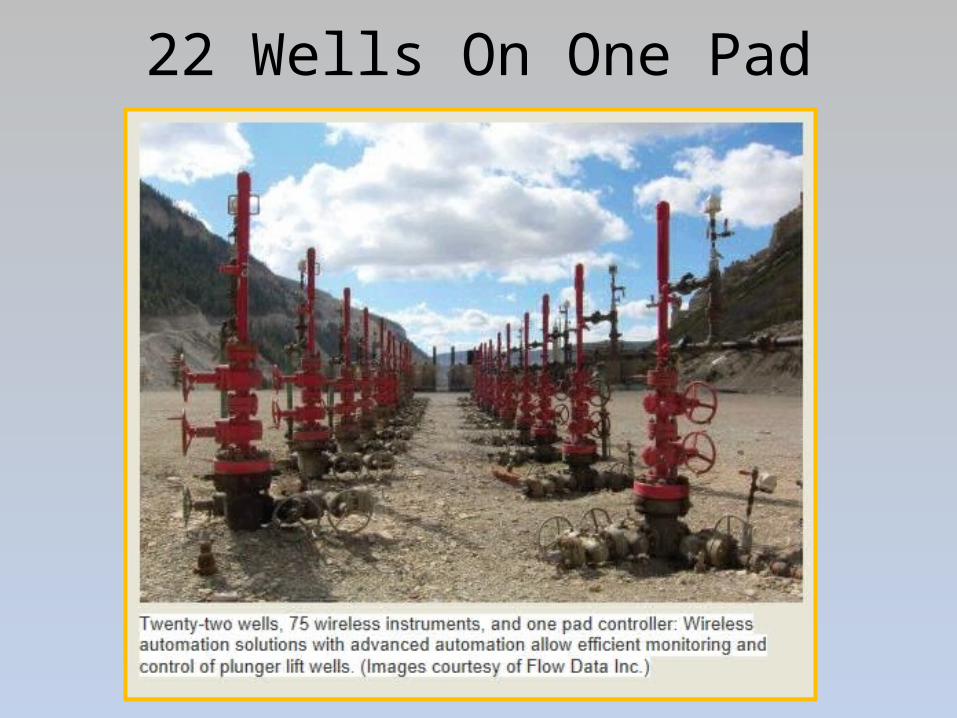
22 Wells On One Pad
2) Moving the Rigs Gets Faster
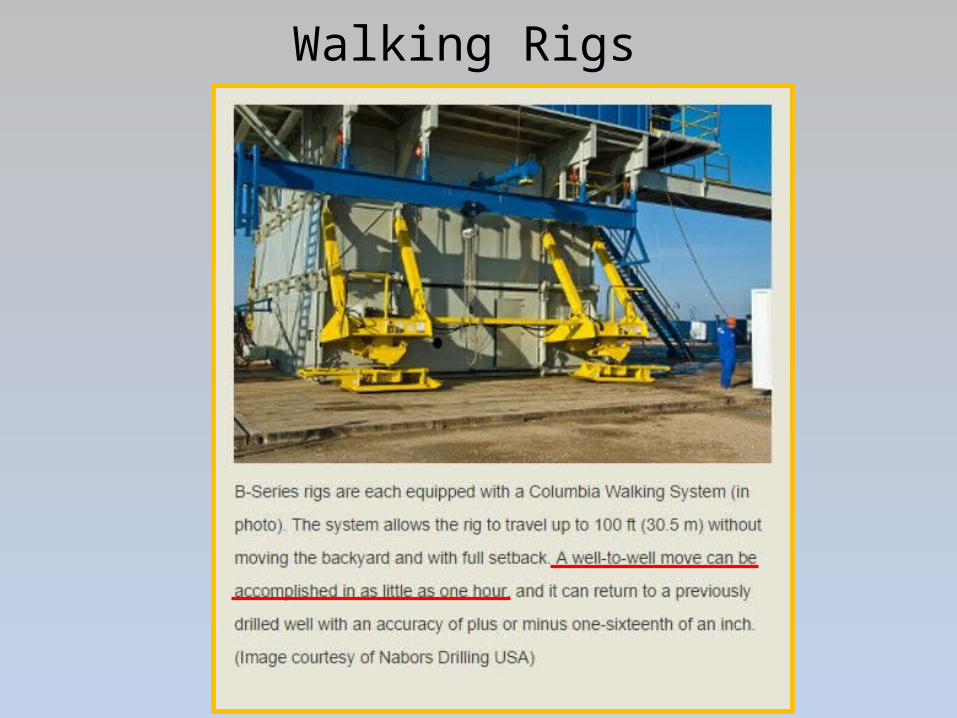
Walking Rigs
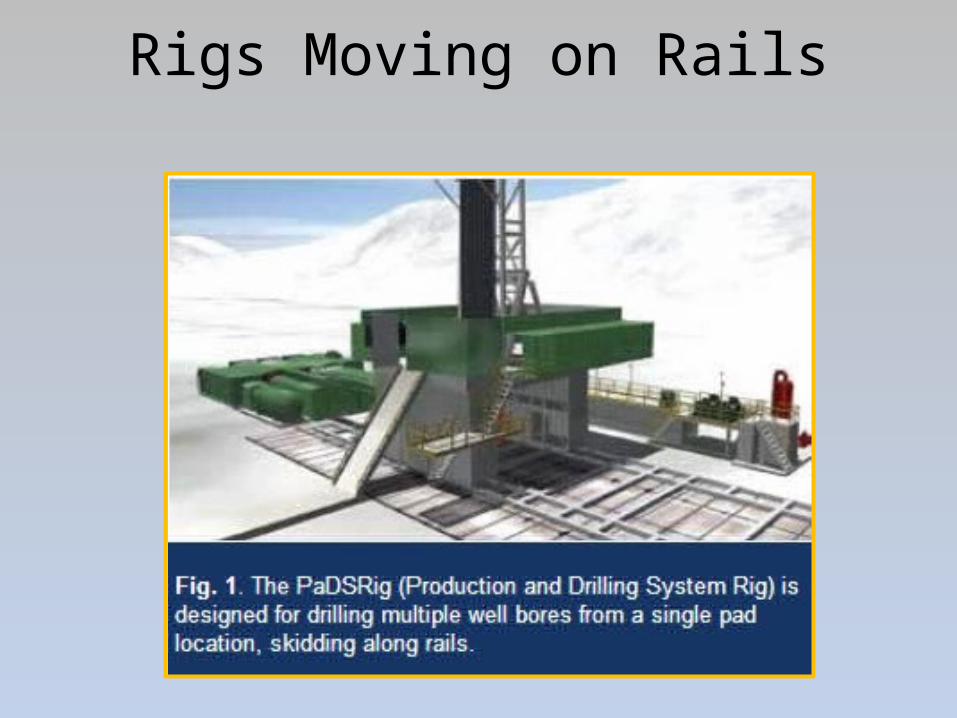
Rigs Moving on Rails
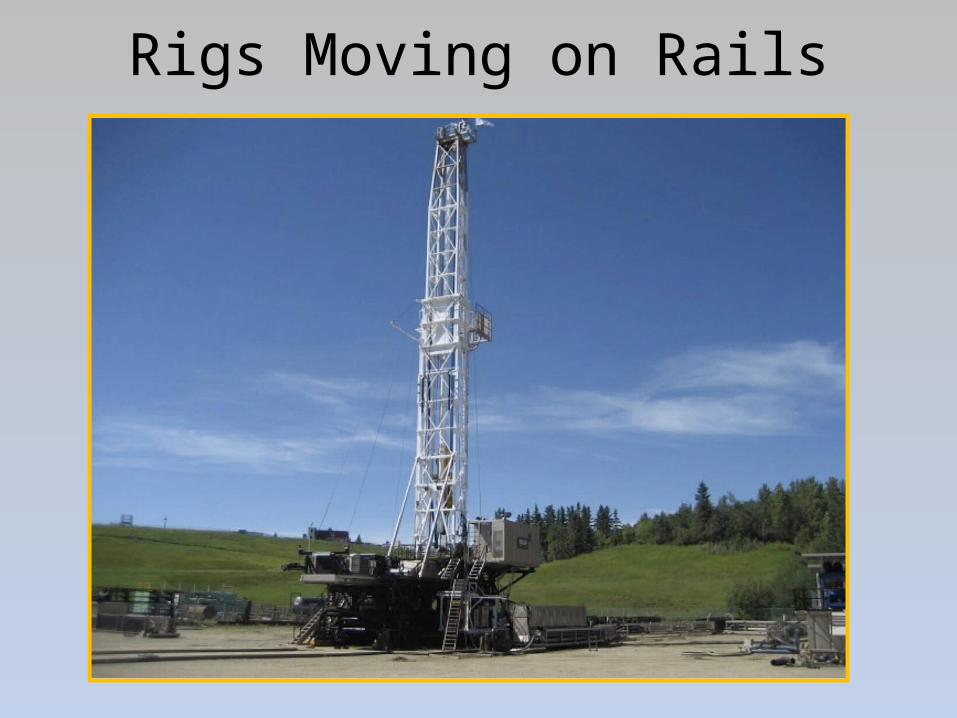
Rigs Moving on Rails

Piping Moves With Rig Movement

Increasing Efficiency Begins to Show Up
Source: Baker Hughes Quarterly Well Count Report
Started 1 well every 24 days
Started 1 well every 16 days
2012 Q1
2014 Q3
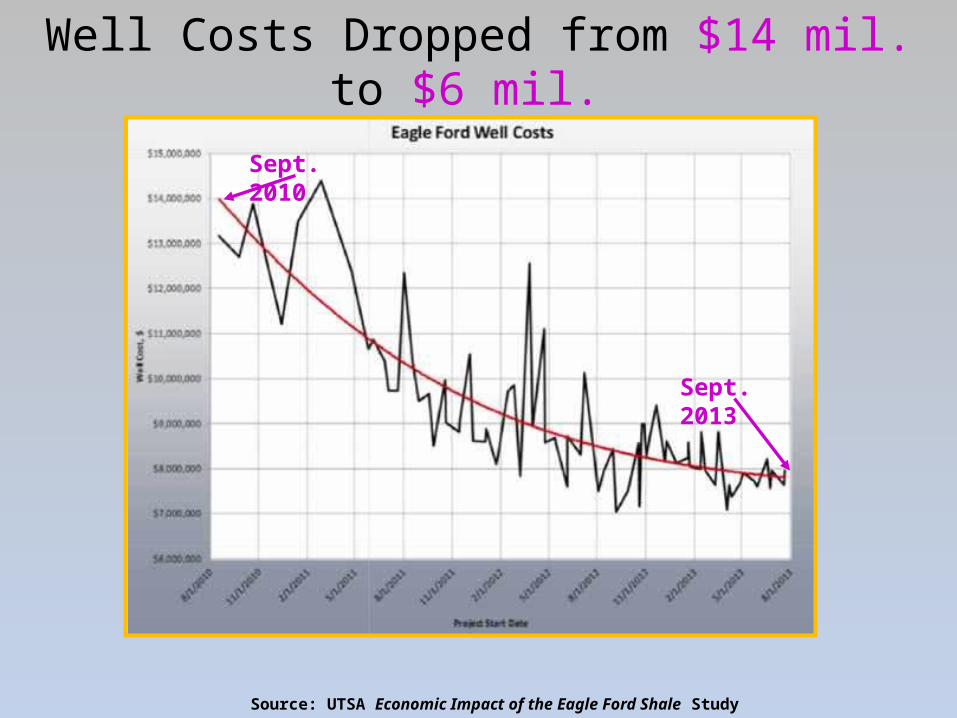
Well Costs Dropped from $14 mil. to $6 mil.
Source: UTSA Economic Impact of the Eagle Ford Shale Study
Sept. 2010
Sept. 2013

3) Well Spacing Gets Tighter
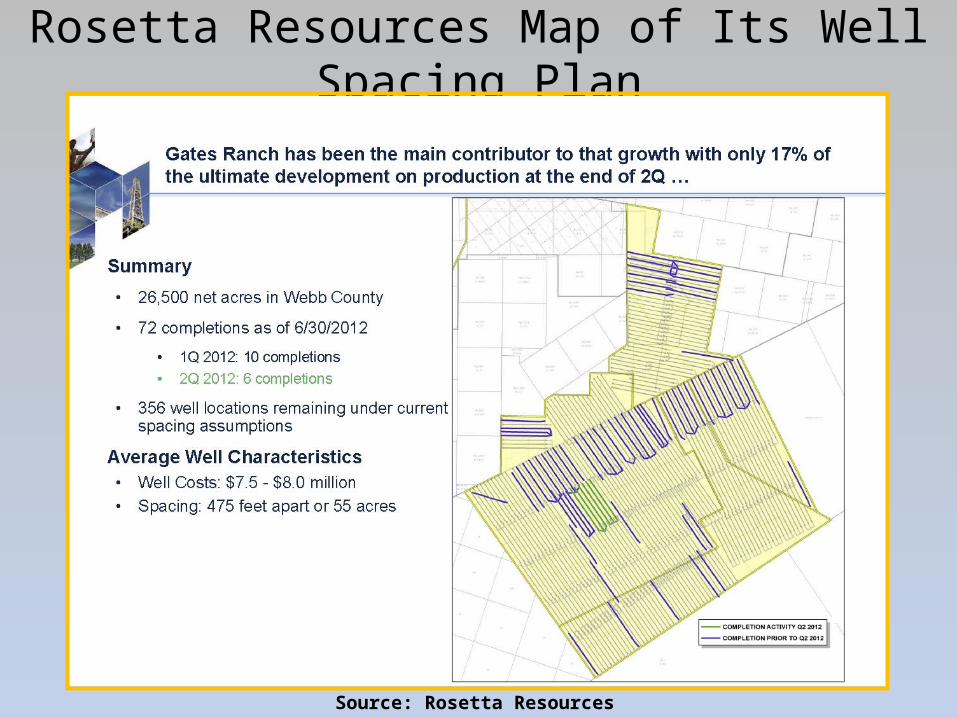
Rosetta Resources Map of Its Well Spacing Plan
Source: Rosetta Resources
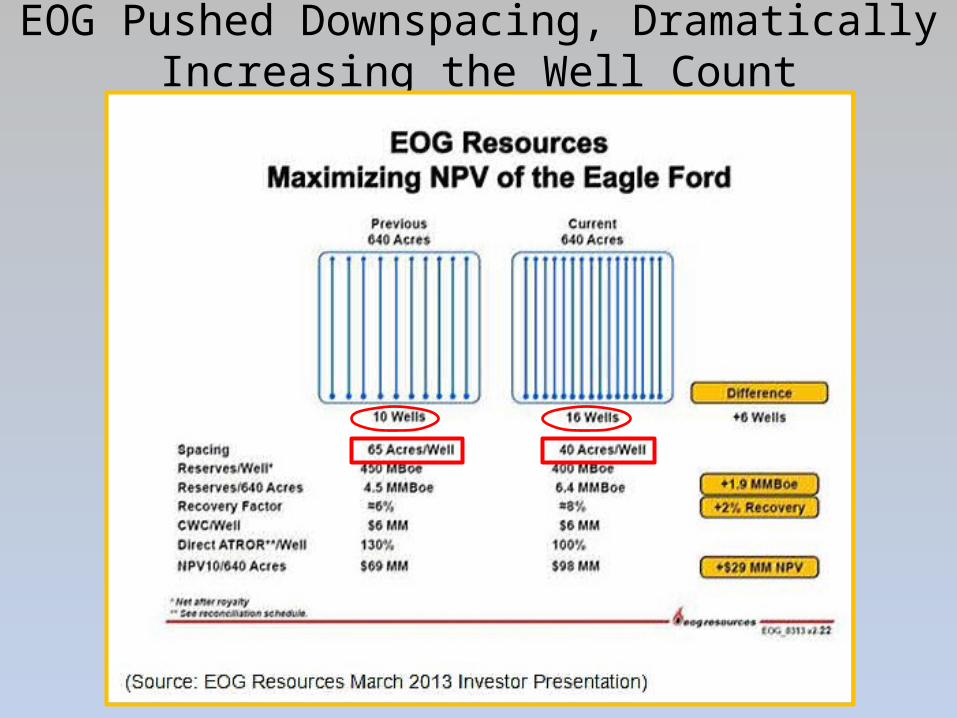
EOG Pushed Downspacing, Dramatically Increasing the Well Count

Factors to Consider With Increased Downspacing
1) When laterals get close enough, they start to rob production from each other.
2) A Marathon test showed two wells on 40-acre spacing each had about 80% of the recovery as one well on 80-acre spacing.
Ex. 1 well @ 80 acres produces 1,000 bbls of oil (Total = 1,000 bbls)vs
2 wells @ 40 acres produce 800 bbls of oil each (Total = 1,600 bbls)
3) So increased production from downspacing must be weighed against increased well cost.

4) Tapping Other Pay Zones in the Future
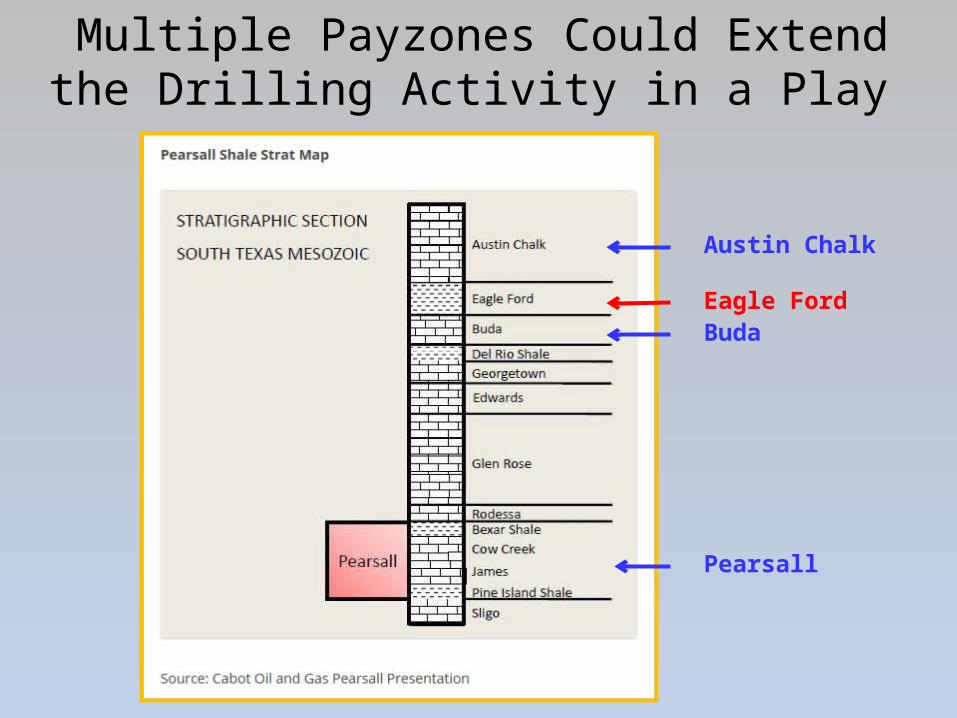
Multiple Payzones Could Extend the Drilling Activity in a Play
Eagle Ford
Austin Chalk
Pearsall
Buda

Pearsall
13 Payzones identified so far by Pioneer
The Permian
Multiple Payzones Could Extend the Drilling Activity in a Play

Vertical Wells versus Horizontal Wells Using Pad Drilling
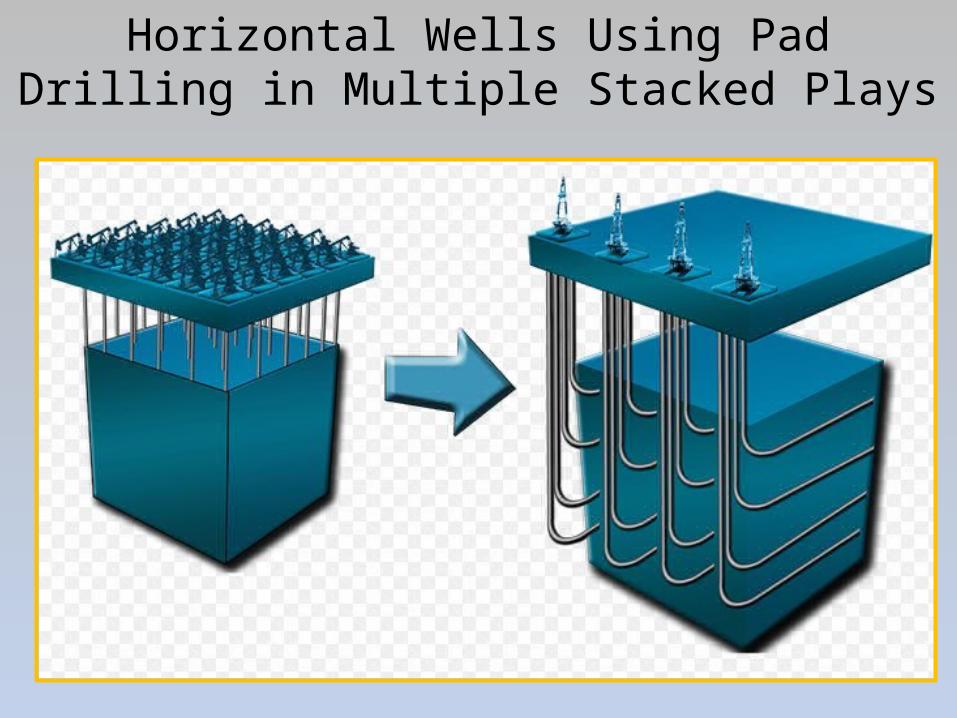
Horizontal Wells Using Pad Drilling in Multiple Stacked Plays

Also Experimenting With “Stacked Lateral” Development
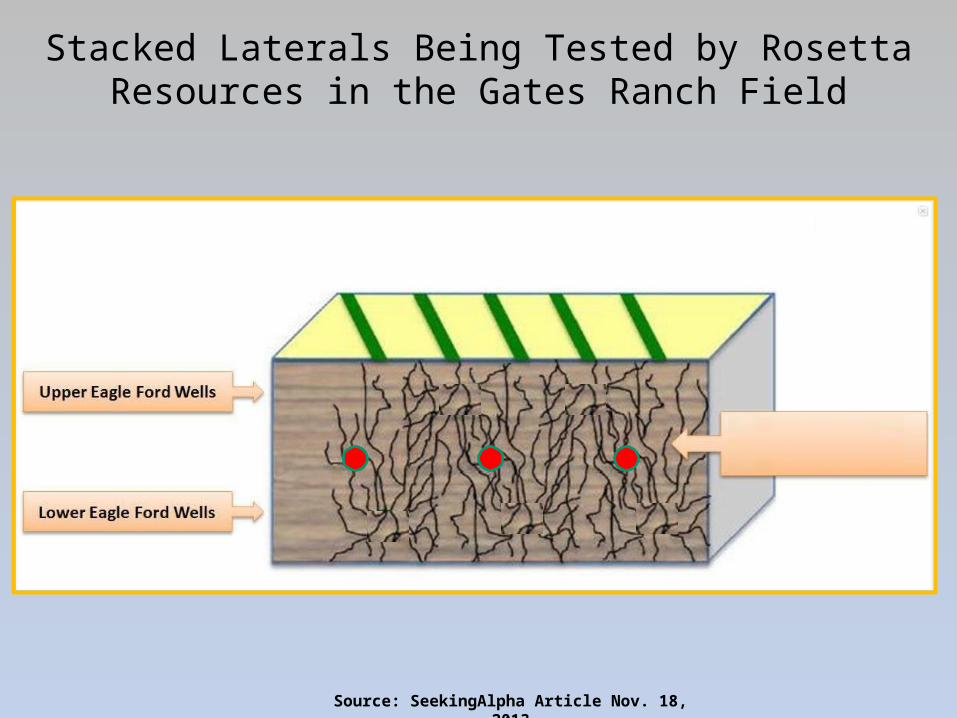
Stacked Laterals Being Tested by Rosetta Resources in the Gates Ranch Field
Source: SeekingAlpha Article Nov. 18, 2013
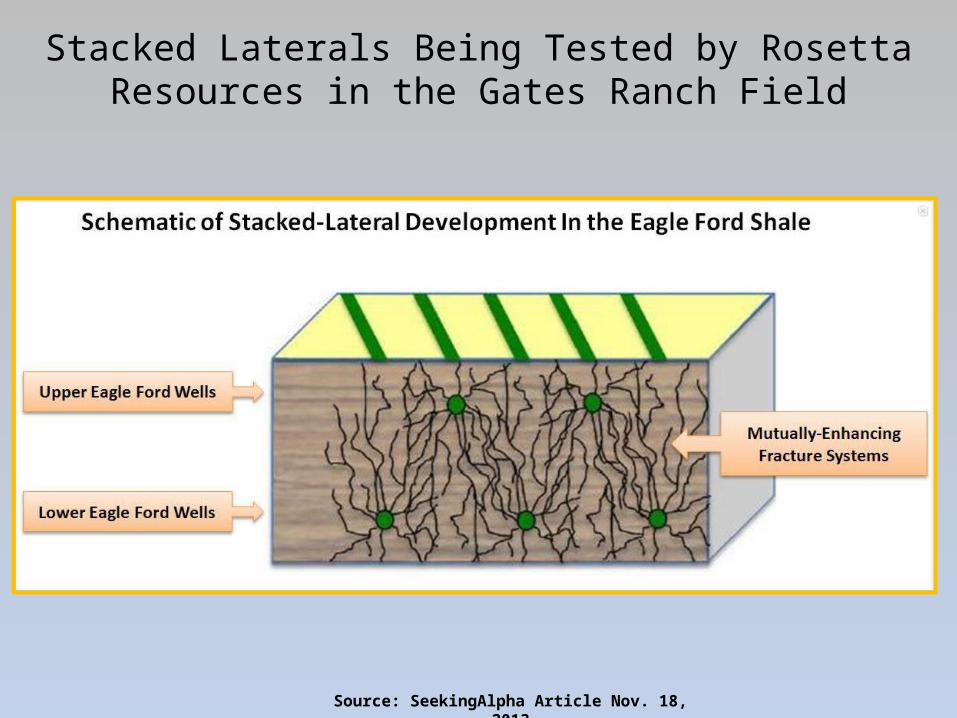
Stacked Laterals Being Tested by Rosetta Resources in the Gates Ranch Field
Source: SeekingAlpha Article Nov. 18, 2013

Finally, there may also be “secondary recovery” (ex. re-fracking) activity on
early wells now in decline

My Revised Guess of Future Eagle Ford Drilling Activity
The Dallas Federal Reserve reported that 5 mil. acres of the Eagle Ford are under lease.
So my latest guess is:– 4 mil. acres/80 acres drained per well = 50k total wells
– 200 rigs x 20 wells drilled per yr. = 4,000 wells per yr.
– 50k wells needed/4,000 wells per yr. = 12.5 years to drill
* Without considering: 1) multiple payzones or 2) secondary recovery.
What Could Derail This O&G “Boom”
• A major breakthrough in renewables (wind, solar, etc.)
• Water availability or contamination endangering aquifers or surface
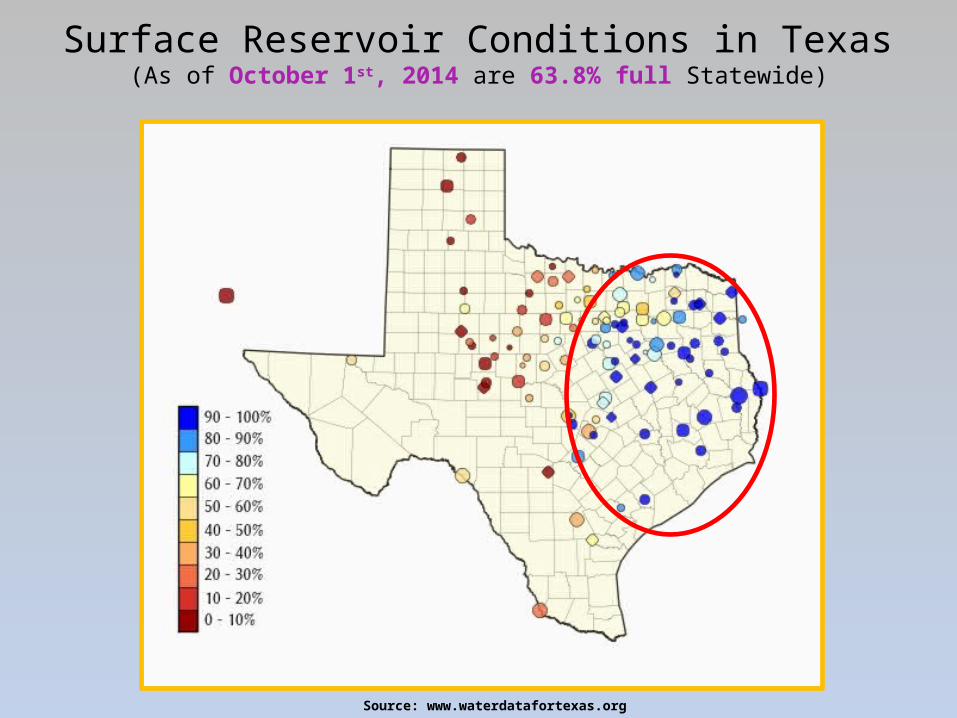
Surface Reservoir Conditions in Texas(As of October 1st, 2014 are 63.8% full Statewide)
Source: www.waterdatafortexas.org
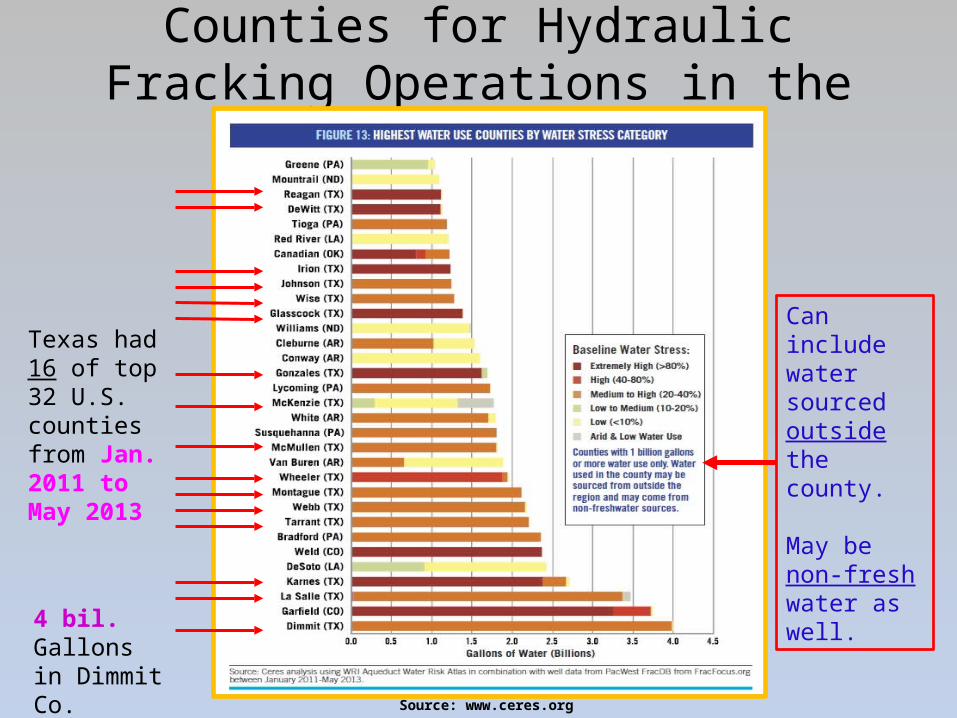
Top 32 Highest Water Use Counties for Hydraulic Fracking Operations in the U.S.
Source: www.ceres.org
Texas had 16 of top 32 U.S. counties from Jan. 2011 to May 2013
Can include water sourced outside the county.
May be non-fresh water as well.
4 bil. Gallons in Dimmit Co.
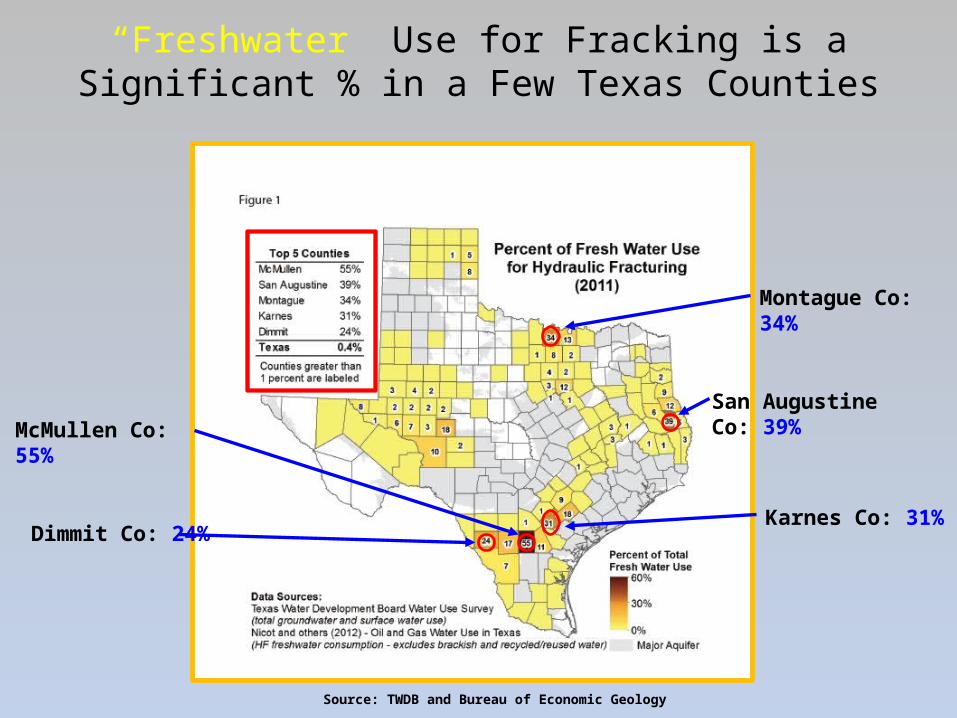
“Freshwater” Use for Fracking is a Significant % in a Few Texas Counties
Source: TWDB and Bureau of Economic Geology
McMullen Co: 55%San Augustine Co: 39%
Karnes Co: 31%Dimmit Co: 24%
Montague Co: 34%
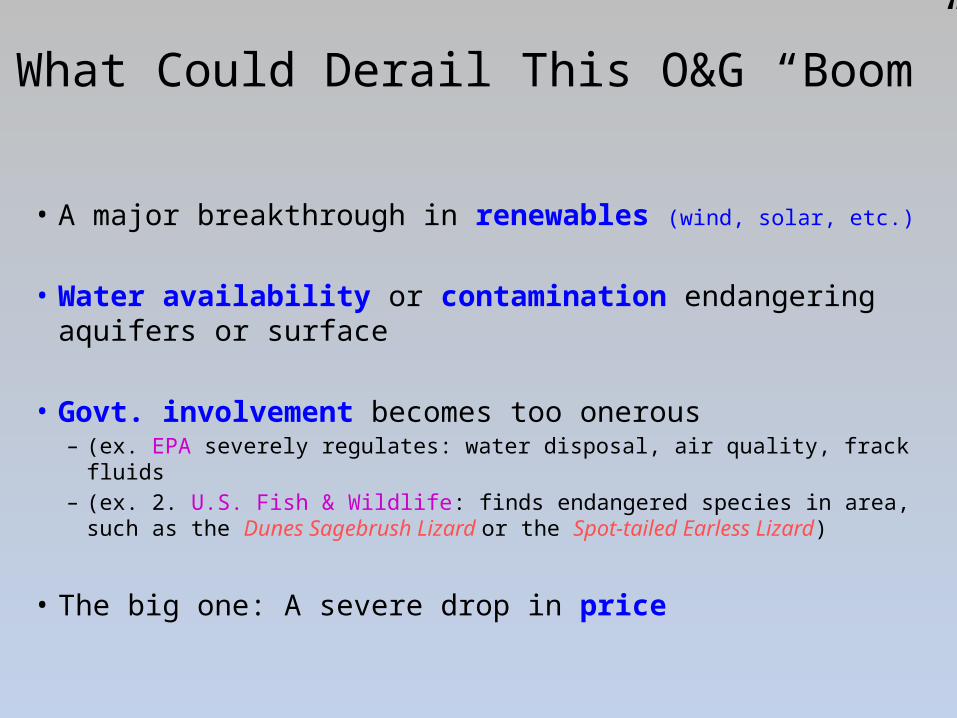
What Could Derail This O&G “Boom”
• A major breakthrough in renewables (wind, solar, etc.)
• Water availability or contamination endangering aquifers or surface
• Govt. involvement becomes too onerous – (ex. EPA severely regulates: water disposal, air quality, frack fluids– (ex. 2. U.S. Fish & Wildlife: finds endangered species in area, such as the
Dunes Sagebrush Lizard or the Spot-tailed Earless Lizard)
• The big one: A severe drop in price
Estimates of Breakeven Prices

U.S. Shale Gas Resources by Breakeven Cost
$4.00/mcf
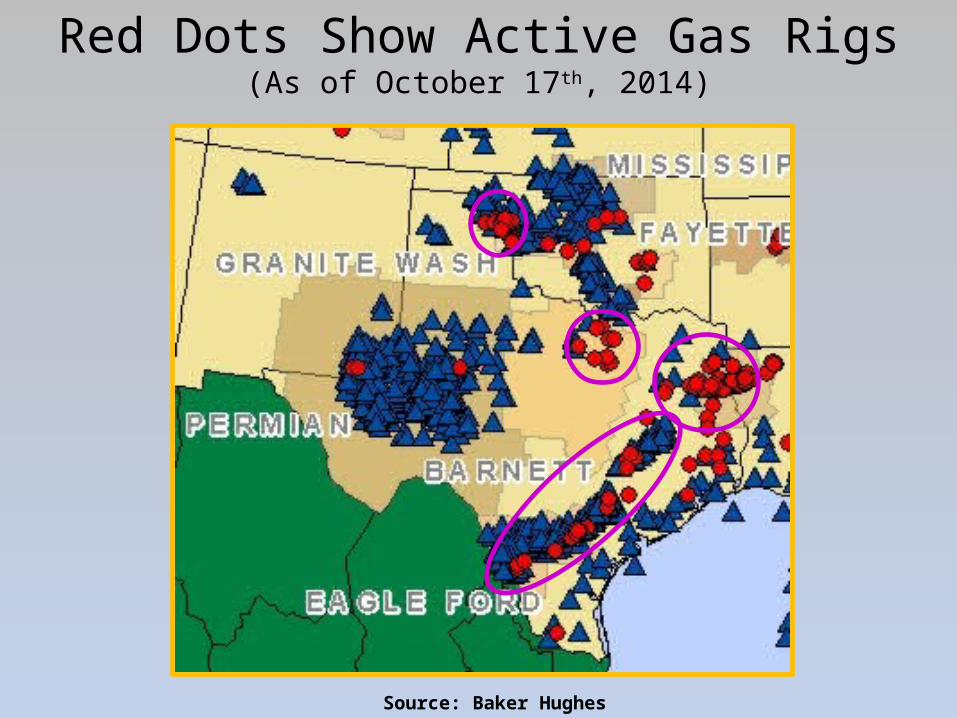
Red Dots Show Active Gas Rigs(As of October 17th, 2014)
Source: Baker Hughes
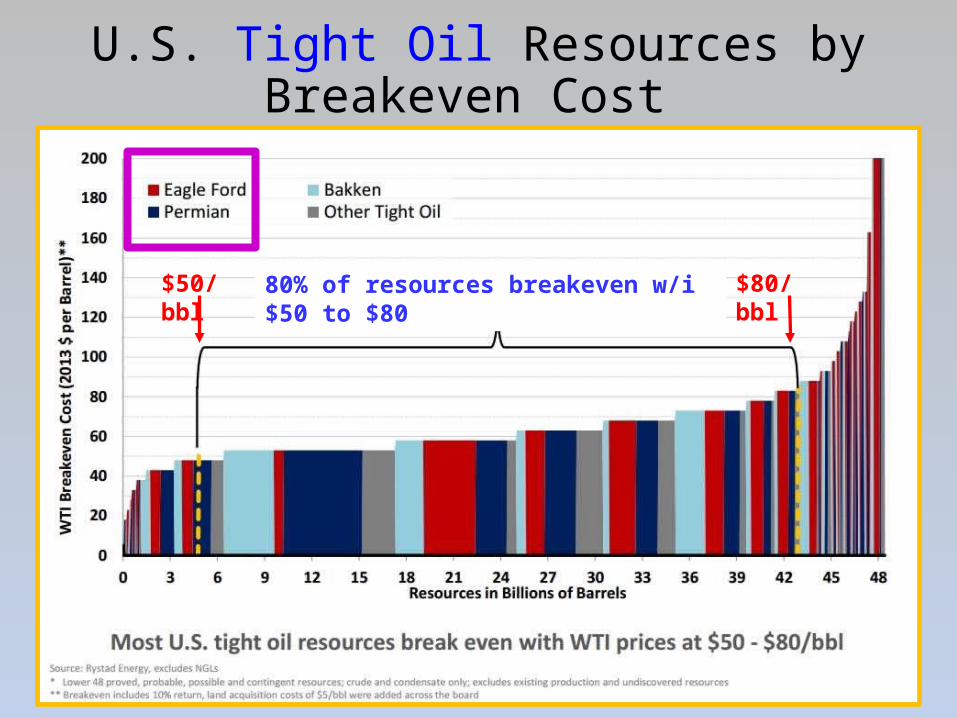
U.S. Tight Oil Resources by Breakeven Cost
$50/bbl $80/bbl80% of resources breakeven w/i $50 to $80

Blue Dots Show Active Oil Rigs(As of October 17th, 2014)
Source: Baker Hughes

Unknowns that Could Affect Price
1) How fast will technology improve?o Miscellaneous Possible Gamechangers (Glori Energy: microbes in
conventional wells; Siluria: dry natural gas to diesel/gasoline)
o Drilling costs (faster drilling times, cheaper completion techniques, etc.)
o Recovery rates of O&G in place improve
o Well decline rates improve
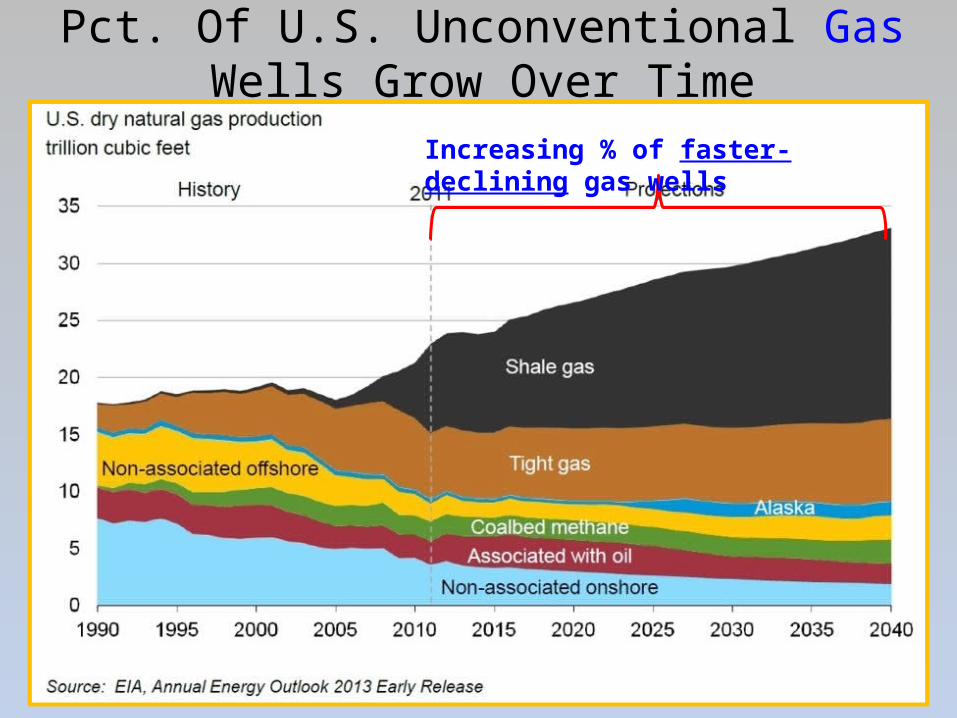
Pct. Of U.S. Unconventional Gas Wells Grow Over Time
Increasing % of faster-declining gas wells

Pct. Of U.S. Unconventional Oil Wells Grow Over Time
Increasing % of faster-declining oil wells

1 2 3 4 5 6 7 8 9 10 11 12 13 14 15 16 17 18 19 20 21 22 23 24 25 26 27 28 29 300
250
500
750
1000
1250
1500
1750
2000
2250
2500
2750
3000
Conventional
Unconventional vs Conventional O&G Well Lifetime Production Curves
Years
Prod
uctio
n Ra
te
Unconventional
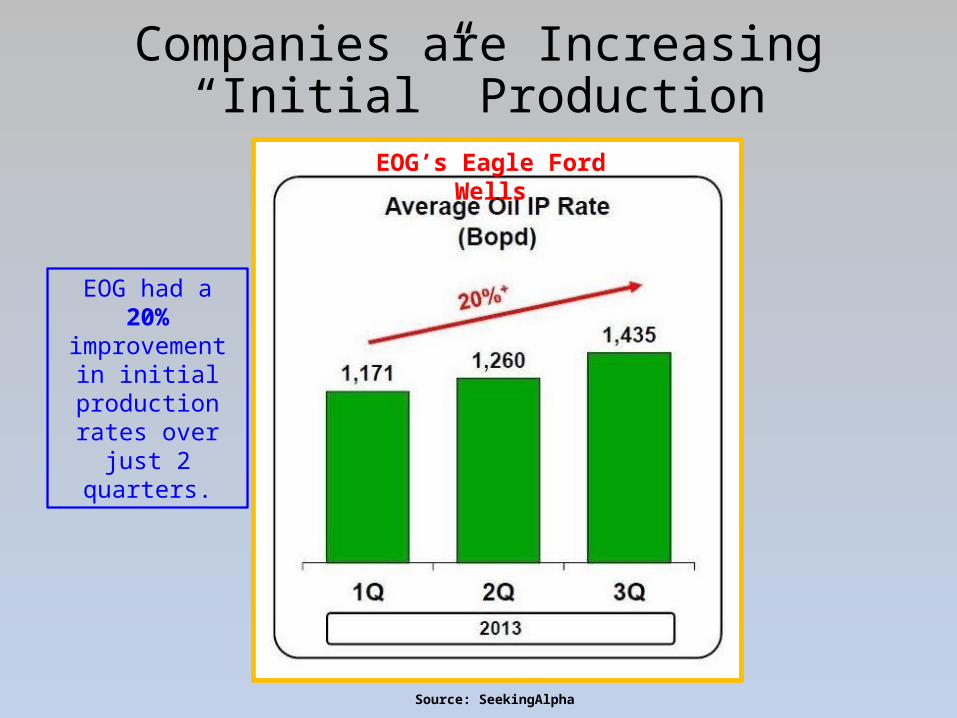
Companies are Increasing “Initial” Production
Source: SeekingAlpha
EOG’s Eagle Ford Wells
EOG had a 20% improvement in
initial production rates over just 2
quarters.

1 2 3 4 5 6 7 8 9 10 11 12 13 14 15 16 17 18 19 20 21 22 23 24 25 26 27 28 29 300
250
500
750
1000
1250
1500
1750
2000
2250
2500
2750
3000
Conventional
Unconventional
But What About Production Over the Total Life of a Well?
Years
Prod
uctio
n Ra
te
The long-term scenario that turns out to be correct will have a major impact.
#1 #3#2
Increase in I.P.
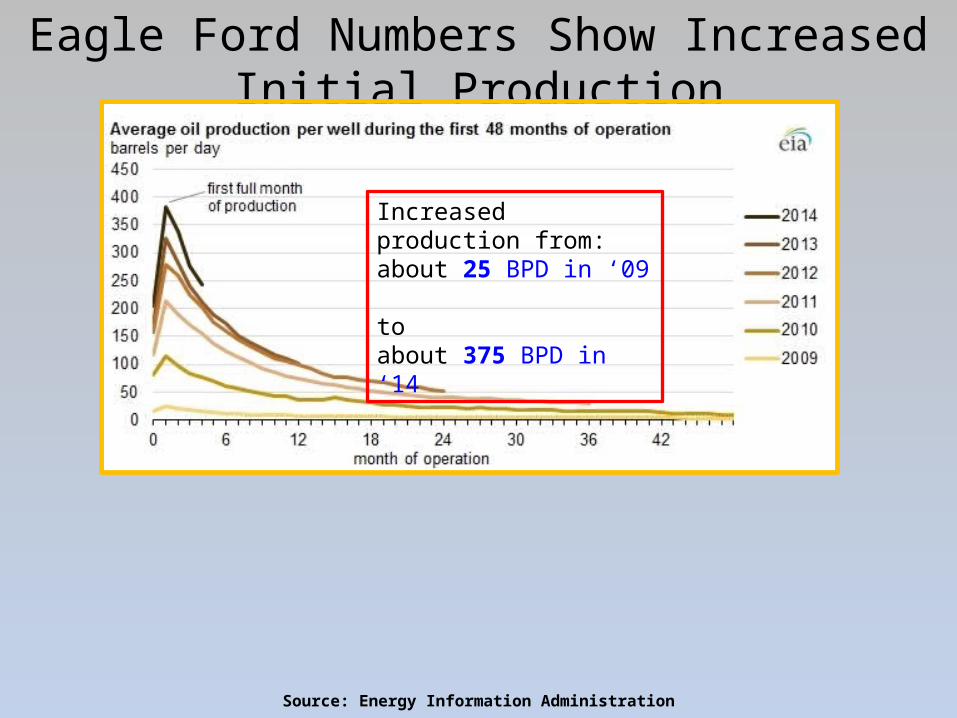
Eagle Ford Numbers Show Increased Initial Production
Source: Energy Information Administration
Increased production from: about 25 BPD in ‘09 to about 375 BPD in ‘14

Numbers Also Show Increased Decline Rates
Source: Energy Information Administration
Increased production from: about 25 BPD in ‘09 to about 375 BPD in ‘14
Unknowns that Could Affect Price
2) Will restrictions on exporting crude be lifted?o Pits (midsize) Refiners against (independent) Producers
o Recent reports say crude exports would actually benefit U.S. economy (ex. lower the price of gasoline)
o Federal political fear may override economic considerations (gasoline price for Congress and environmentalists for Obama)

U.S. Diesel Exports Have Increased Dramatically

The Same With U.S. Gasoline Exports
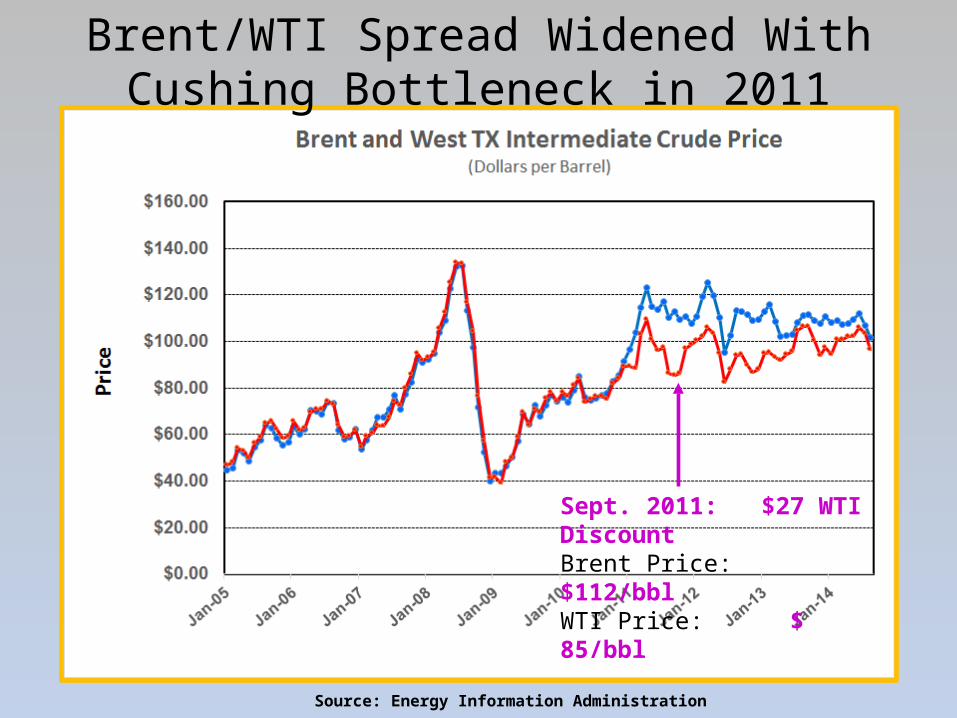
Brent/WTI Spread Widened With Cushing Bottleneck in 2011
Source: Energy Information Administration
Sept. 2011: $27 WTI DiscountBrent Price: $112/bblWTI Price: $ 85/bbl
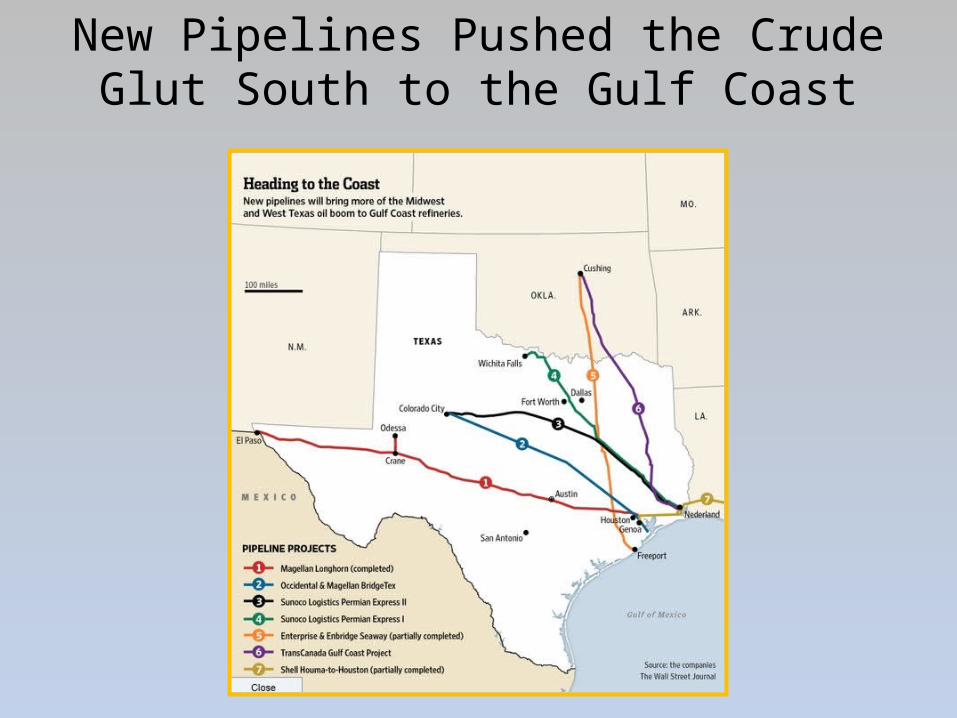
New Pipelines Pushed the Crude Glut South to the Gulf Coast

Now Gulf Coast Light Crude Inventories are Much Higher than Average
Source: RBN Energy Blog
2014

1 2 3 4 5 6 7 8 9 10 11 12 13 14 15 16 17 18 19 20 21 22 23 24 25 26 27 28 29 300
250
500
750
1000
1250
1500
1750
2000
2250
2500
2750
3000
Conventional
Some Predicting: Lower Domestic Prices Will Lead to Increased Crude Imports Again
(But Could Rapid Unconventional Well Decline Rates Make A Difference?)
Years
Prod
uctio
n Ra
te
Unconventional
Unknowns that Could Affect Price
3) Will refiners retool to handle massive amounts of light crude?
The short answer is: NO (political risk)
Unknowns that Could Affect Price
4) How much LNG will be exported from the US?o Pits Petrochems, Manufacturing, Elect. power against Producers
o Some Petrochems showing more flexibility lately (dry gas vs NGLs)
o Discussion over whether the Feds should control export levels thru permitting process or let the market do it.
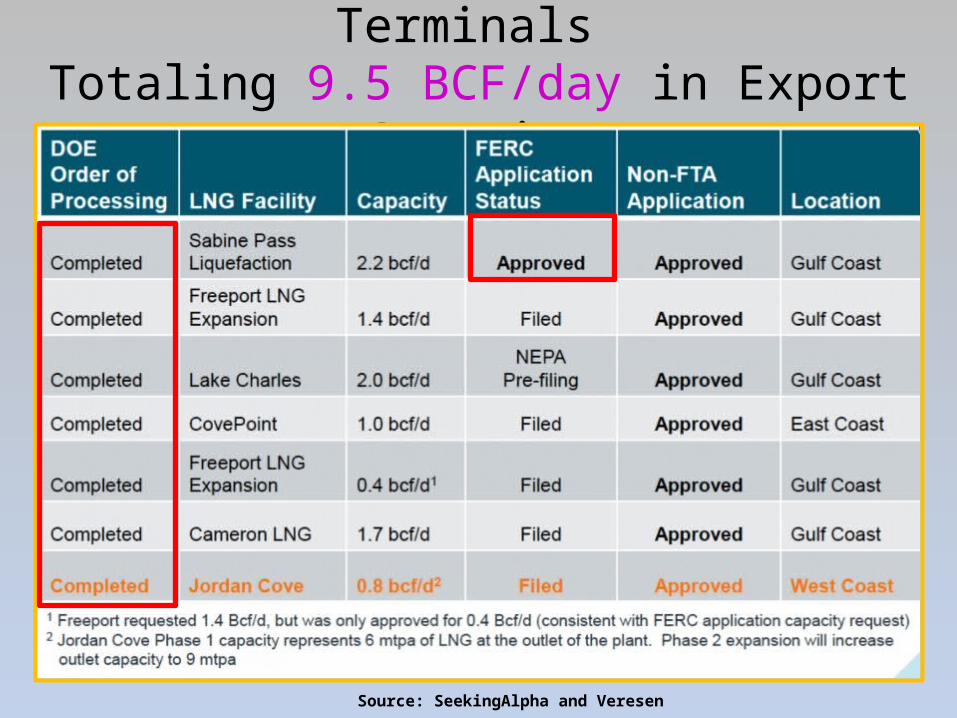
DOE Has Approved LNG Export Terminals Totaling 9.5 BCF/day in Export Capacity
Source: SeekingAlpha and Veresen
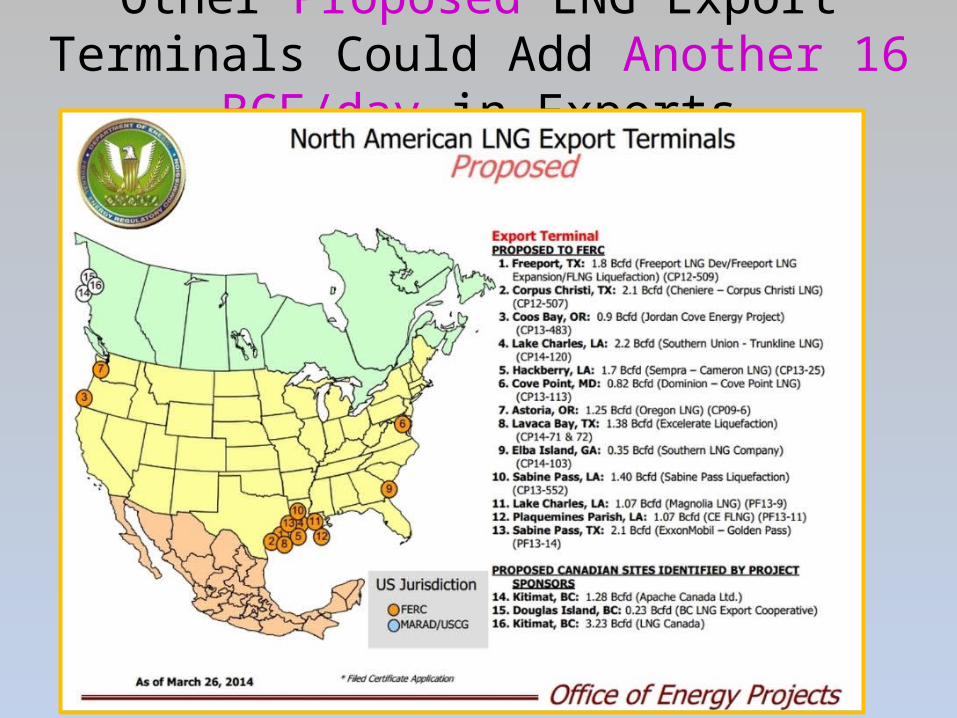
Other Proposed LNG Export Terminals Could Add Another 16 BCF/day in Exports

Unknowns that Could Affect Price
5) Will shale O&G from other countries take off and flood the global market?
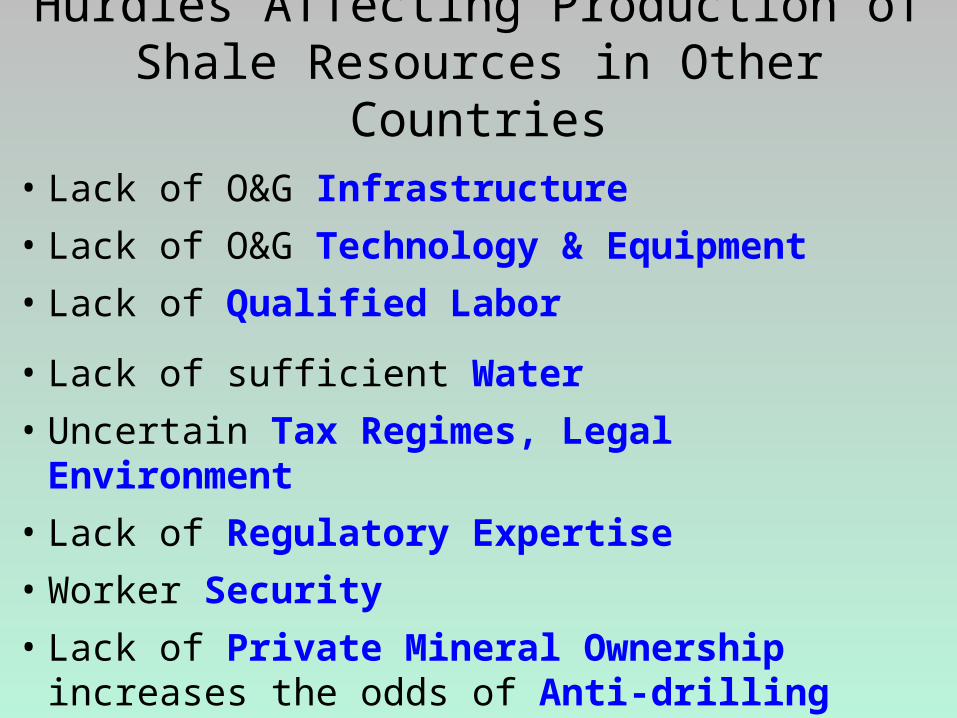
• Lack of O&G Infrastructure• Lack of O&G Technology & Equipment• Lack of Qualified Labor
• Lack of sufficient Water• Uncertain Tax Regimes, Legal Environment• Lack of Regulatory Expertise• Worker Security• Lack of Private Mineral Ownership increases the odds of
Anti-drilling Activism by Citizens
Hurdles Affecting Production of Shale Resources in Other Countries
Finally,How is this O&G boom different from the 80’s?

Saudis Cut Production in Early 1980’s, Then Increased It in 1985
Source: Haver Analytics
10 mil./bpd
2 mil./bpd
6 mil./bpd
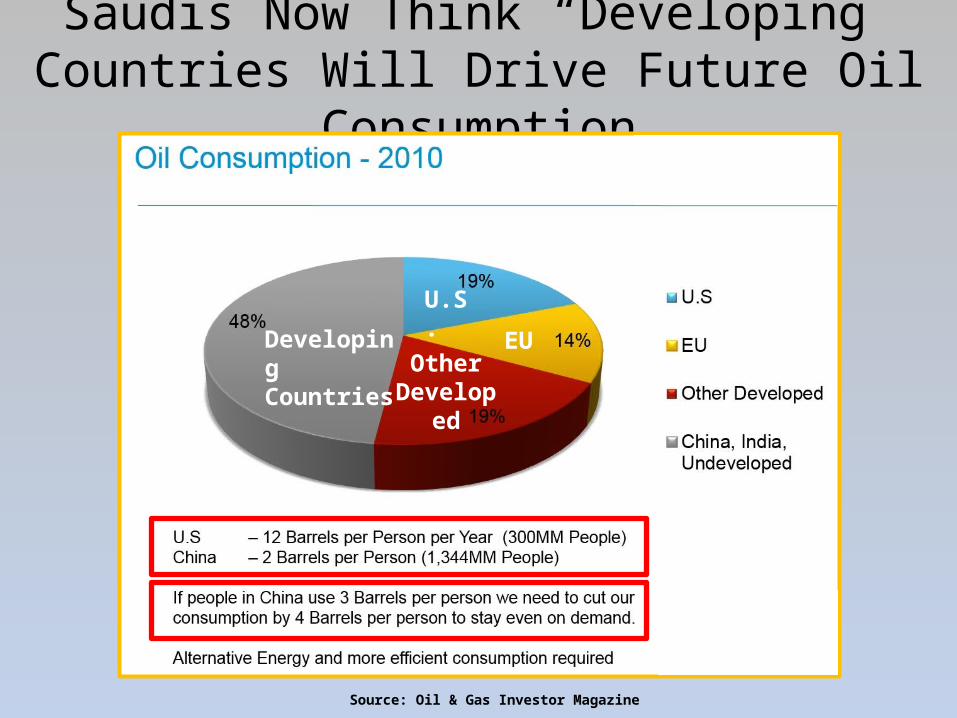
Saudis Now Think “Developing” Countries Will Drive Future Oil Consumption
Source: Oil & Gas Investor Magazine
Developing Countries
U.S.
EUOther
Developed
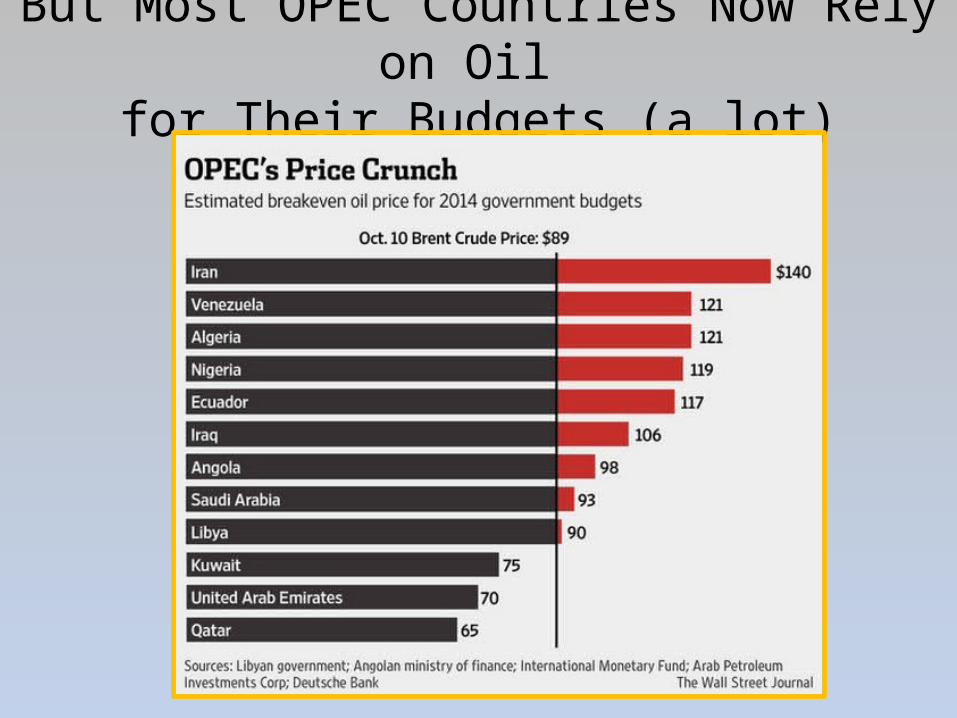
But Most OPEC Countries Now Rely on Oil for Their Budgets (a lot)
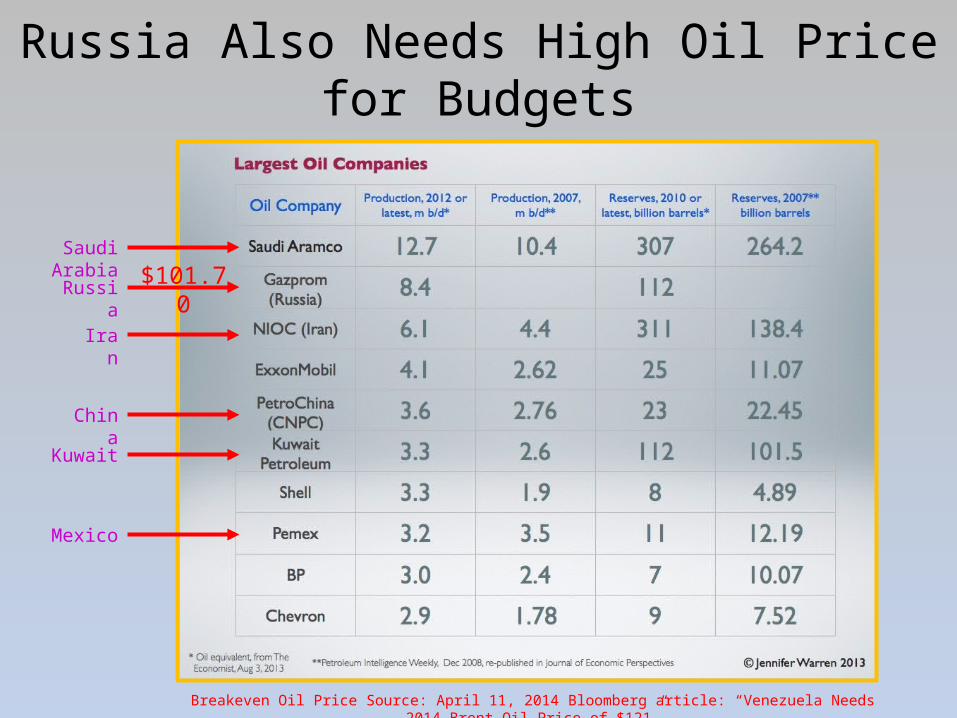
Russia Also Needs High Oil Price for Budgets
Saudi Arabia
Russia
Iran
China
Kuwait
Mexico
$101.70
Breakeven Oil Price Source: April 11, 2014 Bloomberg article: “Venezuela Needs 2014 Brent Oil Price of $121”
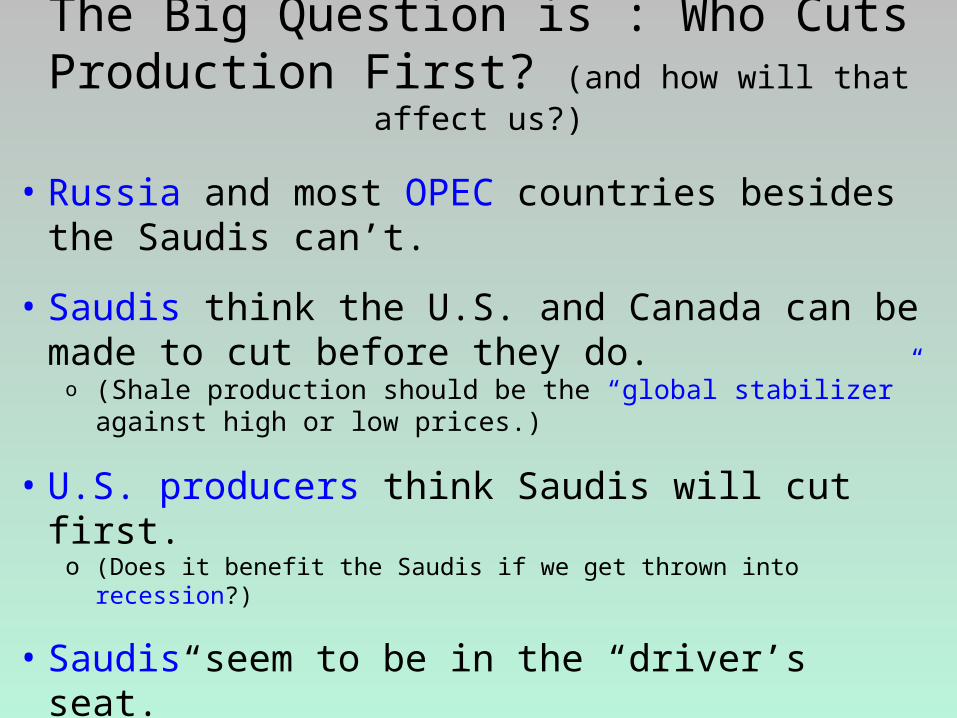
• Russia and most OPEC countries besides the Saudis can’t.
• Saudis think the U.S. and Canada can be made to cut before they do. o (Shale production should be the “global stabilizer” against high or low prices.)
• U.S. producers think Saudis will cut first. o (Does it benefit the Saudis if we get thrown into recession?)
• Saudis seem to be in the “driver’s seat.”o Have staying power; They can drive the price lowero Are they bluffing to get other OPEC members to cut as well?
• If price drops significantly, we will see what actual “breakeven” is for various producers. (Investors will be important)
The Big Question is : Who Cuts Production First? (and how will that affect us?)

http://recenter.tamu.edu
REAL ESTATE CENTER at TEXAS A&M UNIVERSITY
Mays School of Business