Embed Size (px)
Citation preview

@ 2016 Deloite Financial Advisory 1
The Hotel Property HandbookInvestment & Financing Keys
Balearic Islands Snapshot
Financial Advisory I Real Estate - Hospitality
October 2017
@ 2016 Deloite Financial Advisory 2
The Hotel Property HandbookBalearic Islands Snapshot
Javier García-Mateo, MRICS
PartnerFinancial Advisory ‖ Real Estate
[email protected]: +34 659 90 02 15
Ana Granado, MRICS
DirectorFinancial Advisory ‖ Real Estate
[email protected]: +34 630 78 44 73
Jose María Espejo
Senior ManagerFinancial Advisory ‖ Real Estate
[email protected]: +34 918 232 692
Jordi Schoenenberger
PartnerHospitality Industry [email protected]: +34 932 543 932
Fernando Baldellou
PartnerHead of Financial Advisory – Hospitality [email protected]: +34 914 432 514
@ 2016 Deloite Financial Advisory 3
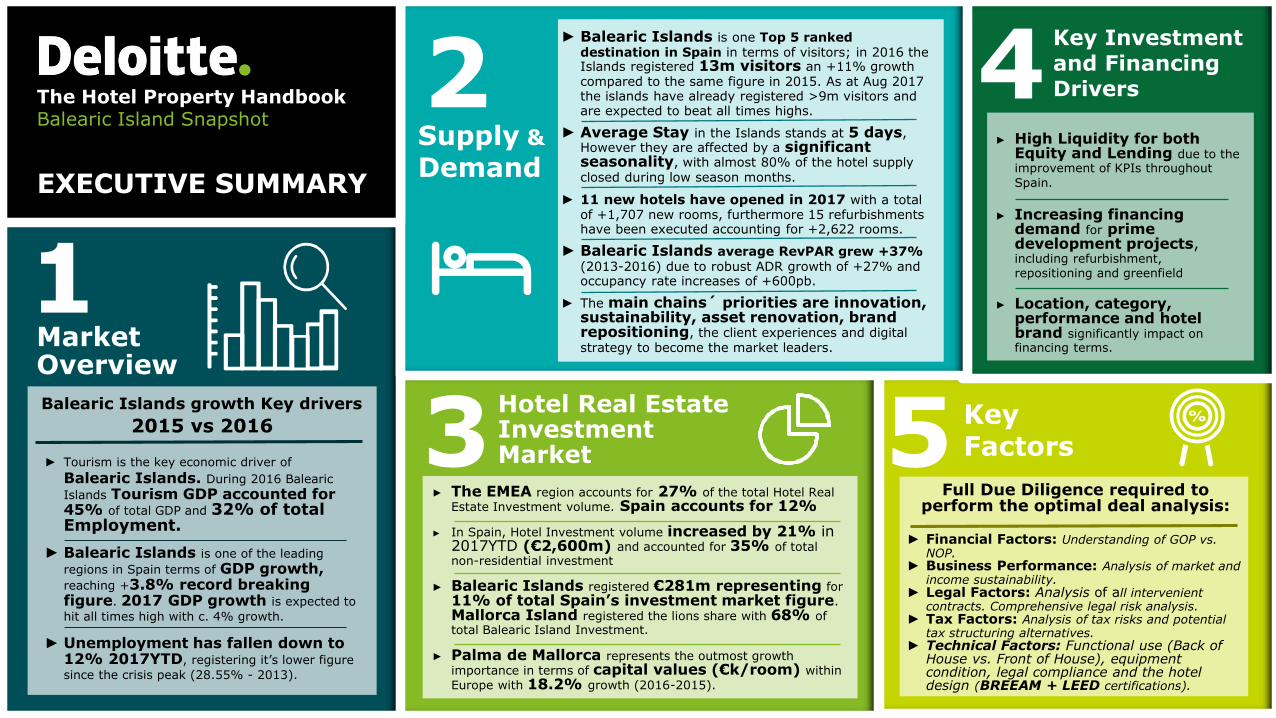
5 Key Factors
Full Due Diligence required to perform the optimal deal analysis:
► Financial Factors: Understanding of GOP vs. NOP.
► Business Performance: Analysis of market and income sustainability.
► Legal Factors: Analysis of all intervenient contracts. Comprehensive legal risk analysis.
► Tax Factors: Analysis of tax risks and potential tax structuring alternatives.
► Technical Factors: Functional use (Back of House vs. Front of House), equipment condition, legal compliance and the hotel design (BREEAM + LEED certifications).
Key Investment and Financing Drivers
► High Liquidity for both Equity and Lending due to the improvement of KPIs throughout
Spain.
► Increasing financing demand for prime development projects, including refurbishment, repositioning and greenfield
► Location, category, performance and hotel brand significantly impact on financing terms.Market
Overview
1
► Tourism is the key economic driver of
Balearic Islands. During 2016 Balearic
Islands Tourism GDP accounted for 45% of total GDP and 32% of total Employment.
► Balearic Islands is one of the leading
regions in Spain terms of GDP growth, reaching +3.8% record breaking figure. 2017 GDP growth is expected to
hit all times high with c. 4% growth.
► Unemployment has fallen down to 12% 2017YTD, registering it’s lower figure
since the crisis peak (28.55% - 2013).
2015 vs 2016
Balearic Islands growth Key drivers
► Balearic Islands is one Top 5 ranked destination in Spain in terms of visitors; in 2016 the Islands registered 13m visitors an +11% growth compared to the same figure in 2015. As at Aug 2017 the islands have already registered >9m visitors and are expected to beat all times highs.
► Average Stay in the Islands stands at 5 days, However they are affected by a significant seasonality, with almost 80% of the hotel supply closed during low season months.
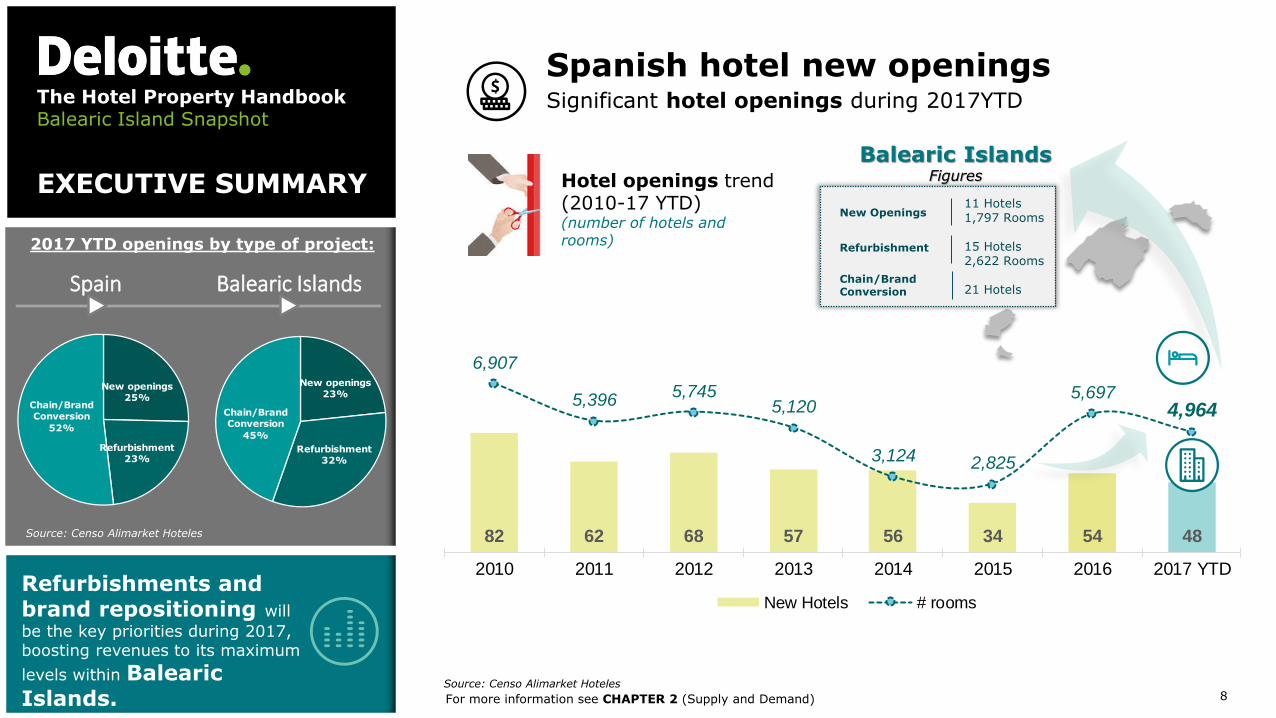
► 11 new hotels have opened in 2017 with a total of +1,707 new rooms, furthermore 15 refurbishments have been executed accounting for +2,622 rooms.
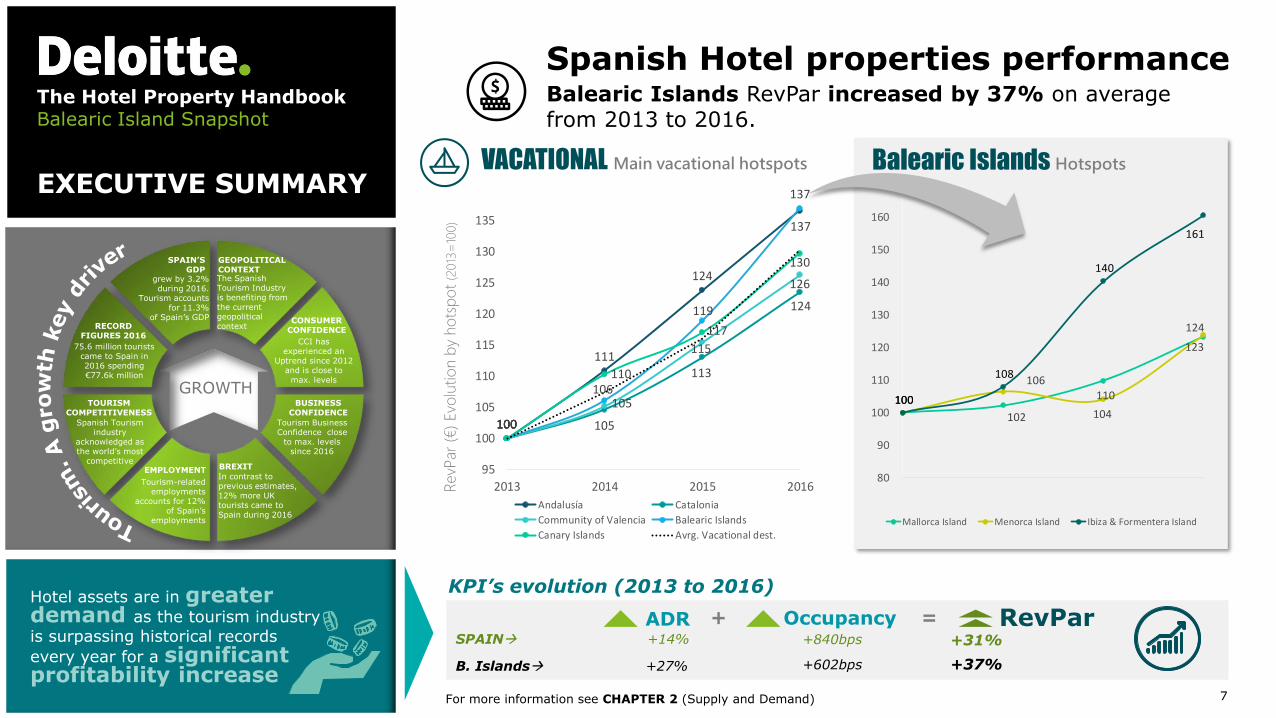
► Balearic Islands average RevPAR grew +37% (2013-2016) due to robust ADR growth of +27% and occupancy rate increases of +600pb.
► The main chains´ priorities are innovation, sustainability, asset renovation, brand repositioning, the client experiences and digital strategy to become the market leaders.
2Supply &
Demand
4
3Hotel Real Estate Investment Market
The Hotel Property HandbookBalearic Island Snapshot
EXECUTIVE SUMMARY
► The EMEA region accounts for 27% of the total Hotel Real Estate Investment volume. Spain accounts for 12%
► In Spain, Hotel Investment volume increased by 21% in 2017YTD (€2,600m) and accounted for 35% of total non-residential investment
► Balearic Islands registered €281m representing for
11% of total Spain’s investment market figure.
Mallorca Island registered the lions share with 68% of total Balearic Island Investment.
► Palma de Mallorca represents the outmost growth importance in terms of capital values (€k/room) within
Europe with 18.2% growth (2016-2015).
@ 2016 Deloite Financial Advisory 4
Cap
ital
Val
ues
Gro
wth
(%
)2
01
5-2
01
6
Capital Valu
e p
er
room
(2015-1
6)
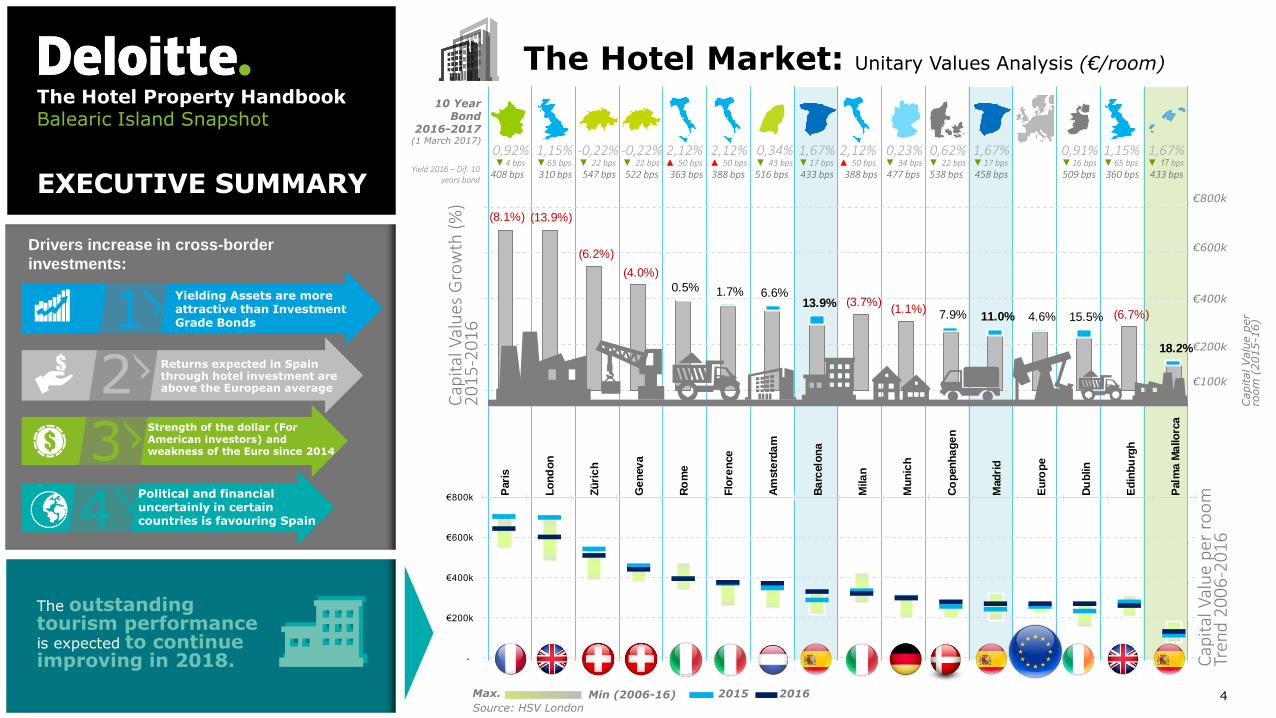
(8.1%) (13.9%)
(6.2%)
(4.0%)
0.5% 1.7% 6.6% 13.9% (3.7%)
(1.1%)7.9% 11.0% 4.6% 15.5% (6.7%)
18.2%
€800k
€600k
€400k
€200k
€100k
-
€200k
€400k
€600k
€800k P
ari
s
Lo
nd
on
Zü
ric
h
Ge
nev
a
Ro
me
Flo
ren
ce
Am
ste
rda
m
Ba
rcelo
na
Mila
n
Mu
nic
h
Co
pen
ha
ge
n
Mad
rid
Eu
rop
e
Du
blin
Ed
inb
urg
h
Palm
a M
allo
rca
The Hotel Property HandbookBalearic Island Snapshot
EXECUTIVE SUMMARY
Drivers increase in cross-border
investments:
2
3
1
4
Yielding Assets are more attractive than Investment Grade Bonds
Strength of the dollar (For American investors) and weakness of the Euro since 2014
Political and financial uncertainly in certain countries is favouring Spain
Cap
ital
Val
ue
per
ro
om
Tr
end
20
06
-20
16
Max. Min (2006-16) 2015 2016
Source: HSV London
The Hotel Market: Unitary Values Analysis (€/room)
The outstanding tourism performanceis expected to continue improving in 2018.
Returns expected in Spain through hotel investment are above the European average
10 Year Bond
2016-2017(1 March 2017)
Yield 2016 – Dif. 10 years bond
2,12%▲ 50 bps
1,67%▼ 17 bps
1,15%▼65 bps
0,92%▼4 bps
1,15%▼65 bps
0,23%▼ 34 bps
0,91%▼16 bps
2,12%▲ 50 bps
2,12%▲ 50 bps
1,67%▼17 bps
1,67%▼17 bps
0,34%▼ 43 bps
0,62%▼ 22 bps
-0,22%▼ 22 bps
-0,22%▼ 22 bps
363 bps 433 bps310 bps408 bps 360 bps477 bps 509 bps388 bps 388 bps433 bps 458 bps516 bps 538 bps522 bps547 bps

@ 2016 Deloite Financial Advisory 5
750 576 519 607 932
2,702 2,145 2,600
150 279 88 120 596
674 930 428
1,467 591
571 751
2,242
1,263
660 595 644
687 365
867
2,297
1,894 3,769
2,277
1,460
1,056
544
807
2,520
5,313
4,895
1,781
4,470
3,189
2,087
3,151
8,587
11,845 12,398
7,334
-
2,000
4,000
6,000
8,000
10,000
12,000
2010 2011 2012 2013 2014 2015 2016 2017YTD
Top 10 Spanish single asset transactions:
A total pipeline investment volume of €800m is expected to be traded in Spain
Spanish Investment Market
Source: Deloitte
Source: Deloitte
EXECUTIVE SUMMARY
Total Hotel investment volume in
Spain as at 2017YTD: €2,600m
Short Term Medium Term Long Term TOTAL
75%100%
17%
8%
In 2017YTD the Hotel investment volume has exceed by 21% the investment volume of 2016. Hotel typology represents 35% of the total investment volume
Source: Deloitte Data Base and third party sources
For more information see CHAPTER 3 (Investment Market)
35%Hotel
+21%
Hotels
Logistic
Retail High Street
Retail Shopping Centre
Offices
# Asset UnitsPrice
(€m)Typology
1 Ritz-Carlton Abama 461 183 Vacational
2 Hotel Villaitana 390 101 Vacational
3 Jardin Tropical 390 101 Vacational
4 Sol Príncipe 799 89 Vacational
5 Hotel Silken 240 80 Urban
6 Hilton Diagonal Mar Barcelona (55%)238 80 Urban
7 Ritz-Carlton Abama 50% 461 75 Vacational
8 Sol Palmanova 653 73 Vacational
9 Silken Puerta de América 315 48 Vacational
10 AC Malaga Palacio 214 48 Urban
The Hotel Property HandbookBalearic Island Snapshot
Balearic Islands
€281mMallorca68%
Ibiza32%
@ 2016 Deloite Financial Advisory 6
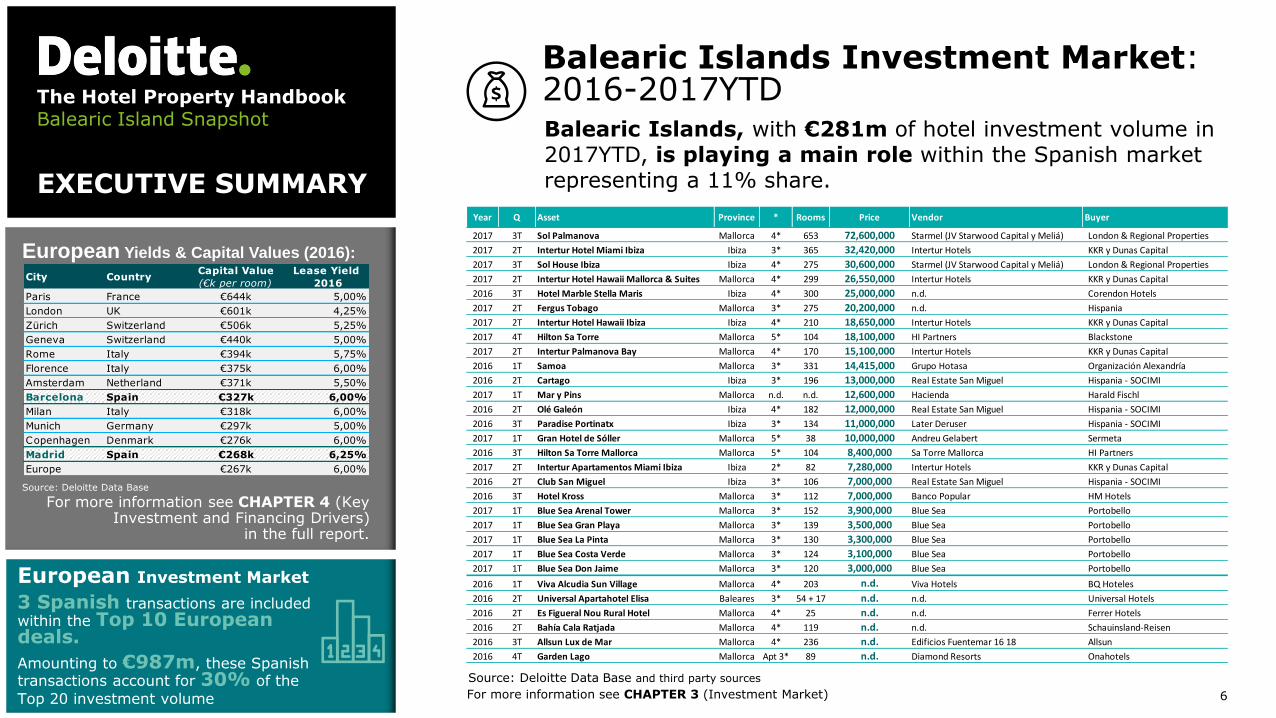
European Yields & Capital Values (2016):
For more information see CHAPTER 4 (Key Investment and Financing Drivers)
in the full report.
Source: Deloitte Data Base
EXECUTIVE SUMMARY
European Investment Market
3 Spanish transactions are includedwithin the Top 10 European deals.
Amounting to €987m, these Spanish transactions account for 30% of the
Top 20 investment volume
Balearic Islands Investment Market: 2016-2017YTDBalearic Islands, with €281m of hotel investment volume in 2017YTD, is playing a main role within the Spanish market representing a 11% share.
Source: Deloitte Data Base and third party sources
For more information see CHAPTER 3 (Investment Market)
City CountryCapital Value
(€k per room)
Lease Yield
2016
Paris France €644k 5,00%
London UK €601k 4,25%
Zürich Switzerland €506k 5,25%
Geneva Switzerland €440k 5,00%
Rome Italy €394k 5,75%
Florence Italy €375k 6,00%
Amsterdam Netherland €371k 5,50%
Barcelona Spain €327k 6,00%
Milan Italy €318k 6,00%
Munich Germany €297k 5,00%
Copenhagen Denmark €276k 6,00%
Madrid Spain €268k 6,25%
Europe €267k 6,00%
The Hotel Property HandbookBalearic Island Snapshot
Year Q Asset Province * Rooms Price Vendor Buyer
2017 3T Sol Palmanova Mallorca 4* 653 72,600,000 Starmel (JV Starwood Capital y Meliá) London & Regional Properties
2017 2T Intertur Hotel Miami Ibiza Ibiza 3* 365 32,420,000 Intertur Hotels KKR y Dunas Capital
2017 3T Sol House Ibiza Ibiza 4* 275 30,600,000 Starmel (JV Starwood Capital y Meliá) London & Regional Properties
2017 2T Intertur Hotel Hawaii Mallorca & Suites Mallorca 4* 299 26,550,000 Intertur Hotels KKR y Dunas Capital
2016 3T Hotel Marble Stella Maris Ibiza 4* 300 25,000,000 n.d. Corendon Hotels
2017 2T Fergus Tobago Mallorca 3* 275 20,200,000 n.d. Hispania
2017 2T Intertur Hotel Hawaii Ibiza Ibiza 4* 210 18,650,000 Intertur Hotels KKR y Dunas Capital
2017 4T Hilton Sa Torre Mallorca 5* 104 18,100,000 HI Partners Blackstone
2017 2T Intertur Palmanova Bay Mallorca 4* 170 15,100,000 Intertur Hotels KKR y Dunas Capital
2016 1T Samoa Mallorca 3* 331 14,415,000 Grupo Hotasa Organización Alexandría
2016 2T Cartago Ibiza 3* 196 13,000,000 Real Estate San Miguel Hispania - SOCIMI
2017 1T Mar y Pins Mallorca n.d. n.d. 12,600,000 Hacienda Harald Fischl
2016 2T Olé Galeón Ibiza 4* 182 12,000,000 Real Estate San Miguel Hispania - SOCIMI
2016 3T Paradise Portinatx Ibiza 3* 134 11,000,000 Later Deruser Hispania - SOCIMI
2017 1T Gran Hotel de Sóller Mallorca 5* 38 10,000,000 Andreu Gelabert Sermeta
2016 3T Hilton Sa Torre Mallorca Mallorca 5* 104 8,400,000 Sa Torre Mallorca HI Partners
2017 2T Intertur Apartamentos Miami Ibiza Ibiza 2* 82 7,280,000 Intertur Hotels KKR y Dunas Capital
2016 2T Club San Miguel Ibiza 3* 106 7,000,000 Real Estate San Miguel Hispania - SOCIMI
2016 3T Hotel Kross Mallorca 3* 112 7,000,000 Banco Popular HM Hotels
2017 1T Blue Sea Arenal Tower Mallorca 3* 152 3,900,000 Blue Sea Portobello
2017 1T Blue Sea Gran Playa Mallorca 3* 139 3,500,000 Blue Sea Portobello
2017 1T Blue Sea La Pinta Mallorca 3* 130 3,300,000 Blue Sea Portobello
2017 1T Blue Sea Costa Verde Mallorca 3* 124 3,100,000 Blue Sea Portobello
2017 1T Blue Sea Don Jaime Mallorca 3* 120 3,000,000 Blue Sea Portobello
2016 1T Viva Alcudia Sun Village Mallorca 4* 203 n.d. Viva Hotels BQ Hoteles
2016 2T Universal Apartahotel Elisa Baleares 3* 54 + 17 n.d. n.d. Universal Hotels
2016 2T Es Figueral Nou Rural Hotel Mallorca 4* 25 n.d. n.d. Ferrer Hotels
2016 2T Bahía Cala Ratjada Mallorca 4* 119 n.d. n.d. Schauinsland-Reisen
2016 3T Allsun Lux de Mar Mallorca 4* 236 n.d. Edificios Fuentemar 16 18 Allsun
2016 4T Garden Lago Mallorca Apt 3* 89 n.d. Diamond Resorts Onahotels
@ 2016 Deloite Financial Advisory 7
100
102
110
123
100
106
104
124
100
108
140
161
80
90
100
110
120
130
140
150
160
170
Mallorca Island Menorca Island Ibiza & Formentera Island
100
111
124
137
100 105
113
124
100
105
115
126
100
106
119
137
100
110
117
130
95
100
105
110
115
120
125
130
135
140
2013 2014 2015 2016
Andalusía Catalonia
Community of Valencia Balearic Islands
Canary Islands Avrg. Vacational dest.
EXECUTIVE SUMMARY
The Hotel Property HandbookBalearic Island Snapshot
GROWTH
EMPLOYMENT
Tourism-related employments
accounts for 12% of Spain’s
employments
In contrast to previous estimates, 12% more UK tourists came to Spain during 2016
BREXIT
Tourism Business Confidence close
to max. levels since 2016
BUSINESS CONFIDENCE
CCI has experienced an
Uptrend since 2012 and is close to
max. levels
CONSUMERCONFIDENCE
The Spanish Tourism Industry is benefiting from the current geopolitical context
GEOPOLITICAL CONTEXT
grew by 3.2% during 2016.
Tourism accounts for 11.3%
of Spain’s GDP
SPAIN’S GDP
75.6 million tourists came to Spain in 2016 spending €77.6k million
RECORD FIGURES 2016
Spanish Tourism industry
acknowledged as the world’s most
competitive
TOURISM COMPETITIVENESS
Hotel assets are in greater demand as the tourism industry
is surpassing historical records
every year for a significant profitability increase
Balearic Islands Hotspots
RevP
ar(€
) Evo
lutio
n b
y ho
tsp
ot
(2013
=10
0)
VACATIONAL Main vacational hotspots
For more information see CHAPTER 2 (Supply and Demand)
Spanish Hotel properties performanceBalearic Islands RevPar increased by 37% on average from 2013 to 2016.
KPI’s evolution (2013 to 2016)
ADR RevParOccupancy+ =SPAIN +14% +840bps +31%
B. Islands +27% +602bps +37%
@ 2016 Deloite Financial Advisory 8
82 62 68 57 56 34 54 48
6,907
5,3965,745
5,120
3,124 2,825
5,6974,964
0
2000
4000
6000
8000
10000
12000
-
20
40
60
80
100
120
140
160
180
200
2010 2011 2012 2013 2014 2015 2016 2017 YTD
New Hotels # rooms
New openings25%
Refurbishment23%
Chain/Brand Conversion
52%
EXECUTIVE SUMMARY
The Hotel Property HandbookBalearic Island Snapshot
Refurbishments and brand repositioning will
be the key priorities during 2017,boosting revenues to its maximum
levels within Balearic Islands. For more information see CHAPTER 2 (Supply and Demand)
Spanish hotel new openingsSignificant hotel openings during 2017YTD
Hotel openings trend (2010-17 YTD) (number of hotels and rooms)
Source: Censo Alimarket Hoteles
Source: Censo Alimarket Hoteles
New Openings
Refurbishment
Chain/Brand Conversion
11 Hotels1,797 Rooms
15 Hotels2,622 Rooms
21 Hotels
Balearic Islands Figures
Spain Balearic Islands
2017 YTD openings by type of project:
New openings23%
Refurbishment32%
Chain/Brand Conversion
45%
@ 2016 Deloite Financial Advisory 9
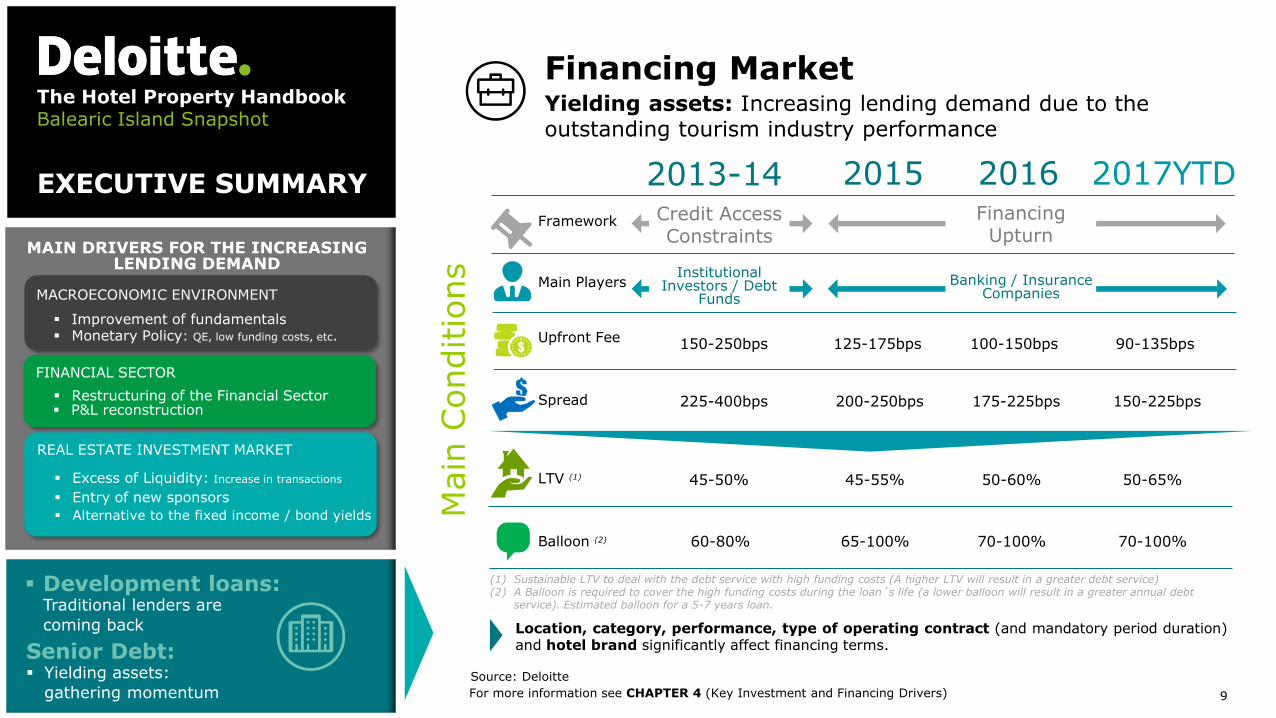
P&L reconstruction Restructuring of the Financial Sector
Improvement of fundamentals
Alternative to the fixed income / bond yields
Senior Debt: Yielding assets:
gathering momentum
MAIN DRIVERS FOR THE INCREASING LENDING DEMAND
Monetary Policy: QE, low funding costs, etc.
Excess of Liquidity: Increase in transactions
Entry of new sponsors
FINANCIAL SECTOR
REAL ESTATE INVESTMENT MARKET
MACROECONOMIC ENVIRONMENT
Yielding assets: Increasing lending demand due to the outstanding tourism industry performance
Financing MarketThe Hotel Property HandbookBalearic Island Snapshot
EXECUTIVE SUMMARY
Source: Deloitte
For more information see CHAPTER 4 (Key Investment and Financing Drivers)
Main
Conditio
ns
LTV (1)
Upfront Fee
Spread
45-50% 45-55%
2015 2016
150-250bps 125-175bps
225-400bps 200-250bps
Framework
Main Players
Balloon (2) 60-80% 65-100%
Credit Access Constraints
Financing Upturn
Institutional Investors / Debt
Funds
Banking / Insurance Companies
2013-14
50-60%
100-150bps
175-225bps
70-100%
Location, category, performance, type of operating contract (and mandatory period duration)and hotel brand significantly affect financing terms.
2017YTD
50-65%
90-135bps
150-225bps
70-100%
(1) Sustainable LTV to deal with the debt service with high funding costs (A higher LTV will result in a greater debt service)(2) A Balloon is required to cover the high funding costs during the loan´s life (a lower balloon will result in a greater annual debt
service). Estimated balloon for a 5-7 years loan.
Development loans: Traditional lenders are
coming back
@ 2016 Deloite Financial Advisory 10
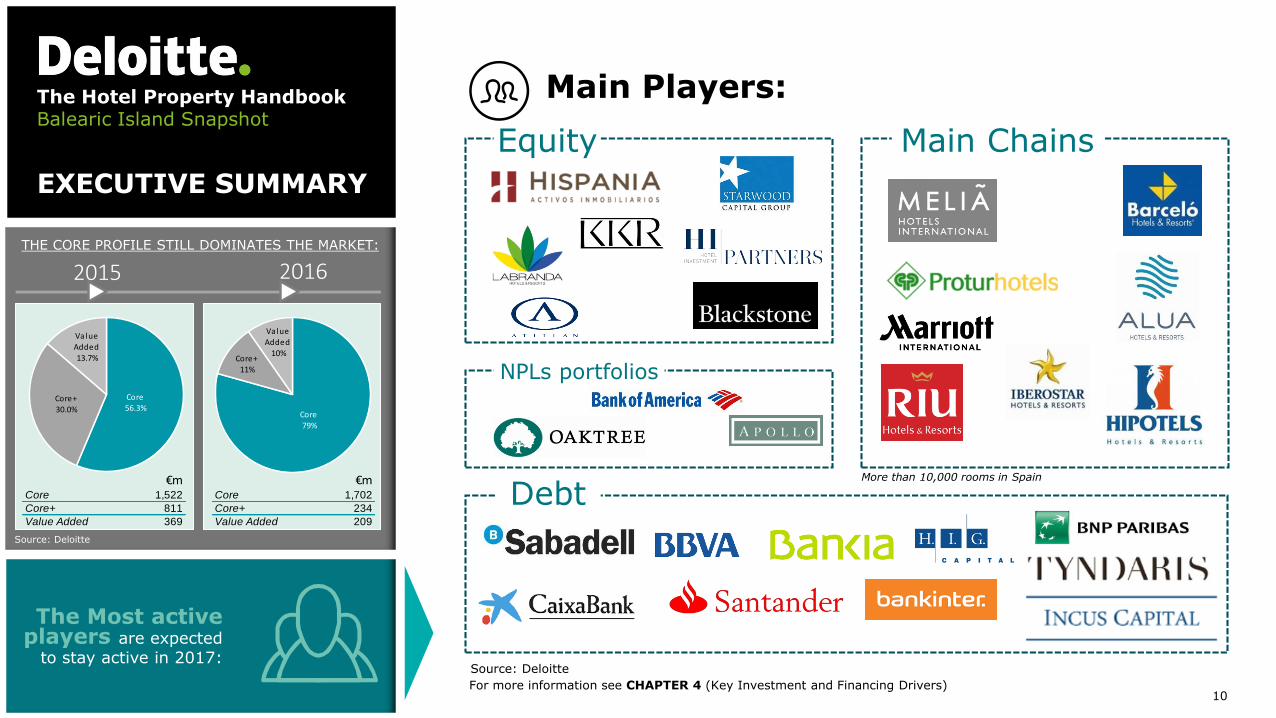
The Most active players are expected
to stay active in 2017:
Main Players:
Equity
Debt(€m)
2015 2016THE CORE PROFILE STILL DOMINATES THE MARKET:
Source: Deloitte
The Hotel Property HandbookBalearic Island Snapshot
EXECUTIVE SUMMARY
Source: Deloitte
For more information see CHAPTER 4 (Key Investment and Financing Drivers)
Main Chains
More than 10,000 rooms in Spain
Core79%
Core+
11%
ValueAdded
10%
Core56.3%
Core+
30.0%
Value
Added13.7%
€mCore 1,522
Core+ 811
Value Added 369
€mCore 1,702
Core+ 234
Value Added 209
NPLs portfolios

@ 2016 Deloite Financial Advisory 11
The Hotel Property HandbookBalearic Island Snapshot

@ 2016 Deloite Financial Advisory 12
The Hotel Property HandbookBalearic Island Snapshot
EXECUTIVE SUMMARY
Hotel
Property
Digital strategy
RenovationCustomised experiences
Brand repositioning
Innovation
SustainabilityBREEAM & LEED
BREEAM and LEED certifications are the
most significant sustainability certifications
worldwide. Both standards are
regularly updated in line with the market.
LEADING SUSTAINABILITY CERTIFICATIONS
@ 2016 Deloite Financial Advisory 13
The Hotel Property HandbookBalearic Island Snapshot
EXECUTIVE SUMMARY
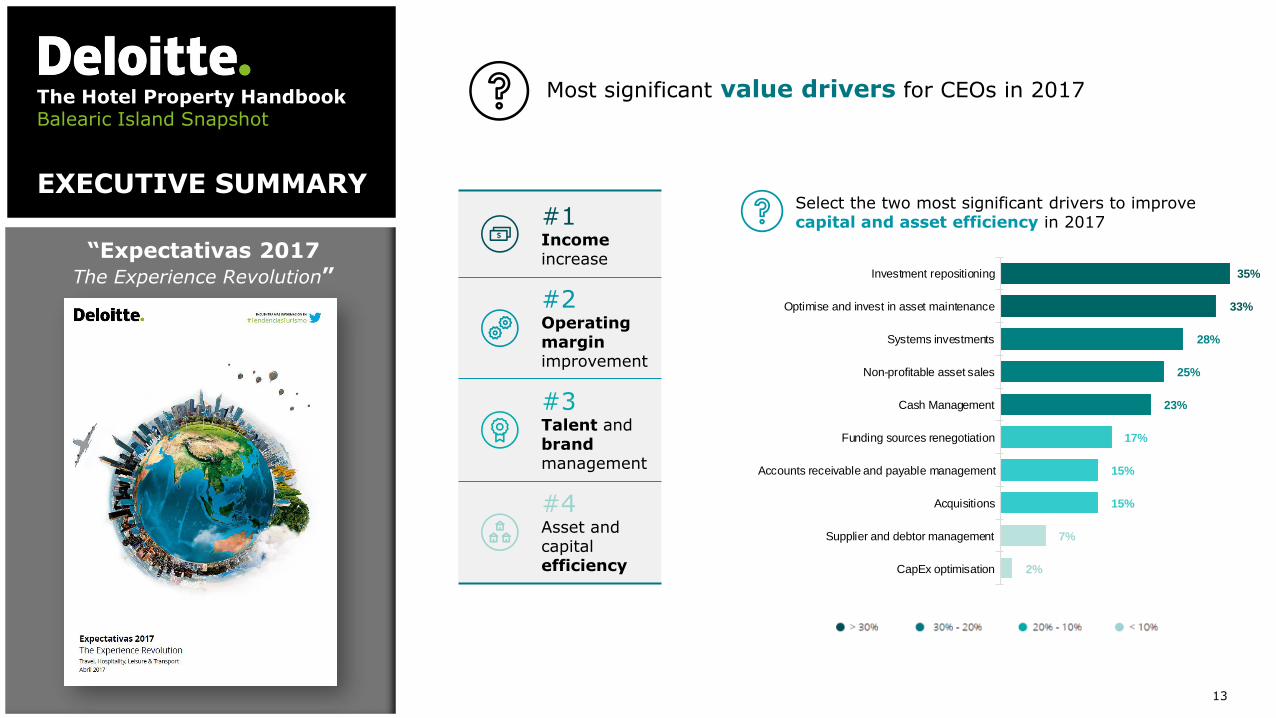
“Expectativas 2017The Experience Revolution”
Most significant value drivers for CEOs in 2017
Select the two most significant drivers to improve capital and asset efficiency in 2017#1
Incomeincrease
#2Operating margin improvement
#3Talent and brandmanagement
#4Asset and capital efficiency
35%
33%
28%
25%
23%
17%
15%
15%
7%
2%
Investment repositioning
Optimise and invest in asset maintenance
Systems investments
Non-profitable asset sales
Cash Management
Funding sources renegotiation
Accounts receivable and payable management
Acquisitions
Supplier and debtor management
CapEx optimisation

@ 2016 Deloite Financial Advisory 14
The Hotel Property HandbookSpain 2017
Javier García-Mateo, MRICS
PartnerFinancial Advisory ‖ Real Estate
[email protected]: +34 659 90 02 15
Ana Granado, MRICS
DirectorFinancial Advisory ‖ Real Estate
[email protected]: +34 630 78 44 73
Jose María Espejo
Senior ManagerFinancial Advisory ‖ Real Estate
[email protected]: +34 918 232 692
Jordi Schoenenberger
PartnerHospitality Industry [email protected]: +34 932 543 932
Fernando Baldellou
PartnerHead of Financial Advisory – Hospitality [email protected]: +34 914 432 514

@ 2016 Deloite Financial Advisory 15