Embed Size (px)
DESCRIPTION
The Hotel Price Index TM Review of global hotel prices: Jan-Jun 2011
Citation preview
The Hotel Price Index TM
Review of global hotel prices: Jan-Jun 2011


The international scale of Hotels.com (in terms of both
customers and destinations) makes the Hotel Price Index
one of the most comprehensive benchmarks available, as
it incorporates both chain and independent hotels, as well
as options such as self-catering and bed and breakfast
properties.
In Europe, approximately 25% of hotel rooms are part of
a chain, the remainder being independent, whereas the
reverse proportions apply to North America.
The Hotels.com Hotel Price IndexTM (HPI®) is a regular survey
of hotel prices in major destinations across the world. The
HPI is based on bookings made on Hotels.com and prices
shown are those actually paid by customers (rather than
advertised rates) in the first half of 2011.
Now in its eighth year, the HPI is respected as the definitive
report on hotel prices paid around the world and increasingly
used as a reference tool by media, hoteliers, analysts,
tourism bodies and academics.
The HPI tracks the real prices paid per room by
Hotels.com customers around the world using a weighted
average based on the number of rooms sold in each of the
markets that Hotels.com operates in.
Approximately 125,000 properties in more than 19,000
global locations make up the sample set of hotels from
which prices are taken.
Introduction

20 years and still going strong
On the move
Earlier this year, we introduced two
free mobile apps for the iPhone
and Android and, since then,
more than a million have been
downloaded. Available in more than
30 languages, the apps allow users
to search and book our hotels
conveniently while on the move
and are used heavily by last-minute
bookers. A similar app for Nokia
smart phones will be available
shortly. Other developments in the
mobile sector will follow.
Our company began life in 1991 when founders David Litman
and Robert Deiner began Hotel Reservations Network,
providing discount hotel prices via a toll-free line in the
US. The first move onto the internet was in 1996 when the
company became one of the early adopters of the new
technology. The Hotels.com name appeared in 2002, the
same year that the first international site was launched in the
UK, and we now have 85 localised sites globally, offering a
choice of almost 140,000 hotels around the world ranging
from five-star luxury properties to B&Bs.
Throughout the years, we have continued to innovate to find
ways to keep improving the service we offer our customers.
Here are a few of our latest enhancements.
See the HPI when you search
One site enhancement currently in development is the
aptly-named Hotel Price Index function (see above) which
will allow customers to see average room prices in a given
destination for accommodation up to 90 days in advance of
the current date so they can more easily find a time to suit
their budget.
It’s good to talk
We have been pioneering improvements
in our multi-lingual call centres, adding yet
more languages, introducing interactive
FAQs to most of our sites and piloting
live chat in several of our markets to provide active help to
customers during the booking process.

1The Hotel Price Index Review of global hotel prices: Jan-Jun 2011
hotel prices in Egypt as a whole were down by 25% and
the UAE down 13%, with Sharm El Sheikh down 26% and
Dubai down 13%, a heavy blow to those tourism-dependent
economies, already reeling from the financial crisis.
As the leisure markets of North Africa disappeared from
travellers’ minds for a while, demand partially transferred
to the traditional European destinations of Spain and Italy,
finally breathing life into what had been moribund markets in
pricing terms. Ireland’s moment in the spotlight as recipient
of Presidential and Royal visits coincided with the first
evidence of recovery after three years of price falls.
The tsunami and nuclear emergency in Japan drove
down occupancy, and prices, in one of Asia’s largest hotel
markets, with rates in the country falling 9% overall but with
individual city prices more radically affected – Kyoto down
19% and Osaka down 29%. The Asian region would have
posted a far higher increase but for the impact of
nature here.
Another BRIC in the wall?
If prices are sluggish in the US and Europe, or falling
from external shocks, they are rising rapidly in the world’s
Hotel prices, along with more traditional bellwethers such
as Baltic Dry (and unconventional ones like skirt length),
give an indication of current economic trends, and perhaps
something of a foretaste of what might yet be. Our review of
the first half of 2011 tells a story of political events, of nature’s
impact, of gyrations in business confidence, and indicates
both where consumer value lies today, and where the market
is betting on tomorrow’s recovery.
In common with most Western economies, global hotel
prices continued their path of unspectacular recovery from
the pricing trough reached in 2009. After stripping out
currency changes and new hotel openings, the price hotels
actually charged customers in the first six months of 2011
rose by just 3% globally. Having fallen to levels not seen
since 2004, we have at least moved on, with the average
global hotel price finally approaching its 2005 level.
“Events, dear boy, events…”
2011 has seen the largest impact from political, and even
geological, events that we’ve seen in the lifetime of this
survey. The revolutions, violent or otherwise, of the Arab
Spring, naturally curtailed demand for a series of important
leisure and business destinations, from the resorts of Egypt
and Tunisia to business travel to Bahrain. As properties
emptied even in areas not directly involved, hoteliers had no
choice but to cut rates to attract business. For UK travellers,
David Roche
President of Hotels.comForeword

2 The Hotel Price Index Review of global hotel prices: Jan-Jun 2011
economic hotspots. Brazil, up 7%, is a case in point,
exacerbated by a lack of new hotels in its major cities with
rates in Sao Paolo rising 27%. In Asia Pacific, destinations
from Singapore to Sydney posted double digit price
increases.
We’ve been following what has driven this in the last two HPI
reports. Business and convention travel has staged a revival,
filling hotels and prompting recovery. Global spending on
business travel is projected to grow another 9.2% in 2011,
according to the GBTA Foundation’s latest report, with
all four BRIC countries outpacing the more developed
economies.
However, as demand has increased, so has supply, which
acts as a brake on prices. There are still nearly 6,000 new
hotel projects in development around the world, adding more
than 900,000 hotel rooms. New York in particular is leading
the way with 20,000 rooms in the construction and planning
phases, according to the July 2011 STR Global Construction
Pipeline Report. London tops the European chart with over
4,500 additional rooms. Asia-Pacific hotel development is
expanding rapidly with 1,244, and over 300,000 rooms,
under construction. 120,000 of these are in China alone.
Hoteliers fear a rise in their local currency
Another feature of this report is how currency exchange
rates have created huge variations in whether prices are
rising or falling for your pocket. The relative weakness of
the US Dollar and Pound Sterling is great news for travellers
paying in Euros, Australian Dollars or Swedish Krona but
relatively higher prices in their own countries mean that
many visitors will have been deterred. Thus UK hoteliers can
breathe a complacent sigh of relief at the relative weakness
of Sterling, knowing that their own countrymen are more
willing to stay domestically, and that overseas visitors find the
UK more affordable.
Wherever you are, and wherever you are going, the HPI
should have the data you need, as well as some lighter
moments. Just which nation spends more when it travels
than any other? How many square feet can you get for
your money around the world? And just who are the most
adventurous when sampling the local cuisine? For the
answers to all this, and more, read on.
3The Hotel Price Index Review of global hotel prices: Jan-Jun 2011
1. Global price changes
2. Price changes in global city destinations
3. Price changes by country
4. Focus on the UK
5. Prices paid at home and away
6. Where to go for £100 a night
7. Average room prices by star rating
8. Luxury for less
9. Travel habits
Top UK destinations for UK travellers
Top overseas destinations for UK travellers
Top UK destinations for travellers from overseas
10. Hotel facts check-out
Contents
5
8
18
24
30
32
34
37
39
42
4 The Hotel Price Index Review of global hotel prices: Jan-Jun 2011
The second section (Chapters 2-9) shows hotel prices
across the world per room per night as paid by UK travellers
in Pounds Sterling, comparing prices paid in the January-
June period of 2011 with the same period in 2010. This
shows the changes in real prices paid by consumers,
reflecting both movements in exchange rates and
hotel pricing.
Prices are rounded to the nearest Pound and percentage
figures to the nearest percentage point.
The final chapter focuses on some additional, more light-
hearted facts and hotel habits identified by Hotels.com.
In the HPI report, we focus on two main sources of data.
The first section (Chapter 1) shows the global Hotel
Price Index for the first half of 2011 compared with the
corresponding period in 2010.
The Index is compiled from all relevant transactions on
Hotels.com, in local currency, weighted to reflect the size of
each market. By representing hotel price movements in an
index, Hotels.com can illustrate the actual price movements
as paid by consumers without foreign exchange fluctuations
distorting the picture.
The Index was started in 2004 at 100 and includes all
bookings across all star ratings from one to five star.
5The Hotel Price Index Review of global hotel prices: Jan-Jun 2011
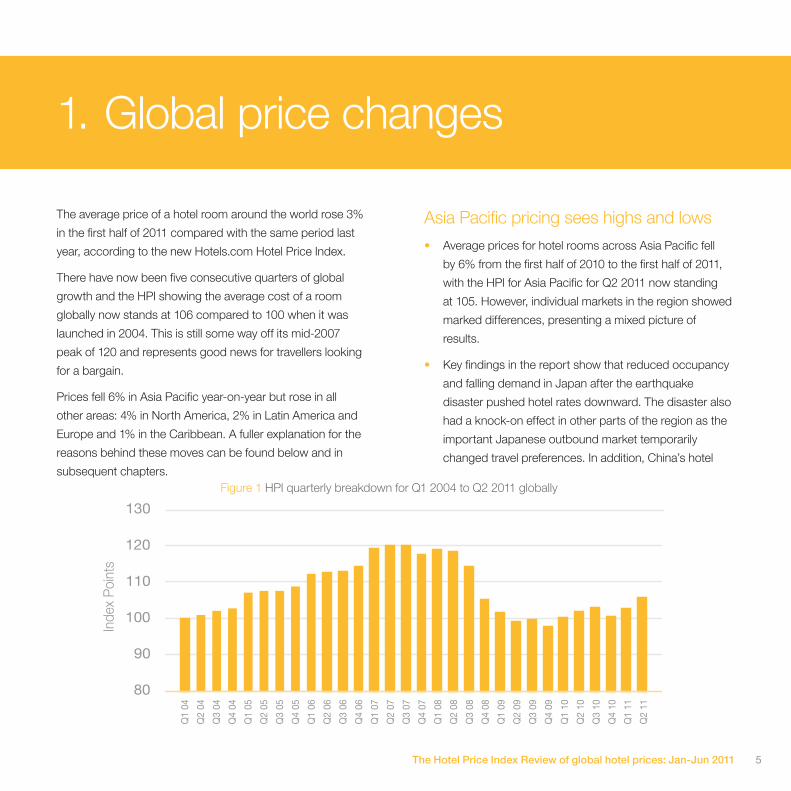
The average price of a hotel room around the world rose 3%
in the first half of 2011 compared with the same period last
year, according to the new Hotels.com Hotel Price Index.
There have now been five consecutive quarters of global
growth and the HPI showing the average cost of a room
globally now stands at 106 compared to 100 when it was
launched in 2004. This is still some way off its mid-2007
peak of 120 and represents good news for travellers looking
for a bargain.
Prices fell 6% in Asia Pacific year-on-year but rose in all
other areas: 4% in North America, 2% in Latin America and
Europe and 1% in the Caribbean. A fuller explanation for the
reasons behind these moves can be found below and in
subsequent chapters.
1. Global price changes
Figure 1 HPI quarterly breakdown for Q1 2004 to Q2 2011 globally
Asia Pacific pricing sees highs and lows
• Average prices for hotel rooms across Asia Pacific fell
by 6% from the first half of 2010 to the first half of 2011,
with the HPI for Asia Pacific for Q2 2011 now standing
at 105. However, individual markets in the region showed
marked differences, presenting a mixed picture of
results.
• Key findings in the report show that reduced occupancy
and falling demand in Japan after the earthquake
disaster pushed hotel rates downward. The disaster also
had a knock-on effect in other parts of the region as the
important Japanese outbound market temporarily
changed travel preferences. In addition, China’s hotel
Q1
04
Q2
04
Q3
04
Q4
04
Q1
05
Q2
05
Q3
05
Q4
05
Q1
06
Q2
06
Q3
06
Q4
06
Q1
07
Q2
07
Q3
07
Q4
07
Q1
08
Q2
08
Q3
08
Q4
08
Q1
09
Q2
09
Q3
09
Q4
09
Q1
10
Q2
10
Q3
10
Q4
10
Inde
x Po
ints
Q1
11
Q2
11
80
90
100
110
120
130

6 The Hotel Price Index Review of global hotel prices: Jan-Jun 2011
prices fell compared to a year ago mainly due to the
expected weaker demand in Shanghai and the
surrounding region. Last year’s World Expo saw a spike
in prices and accommodation supply in the Shanghai
region.
• Despite these downward price pressures, there have
also been clear rises in rates paid in many places. For
example, continued strong inbound business and leisure
travel to Hong Kong caused hotel stays to become more
expensive. Many Australian cities also noted high
occupancy and rising prices, as corporate travel
continued strongly and the Australian dollar remained
high for tourists.
• Overall lower average prices paid for hotels in the region
means good news both for travellers coming into Asia
and for travellers within Asia. During this period,
consumers travelling to Asia have benefited from the
favourable exchange rates in many of their currencies.
One note of advice to travellers is to search and compare
alternatives, as individual markets exhibit different trends.
Europe shows modest signs of recovery
• The HPI in Europe reached 105 points in Q2 2011, the
highest it has been since Q4 2008 but 12% lower than
at its peak in Q2 2007.
• This figure meant travellers to European destinations
were paying just 5% more for hotel rooms than in 2004
when the Index began.
• There was a 2% price increase in the January-June
2011 period compared with the first half of last year and
four months of successive rises up to the end of June.
• Again, the picture is mixed across the region with
Iceland recovering from the effects of the volcanic
eruption in 2010, Ireland boosted by the visits of the
Queen Elizabeth II and President Obama and Spain
helped by an increase in visitor numbers as travellers
avoided the unrest in Egypt and North Africa. Elsewhere,
the economic problems in Greece drove prices down.
Latin America

7The Hotel Price Index Review of global hotel prices: Jan-Jun 2011
HPI highest in Latin America
• Prices paid by travellers for hotel rooms in Latin America
rose 2% from the first half of 2010 to the first half of 2011
and its HPI for Q2 2011 stood at 112, the highest out of
the regions surveyed.
• Latin American hotel prices have now risen for five
successive quarters, a trend mirrored only by North
America, and underlines the growing economic power of
the region, especially in its largest country, Brazil.
North American recovery continues
• Average prices paid by travellers for hotel rooms in North
America (the US and Canada) rose 4% year-on-year in
the first six months of 2011 with the region’s HPI hitting
105 for Q2 2011.
• North America has been experiencing small but steady
increases in prices for the last five quarters. Stronger
demand, from leisure and business travellers, has given
hoteliers the confidence to hold or increase their prices.
• Despite the modest increases, average room rates were
just 5% higher than when the HPI started in 2004.
North America
Caribbean prices warming
• Prices for the Caribbean rose by 1% year-on-year. For
Q2 2011, the HPI for the region stood at 101 points,
30 points down on its Q1 2007 peak and just one point
above the HPI at its 2004 launch.
• The Caribbean had experienced nine successive
quarters of percentage falls from Q1 2008 to Q1 2010
but has stabilised since then with a pattern of modest
recovery.

8 The Hotel Price Index Review of global hotel prices: Jan-Jun 2011
2. Price changes in global city destinations
The following sections reflect the real Pound Sterling (£)
prices paid by travellers from the UK during the first half of
2011, compared to prices paid in Pound Sterling over the
same period a year before.
UK travellers faced price rises in many of their favourite
destinations. This could in part be explained by currency
fluctuations but it was also due to hoteliers raising rates
and offering fewer discounts as the overall global economy
continued its recovery.
Crises hit hotel prices
City hotel prices in countries which were hit by political
turmoil and natural disasters dropped sharply.
Room rates in Osaka fell 29% to £53 and by 19% to £84
in Kyoto as Japan suffered the triple blow of earthquake,
tsunami and nuclear crisis in March. There was a modest
3% increase in Tokyo to £104, mainly due to currency
fluctuations, although the long-term effects on hotel pricing
in the country may still not have been fully felt. However, in a
recent Hotels.com poll of 500 people in 17 countries, 86% of
respondents said they would consider a trip to Japan within
the next year.
In Egypt, the popular Red Sea resort of Sharm El Sheikh saw
room rates drop 26% to £66 as foreign tourists stayed away
because of the “Arab Spring” uprising and mounting political
unrest across the Middle East and North Africa. However,
prices rose 3% in Cairo because of demand from corporate
travellers.
The impact of the civil unrest spread to unaffected countries
in the region with Doha in Qatar down 39% as business
travel slowed. Prices also fell in Dubai, down 13%, and Abu
Dhabi, down 9%, a trend bolstered by growing capacity with
more than 150 new hotel projects under construction in the
Gulf States. Increased flight costs due to the fuel price rises
also impacted travel to the region from the UK.
Mixed picture in Europe
The crisis in the debt-hit Greek economy continued to have
an effect on prices in the country’s hotel sector with average
rates in Athens falling 15% to £80, which is good news for
travellers wanting to visit mainland Greece and its islands.
There was also a drop in the capital of another debt-hit
country with prices dropping 3% to £79 in the Portuguese
city of Lisbon. However, Dublin bucked the trend with a 7%
rise to £73, helped by some high-profile visits and a number
of popular events, as well as a stabilisation of hotel prices
which had fallen 35%, the heaviest slump in Europe, over the
past three years.
Reykjavik also recovered from last year’s double whammy
of the volcanic ash cloud and banking crisis, with prices
rising 19% to £92. The fall in the value of the Icelandic
Krona boosted demand from foreign visitors, as the city is

9The Hotel Price Index Review of global hotel prices: Jan-Jun 2011
Monte Carlo
a popular weekend destination with short flying times from
Europe, and hoteliers raised prices accordingly.
There were significant price rises in Eastern European cities
which have offered relatively cheap hotel accommodation in
the past. These came after increased demand from travellers
making the most of the low prices. Vilnius rose 20% to £57,
Warsaw 16% to £77, Tallinn 9% to £59 and Prague 7% to
£72, still representing good value.
Monte Carlo stayed the most expensive European
destination for UK travellers but was joined on £171 by
Geneva, up 14% on last year. Elsewhere, popular Eurozone
city break destinations became more expensive, such as
Amsterdam where increased occupancy also helped to
push prices up 13% as the Euro gained in value against the
Pound.
Many popular Italian and Spanish destinations also saw
increased prices with demand soaring as travellers switched
from resorts in troubled North African countries such as
Egypt and Tunisia. The biggest percentage rise of 57% came
on the Balearic holiday island of Ibiza, taking the average
room rate to £117.
Rome rose 6% to £120 and Barcelona also became more
expensive for UK travellers rising 5% to £102, an increase
fuelled by events such as the Formula One Grand Prix
in May as well as international congresses, coupled with
the growing popularity of cruising, which saw a rise in the
number of cruise holidaymakers stopping off in the city.
The impact of one-off events could also be seen in
Dusseldorf where prices rose 17%, in part fuelled by the city
hosting the Eurovision Song Contest in May.
Demand rises in American cities
UK travellers exploiting the Pound’s relative strength against
the US Dollar still found that hotel rooms in some of their
favourite destinations were more expensive.
There was less discounting among hoteliers than last year as
US corporate travellers pushed up demand and prices, with
convention centres such as Boston, San Francisco and Las
Vegas posting 10%, 9% and 5% increases to £134, £103
and £73 respectively.
10 The Hotel Price Index Review of global hotel prices: Jan-Jun 2011
Even though New York had the largest increase in supply
this year, especially at the upper end of the market, there
was still a 6% increase in prices to £160 as demand was
robust from domestic travellers and European visitors
cashing in on the appreciation of their currencies against the
US Dollar.
South African cities see price falls after World Cup
Travellers to South Africa enjoyed lower prices in the
aftermath of the 2010 football World Cup. Popular
stadium cities experienced double-digit percentage
drops as demand tailed off and World Cup premium rates
disappeared.
Room rates dropped 13% in Johannesburg to £111 from
£129 and Cape Town, a base for many England supporters,
saw a 20% drop from £126 to £100.
Prices up Down Under
The Australian economy was less affected by the global
recession and the subsequent strength of the Australian
Dollar led to a decline in UK travellers and those from the
Eurozone and US. This was offset by a rise in corporate
travel and a growth in the number of visitors from China
as more direct flights between the two countries became
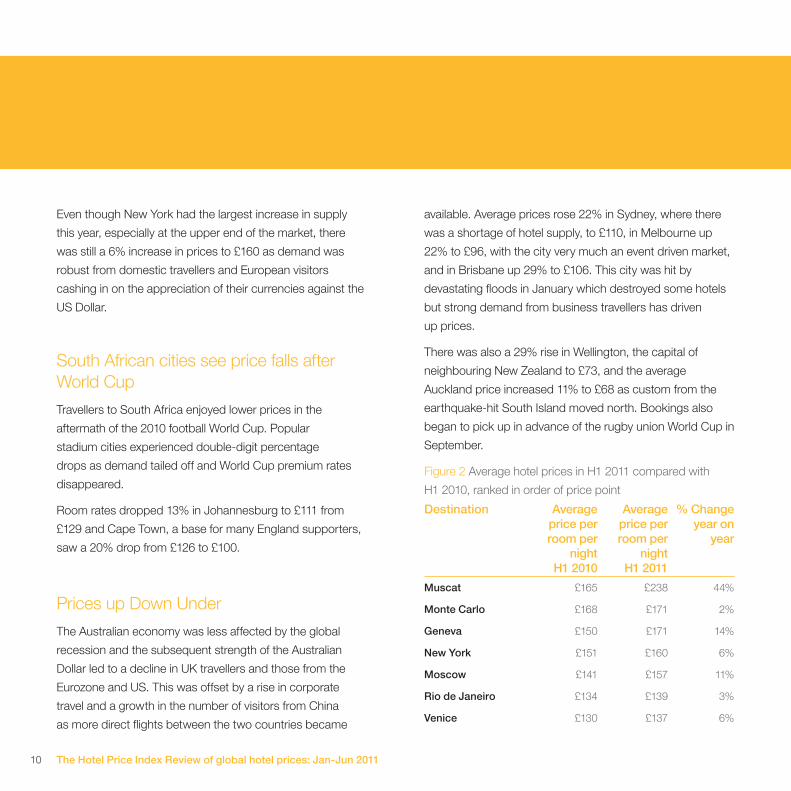
Destination Average price per room per
night H1 2010
Average price per room per
night H1 2011
% Change year on
year
Muscat £165 £238 44%
Monte Carlo £168 £171 2%
Geneva £150 £171 14%
New York £151 £160 6%
Moscow £141 £157 11%
Rio de Janeiro £134 £139 3%
Venice £130 £137 6%
available. Average prices rose 22% in Sydney, where there
was a shortage of hotel supply, to £110, in Melbourne up
22% to £96, with the city very much an event driven market,
and in Brisbane up 29% to £106. This city was hit by
devastating floods in January which destroyed some hotels
but strong demand from business travellers has driven
up prices.
There was also a 29% rise in Wellington, the capital of
neighbouring New Zealand to £73, and the average
Auckland price increased 11% to £68 as custom from the
earthquake-hit South Island moved north. Bookings also
began to pick up in advance of the rugby union World Cup in
September.
Figure 2 Average hotel prices in H1 2011 compared with
H1 2010, ranked in order of price point
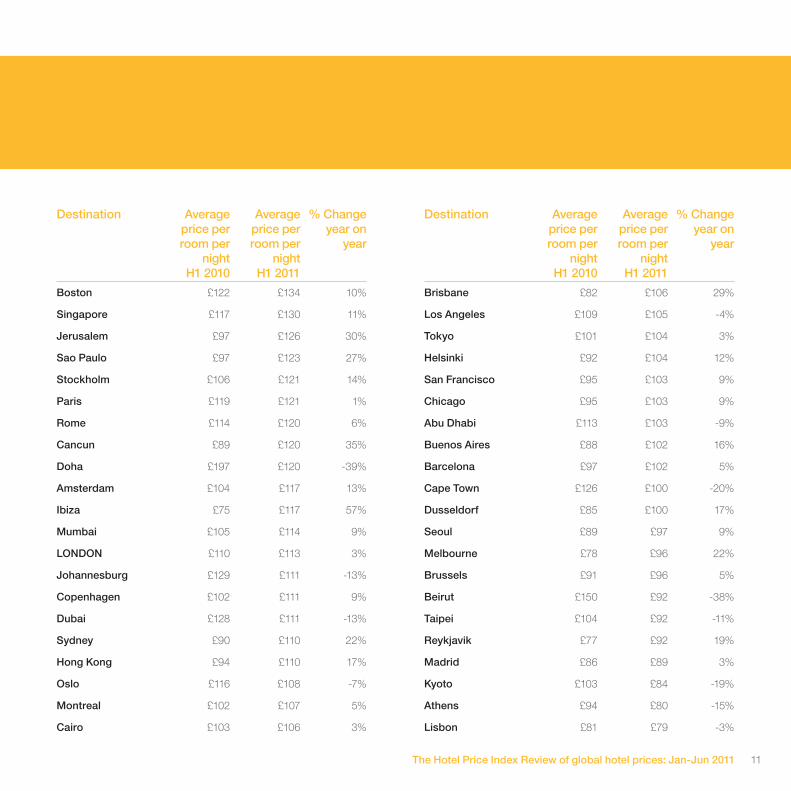
11The Hotel Price Index Review of global hotel prices: Jan-Jun 2011
Destination Average price per room per
night H1 2010
Average price per room per
night H1 2011
% Change year on
year
Boston £122 £134 10%
Singapore £117 £130 11%
Jerusalem £97 £126 30%
Sao Paulo £97 £123 27%
Stockholm £106 £121 14%
Paris £119 £121 1%
Rome £114 £120 6%
Cancun £89 £120 35%
Doha £197 £120 -39%
Amsterdam £104 £117 13%
Ibiza £75 £117 57%
Mumbai £105 £114 9%
LONDON £110 £113 3%
Johannesburg £129 £111 -13%
Copenhagen £102 £111 9%
Dubai £128 £111 -13%
Sydney £90 £110 22%
Hong Kong £94 £110 17%
Oslo £116 £108 -7%
Montreal £102 £107 5%
Cairo £103 £106 3%
Destination Average price per room per
night H1 2010
Average price per room per
night H1 2011
% Change year on
year
Brisbane £82 £106 29%
Los Angeles £109 £105 -4%
Tokyo £101 £104 3%
Helsinki £92 £104 12%
San Francisco £95 £103 9%
Chicago £95 £103 9%
Abu Dhabi £113 £103 -9%
Buenos Aires £88 £102 16%
Barcelona £97 £102 5%
Cape Town £126 £100 -20%
Dusseldorf £85 £100 17%
Seoul £89 £97 9%
Melbourne £78 £96 22%
Brussels £91 £96 5%
Beirut £150 £92 -38%
Taipei £104 £92 -11%
Reykjavik £77 £92 19%
Madrid £86 £89 3%
Kyoto £103 £84 -19%
Athens £94 £80 -15%
Lisbon £81 £79 -3%

12 The Hotel Price Index Review of global hotel prices: Jan-Jun 2011
Figure 3 The biggest percentage price rises in H1 2011
compared with H1 2010, ranked by percentage change
Destination Average price per room per
night H1 2010
Average price per room per
night H1 2011
% Change year on
year
Ibiza £75 £117 57%
Muscat £165 £238 44%
Cancun £89 £120 35%
Jerusalem £97 £126 30%
Wellington £56 £73 29%
Brisbane £82 £106 29%
Sao Paulo £97 £123 27%
Melbourne £78 £96 22%
Sydney £90 £110 22%
Benidorm £63 £77 22%
Vilnius £47 £57 20%
Reykjavik £77 £92 19%
Hong Kong £94 £110 17%
Dusseldorf £85 £100 17%
Warsaw £66 £77 16%
Buenos Aires £88 £102 16%
Stockholm £106 £121 14%
Geneva £150 £171 14%
Destination Average price per room per
night H1 2010
Average price per room per
night H1 2011
% Change year on
year
Benidorm £63 £77 22%
Warsaw £66 £77 16%
Shanghai £93 £76 -19%
Dublin £69 £73 7%
Wellington £56 £73 29%
Las Vegas £69 £73 5%
Prague £67 £72 7%
Berlin £74 £72 -3%
Kuala Lumpur £67 £72 7%
Budapest £66 £68 2%
Auckland £61 £68 11%
Beijing £68 £67 -2%
Krakow £67 £67 0%
Sharm El Sheikh £89 £66 -26%
Tallinn £54 £59 9%
Vilnius £47 £57 20%
Bangkok £57 £57 -1%
Riga £52 £53 2%
Osaka £75 £53 -29%
Manila £57 £46 -19%
Hanoi £56 £42 -24%
13The Hotel Price Index Review of global hotel prices: Jan-Jun 2011
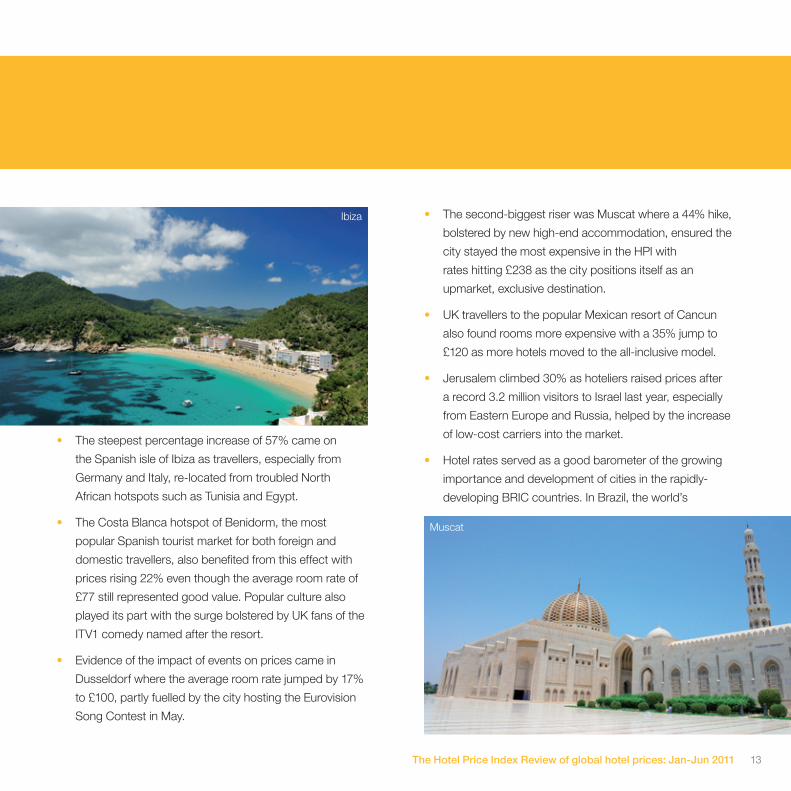
• The second-biggest riser was Muscat where a 44% hike,
bolstered by new high-end accommodation, ensured the
city stayed the most expensive in the HPI with
rates hitting £238 as the city positions itself as an
upmarket, exclusive destination.
• UK travellers to the popular Mexican resort of Cancun
also found rooms more expensive with a 35% jump to
£120 as more hotels moved to the all-inclusive model.
• Jerusalem climbed 30% as hoteliers raised prices after
a record 3.2 million visitors to Israel last year, especially
from Eastern Europe and Russia, helped by the increase
of low-cost carriers into the market.
• Hotel rates served as a good barometer of the growing
importance and development of cities in the rapidly-
developing BRIC countries. In Brazil, the world’s
Muscat
• The steepest percentage increase of 57% came on
the Spanish isle of Ibiza as travellers, especially from
Germany and Italy, re-located from troubled North
African hotspots such as Tunisia and Egypt.
• The Costa Blanca hotspot of Benidorm, the most
popular Spanish tourist market for both foreign and
domestic travellers, also benefited from this effect with
prices rising 22% even though the average room rate of
£77 still represented good value. Popular culture also
played its part with the surge bolstered by UK fans of the
ITV1 comedy named after the resort.
• Evidence of the impact of events on prices came in
Dusseldorf where the average room rate jumped by 17%
to £100, partly fuelled by the city hosting the Eurovision
Song Contest in May.
Ibiza
14 The Hotel Price Index Review of global hotel prices: Jan-Jun 2011
Destination Average price per room per
night H1 2010
Average price per room per
nightH1 2011
% Change year on
year
Doha £197 £120 -39%
Beirut £150 £92 -38%
Osaka £75 £53 -29%
Sharm El Sheikh £89 £66 -26%
Hanoi £56 £42 -24%
Cape Town £126 £100 -20%
Manila £57 £46 -19%
Kyoto £103 £84 -19%
Shanghai £93 £76 -19%
Athens £94 £80 -15%
Johannesburg £129 £111 -13%
Dubai £128 £111 -13%
Taipei £104 £92 -11%
Abu Dhabi £113 £103 -9%
seventh largest economy with a strong currency, the
average room rate in Sao Paulo rose 27% to £123 as
demand, especially from business visitors, continued to
outstrip supply. Hong Kong was also up 17% to £110
due to an influx of foreign corporate travellers and leisure
visitors and shoppers from China.
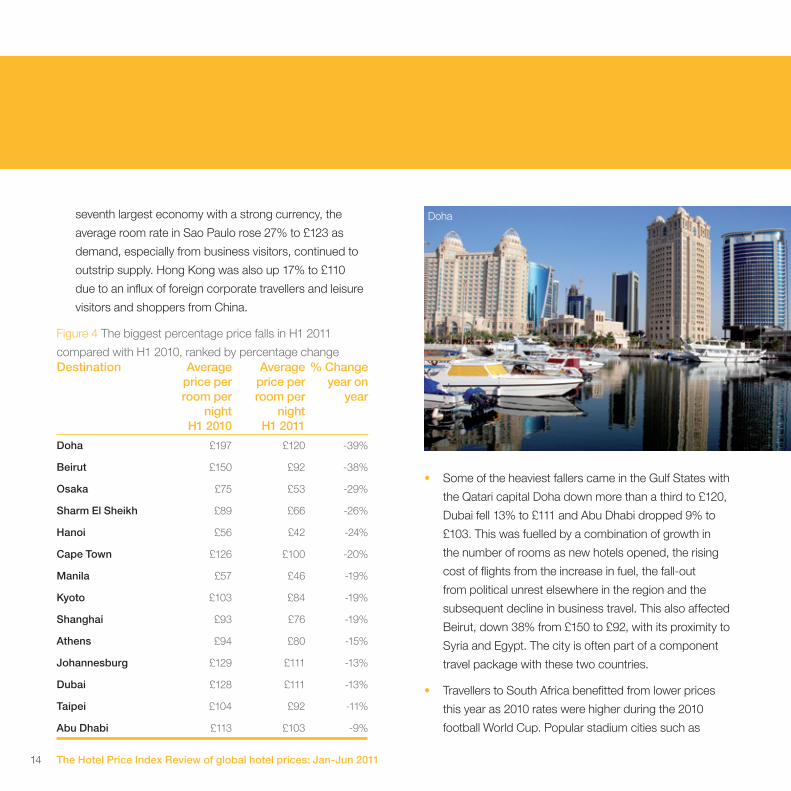
Figure 4 The biggest percentage price falls in H1 2011
compared with H1 2010, ranked by percentage change
• Some of the heaviest fallers came in the Gulf States with
the Qatari capital Doha down more than a third to £120,
Dubai fell 13% to £111 and Abu Dhabi dropped 9% to
£103. This was fuelled by a combination of growth in
the number of rooms as new hotels opened, the rising
cost of flights from the increase in fuel, the fall-out
from political unrest elsewhere in the region and the
subsequent decline in business travel. This also affected
Beirut, down 38% from £150 to £92, with its proximity to
Syria and Egypt. The city is often part of a component
travel package with these two countries.
• Travellers to South Africa benefitted from lower prices
this year as 2010 rates were higher during the 2010
football World Cup. Popular stadium cities such as
Doha

15The Hotel Price Index Review of global hotel prices: Jan-Jun 2011
Ibiz
a
Mu
scat
Can
cun
Jeru
sale
m
Wel
ling
ton
Bri
sban
e
Sao
Pau
lo
Mel
bo
urn
e
Syd
ney
Ben
ido
rm
Rey
kjav
ik
Ho
ng
Ko
ng
Du
ssel
do
rf
War
saw
Gen
eva
Taip
ei
J’B
urg
Du
bai
Ath
ens
Man
ila
Kyo
to
Sh
ang
hai
Cap
e To
wn
Han
oi
Sh
arm
El S
hei
kh
Osa
ka
Bei
rut
Do
ha
Ab
uD
hab
i
Bu
eno
s A
ires
Figure 5 The biggest percentage price rises and falls in H1 2011 compared with H1 2010, ranked by percentage change
Cape Town and Johannesburg experienced double-digit
percentage drops as demand and prices fell.
• Far Eastern cities featured prominently in the list with
prices falling in Hanoi by 24%, Manila by 19% and Taipei
by 11%. There was a 19% fall in Shanghai as the market
re-adjusted after the World Expo event from April to
October last year and the opening of new hotels.
• The impact of the Japanese earthquake, tsunami and
nuclear crisis hit both Osaka and Kyoto, down 29% and
19% respectively.
Kyoto
16 The Hotel Price Index Review of global hotel prices: Jan-Jun 2011
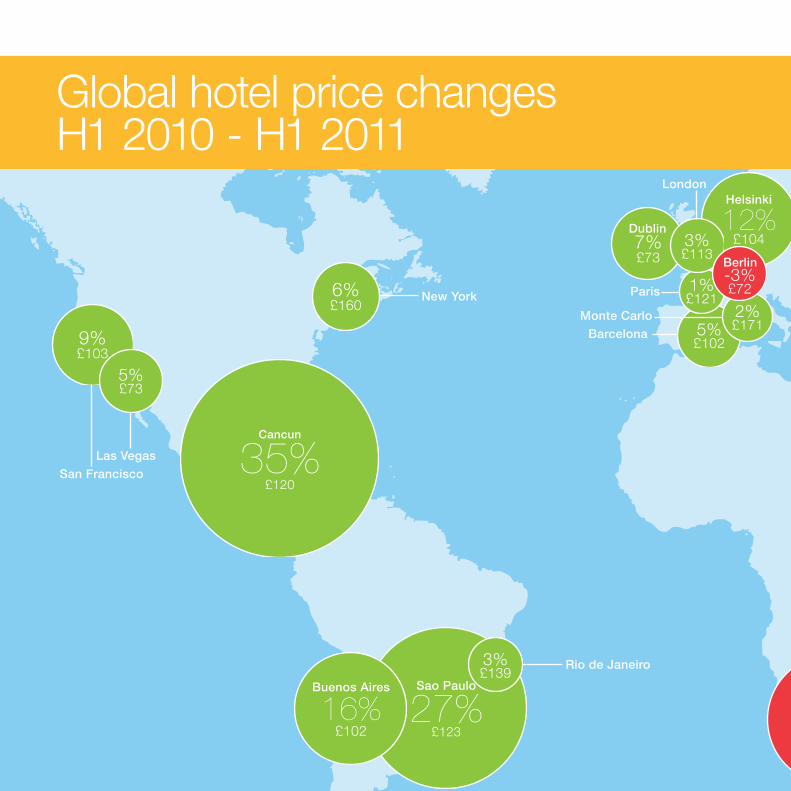
27%£123
Sao Paulo
New York6%£160
3%£139
Rio de Janeiro
11%£130
Singapore
-39%£120
Doha
44%£238
Muscat9%£114
Mumbai
22%£110
Sydney
3%£106
Cairo
9%£103
Barcelona 5%£102
Monte Carlo 2%£171
16%£102
Buenos Aires
-20%£100
Cape Town 22%£96
Melbourne
Paris 1%£121
Las Vegas
7%£73
Dublin
-2%£67
Bangkok -1%£57
12%£104
Helsinki
17%£110
Hong Kong
-19%£84
Kyoto3%£104
Tokyo
5%£73
San Francisco
Beijing
3%£113
London
-3%£72
Berlin
14%£171
Geneva
11%£157
Moscow
35%£120
Cancun
-13%£111
Dubai
Global hotel price changes H1 2010 - H1 2011

17The Hotel Price Index Review of global hotel prices: Jan-Jun 2011
27%£123
Sao Paulo
New York6%£160
3%£139
Rio de Janeiro
11%£130
Singapore
-39%£120
Doha
44%£238
Muscat9%£114
Mumbai
22%£110
Sydney
3%£106
Cairo
9%£103
Barcelona 5%£102
Monte Carlo 2%£171
16%£102
Buenos Aires
-20%£100
Cape Town 22%£96
Melbourne
Paris 1%£121
Las Vegas
7%£73
Dublin
-2%£67
Bangkok -1%£57
12%£104
Helsinki
17%£110
Hong Kong
-19%£84
Kyoto3%£104
Tokyo
5%£73
San Francisco
Beijing
3%£113
London
-3%£72
Berlin
14%£171
Geneva
11%£157
Moscow
35%£120
Cancun
-13%£111
Dubai

18 The Hotel Price Index Review of global hotel prices: Jan-Jun 2011
3. Price changes by country
Prices rose in three quarters of the countries favoured by
UK travellers in H1 2011, according to the latest Hotel
Price Index.
However, there were significant falls triggered by political and
economic crises and natural disasters.
The biggest faller was Egypt which was hit by political
instability after the uprising against the government in
January. The average room rate fell by 25% as tourists
stayed away and hoteliers were forced to discount to
encourage visitors.
The United Arab Emirates, including the popular tourist and
business destination of Dubai, also dropped 13% as the
fall-out from the “Arab Spring” spread across the region to
affect even those markets which had avoided civil unrest.
Another big faller was Japan, down 9%, following the series
of disasters earlier this year.
Struggling Eurozone countries Greece and Portugal fell
4% and 1% respectively, although Irish prices bucked the
trend rising 6% to £73. This was partly due to the interest
sparked by events such as the Ireland-England rugby match
in March, the Take That concert in June and the visits of
the Queen Elizabeth II and Barack Obama which created
positive headlines around the world. Considerably higher
visitor numbers were reported at many tourist spots around
the country during this period.
Spain posted a modest 3% increase in the face of a 21%
unemployment rate and a troubled economy. Domestic
demand fell back especially in some cities but the hotel
sector held its own due to the strong performance of
Mediterranean resorts such as the Canary and Balearic
Islands which picked up custom from troubled North African
countries like Egypt and Tunisia from the UK and Germany.
The South African hotel sector re-adjusted after the surge in
prices before and during last summer’s football World Cup
with the second biggest fall of 17% taking the average room
rate to £105.
Switzerland retained its place as the most expensive country
for UK visitors compared with H1 2010, with average room
rates reaching £144 after an 11% hike, followed closely by
Russia on £141 and Israel on £134.
The biggest percentage price rise of 20% happened in
Switzerland
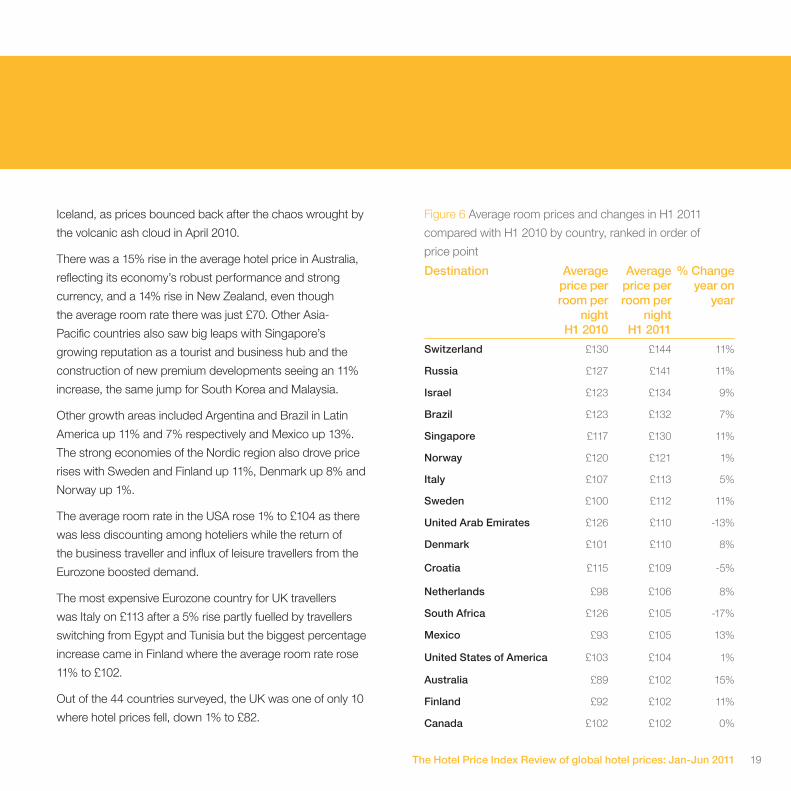
19The Hotel Price Index Review of global hotel prices: Jan-Jun 2011
Iceland, as prices bounced back after the chaos wrought by
the volcanic ash cloud in April 2010.
There was a 15% rise in the average hotel price in Australia,
reflecting its economy’s robust performance and strong
currency, and a 14% rise in New Zealand, even though
the average room rate there was just £70. Other Asia-
Pacific countries also saw big leaps with Singapore’s
growing reputation as a tourist and business hub and the
construction of new premium developments seeing an 11%
increase, the same jump for South Korea and Malaysia.
Other growth areas included Argentina and Brazil in Latin
America up 11% and 7% respectively and Mexico up 13%.
The strong economies of the Nordic region also drove price
rises with Sweden and Finland up 11%, Denmark up 8% and
Norway up 1%.
The average room rate in the USA rose 1% to £104 as there
was less discounting among hoteliers while the return of
the business traveller and influx of leisure travellers from the
Eurozone boosted demand.
The most expensive Eurozone country for UK travellers
was Italy on £113 after a 5% rise partly fuelled by travellers
switching from Egypt and Tunisia but the biggest percentage
increase came in Finland where the average room rate rose
11% to £102.
Out of the 44 countries surveyed, the UK was one of only 10
where hotel prices fell, down 1% to £82.
Destination Average price per room per
night H1 2010
Average price per room per
nightH1 2011
% Change year on
year
Switzerland £130 £144 11%
Russia £127 £141 11%
Israel £123 £134 9%
Brazil £123 £132 7%
Singapore £117 £130 11%
Norway £120 £121 1%
Italy £107 £113 5%
Sweden £100 £112 11%
United Arab Emirates £126 £110 -13%
Denmark £101 £110 8%
Croatia £115 £109 -5%
Netherlands £98 £106 8%
South Africa £126 £105 -17%
Mexico £93 £105 13%
United States of America £103 £104 1%
Australia £89 £102 15%
Finland £92 £102 11%
Canada £102 £102 0%
Figure 6 Average room prices and changes in H1 2011
compared with H1 2010 by country, ranked in order of
price point

20 The Hotel Price Index Review of global hotel prices: Jan-Jun 2011
Destination Average price per room per
night H1 2010
Average price per room per
nightH1 2011
% Change year on
year
Morocco £71 £69 -2%
Egypt £91 £69 -25%
Poland £65 £68 4%
Hungary £66 £67 2%
Thailand £63 £65 3%
Iceland
Destination Average price per room per
night H1 2010
Average price per room per
nightH1 2011
% Change year on
year
France £101 £102 1%
Argentina £90 £100 11%
Turkey £98 £98 0%
Greece £101 £96 -4%
Indonesia £94 £96 2%
South Korea £85 £94 11%
Belgium £92 £94 2%
Austria £90 £94 4%
China £89 £92 4%
Iceland £77 £92 20%
Taiwan £98 £91 -7%
Japan £97 £89 -9%
Malaysia £79 £88 11%
Germany £84 £87 4%
India £83 £85 2%
Spain & Canary Islands £81 £83 3%
UNITED KINGDOM £83 £82 -1%
Portugal £83 £81 -1%
Ireland £69 £73 6%
Czech Republic £67 £72 7%
New Zealand £62 £70 14%

21The Hotel Price Index Review of global hotel prices: Jan-Jun 2011
Figure 7 Average room prices and changes in H1 2011
compared with H1 2010 by price rises, ranked by
percentage change
Figure 8 Average room prices and changes in H1 2011
compared with H1 2010 by price falls, ranked by
percentage change
Destination Average price per room per
night H1 2010
Average price per room per
night H1 2011
% Change year on
year
Egypt £91 £69 -25%
South Africa £126 £105 -17%
United Arab Emirates £126 £110 -13%
Japan £97 £89 -9%
Taiwan £98 £91 -7%
Croatia £115 £109 -5%
Greece £101 £96 -4%
Morocco £71 £69 -2%
Portugal £83 £81 -1%
UNITED KINGDOM £83 £82 -1%
Destination Average price per room per
night H1 2010
Average price per room per
night H1 2011
% Change year on
year
Iceland £77 £92 20%
Australia £89 £102 15%
New Zealand £62 £70 14%
Mexico £93 £105 13%
Singapore £117 £130 11%
Russia £127 £141 11%
Sweden £100 £112 11%
South Korea £85 £94 11%
Switzerland £130 £144 11%
Finland £92 £102 11%
Malaysia £79 £88 11%
Argentina £90 £100 11%
Israel £123 £134 9%
Denmark £101 £110 8%
Netherlands £98 £106 8%
Brazil £123 £132 7%
Ireland £69 £73 6%
Cape Town

£150
£140
£130
£120
£110
£100
£90
£80
£70
£60
Argentina£100 11%
Canada£102 0%
USA£104 1%
Mexico£105 13%
Brazil£132 7%
Thailand£65 3%
New Zealand£70 14%
India£85 2%
Malaysia£88 11%
Japan£89 -9%
Hungary£67 2%
Egypt£69 -25%
Ireland£73 6%
UK£82 -1%
Spain & Canary Islands£83 3%
Germany£87 4%
Turkey£98 0%
France£102 1%
Netherlands£106 8%
Italy£113 5%
Norway£121 1%
Russia£141 11%
Switzerland£144 11%
China£92 4%
Indonesia£96 2%
Australia£102 15%
Singapore£130 11%
Global hotel price changes by country
24 The Hotel Price Index Review of global hotel prices: Jan-Jun 2011
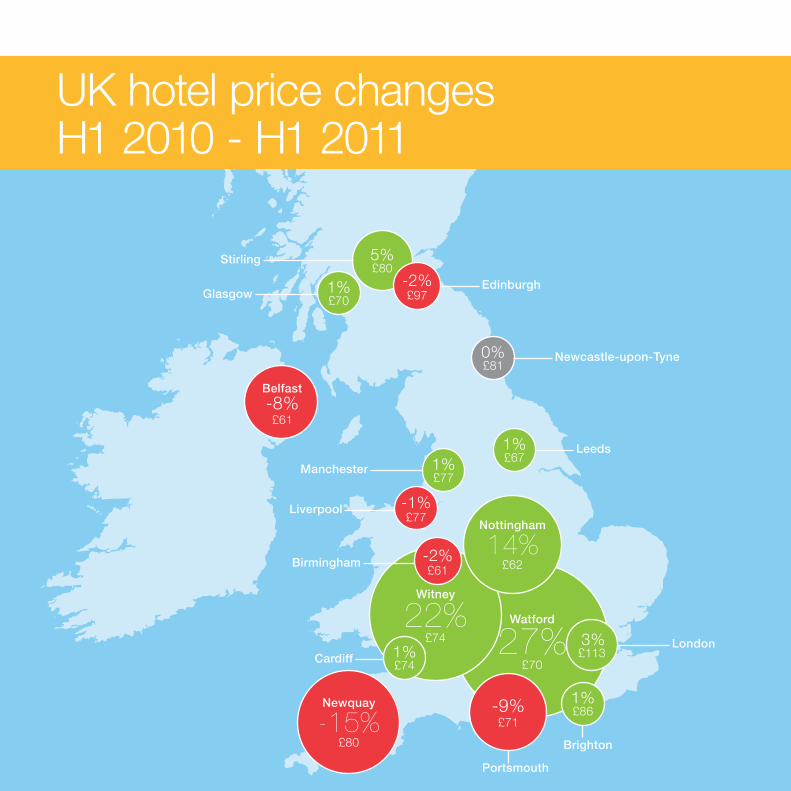
4. Focus on the UK
Hotel room rates fell on average by 1% from £83 to £82 a
night across the UK from H1 2010 to H1 2011.
However, the overall picture masks some dramatic price
movements across the country.
The average cost of a room in London rose 3% to £113, still
behind its 2007 peak, with the city at full capacity for events
such as Chelsea Flower Show and the Wimbledon tennis
tournament. There was still availability on the weekend of
the Royal Wedding in April with many sightseers making day
trips or basing themselves in cheaper locations outside the
city and then travelling in. Hoteliers discounted just prior to
the wedding weekend to encourage more visitors to stay in
the capital.
Over 50% of all visits to the UK include a London component
and the city’s continuing popularity in general forced visitors
to look elsewhere for accommodation which led to some
dramatic price rises in towns close to the capital in the first
half of the year. The average price rose 27% in Watford, the
highest rise in the UK, to £70 and there were other climbers
in High Wycombe, Stevenage and Slough up 16%, 13% and
8% respectively.
Many of the major tourist destinations saw price rises
with Cambridge up 6% to £100 and York up 5% to £88
as demand stayed steady, boosted by the “staycation”
phenomenon and an influx of travellers from the Eurozone
taking advantage of the Euro’s relative strength against the
Pound. The popularity of Oxford also led to a 5% increase
to £103 and an overspill effect as some visitors opted for
nearby towns instead such as Witney and Chipping Norton,
both up 22%.
These factors maintained the buoyancy of the leisure hotel
sector and some traditional seaside resorts saw double-digit
percentage price rises such as Southend-on-Sea up 12% to
£85 and Scarborough up 18% to £60. The Lake District also
remained popular with Bowness-on-Windermere at £134
having the highest average hotel prices in Britain amongst
the destinations included in the report.
Discounting by UK hoteliers in January as some absorbed
the 2.5% increase in Value Added Tax to 20% and a growth
in budget chains also kept prices down.
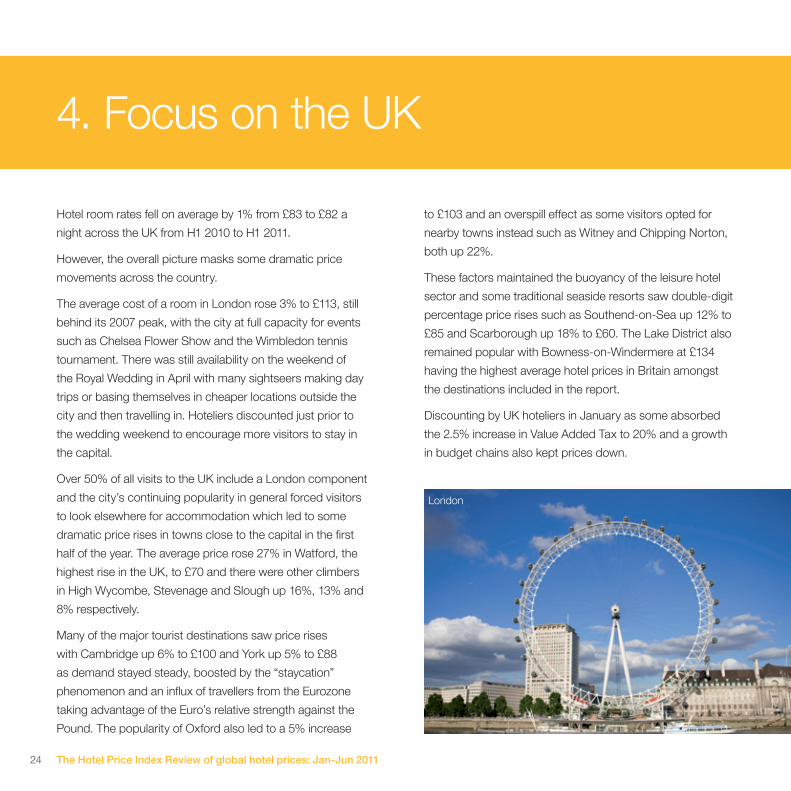
London
25The Hotel Price Index Review of global hotel prices: Jan-Jun 2011
0
30
60
90
120
150
Bo
wne
ss-o
n-W
ind
erm
ere
St.
Pet
er P
ort
Lond
on
Bat
hS
t. H
elie
rO
xfo
rdC
amb
rid
ge
Ed
inb
urg
hYo
rkC
hip
pin
g N
ort
on
Avi
emo
reB
rig
hto
nS
out
hend
-on-
Sea
Ab
erd
een
New
cast
le-u
po
n-Ty
neS
tirlin
gN
ewq
uay
Live
rpo
ol
Man
ches
ter
Witn
eyC
ard
iffC
ante
rbur
yB
rist
ol
Bo
urne
mo
uth
Inve
rnes
sP
ort
smo
uth
Slo
ugh
Dun
dee
Wat
ford
Gla
sgo
wS
wan
sea
Leed
sC
olc
hest
erS
heff
ield
So
uthp
ort
No
ttin
gha
mH
igh
Wyc
om
be
Bel
fast
Bir
min
gha
mS
out
ham
pto
nS
carb
oro
ugh
Bla
ckp
oo
lS
teve
nag
e
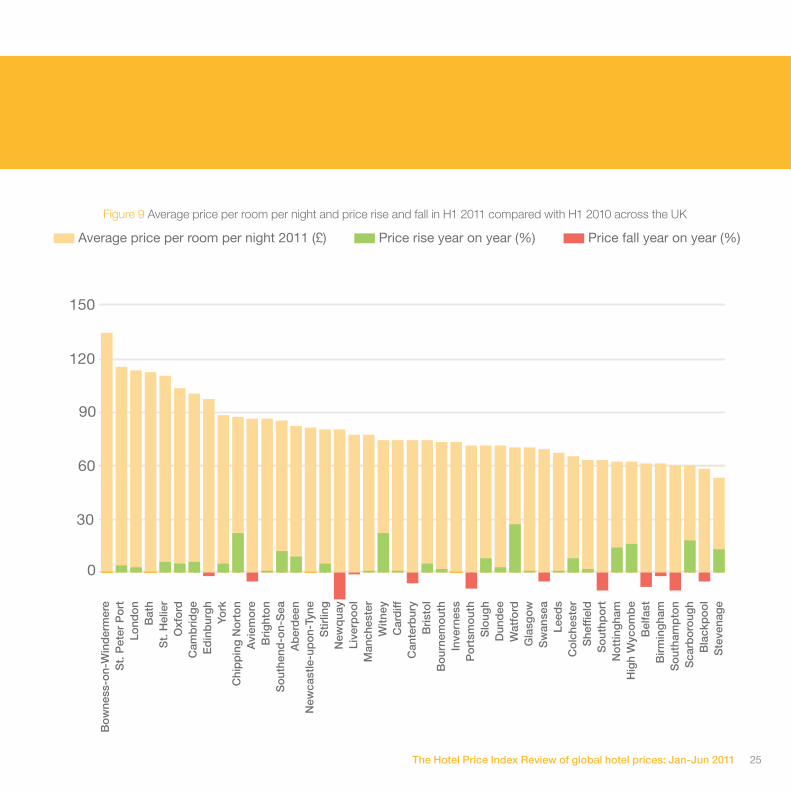
Average price per room per night 2011 (£) Price rise year on year (%) Price fall year on year (%)
Figure 9 Average price per room per night and price rise and fall in H1 2011 compared with H1 2010 across the UK

26 The Hotel Price Index Review of global hotel prices: Jan-Jun 2011
Bowness-on-Windermere
Destination Average price per room per
night H1 2010
Average price per room per
night H1 2011
% Change year on
year
Bowness-on-Windermere
£134 £134 0%
St. Peter Port £110 £115 4%
London £110 £113 3%
Bath £112 £112 0%
St. Helier £104 £110 6%
Oxford £98 £103 5%
Cambridge £94 £100 6%
Destination Average price per room per
night H1 2010
Average price per room per
night H1 2011
% Change year on
year
Edinburgh £98 £97 -2%
York £84 £88 5%
Chipping Norton £71 £87 22%
Aviemore £90 £86 -5%
Brighton £84 £86 1%
Southend-on-Sea £76 £85 12%
Aberdeen £75 £82 9%
Newcastle-upon-Tyne £81 £81 0%
Stirling £76 £80 5%
Newquay £94 £80 -15%
Liverpool £78 £77 -1%
Manchester £76 £77 1%
Witney £61 £74 22%
Cardiff £74 £74 1%
Canterbury £79 £74 -6%
Bristol £70 £74 5%
Bournemouth £72 £73 2%
Inverness £73 £73 0%
Portsmouth £78 £71 -9%
Slough £65 £71 8%
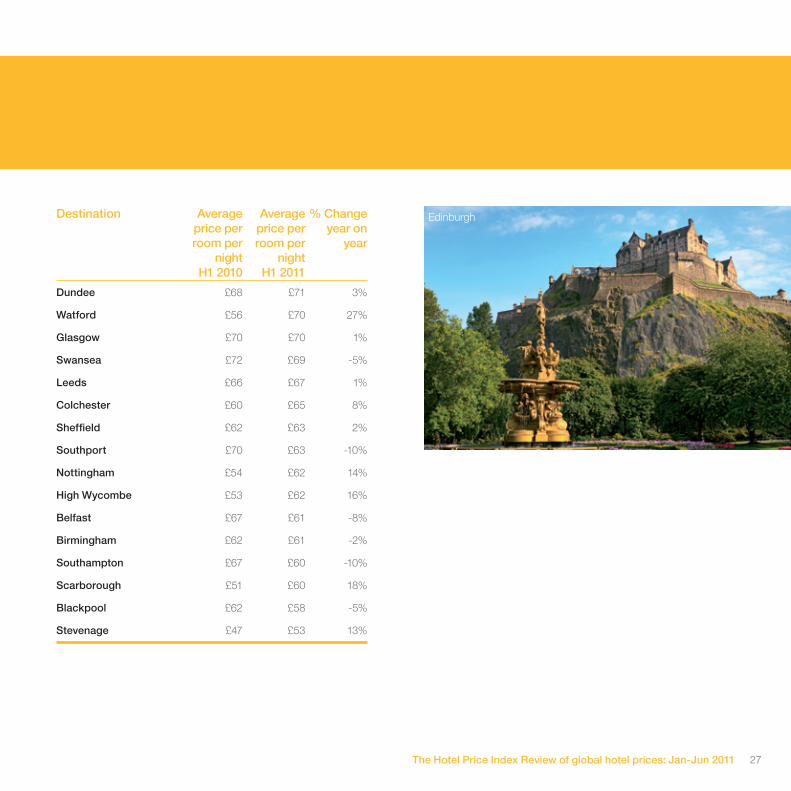
Figure 10 Average room prices and changes in H1 2011
across the UK, ranked in order of price point
27The Hotel Price Index Review of global hotel prices: Jan-Jun 2011
Destination Average price per room per
night H1 2010
Average price per room per
night H1 2011
% Change year on
year
Dundee £68 £71 3%
Watford £56 £70 27%
Glasgow £70 £70 1%
Swansea £72 £69 -5%
Leeds £66 £67 1%
Colchester £60 £65 8%
Sheffield £62 £63 2%
Southport £70 £63 -10%
Nottingham £54 £62 14%
High Wycombe £53 £62 16%
Belfast £67 £61 -8%
Birmingham £62 £61 -2%
Southampton £67 £60 -10%
Scarborough £51 £60 18%
Blackpool £62 £58 -5%
Stevenage £47 £53 13%
Edinburgh
28 The Hotel Price Index Review of global hotel prices: Jan-Jun 2011
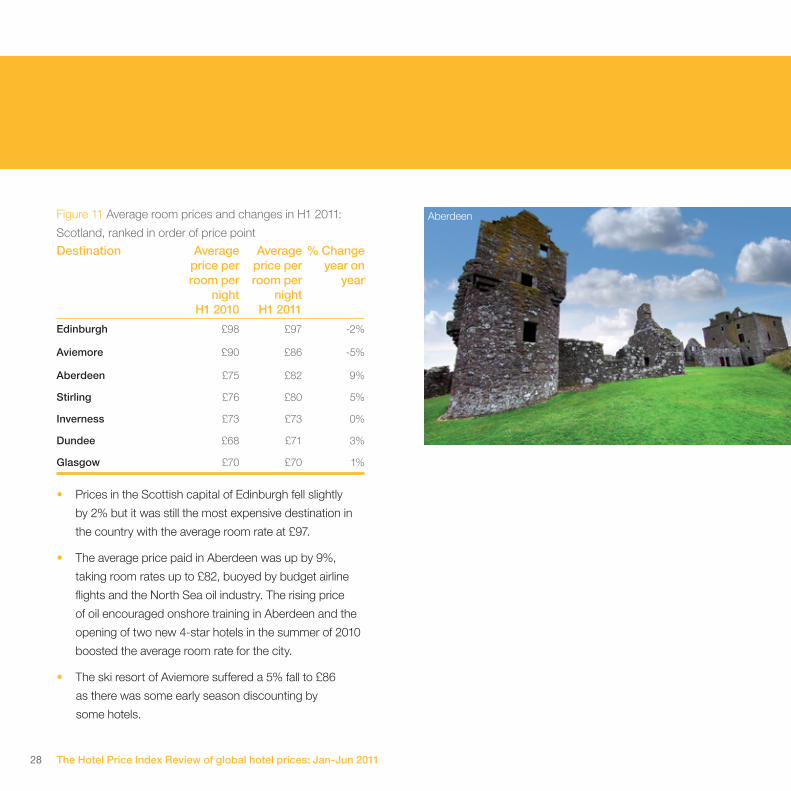
Aberdeen
• Prices in the Scottish capital of Edinburgh fell slightly
by 2% but it was still the most expensive destination in
the country with the average room rate at £97.
• The average price paid in Aberdeen was up by 9%,
taking room rates up to £82, buoyed by budget airline
flights and the North Sea oil industry. The rising price
of oil encouraged onshore training in Aberdeen and the
opening of two new 4-star hotels in the summer of 2010
boosted the average room rate for the city.
• The ski resort of Aviemore suffered a 5% fall to £86
as there was some early season discounting by
some hotels.
Destination Average price per room per
night H1 2010
Average price per room per
night H1 2011
% Change year on
year
Edinburgh £98 £97 -2%
Aviemore £90 £86 -5%
Aberdeen £75 £82 9%
Stirling £76 £80 5%
Inverness £73 £73 0%
Dundee £68 £71 3%
Glasgow £70 £70 1%
Figure 11 Average room prices and changes in H1 2011:
Scotland, ranked in order of price point
29The Hotel Price Index Review of global hotel prices: Jan-Jun 2011
5%£80
27%£70
Watford
Edinburgh
-8%£61
Belfast
1%£86
Brighton
-2%£97Glasgow 1%
£70
1%£67
Leeds
Liverpool -1%£77
London
Manchester 1%£77
0%£81
Newcastle-upon-Tyne
3%£113
22%£74
Witney
-2%£61
Birmingham
Cardiff 1%£74
-15%£80
Newquay -9%£71
Portsmouth
Stirling
14%£62
Nottingham
UK hotel price changesH1 2010 - H1 2011

30 The Hotel Price Index Review of global hotel prices: Jan-Jun 2011
5. Prices paid at home and away
The biggest domestic spenders were the Swiss and the
Norwegians who spent £136 and £119 on hotel rooms at
home. The Indians were those with the best eye for value
within their own borders, spending just £58 when in a
domestic destination.
The Japanese were the biggest spenders on hotel rooms
when they travelled abroad, according to the Hotels.com
Hotel Price Index. They spent an average £111 a night on
hotel rooms when they headed overseas, £2 more than the
Swiss and £5 more than the Americans.
The biggest Eurozone spenders on their travels were the
Austrians who parted with an average £96 a night for a
hotel room.
At the other end of the scale, the Mexicans were the savviest
when outside their borders, parting with £73 a night,
according to the report.
UK travellers were joint ninth in the table of the biggest
spenders along with the Brazilians, splashing out an average
£97 a night abroad. However, they spent £15 less at £82 a
night on domestic hotel rooms.
Tokyo Mexico

31The Hotel Price Index Review of global hotel prices: Jan-Jun 2011
Country HOME AWAY
Switzerland £136 £109
Norway £119 £105
Singapore £113 £84
Sweden £105 £99
Brazil £104 £97
Russia £104 £101
Australia £102 £106
Denmark £98 £92
Finland £91 £88
Japan £90 £111
Canada £87 £91
Netherlands £85 £88
Austria £82 £96
UNITED KINGDOM £82 £97
Italy £80 £90
China £75 £99
Germany £74 £88
Country HOME AWAY
USA £72 £106
Ireland £72 £94
Mexico £72 £73
France £70 £89
Spain & Canary Islands £66 £91
New Zealand £61 £91
India £58 £91
Figure 12 Average room prices paid by travellers when travelling within their own countries versus those paid overseas in H1 2011,
ranked in order of price point

32 The Hotel Price Index Review of global hotel prices: Jan-Jun 2011
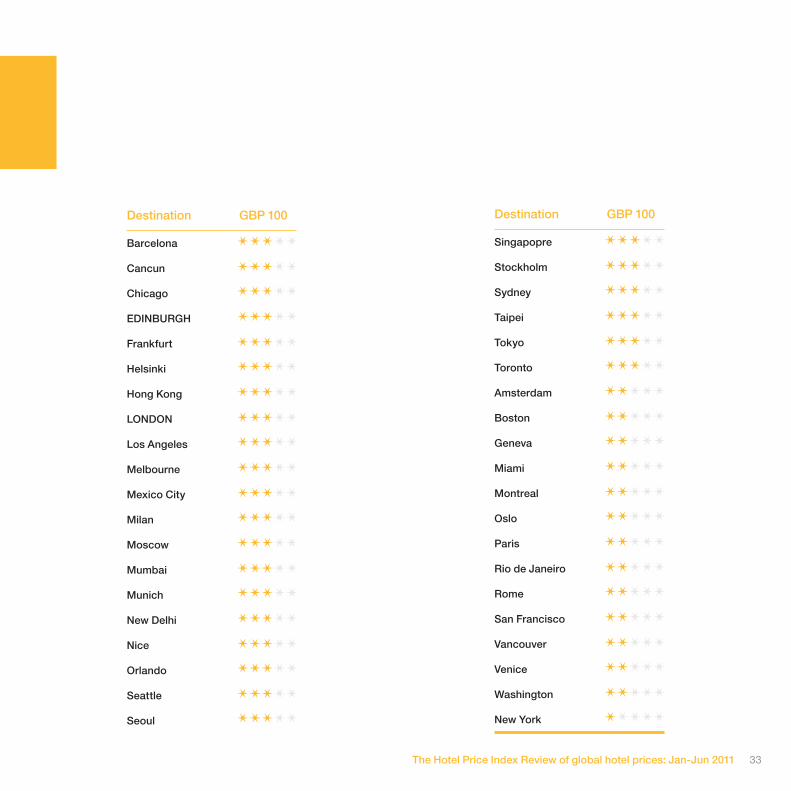
6. Where to go for £100 a night
With the emphasis on value for money, travellers with £100 a
night to spend on their hotel room could choose from a wide
selection of destinations as they searched for quality for less.
Two cities, Marrakech and Warsaw, offered five-star hotel
accommodation averaging under £100 a night, both within a
four-hour flight from the UK.
In comparison, £100 would buy you a three-star hotel room
in London and Edinburgh but only one star in New York.
Destination GBP 100
Marrakech
Warsaw
Bali
Marrakech
Destination GBP 100
Bangkok
Beijing
Berlin
Budapest
Buenos Aires
Cairo
Cape Town
Dubai
Dublin
Guangzhou
Istanbul
Las Vegas
Lisbon
Madrid
Pisa
Prague
Santiago
Shanghai
Tallinn
Vienna
Figure 13 The star rating that can be purchased with £100
per room night in the world’s top cities
33The Hotel Price Index Review of global hotel prices: Jan-Jun 2011
Destination GBP 100
Barcelona
Cancun
Chicago
EDINBURGH
Frankfurt
Helsinki
Hong Kong
LONDON
Los Angeles
Melbourne
Mexico City
Milan
Moscow
Mumbai
Munich
New Delhi
Nice
Orlando
Seattle
Seoul
Destination GBP 100
Singapopre
Stockholm
Sydney
Taipei
Tokyo
Toronto
Amsterdam
Boston
Geneva
Miami
Montreal
Oslo
Paris
Rio de Janeiro
Rome
San Francisco
Vancouver
Venice
Washington
New York
34 The Hotel Price Index Review of global hotel prices: Jan-Jun 2011
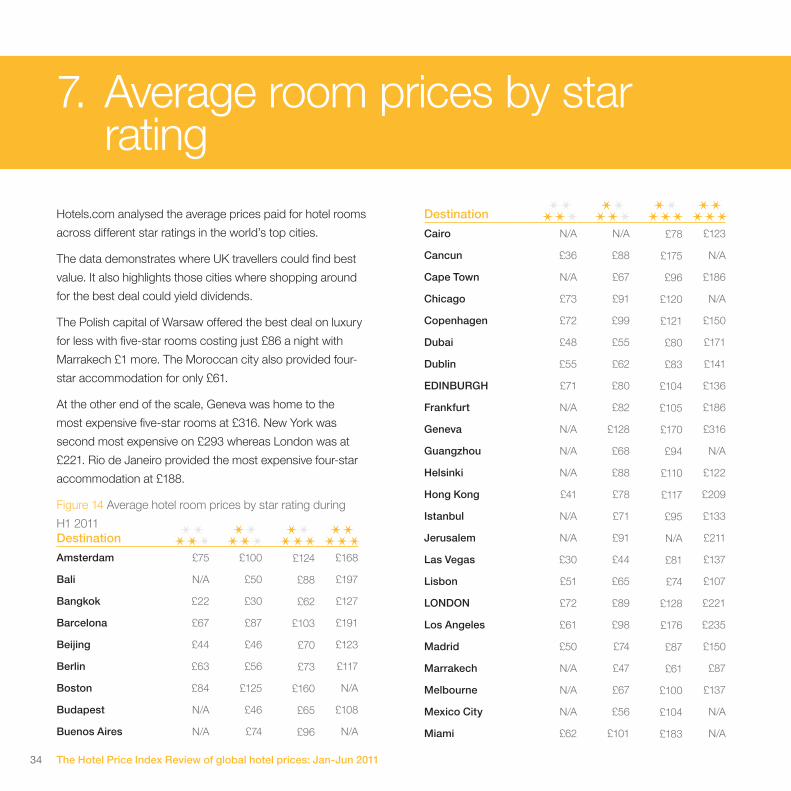
7. Average room prices by star rating
Hotels.com analysed the average prices paid for hotel rooms
across different star ratings in the world’s top cities.
The data demonstrates where UK travellers could find best
value. It also highlights those cities where shopping around
for the best deal could yield dividends.
The Polish capital of Warsaw offered the best deal on luxury
for less with five-star rooms costing just £86 a night with
Marrakech £1 more. The Moroccan city also provided four-
star accommodation for only £61.
At the other end of the scale, Geneva was home to the
most expensive five-star rooms at £316. New York was
second most expensive on £293 whereas London was at
£221. Rio de Janeiro provided the most expensive four-star
accommodation at £188.
Figure 14 Average hotel room prices by star rating during
H1 2011Destination
Amsterdam £75 £100 £124 £168
Bali N/A £50 £88 £197
Bangkok £22 £30 £62 £127
Barcelona £67 £87 £103 £191
Beijing £44 £46 £70 £123
Berlin £63 £56 £73 £117
Boston £84 £125 £160 N/A
Budapest N/A £46 £65 £108
Buenos Aires N/A £74 £96 N/A
Destination
Cairo N/A N/A £78 £123
Cancun £36 £88 £175 N/A
Cape Town N/A £67 £96 £186
Chicago £73 £91 £120 N/A
Copenhagen £72 £99 £121 £150
Dubai £48 £55 £80 £171
Dublin £55 £62 £83 £141
EDINBURGH £71 £80 £104 £136
Frankfurt N/A £82 £105 £186
Geneva N/A £128 £170 £316
Guangzhou N/A £68 £94 N/A
Helsinki N/A £88 £110 £122
Hong Kong £41 £78 £117 £209
Istanbul N/A £71 £95 £133
Jerusalem N/A £91 N/A £211
Las Vegas £30 £44 £81 £137
Lisbon £51 £65 £74 £107
LONDON £72 £89 £128 £221
Los Angeles £61 £98 £176 £235
Madrid £50 £74 £87 £150
Marrakech N/A £47 £61 £87
Melbourne N/A £67 £100 £137
Mexico City N/A £56 £104 N/A
Miami £62 £101 £183 N/A

Hotel star ratings explained
There is no universal star rating system. Each country has
its own, and in some cases, such as the UK, more than one.
This means travellers should be aware of a possible disparity
of standards and facilities when booking rooms with the same
star ratings in different countries.
35The Hotel Price Index Review of global hotel prices: Jan-Jun 2011
Amsterdam
Destination
Milan N/A £79 £114 £199
Montreal £72 £101 £140 N/A
Moscow N/A £94 £143 £211
Mumbai £43 £70 £107 £159
Munich £69 £82 £101 £146
New Delhi £30 £42 £101 £159
New York £105 £145 £186 £293
Nice £70 £91 £137 £245
Orlando £38 £67 £119 £155
Oslo £79 £102 £120 £150
Paris £80 £107 £153 £271
Pisa N/A £64 £89 £127
Prague N/A £53 £66 £116
Rio de Janeiro £99 £152 £188 N/A
Rome £80 £101 £121 £220
San Francisco £69 £104 £138 N/A
Sao Paulo N/A £108 £162 N/A
Seattle £74 £99 £134 £138
Seoul N/A £62 £102 £166
Shanghai N/A £53 £77 £159
Singapore £53 £97 £141 £220
Stockholm £66 £99 £128 £159
Sydney N/A £75 £115 £177
Taipei N/A £66 £112 N/A
Destination
Tallinn £37 £44 £62 £105
Tokyo £49 £81 £138 N/A
Toronto £69 £94 £133 N/A
Vancouver £76 £106 £146 N/A
Venice £77 £114 £146 £248
Vienna N/A £69 £88 £154
Warsaw N/A £63 £74 £86
Washington £83 £117 £154 N/A

36 The Hotel Price Index Review of global hotel prices: Jan-Jun 2011
RomeFigure 15 Top 10 most expensive cities for five-star hotels
Destination
Geneva £316
New York £293
Paris £271
Venice £248
Nice £245
Los Angeles £235
LONDON £221
Rome £220
Singapore £220
Jerusalem £211
Paris

37The Hotel Price Index Review of global hotel prices: Jan-Jun 2011
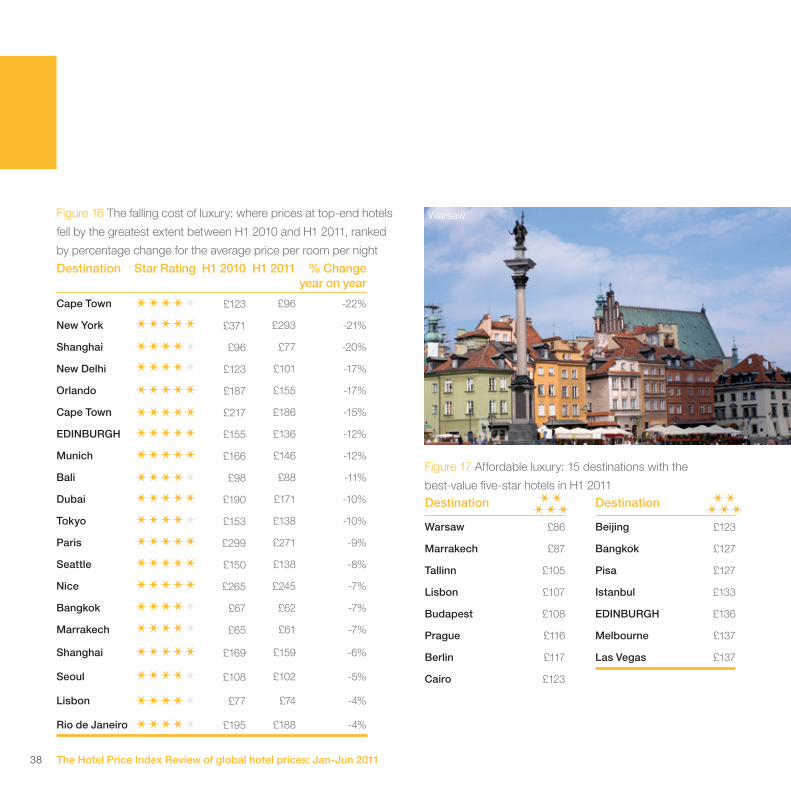
8. Luxury for less
The falling cost of luxury
Travellers searching for the best in hotel accommodation
were able to benefit from dramatic price falls across the
world in the first half of 2011.
For example, five-star prices tumbled 21% in New York,
the most popular overseas destination for UK travellers,
from £371 to £293 following an increase in the amount of
upmarket accommodation. There was also a 17% fall in
another favourite city, Orlando, where high-end rooms were
reduced from £187 to £155 as customers opted for
cheaper deals.
Cape Town witnessed the biggest percentage fall in
premium rates down 15% from £217 to £186 for five-star and
22% from £123 to £96 for four-star as the market re-adjusted
from the demand inflated by last year’s football World Cup.
Warsaw was the cheapest place for five-star hotels with an
average rate of just £86 with other Eastern European cities
also offering excellent value: Tallinn on £105, Budapest on
£108 and Prague on £116.
In Western Europe, luxury romantic weekends in Paris were
also more affordable with five-star rooms 9% cheaper, down
from £299 to £271 and 7% less in the Cote d’Azur resort of
Nice from £265 to £245. There were also 12% falls in Munich
and Edinburgh, the only British city to feature on the list, with
average rates going down to £146 and £136 respectively.
Five-star deals at another popular destination, Dubai, also fell
10% to £171 from £190 because of increased capacity and
a fall-off in demand due to the negative perception of the
region generated by widespread civil unrest.
For those prepared to travel further afield, there were falls in
both five and four-star accommodation in Shanghai, down
6% and 20% to £159 and £77, as the market re-adjusted
after the World Expo last year. There were also good savings
on four-star accommodation in other Asian destinations such
as New Delhi down 17%, Bali down 11%, Tokyo down 10%,
Bangkok down 7% and Seoul down 5%.
Those looking for the high life but wanting to spend
substantially less than in the first half of 2010 should look no
further than the Hotels.com HPI guide to “Luxury for Less” in
the table overleaf which shows where in the world four-star
and five-star hotel rates have fallen the most.
Bali
38 The Hotel Price Index Review of global hotel prices: Jan-Jun 2011
Figure 17 Affordable luxury: 15 destinations with the
best-value five-star hotels in H1 2011
Figure 16 The falling cost of luxury: where prices at top-end hotels
fell by the greatest extent between H1 2010 and H1 2011, ranked
by percentage change for the average price per room per night
Destination
Warsaw £86
Marrakech £87
Tallinn £105
Lisbon £107
Budapest £108
Prague £116
Berlin £117
Cairo £123
Destination
Beijing £123
Bangkok £127
Pisa £127
Istanbul £133
EDINBURGH £136
Melbourne £137
Las Vegas £137
Destination Star Rating H1 2010 H1 2011 % Change year on year
Cape Town £123 £96 -22%
New York £371 £293 -21%
Shanghai £96 £77 -20%
New Delhi £123 £101 -17%
Orlando £187 £155 -17%
Cape Town £217 £186 -15%
EDINBURGH £155 £136 -12%
Munich £166 £146 -12%
Bali £98 £88 -11%
Dubai £190 £171 -10%
Tokyo £153 £138 -10%
Paris £299 £271 -9%
Seattle £150 £138 -8%
Nice £265 £245 -7%
Bangkok £67 £62 -7%
Marrakech £65 £61 -7%
Shanghai £169 £159 -6%
Seoul £108 £102 -5%
Lisbon £77 £74 -4%
Rio de Janeiro £195 £188 -4%
Warsaw

39The Hotel Price Index Review of global hotel prices: Jan-Jun 2011
9. Travel habits
Top UK destinations for UK travellers
London again held its place as the most popular domestic
destination, according to the Hotels.com Hotel Price Index.
Manchester and Edinburgh came in at number two and
three with Birmingham and Glasgow completing the top five
list of the most popular home destinations for UK travellers.
Rank Destination
1 London
2 Manchester
3 Edinburgh
4 Birmingham
5 Glasgow
6 Liverpool
7 Bristol
8 Cardiff
9 Leeds
10 Brighton
11 Bournemouth
12 York
13 Nottingham
14 Belfast
15 Southampton
16 Newcastle-upon-Tyne
17 Blackpool
18 Bath
19 Sheffield
20 Oxford
London
Figure 18 Top UK destinations for UK travellers

40 The Hotel Price Index Review of global hotel prices: Jan-Jun 2011
Top overseas destinations for UK travellers
New York retained its position as the most popular overseas
destination for UK travellers so far in 2011, despite the
average daily rate increasing 6%. In fact there were six US
cities in the top 20 list, with Las Vegas, San Francisco, Los
Angeles, Orlando and Miami also featuring as the Pound
gained strongly against the US Dollar.
Paris was the second-most popular overseas destination
and top European city for UK travellers. Other traditional
European city-break favourites also featured prominently
with Rome, Amsterdam, Dublin, Barcelona and Berlin all in
the top 10.
Other locations included Dubai, still a popular long weekend
destination, and the Far East cities of Hong Kong, Bangkok
and Singapore. However, Tokyo, which was thirty-second on
the list last year, fell out of the top 50 following the aftermath
of the earthquake.
Rank Destination Country
1 New York United States
2 Paris France
3 Las Vegas United States
4 Rome Italy
5 Amsterdam Netherlands
6 Dublin Ireland
7 Barcelona Spain & Canary Islands
8 San Francisco United States
9 Dubai United Arab Emirates
10 Berlin Germany
11 Los Angeles United States
12 Orlando United States
13 Hong Kong China
14 Madrid Spain & Canary Islands
15 Venice Italy
16 Prague Czech Republic
17 Bangkok Thailand
18 Sydney Australia
19 Miami United States
20 Singapore Singapore
Figure 19 Top overseas destinations for UK travellers
New York
41The Hotel Price Index Review of global hotel prices: Jan-Jun 2011
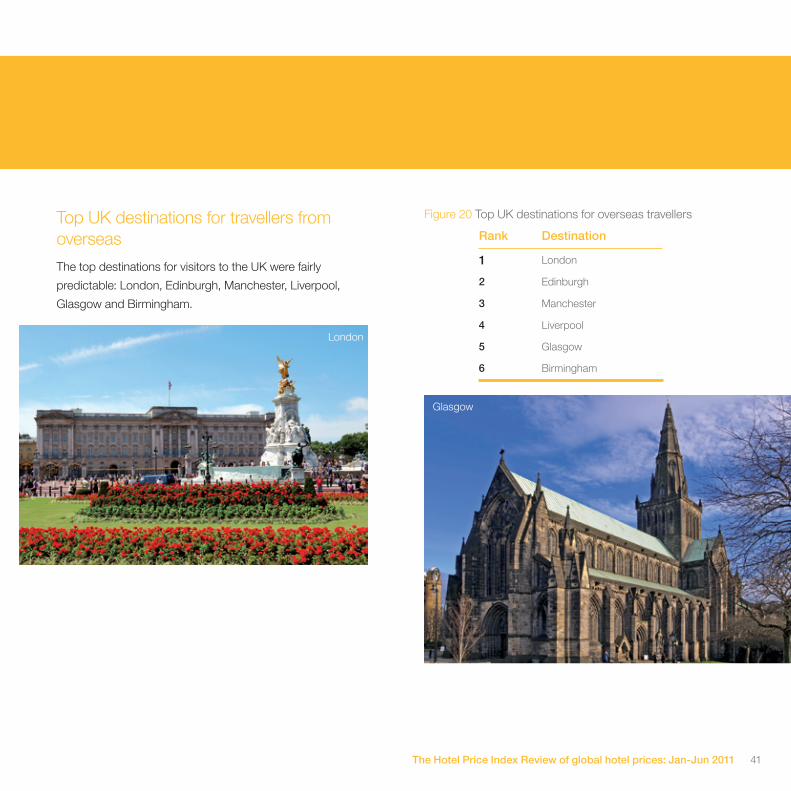
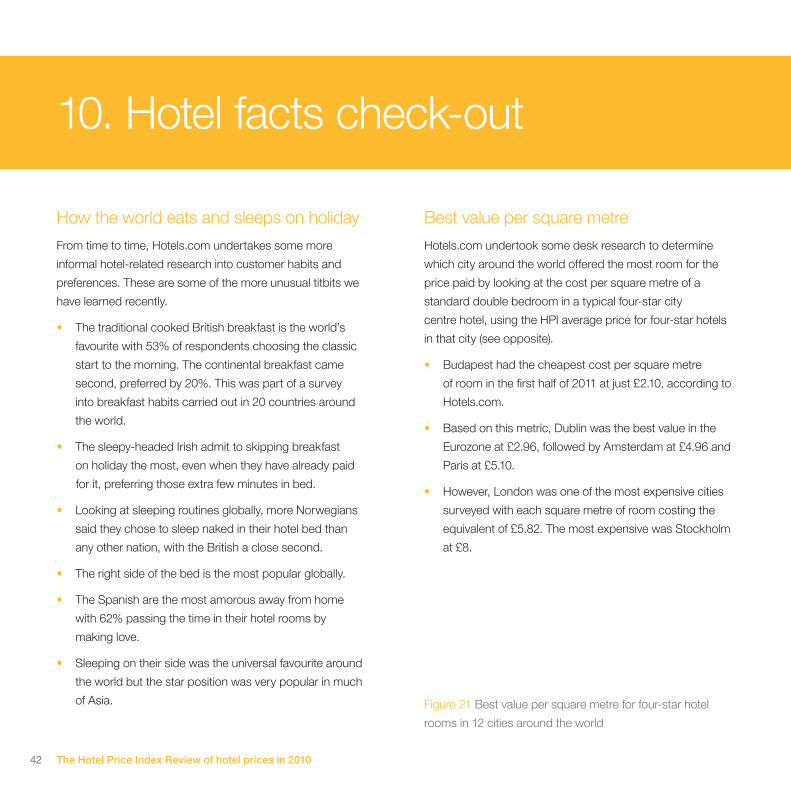
Top UK destinations for travellers from overseas
The top destinations for visitors to the UK were fairly
predictable: London, Edinburgh, Manchester, Liverpool,
Glasgow and Birmingham.
Rank Destination
1 London
2 Edinburgh
3 Manchester
4 Liverpool
5 Glasgow
6 Birmingham
Figure 20 Top UK destinations for overseas travellers
London
Glasgow
10. Hotel facts check-out
42 The Hotel Price Index Review of hotel prices in 2010
How the world eats and sleeps on holiday
From time to time, Hotels.com undertakes some more
informal hotel-related research into customer habits and
preferences. These are some of the more unusual titbits we
have learned recently.
• The traditional cooked British breakfast is the world’s
favourite with 53% of respondents choosing the classic
start to the morning. The continental breakfast came
second, preferred by 20%. This was part of a survey
into breakfast habits carried out in 20 countries around
the world.
• The sleepy-headed Irish admit to skipping breakfast
on holiday the most, even when they have already paid
for it, preferring those extra few minutes in bed.
• Looking at sleeping routines globally, more Norwegians
said they chose to sleep naked in their hotel bed than
any other nation, with the British a close second.
• The right side of the bed is the most popular globally.
• The Spanish are the most amorous away from home
with 62% passing the time in their hotel rooms by
making love.
• Sleeping on their side was the universal favourite around
the world but the star position was very popular in much
of Asia.
Best value per square metre
Hotels.com undertook some desk research to determine
which city around the world offered the most room for the
price paid by looking at the cost per square metre of a
standard double bedroom in a typical four-star city
centre hotel, using the HPI average price for four-star hotels
in that city (see opposite).
• Budapest had the cheapest cost per square metre
of room in the first half of 2011 at just £2.10, according to
Hotels.com.
• Based on this metric, Dublin was the best value in the
Eurozone at £2.96, followed by Amsterdam at £4.96 and
Paris at £5.10.
• However, London was one of the most expensive cities
surveyed with each square metre of room costing the
equivalent of £5.82. The most expensive was Stockholm
at £8.
Figure 21 Best value per square metre for four-star hotel
rooms in 12 cities around the world

Paris
Budapest
Las Vegas
Mexico City
Dublin
Sydney
New Delhi
Amsterdam
New York / London
Oslo
Stockholm
Best value per square metre

44 The Hotel Price Index Review of global hotel prices: Jan-Jun 2011
About Hotels.com
As part of the Expedia group which operates in all major
markets, Hotels.com offers almost 140,000 quality hotels,
B&Bs and serviced apartments worldwide. If a customer can
find the same deal for less on a prepaid hotel, Hotels.com
will match it. Hotels.com benefits from one of the largest
hotel contracting teams in the industry negotiating the best
rates for its customers, plus there are more than 2.5 million
reviews from users who have actually stayed in the hotels to
ensure customers make an informed choice when booking.
Travellers can book online or by contacting one of the
multilingual call centres on 020 3027 8146.
In 2010, Hotels.com launched its Welcome Rewards
customer loyalty programme in the UK, where customers
can earn a free night for every ten nights stayed (subject
to Welcome Rewards terms and conditions as set out at
www.hotels.com).
In 2011, Hotels.com was named “Best Overall Customer
Experience” according to a study by Keynote Competitive
Research that examined nine of the top online travel
websites in the US, and won first place in six other
categories, including the key service areas of customer
satisfaction, customer support and booking process,
achieving a total of 12 top three places overall, improving its
scores in 14 out of the 16 categories, compared to the
2010 results.
During 2011, Hotels.com launched a specially-designed app
for the iPad and several smart phone apps, all available to
download for free. These allow users to search and book
more than 20,000 last minute deals from around the world.
Available in more than 30 languages, the apps also allow
users to sort and filter hotels, browse user reviews plus find
last minute hotel deals close to their location.
The company currently operates more than 85 Hotels.com
sites around the world including 33 sites in 24 languages
across EMEA. The European sites launched in the UK in
2002 and now attract several million unique users every
month and thousands of people now book bed nights
through Hotels.com every day. The two newest sites
launched in 2011 are Indonesia and Vietnam.

45The Hotel Price Index Review of global hotel prices: Jan-Jun 2011
For further information
For more information/press enquiries or spokespeople for
any global region, please contact:
Kate Hopcraft +44 (0)20 7019 2165
Yvonne Bonanati +44 (0)20 7019 2815
Zoe Chan +852 3607 5719
Alison Couper +44 (0)20 7019 2360

Rio
de
Jane
iro
Ro
me
San
Fra
ncis
coS
ao P
aulo
Seo
ulS
hang
hai
Shar
m E
l She
ikh
Sing
apor
eSt
ockh
olm
Sydne
y
Taipei
Tallin
n
Tokyo
Venice
Vilnius
Warsaw
Wellington
Abu Dhabi
AmsterdamAthens
AucklandBangkokBarcelonaBeijingBeirutBerlinBrussels
Budapest
Buenos A
ires
Cairo
Cancun
Cap
e Town
Chicago
Co
penhag
en
Do
ha
Dub
ai
Dub
lin
Dus
seld
orf
Gen
evaH
anoi
Hel
sink
i
Hong
KongIb
iza
Jeru
salem
Johannesburg
Kuala LumpurKyotoLas Vegas
LisbonLondon
Los Angeles
Madrid
Manila
Melbourne
Monte Carlo
Montreal
Moscow
Mum
bai
Muscat
New York
Osaka
Oslo
Paris
Prague
Reykjavik
Riga
£240
£230
£220
£210
£200
£190
£180
£170
£160
£150
£140
£130
£120
£110
£100
£90
£80
£70
£60
£50
£40
Hotel Prices (2011)
60%
50%
40%
30%
20%
10%
0%
-10%
-20%
-30%
-40%
Percentage Fall Rise
Global hotel price changes H1 2010 - H1 2011


© 2011 Hotels.com, L.P. The Hotel Price Index (HPI®), this report and its contents are the copyright of Hotels.com, L.P. All rights reserved.Any reproduction of this report or its contents must acknowledge www.hotels.com as the source.