Embed Size (px)
Citation preview


Disclaimer
This presentation and subsequent discussion may contain certain forward-looking statements. These forward-looking statements reflect the company’s view on some future events and involve known and unknown risks and uncertainties and other factors which may cause actual performance and development differ materially. Past performance cannot be relied on as a guide for future performance.

Corporate & Results Overview
Utilities
Group Financials Review
Conclusions & Outlook
3
Agenda

Corporate & Results Overview
4

Three Business Drivers
5
HK Core (HC) New Energy (NE) Mainland Utilities (MU)
•HK City-gas
•Landfill Gas
•Bandwidth + Data Centre
•City-gas (0003.hk + 1083.hk)
•Mid Stream
•Gas Storage
•Clean Transportation Fuels
•Water Supply/Sewage
•COG to LNG
•CBM to LNG
•Clean Transportation Fuels
•Coal-based Chemicals
•Oil/Gas E&P
•Biomass to Fuels
•Aviation Fuel Storage

6
0003.HK Hong Kong & China Gas Co., Ltd.
(HK$ Bn) 1H14 1H13 Change
Revenue
(Excluding FCVC in HK)14.83 12.16 +22%
Operating Profit After Tax 3.63 3.25 +12%
Exchange Gain/(Loss) (0.28) 0.17
IFC Revaluation Gain 0.26 0.13
Profit Attributable to Shareholders 3.73 3.62 +3%
Earnings Per Share (HK cents) 35.4 34.4 +3%
Interim Dividend Per Share (HK cents) 12.0 12.0

7
0003.HK Hong Kong & China Gas Co., Ltd.
(HK$ Bn) 1H14 1H13 Change
HK Core 1.57 1.49 +5%
Mainland Utilities 1.81 1.53 +18%
New Energy 0.25 0.22 +14%
Total 3.63 3.25 +12%
Operating Profit After Tax By Businesses
8
(HK$ Bn) 1H14 1H13 Change
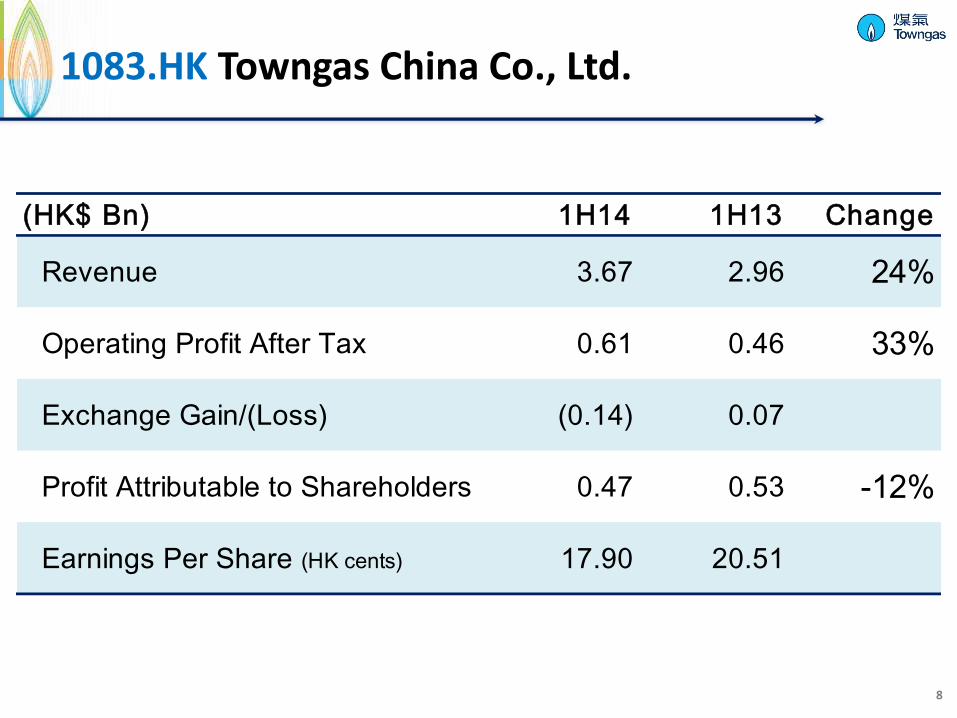
Revenue 3.67 2.96 24%
Operating Profit After Tax 0.61 0.46 33%
Exchange Gain/(Loss) (0.14) 0.07
Profit Attributable to Shareholders 0.47 0.53 -12%
Earnings Per Share (HK cents) 17.90 20.51
1083.HK Towngas China Co., Ltd.

Performance Overview
9
Town Gas Sales
4.1%
Total Customer
+11,916*
* Compared with 2013 Year End

Performance Overview
10
City-gas Sales Volume
17% 7.7Bn m³
Total City-gas Customer
+1.0Mn* 18.3Mn
Midstream Sales Volume
10% 1.7Bn m³
City-water Sales Volume
2% 196Mn m³
* Compared with 2013 Year End

Performance Overview
11
Shanxi Jincheng Coalbed Methane
Liquefaction
117Mn m3*
Inner Mongolia Coal-to-Methanol
132k tons*
Thailand Oilfield
4,000 BOPD
CNG/LNG Refilling Stations
44 Stations
Aviation Fuel Facility
2.8M tons*
+100%
* 1H 2014 Production/Throughput Volume
+12% +8%
+4%

IM Coal to Methanol to Gasoline
Xuzhou, Jiangsu COG to LNG
Heze, Shandong COG to LNG
Moving Forward
Zhangjiagang, Jiangsu Palm Oil Residue to Biofuel 120k tons Diesel, Mid 2015 140k tons Gasoline, 2014 Q4
70k tons LNG, 2015 Q4 80k tons LNG, 2015 Q4 12

Heilongjiang
Jilin
Liaoning
Hebei
Beijing Inner Mongolia
Shandong
Jiangsu Shaanxi
Henan Anhui
Hubei
Chongqing Zhejiang
Hunan
Sichuan
Guizhou
Jiangxi Fujian
Guangdong Guangxi
Yunnan
Hainan
Hong Kong
Shanxi
Businesses Profile
13
As of Jul 31, 2014
provincial regions
192 projects
24
projects added, total
in
19
Utilities
City-gas 126 (HKCG: 33 + TCCL: 93 )
Midstream 8
Water & Sewage 6
Refilling stations 2
New Energy
Gas-based 6
Coal-based 6
Refilling stations 20
Telecommunications 10
Others 8
M
coal-mine chemical plant logistics

Pleasing OPAT results against a slow global economy backdrop.
PAT tarnished by unfavorable RMB exchange rate, but is likely transient.
MU enjoys sustained gas consumption growth, urbanization continues to drive housing and gas demand.
Keeping up with the new city gas project additions in the Mainland.
NE is deploying several new energy conversion projects.
Thailand Oilfield Project is materializing higher production output. 14
Remarks on 1H 2014 Performance

Utilities: HK & Mainland China Upwards Momentum
15

16
Hong Kong Business Performance
Customer Gain Total Customers Coverage Household
Penetration
Stable Business Fuel Cost Pass-through Gas Sales Volume: +4.1%
5% HK$1.6Bn
* Compared with 2013 Year End

Towngas China (1083.hk)
17

18
Towngas China (1083.hk) Highlights
HK$612Mn 33%Operating Profit After Tax
Project Number Gas Sales Volume
Customer Number
+418,300*8.9Mn
+8* Total 95
13%3.3Bn m³
* Compared with 2013 Year End

19
Towngas China (1083.hk)
Operating Highlights
0.0
0.5
1.0
1.5
2.0
2.5
3.0
3.5
0
3
6
9
12
15
Piped-gasConnection FeesOthers
(HK$ Bn) (Bn m3)
Turnover Mix (%) (All JV 100%)
1H14 1H13
17%
26%
57% 57%
17%
26%
1H14 1H13
84%
7% 11%
82%
12% 4%
(Mn)
8.0 8.9
294 306
100
140
180
220
260
300
2
4
6
8
10
Customers No. (LHS)
Gas Volume/Employee (RHS)
(‘000 m³)
1H14 1H13
Industrial
Commercial
Residential

Utilities: Mainland China Upwards Momentum
20

21
Mainland Utilities Performance (Towngas China inclusive)
City-gas City-water Midstream-gas
Volume: +17% 7.7Bn m3
+2% 196Mn ton
+10% 1.7Bn m3
Projects Number: 126 (+7*) 6 8
Customers Number: +0.97Mn* 18.3Mn
+0.03Mn* 1.0Mn
Refilling Station Volume:
+5% 131Mn m3
HK$1.8Bn18%Operating Profit After Tax
* Compared with 2013 Year End

Heilongjiang
Jilin
Liaoning
Hebei Beijing
Inner Mongolia
Shandong
Jiangsu
Shaanxi
Henan Anhui
Hubei
Chongqing Zhejiang
Hunan
Sichuan
Guizhou Jiangxi Fujian
Guangdong Guangxi
Yunnan
Hainan
Hong Kong
22
in provincial regions
145 projects
23 9 projects added, total
Territorial Coverage As of Jul 31, 2014
Utilities
City-gas 126 (HKCG: 33 + TCCL: 93 )
Midstream 8
Water & Sewage 6
Refilling stations 2
Others 3
M

0.08 0.3 0.8
1.4 2.1
4.6
5.8
6.9
8.5
10.3
11.9
6.6
7.7
0
2
4
6
8
10
12
14
16
2001 2002 2003 2004 2005 2006 2007 2008 2009 2010 2011 2012 2013 1H14
23
Gas
Sal
es
Vo
lum
e (
Bn
m3)
All JVs (100%)
0.02
1H14 vs 1H13
+17%
City-gas Business
Growing Gas Sales Volume

24
0
2
4
6
8
0
6
12
18
24
30
36
Piped-gasConnection FeesOthers
(HK$ Bn) (Bn m3)
1H14 1H13
86%
4% 11%
85%
11% 3%
1H14 1H13
22%
26%
52%
53%
21%
26%
Turnover Mix (%) (All JV 100%)
(Mn)
15.7 18.3
394 421
100
200
300
400
0
4
8
12
16
20
24
Customers No. (LHS)
Gas Volume/Employee (RHS)
(‘000 m³)
1H14 1H13
Industrial Commercial
Residential
City-gas Business
Operational Highlights
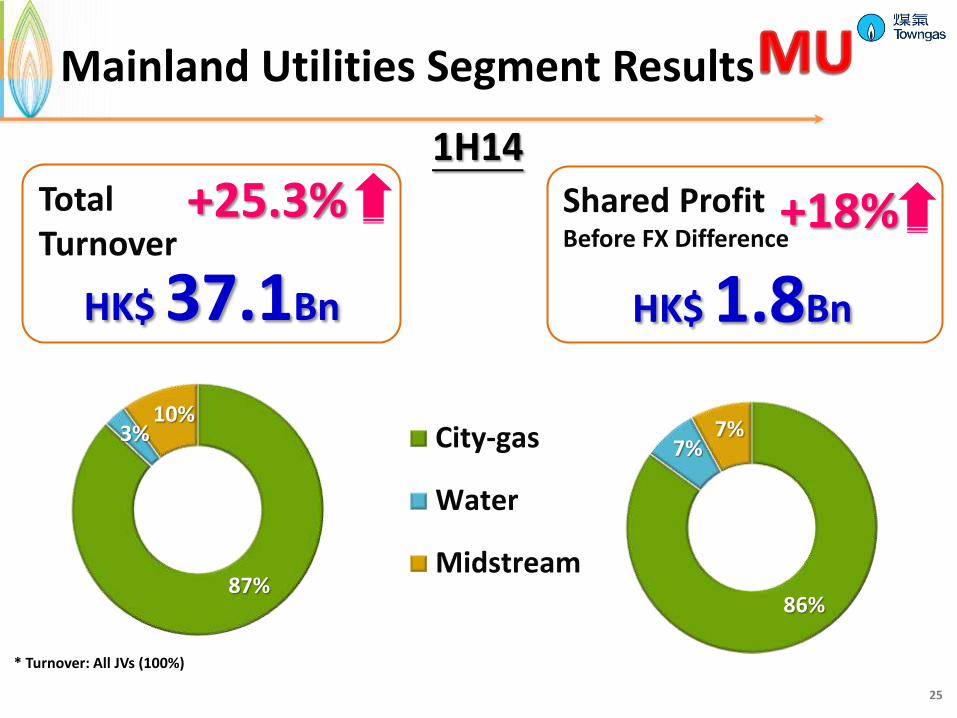
1H14 Total Turnover
HK$ 37.1Bn
+25.3% Shared Profit Before FX Difference
HK$ 1.8Bn
+18%
25
City-gas
Water
Midstream86%
7% 7%
* Turnover: All JVs (100%)
87%
10% 3%
Mainland Utilities Segment Results

Effective 1 September 2014
Affect Non-residential customers
Maximum Rmb0.4/m³ on Existing Gas Volume
75 JVs Affected out of 126
Around 18% gas volume affected in 2014
26
2nd NG Gate-Price Adjustments

Qiqihar
Lianfu
Russian Gas •Expected arrival in 2018 •Ramping up to 38bn m³ per year
Yingkou
Lvshun Detai
Wafangdian Changxingdao
Anshan
Shenyang
Fuxin Xinqiu/Dali
Chaoyang Jianping
Kazuo Benxi
Tieling
Qinhuangdao
Heihe
Shenyang
Harbin
Songyuan
Changlin
Siping
Gongzhuling Changchun
Jitian
Jilin
Yanji
Sino-Russian Gas Supply
City-gas projects Total
Northeastern China Welcoming the Russian Gas
27
2014 Expected: 1Bn m³ 2020 Forecast: 3.5Bn m³
MD comment

Group Financial Sustainable Growth
28

29
Consolidated Revenue
PRC
63%
HK
37%
1H14 Revenue (HK$ Bn)
HK PRC Total
5.9 (+5%)
9.9 (+31%)
15.8 (+20%)

30
Consolidated Total Assets
PRC
61%
HK
39%
1H14 Assets (HK$ Bn)
HK PRC Total
42.8 67.9 110.7
PRC Current Assets
11%

25 Aug 2014 @6.155
6.00
6.05
6.10
6.15
6.20
6.25
6.30
Nov-13 Jan-14 Mar-14 May-14 Jul-14
USD/CNH Spot Rate
+0.8%
31
RMB vs USD Trend
- 2.5%
31 Dec 2013 @6.05
30 Jun 2014 @6.206

* USD/CNY Spot: 6.05 as at 31 Dec 2013
6
13
RMB FX Rate Forecast
Bank
End of 2014 (Forecast)
(as at 30 April)
End of 2014 (Forecast)
(as at 28 Jul)
End of 2014 (Forecast)
(as at 19 Aug)
Change Comparing to End of 2013
Royal Bank of Scotland 5.88 5.86 5.86 3.1%
Bank of America 6.10 6.00 6.00 0.8%
Credit Agricole CIB 6.00 6.00 6.00 0.8%
Nomura 6.00 6.05 6.05 0.0%
Mizuho 6.05 6.05 6.05 0.0%
Bank J. Safra Sarasin 6.05 6.05 6.05 0.0%
Mitsubishi Bank UFJ 5.93 6.06 6.06 -0.2%
Standard Chartered Bank 6.04 6.09 6.09 -0.7%
Citi 6.08 6.09 6.11 -0.7%→-1.0%
Commonwealth Bank of Australia 5.85 6.10 6.10 -0.8%
Credit Suisse 6.10 6.13 6.13 -1.3%
Morgan Stanley 5.91 6.14 6.14 -1.5%
HSBC 6.14 6.14 6.14 -1.5%
JP Morgan Chase 6.05 6.15 6.15 -1.7%
ANZ 6.08 6.15 6.15 -1.7%
BNP 6.20 6.20 6.20 -2.5%
Barclays 6.07 6.22 6.22 -2.8%
Rabobank 6.28 6.29 6.29 -4.0%
Daiwa 6.50 6.50 6.50 -7.4%
Average : 6.07 6.12 6.12 - 1.2%

33
0003.HK Hong Kong & China Gas Co., Ltd.
(HK$ Bn) 1H14 1H13 Change
Profit Attributable to
Shareholders3.73 3.62 3%
IFC Revaluation Gain 0.26 0.13
Exchange Gain/(Loss) (0.28) 0.17
Underlying Business PAT 3.75 3.32 13%

34
1083.HK Towngas China Co., Ltd.
(HK$ Bn) 1H14 1H13 Change
Profit Attributable to Shareholders 0.47 0.53 -12%
Exchange Gain/(Loss) (0.14) 0.07
Underlying Business PAT 0.61 0.46 33%

35
Underlying Business Margins
Hong Kong Core New Energy Mainland Utilities
1H14
1H13
46.7%
46.6%
15.5%
14.3%
1H14
1H13
24.1%
24.8%
6.3%
5.5%
1H14
1H13
34.5%
29.7%
2.8%
1.5%
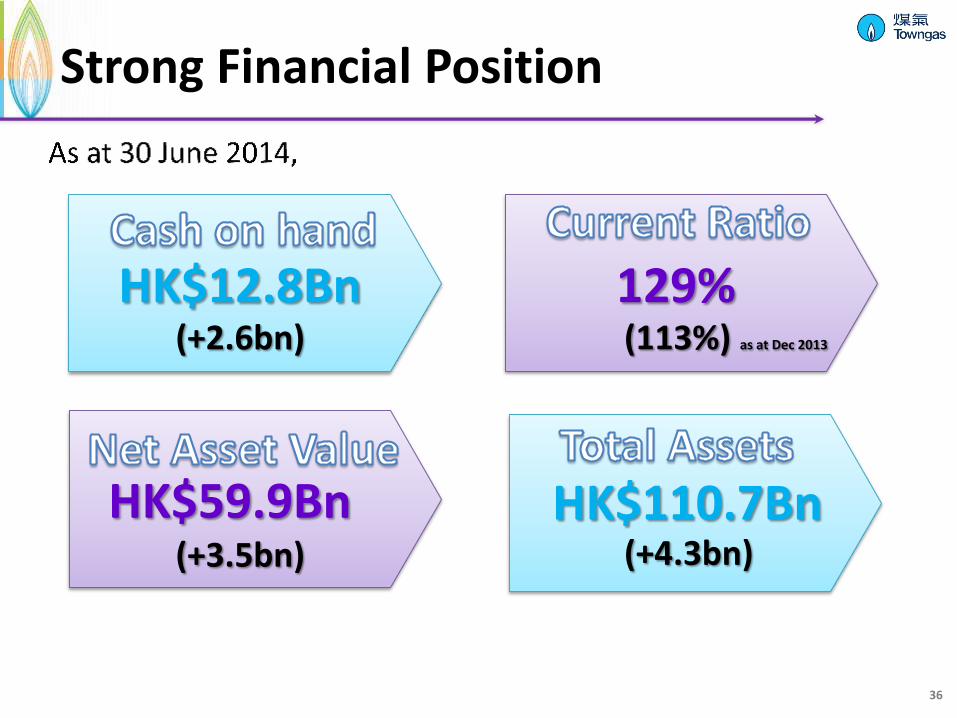
HK$12.8Bn
36
Strong Financial Position
129%
HK$59.9Bn HK$110.7Bn
(+2.6bn)
(113%) as at Dec 2013
(+3.5bn)
(+4.3bn)

37
Leverage
HKCG (0003.hk) TCCL (1083.hk)
10.4x 11.3x 26.1% 24.2%
HK$31.5Bn
PRC
5%
Long Term 52%
(As at 30 June 2014)
18% Short Term
Medium Term 25%
Avg. Tenor 8.4yrs
Avg. Interest 3.8%

38
HKCG (0003.hk) TCCL (1083.hk)
A+
A1
BBB
Baa2
Diversified Funding Sources
MTN Notes
(AUD,JPY,HKD) 10-40 Years
Perpetual Securities
Dim Sum Bond 5-Year
USD Bond 144A
Bilateral Bank Loan
Medium Term Bilateral
Bank Loan 1 - 5 Years
Syndicated Loan

2013
2012
2011
2010
2009
2008
2007
2006
2005
39
(HK$ Bn)
2.0
1.6
Strong Dividend from PRC

Group Operation 13
PRC Dividends Distribution 7
20
Dividend 12
New Investment 10
22
Inflow
Outflow
(HKD Bn)
(HKD Bn)
40
Shortfall - Finance by Cash on Hand 2 (HKD Bn)
Rolling 3-Year Cashflow Projection Healthy Cashflow

Outlook Expanding New Horizons
41

Immense Population
Urbanization
Growing Economy
World’s Manufacture
Base
No. 1 Automobile
Market
High Oil & NG Import
Severe Pollution
Rich Coal Reserve, Lacking Oil & Gas
Massive Agricultural, Industrial & Residential
Waste
China’s Energy Outlook
42

Myanmar gas supply to Southwest China
Russian gas supply to Northeast China in 2018
20+ additional LNG receiving terminals planned to be built
Natural gas supply reform
Integrated gas pipeline infrastructure
Third party access
Natural gas trading platform
43
Policies and Directions

Promote LNG vehicles/vessels
Encourage indigenous alternative fuel supplies
Encourage innovations, R&D
Distributed energy centres shall enhance gas sales
Gas consumption forecast increase 74% to 400Bn m³ (2016-2020)
44
Policies and Directions (Cont.)

45
• Industrial waste
• Agricultural waste
• Food waste
• Coal
• CBM
Clean Energy
PM 2.5
CO2, SO2
Crude consumption
Reduce
• Efficient & Clean Processes
• Self-developed Technologies
• Scalable & Multipliable
• > 25% IRR
• < HKD800Mn/Project
• LNG
• Synthetic Natural Gas
• Liquid Auto Fuels
• Chemicals
NE Strategies

Looking Forward
46
NE energy projects highly scalable & multipliable.
First wave NE project construction period in 2014 to 2015. Full-year profits to be realized in 2016.
More projects earmarked for 2015-2016 period.
NE projects payback in 4-5 years.
Cash flow generated post 2016 will fund future projects.

Looking Forward
47
Hong Kong housing supply will almost double.
Mainland housing supply growth continues due to urbanization.
Price reform may momentarily impact NG demand growth.
Rising labour costs become a concern.

48
HK Gas Business remains as a stable, low growth, cash
generating operation.
Operation efficiency is the key.
More green energy sources, e.g. landfill gas.
Mainland City-gas Business is projected
to continue having mid growth.
Capturing gas markets is the key.
New Energy Business is positioned to deliver
high growth.
Developing and applying high efficiency technologies in energy transmutation is the key.
Our Targets (2014-2019)

2005 2009
New
Energy
Mainland
Utilities
Hong Kong
Core
1994 2008 + Mainland
Utilities
+ New Energy Hong Kong Core
1862
OPAT
132 yrs
Sustaining Growth Others
2013 49

We are in the Right Trades
We are at the Right Time
We are in the Right Region


![[Papercraft] Banco da China, Hong Kong](https://img.pdfslide.us/doc/110x75/55288796550346bc588b484b/papercraft-banco-da-china-hong-kong.jpg)