Embed Size (px)
Citation preview
BUILDING TECHNOLOGIES OFFICE
1
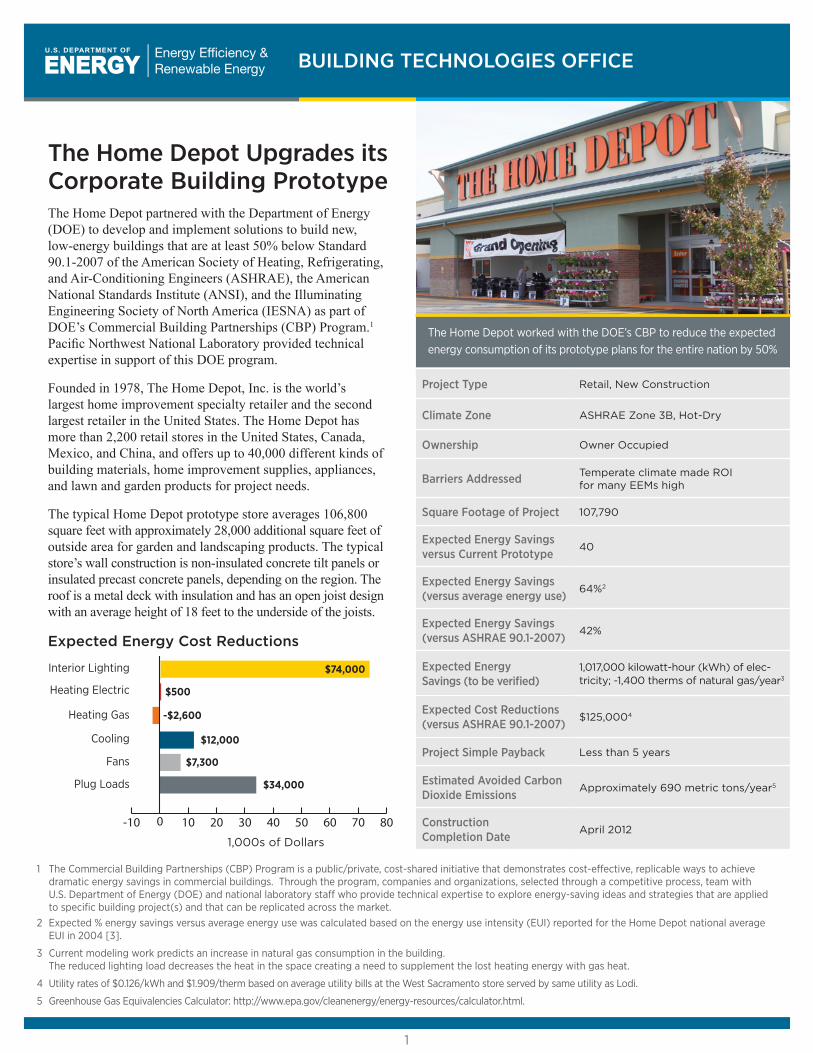
The Home Depot Upgrades its Corporate Building PrototypeThe Home Depot partnered with the Department of Energy (DOE) to develop and implement solutions to build new, low-energy buildings that are at least 50% below Standard 90.1-2007 of the American Society of Heating, Refrigerating, and Air-Conditioning Engineers (ASHRAE), the American National Standards Institute (ANSI), and the Illuminating Engineering Society of North America (IESNA) as part of DOE’s Commercial Building Partnerships (CBP) Program.1 Pacific Northwest National Laboratory provided technical expertise in support of this DOE program.
Founded in 1978, The Home Depot, Inc. is the world’s largest home improvement specialty retailer and the second largest retailer in the United States. The Home Depot has more than 2,200 retail stores in the United States, Canada, Mexico, and China, and offers up to 40,000 different kinds of building materials, home improvement supplies, appliances, and lawn and garden products for project needs.
The typical Home Depot prototype store averages 106,800 square feet with approximately 28,000 additional square feet of outside area for garden and landscaping products. The typical store’s wall construction is non-insulated concrete tilt panels or insulated precast concrete panels, depending on the region. The roof is a metal deck with insulation and has an open joist design with an average height of 18 feet to the underside of the joists.
The Home Depot worked with the DOE’s CBP to reduce the expected energy consumption of its prototype plans for the entire nation by 50%
Expected Energy Cost Reductions
Fans
Heating Gas
Heating Electric
Cooling
Plug Loads
1,000s of Dollars
-$2,600
$500
$7,300
Interior Lighting
$12,000
-10 0 10 20 30 40 50 60 70 80
$74,000
$34,000
Project Type Retail, New Construction
Climate Zone ASHRAE Zone 3B, Hot-Dry
Ownership Owner Occupied
Barriers Addressed Temperate climate made ROI for many EEMs high
Square Footage of Project 107,790
Expected Energy Savings versus Current Prototype
40
Expected Energy Savings (versus average energy use)
64%2
Expected Energy Savings (versus ASHRAE 90.1-2007)
42%
Expected Energy Savings (to be verified)
1,017,000 kilowatt-hour (kWh) of elec-tricity; -1,400 therms of natural gas/year3
Expected Cost Reductions (versus ASHRAE 90.1-2007)
$125,0004
Project Simple Payback Less than 5 years
Estimated Avoided Carbon Dioxide Emissions
Approximately 690 metric tons/year5
Construction Completion Date
April 2012
1 The Commercial Building Partnerships (CBP) Program is a public/private, cost-shared initiative that demonstrates cost-effective, replicable ways to achieve dramatic energy savings in commercial buildings. Through the program, companies and organizations, selected through a competitive process, team with U.S. Department of Energy (DOE) and national laboratory staff who provide technical expertise to explore energy-saving ideas and strategies that are applied to specific building project(s) and that can be replicated across the market.
2 Expected % energy savings versus average energy use was calculated based on the energy use intensity (EUI) reported for the Home Depot national average EUI in 2004 [3].
3 Current modeling work predicts an increase in natural gas consumption in the building. The reduced lighting load decreases the heat in the space creating a need to supplement the lost heating energy with gas heat.
4 Utility rates of $0.126/kWh and $1.909/therm based on average utility bills at the West Sacramento store served by same utility as Lodi.
5 Greenhouse Gas Equivalencies Calculator: http://www.epa.gov/cleanenergy/energy-resources/calculator.html.

BUILDING TECHNOLOGIES OFFICE
2DEPARTMENT OF ENERGY
The stores have large entrances for customer flow with direct access to the store and for loading and unloading materials. Heating, ventilation, and air conditioning (HVAC) is handled by a roof top unit system with an energy management system.
A Home Depot store open in Lodi, California, is the first store built using the new prototype design, and is the most energy efficient Home Depot store in the country.
The Home Depot and the design team worked from the onset of the program to apply the CBP performance standard to its national portfolio of buildings, and evaluated energy efficiency measures (EEMs) for implementation in all future buildings. The biggest challenge was achieving the high-performance standard in the mild climate chosen for this specific project.
Decision CriteriaAt The Home Depot, energy efficiency measures (EEMs) must meet strict return on investment (ROI) requirements to be implemented in a new building.
• Measures with an ROI of less than 2 years are implemented directly.
• Measures with an ROI of 2-5 years are carefully evaluated.
• Measures with an ROI of more than 5 years are considered if the implementation cost is relatively low.
Economic
The EEM selection process for The Home Depot store in Lodi, California, was different from the EEM selection process in other areas of the country because of the very temperate climate in Lodi. In these mild temperatures, the typical store
uses very little natural gas and spends approximately 60 times more on electricity than natural gas. This discrepancy in utility expenses compelled the CBP team to focus on EEMs that saved electricity. Stores in other climates will consider the cost effectiveness of the full package of EEMs and additional envelope measures will be implemented.
EEMs that save natural gas were noted for other regions, but typically did not meet the ROI criteria in this specific location. Using the Trane Trace energy model, the team analyzed each EEM to enable The Home Depot to evaluate the ROI for each individual measure. The design team used this information to select the final EEM list for the Lodi store, which resulted in the greatest energy savings compared to the baseline prototype, while keeping project costs within the corporate economic targets.
Policy
The Home Depot wants to reduce energy consumption across all stores by 20% by the year 2015. In 2004, The Home Depot stores in the United States used approximately 25 kWh per square foot. By 2010, this was down to 21 kWh per square foot1. In-store policies provide additional energy and environmental benefits:
• 1.6 million pounds of compact fluorescent bulbs recycled for consumers
• A consumer education program guides customers to environmentally friendly products.
The Home Depot corporate energy team consistently looks for cost-effective energy measures that can be incorporated into stores. They often experiment with new measures to determine impact to customers and to evaluate the actual cost savings associated with the EEMs. This experimentation benefited the Lodi store by allowing the design team to test measures in other stores prior to implementation.
(Left) At The Home Depot store in Lodi, California, increasing the number of skylights to improve daylighting and customer experience was determined to be cost effective. Skylights from the Lodi store are shown at roof top level. (Right) In The Home Depot store, the checkout area is the focus of many of the skylights. Daylighting sensors adjust the lighting level from 100% to 50% or 0%. In this photo, the 0% lighting level is active, where the overhead lights in the upper left are completely off.

BU
ILDIN
G TE
CH
NO
LOG
IES O
FFICE
3D
EPA
RTM
EN
T OF E
NE
RG
Y
Energy Efficiency MeasuresThe CBP team originally proposed more than 50 EEMs that would benefit different regions and store types across the country. The energy savings from the measures follow in the table. While many of the EEMs shown were not selected for the Lodi store because of the ROI in the mild climate, many (particularly envelope improvements) will be cost effective when the prototype is applied nationally and will be implemented then. The EEMs are presented ranked by expected annual savings.
EEMImplemented in
This ProjectWill Consider for Future Projects
Expected Annual Saving Expected Cost of Conserved
Energy $/kWh3
Expected Simple Payback
yrkWh/yr1 $/yr2
Envelope: 7% of Whole Building Savings
Reduced building height by 4 feet Yes Yes 231,000 $24,000 Negative first cost Immediate
Increased roof insulation* No Yes NA $1,200 $1.85 > 40
Reduced air infiltration at entrances Yes Yes Benefits captured in package of measures
Lighting: 24% of Whole Building Savings
Reduced lighting power density on sales floor Yes Yes 494,000 $62,000 0.00 Immediate
Reduced exterior lighting power density Yes Yes 76,000 $9,600 $0.02 < 1
Used daylighting (increased number of skylights and 3 phase lighting) Yes Yes 40,000 $5,000 $0.32 < 12
Used light-emitting diode lighting in retail display racks Yes Yes 25,000 $3,200
Installed occupancy sensors and controls Yes Yes 20,000 $2,500 $0.01 < 1
Installed light-emitting diode lighting in offices and sensors and controls Yes Yes 11,000 $1,400 $0.10 < 4
Reduced lighting levels further during non-customer operation times (stocking and employee times) No No Measure determined possible safety issue
HVAC: 10% of Whole Building Savings
Installed high performance roof top units* Yes Yes NA $4,600 Negative first cost Immediate
Adjusted HVAC fan energy* Yes Yes Evaluating
Separated lumber area (allows lower temperature setpoint in section of store) No No Measure determined not feasible due to operational constraints vs. energy savings
Adjusted HVAC operation schedules and setpoints Yes Yes Evaluating No first cost Immediate
Plug Loads/Miscellaneous: 1% of Whole Building Savings
Installed quick battery charging stations Yes Yes NA $1,800 $0.02 < 1
* EEM is dependent on climate.1 kWh/year energy savings per measure were approximated using several methods including metered performance at existing stores, simulation software, and simple calculations.
The performance of the whole package of selected EEMs in the building is greater than the sum of the individual measures shown.2 Annual savings based on estimates from the design team and measured performance tested by the design team in other stores.3 Meier 1984.

BUILDING TECHNOLOGIES OFFICE
4 DEPARTMENT OF ENERGY
Ann
ual E
UI (
kBtu
/ft2 )
42% SAVINGS
Code Baseline Prototype Design Final Design
Fans
Cooling
Heating Gas
Heating Electric
Interior Lighting
Plug Loads
3% SAVINGS
0
10
20
30
40
50
60
70
80
Energy Use Intensities By End Use
The CBP team used Trane Trace and monitored data from other buildings in the company portfolio. The team evaluated several EEMs for total energy savings in the building. Other EEMs, like reduced lighting density in sales areas, were tested in other stores around the country and the change in energy consumption was measured to verify possible savings. This approach also allowed the team to ensure the EEMs would support branding and marketing criteria.
Some recommended EEMs, including additional lighting and temperature operational changes, were eliminated because current operations are already at a reduced level. In other cases, such as HVAC, the business case was assessed by modeling the energy performance and calculating capital costs.
To assess whole-building savings, three different energy models were created. Model 1 was the code baseline model. Model 2 represented a Home Depot store in Sacramento, California, built to the standard corporate building prototype. Model 3 included all of the selected EEMs for the Lodi store. Model 3 was also used to calculate possible savings in other locations to verify the revised prototype will achieve energy savings of more than 50% in most climates.
Model 1 - Code Baseline
The first model represented the prescriptive specifications of ASHRAE 90.1-2007. The baseline building had an annual energy use intensity (EUI) of 77 kilo British thermal units (kBtu)/square foot (ft2).
Model 2 - Prototype Design
The second model represented a building designed and operated according to The Home Depot’s original design and had an annual EUI of approximately 75 kBtu/ft2.
Model 3 - Final Design
The third version incorporated the EEMs included in the design. This model had an annual EUI of about 45 kBtu/ft2 and an annual energy savings of 42% over ASHRAE 90.1-2007.
Comparing Estimated EUI of Code Baseline, Prototype Design, and Final Design Models

BUILDING TECHNOLOGIES OFFICE
5DEPARTMENT OF ENERGY
Estimated Annual Energy Use and Percentage Savings by End Use
Code Baseline Prototype Design Final Design
End Use Category Annual EUI (kBtu/ft2)
Annual EUI (kBtu/ft2)
Annual EUI (kBtu/ft2)
Percent Savings Over Baseline
Interior Lighting 38.9 38.8 19.7 49
Heating (electric) 0.6 0.4 0.4 22
Heating (gas) 2.2 2.6 3.5 -61
Cooling 6.7 6.1 3.4 49
Fans 6.1 4.3 4.2 31
Plug Loads 22.5 22.5 13.5 40
Total 77.0 74.7 44.7 42
Estimated End Use Energy Savings from Implemented EEMs by End Use versus Code Baseline
Electricity End Use Category
Interior Lighting 584,000 kWh
Heating 3,700 kWh
Cooling 99,000 kWh
Fans 58,000 kWh
Plug Loads 272,000 kWh
Electricity Total 1,017,000 kWh
Natural Gas End Use Category
Heating -1,400 therms
Natural Gas Total -1,400 therms
(Left) Lighting display area when no customer is present. (Right) Lighting display area when customer is present. Motion sensors activate the display lighting in this aisle during the time a nearby shopper is browsing.

eere.energy.gov
BUILDING TECHNOLOGIES OFFICE
6
Lessons LearnedThe CBP project at the Lodi Home Depot store provided valuable insights that may be of help to other design teams.
Test the EEMs
The design team took a proactive approach to testing the measures in existing stores when possible. The light-emitting diode in-rack lighting was installed in an existing store to evaluate the impact to customers and sales. Many of the measures chosen for the Lodi store will serve as the test case for future implementation. One example is the motion sensor system installed for the three aisles of display lighting fixtures. This section of the store typically has a dedicated roof top air conditioning unit to handle the heat load from hundreds of lights operating at all times. In the Lodi store the aisles have motion sensors that turn the display lighting fixtures on only when a customer is in the aisle shopping. This EEM is expected to significantly reduce the load required for the roof top HVAC in addition to the direct energy savings from the lighting.
See the Big Picture
Lodi’s moderate climate made many of the proposed envelope EEMs less cost effective than they would be in other parts of the country. Recognizing that the savings might be even greater when considered across the full portfolio, the CBP team evaluated the performance of the proposed energy measures at locations in Baltimore, Charlotte, and Hartford to quantify the value of changing these measures in the portfolio prototype store.
The team found that when the heating energy was considered for the four locations across the country, the savings for heating energy would be much larger in the other areas compared to Lodi (more than 3 times in Hartford and more than 2 times in Baltimore). In these locations the package of EEMs considered would be well over the 50% target for the CBP. Based on this analysis, The Home Depot has incorporated the increased roof and wall insulation in the portfolio prototype and will roll these changes into future stores in other climate zones.
Maximize Team Communications
The Home Depot design team was composed of PNNL, WD Partners and McKinstry Industries and included many of the same groups that would have been involved in construction of a typical (non-CBP) store. This team’s existing integration made it easier for the parties involved to communicate. The design team’s knowledge of standard Home Depot design criteria and ROI requirements made selection of EEMs much smoother as the project progressed.
PNNL-SA-90234 • March 2013
Printed with a renewable-source ink on paper containing at least 50% wastepaper, including 10% post consumer waste.
“The Lodi store has become our showcase for energy efficiency and a great test-bed of energy performance for the company.”
— David Oshinski, Director of Construction at The Home Depot
References and Additional Information
1 ASHRAE. 2011. “50% Advanced Energy Design Guide for Medium to Big Box Retail Buildings.” American Society of Heating, Refrigerating and Air Conditioning Engineers, Atlanta, Georgia. Available at http://www.ashrae.org/standards-research--technology/advanced-energy-design-guides/50-percent-aedg-free-download
2 Meier, A.K. 1984. “The Cost of Conserved Energy as an Investment Statistic.” ESL-IE-84-04-109, Lawrence Berkeley Laboratory. Available at http://repository.tamu.edu/bitstream/handle/1969.1/94751/ESL-IE-84-04-109.pdf?sequence=1.
3 Shoemaker, J. 2010. “Home Depot’s Sustainable Efforts Reduce Energy Consumption in US and Canadian Stores.” Emerging Energy. Available at http://www.energyboom.com/emerging/home-depot%E2%80%99s-sustainable-efforts-reduce-energy-consumption-us-and-canadian-stores
4 WD Partners 2011. “Commercial Building Partnership Stage 1 Final Report.”