Embed Size (px)
Citation preview

<#>
© 2010 Morningstar, Inc. All rights reserved.
The History and Economics of Stock Market
Crashes
× Paul D. Kaplan, Ph.D., CFAQuantitative Research DirectorMorningstar Europe
The History and Economics of Stock Market Crashes
× Chapter in Insights into the Global Financial Crisis, Laurence B. Siegel, ed., CFA Institute, 2009.
× Authors
× Paul D. Kaplan, Morningstar Europe
× Thomas Idzorek, Ibbotson Associates
×Michele Gambera, UBS Global Asset Management
× Katusanari Yamaguchi, Ibbotson Associates Japan
× James Xiong, Ibbotson Associates
× David M. Blanchett, MBA Candidate, Chicago Booth School

Contents
× “Black Sunday,” 14 September 2008
× Bubbles and Crashes Globally
× U.S. Record
× U.K. Record
× Japanese Record
× Global Perspectives on 1987 and 1929 Crashes and the Long Boom
×Why Do Crashes Occur?
× Policy Conclusions

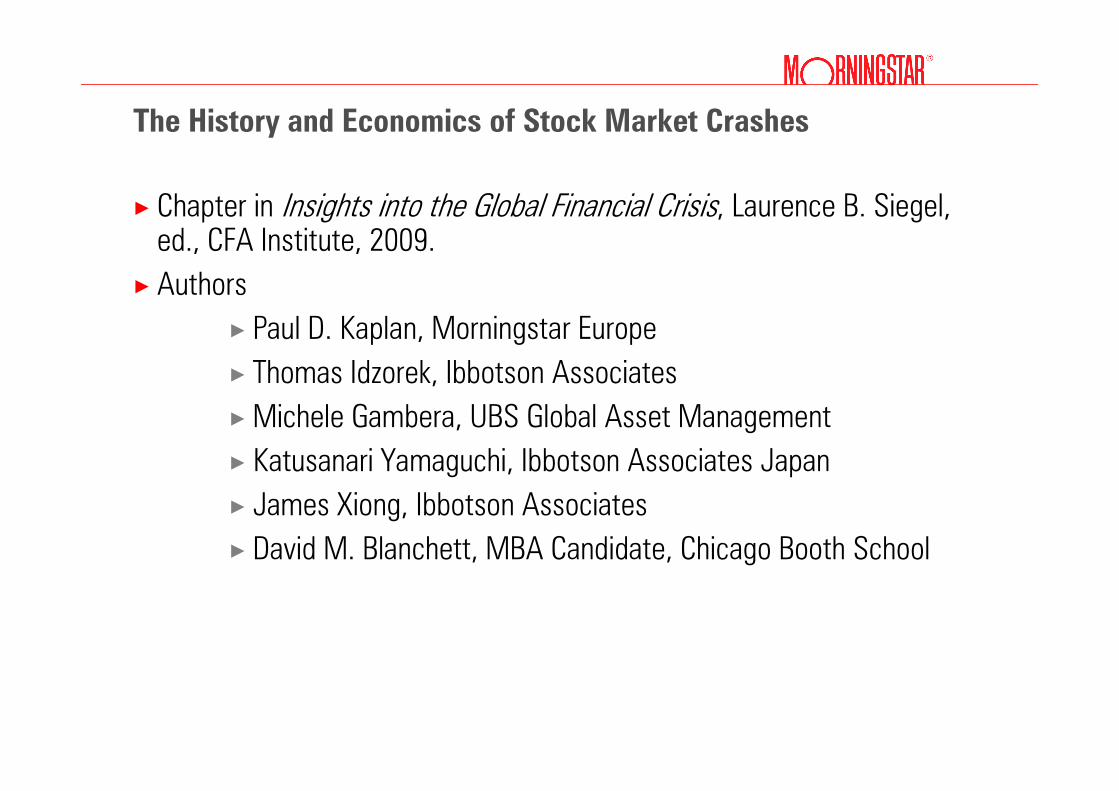
“Black Sunday,” 14 September 2008
Intraday Movement in Various Markets, 15-16 September 2008

A Global Systemic Crisis
× Highly leveraged real estate
× Long period of rising prices
× Large supply of liquidity & credit
× Securitized mortgages sold globally
× Subprime mortgages
× Failure of rating agencies
×Widespread fall in prices exposed system wide risk
× Credit Default Swaps
× Opaquely linked together many financial institutions globally
× Amplified counterparty risk which was underestimated
× Fall of Lehman Brothers triggered a global systemic crisis
× A classic crisis set up by high levels of leverage everywhere
Bubbles and Crashes Globally
The Black Swan
× An event that is inconsistent with past data but that happens anyway

Gray Swans
× “Events of considerable nature which are far too big for the bell curve, which are predictable, and for which one can take precautions”Benoit Mandelbrot (inventor of fractal geometry)
“We seem to have a once-in-a-lifetime
crisis every three or four years.”
Leslie RahlFounder of Capital Market Risk Advisors
Source: Christopher Wright, “Tail Tales,” CFA Institute Magazine, March/April 2007

The Black Turkey
× “An event that is entirely consistent with past data but that no one thought would happen” Larry Siegel

A Flock of Turkeys
Asset class Time period Peak to trough decline
US stocks (real total return) 1911-1920 51%
US stocks (DJIA, daily) 1929-1932 89%
Long US Treasury bond (real total return)
1941-1981 67%
US stocks 1973-1974 49%
UK stocks (real total return) 1972-1974 74%
Gold 1980-1985 62%
Oil 1980-1986 71%
Japan stocks 1990-2009 82%
US stocks (S&P) 2000-2002 49%
US stocks (NASDAQ) 2000-2002 78%
US stocks (S&P) 2007-2009 57%
Nominal price return unless otherwise specified.
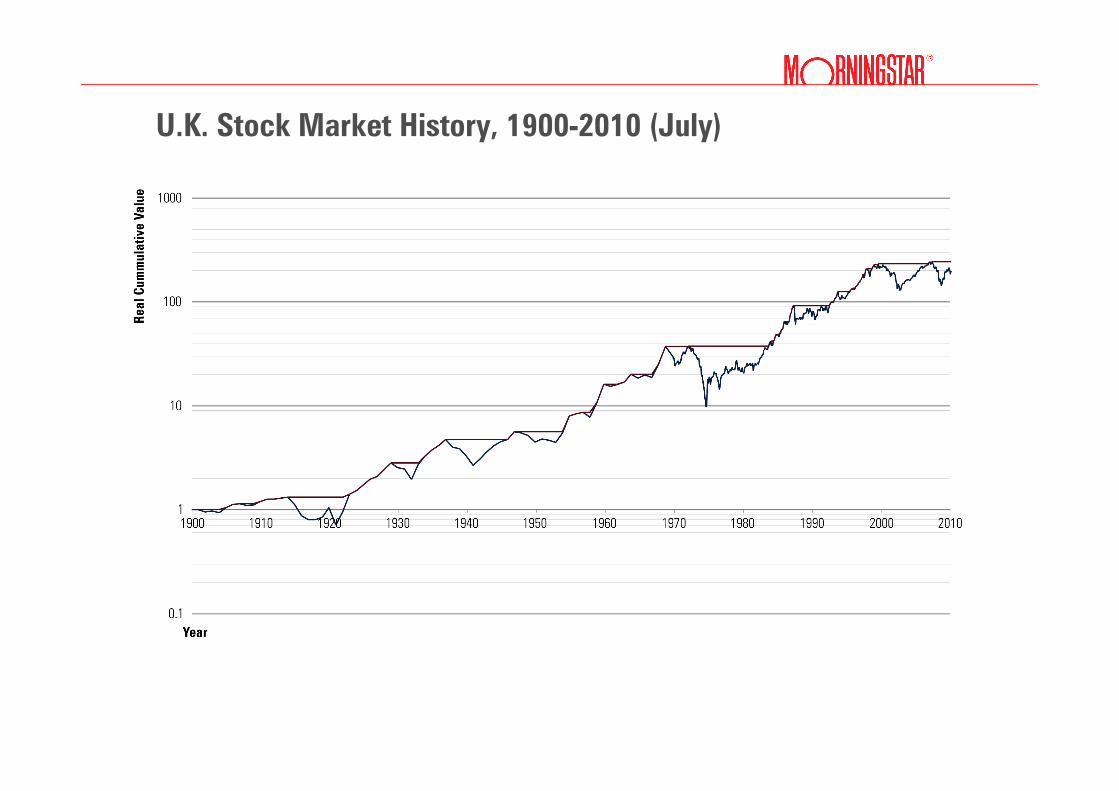
U.K. Stock Market History, 1900-2010 (July)

Largest Declines in U.K. Stock Market History, 1900-2010Real Total Returns
Post-World War II correction195421.3019521946
First part of Great Depression193330.5719311928
“Black Monday,” 19 Oct 1987Nov 199234.07Nov 1987Sep 1987
Speculation in currencies;
Bretton Woods
Apr 197235.80May 19701968
Crash of 2007−2009;
global financial crisis
TBD40.99Feb 2009Oct 2007
Second part of Great Depression;
World War II
194643.7119401936
Information technology bubble
and collapse
Apr 200744.91Jan 2003Dec 1999
World War I192245.8519201913
Oil shockJan 198473.81%Nov 1974Apr 1972
Event(s)RecoveryDeclineTroughPeak

Japanese Stock Market History, 1952-2009

Largest Declines in Japanese Stock Market History,January 1952-June 2009, Real Total Returns
“Black Monday,” 19 Oct 1987Mar 198819.79Dec 1987Aug 1987
Bretton WoodsJun 197221.33Dec 1970May 1970
Stalin shockDec 195531.98May 1954Jun 1953
Yamaichi Securities bailoutAug 196834.47Jun 1965Jun 1961
Worldwide oil crisisDec 198351.85Oct 1974Dec 1972
Easy credit; real estate bubbleTBD71.92%Mar 2003Dec 1989
Event(s)RecoveryDeclineTroughPeak
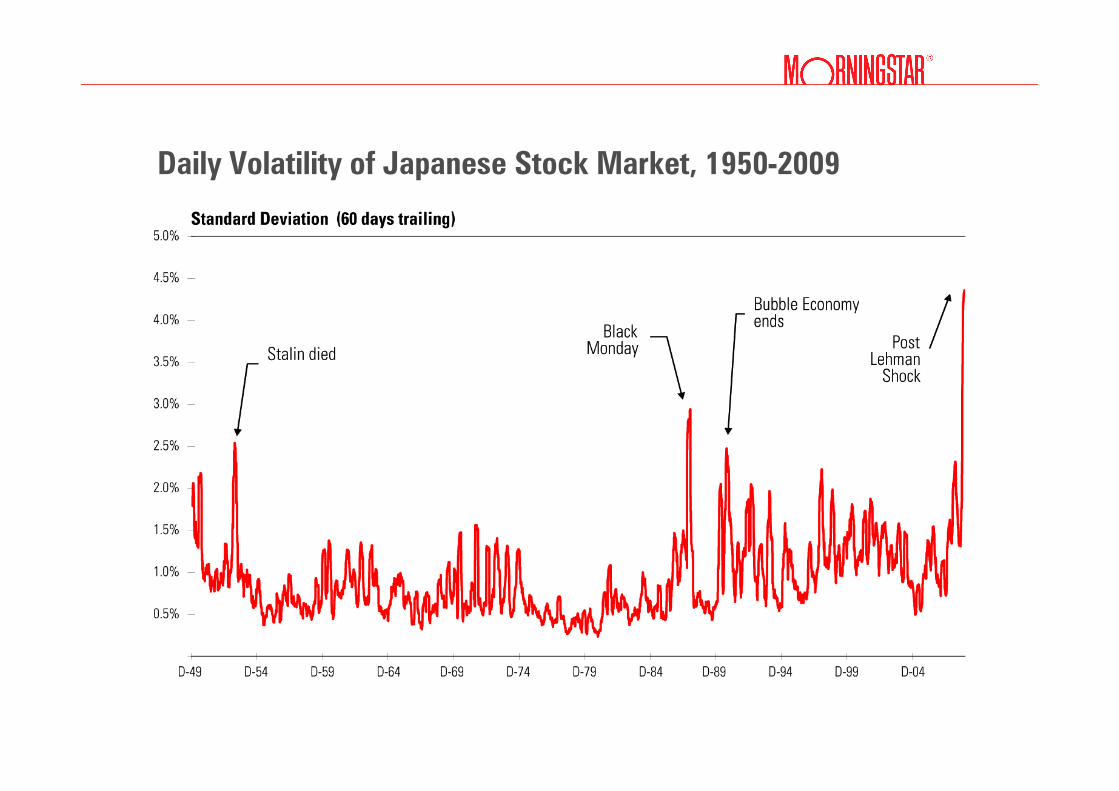
Daily Volatility of Japanese Stock Market, 1950-2009

Japanese Stock and Land Price Indices, 1955-2009

October 1987 Stock Market Total Return (% U.S. Dollars)

Real Stock Price Indices Excluding Dividends, 1929-1935

Largest Peak-to-Trough Declines in 8 Countries Since 1969Month-end results as of July 2010 in inflation-adjusted local currency
Country Peak Trough Decline Recovery
Spain April 1973 April 1980 85.36% December 1996
Italy January 1970 December 1977 82.58% March 1986
U.K. April 1972 November 1974 73.81% January 1984
Japan December 1989 April 2003 70.33% To Be Determined
Germany February 2000 March 2003 69.44% To Be Determined
France August 2000 March 2003 60.52% To Be Determined
Canada February 1980 June 1982 51.38% March 1986
U.S. December 1999 February 2009 54.84% To Be Determined
Source: Morningstar EnCorr,, MSCI Barra, International Monetary Fund

Drawdowns Around the World, January 1988 – September 2010

Bases on monthly inflation-adjusted returns on the MSCI UK Gross Return index : January 1970 − July 2010
Source: Morningstar EnCorr, MSCI Barra, and International Monetary Fund
Cracks in the Bell Curve: The UK
Why Do Crashes Occur?

Economic Thought and Financial Crises
×Wicksell and Fisher
× Over optimism leads to excessive leveraged real investment
× Eventually reality hits and there is an economic crisis
× Keynes
× Confidence crisis, liquidity trap, and market imbalance makes government intervention necessary to remedy a recession
× Hayek
× Government and central bank stimulation increase leverage, thus deepening recessions during the inevitable deleveraging
×Minsky
× Market calm lulls people into underestimating risk and over optimism
× Some government intervention needed to mitigate this behavior

× Regulators permitted excessive risk taking by allowing excessive leverage
× Central banks fueled excessive leverage with expansionary policies
× Lack of sound risk management
×Market participants underestimated risk
× Academics overly believed in market efficiency
× Politicians benefited from excessive short run economic growth
× CEOs focused on short-term profits, hoping to retire before the inevitable crash
The Crash of 2007-2009 in Light of Economic Theory

Policy Conclusions

× Regulatory Reform
× Transparency
× Limit leverage
× Enlarge scope to all financial institutions
× Risk modeling reform
× Include scenarios of sudden flight to quality
×Model systemic risk
× Reform the financial infrastructure for more transparency
× OTC derivatives
× Off-balance-sheet vehicles
Steps To Reduce Likelihood of a Future Crises