Embed Size (px)
Citation preview

The High Cost of Fossil Fuels Why America Can’t Afford to Depend on Dirty Energy

The High Cost of Fossil FuelsWhy America Can’t Afford to Depend on Dirty Energy
Sarah Payne and Tony Dutzik, Frontier Group
Emily Figdor, Environment America
Research & Policy Center
June 2009

Acknowledgments
The authors wish to thank Bruce Biewald, President, Synapse Energy Economics, and Joseph Romm, Senior Fellow, Center for American Progress, for their review of this report. The authors would also like to thank Susan Rakov and Travis Madsen of Frontier Group for their editorial assistance.
The generous financial support of the Energy Foundation and the New York Com-munity Trust made this report possible.
The opinions expressed in this report are those of the authors and do not necessarily reflect the views of our funders or those who provided review. Any factual errors are strictly the responsibility of the authors.
© 2009 Environment America Research & Policy Center
Environment America Research & Policy Center is a 501(c)(3) organization. We are dedi-cated to protecting America’s air, water and open spaces. We investigate problems, craft solutions, educate the public and decision makers, and help Americans make their voices heard in local, state and national debates over the quality of our environment and our lives. For more information about Environment America Research & Policy Center or for additional copies of this report, please visit www.environmentamerica.org.
Frontier Group conducts independent research and policy analysis to support a cleaner, healthier and more democratic society. Our mission is to inject accurate information and compelling ideas into public policy debates at the local, state and federal levels. For more information about Frontier Group, please visit www.frontiergroup.org.
Cover photo: ImagineGolf, under license from istockphoto.com Layout: Harriet Eckstein Graphic Design

Table of Contents
Executive Summary 1
Introduction 6
America’s Current Energy Path: Costly and Dangerous Dependence on Fossil Fuels 8Fossil Fuels Are Costly to Consumers and the Economy 9Americans Will Suffer Increasing Economic Burdens from Fossil Fuel Dependence in the Years to Come 10
Future Energy Cost Forecasts: No Crystal Ball 10America’s Fossil Fuel Bill: At Least $23 Trillion Between 2010 and 2030 12The Burden of Fossil Fuel Expenditures Varies by State 15
America Pays a Heavy Price in Environmental and Public Health Damage from Fossil Fuels 17
Global Warming 17Air Pollution 20Oil Spills and Other Fossil Fuel-Related Disasters 21
Clean Energy: A Better Choice for Our Future 23Clean Energy Investments Can Save Money 23Clean Energy Benefits the Environment 25Making it Happen: Policy Recommendations 26
Appendix A. Tables 27
Appendix B. Methodology 33
Notes 35


Executive Summary 1
Executive Summary
America is at an energy crossroad. As a nation, we are dependent on fossil fuels at a time of growing demand
and dwindling supply. Meanwhile, fos-sil fuel use continues to impose massive environmental and economic costs. Now our country must choose between paying to continue the status quo and investing in a new energy future.
The costs of continuing on our current energy path are steep. American consumers and businesses already spend roughly $700 billion to $1 trillion each year on coal, oil and natural gas, and suffer the incalculable costs of pollution from fossil fuels through damage to our health and environment. If America continues along a business-as-usual energy path, U.S. fossil fuel spending is likely to grow, totaling an estimated $23 trillion between 2010 and 2030.
Policymakers in Washington, D.C., and many states have recently taken the first small steps toward a clean energy future, adopting policies to encourage energy ef-ficiency, ramp up the use of solar and wind power, and curb global warming pollution. Now, with even bolder steps—such as a national cap on global warming pollution and more ambitious targets for renewable
energy and energy efficiency—on the pub-lic agenda, powerful interests with a stake in preserving the status quo have criticized strong clean energy policies as being too expensive for the American public.
In fact, the reverse is true. The United States cannot afford to wait to break our dependence on fossil fuels. The cost of fossil fuels to our economy and our en-vironment will continue to mount in the years to come unless the nation takes bold steps now to embrace the benefits of a clean energy future.
America is overly reliant on fossil fuels such as coal, natural gas and oil. This dependence is costly to every-day citizens, and sends valuable dol-lars overseas and out of the domestic economy.
• The United States depends on fossil fuels for 85 percent of our energy supply.
• In 2006, American consumers and businesses spent $921 billion—or close to 7 percent of America’s gross domestic product—on fossil fuels,

2 The High Cost of Fossil Fuels
more than the nation spends on education or the military. In 2008, national expenditures on fossil fuels likely topped $1 trillion for the first time ever. Each year, more than 70 percent of this money is spent on oil.
• In 2007, America spent more than $360 billion importing fossil fuels, with the vast majority of that money spent on crude oil. That money is a direct transfer of wealth from Ameri-can consumers to oil companies and foreign governments.
• For every dollar that an American household spends each year, about 10 cents are likely to go toward the purchase of energy, with most of that money spent on fossil fuels.
Fossil fuel production and use dam-age our environment and our health—inflicting even greater damage on the American economy and our quality of life.
• Fossil fuel combustion is the leading contributor to global warming, which, in addition to being a looming envi-ronmental and human catastrophe, could inflict massive economic dam-age as well:
o Sea level rise and an increase in the severity of storms could put key cities such as New York, Miami and New Orleans at greater risk of costly storm damage. A 2008 Natural Resources Defense Council study estimated that high-intensity hurricanes could cause as much as $422 billion in damages in Atlantic and Gulf Coast states between 2025 and 2100.
o A 2007 study by researchers at the Lawrence Livermore National
Laboratory and the Carnegie In-stitution at Stanford University found that global production of three of the six largest global crops experienced significant losses due to global warming between 1981 and 2002. The study concluded that global wheat growers, for example, lost $2.6 billion and global corn growers lost $1.2 billion in 2002.
o Global warming is forecast to inflict a variety of other costs, including declining rainfalls and rising tem-peratures that will combine to cause large and extended drought condi-tions in regions like the Southwest, and impacts on public health due to heat-related illnesses, greater formation of ozone smog, and in-creases in vector-borne disease.
o An assessment by former World Bank Chief Economist Sir Nicholas Stern indicates that global warming has the potential to reduce global per-capita consumption by as much as 20 percent.
• Fossil fuel production and use also im-poses other environmental and social costs beside those related to global warming.
o Fossil fuels are a leading source of air and water pollution. The economic cost of air pollution in sectors regulated under the Clean Air Act has been estimated at $9 trillion between 1970 and 2000, with costs resulting from pol-lution-induced early mortality, illness, health care costs and lost productivity.
o The production and transport of fossil fuels results in routine pollution of the environment and

Executive Summary 3
occasional catastrophic accidents. The December 2008 collapse of a coal ash pond outside a Tennessee Valley Authority power plant cov-ered 300 acres in sludge and will cost an estimated $825 million to clean up. Between 1990 and 2006, 51 large oil spills in the United States resulted in the expenditure of between $860 million and $1.1 billion in removal costs and com-pensation for damages.
The economic and environmental burden of fossil fuel dependence will only worsen in the years to come.
• The United States will spend an estimated $23 trillion on fossil fuels between 2010 and 2030 should energy consumption and fossil fuel prices follow U.S. government projections—an amount equivalent to nearly three years’ worth of income for the entire American workforce at current earning rates.
• Fossil fuel expenditures will decline in the next several years due to the lingering effects of the economic recession, but annual expenditures of more than $1 trillion per year—which proved devastating to the economy during early 2008—will become the “new normal” by the middle of the next decade. By 2030, the United States can expect to spend approxi-mately $360 billion more per year on fossil fuels than we did in 2006.
• If fossil fuel prices are driven higher, faster, the United States could expect to spend more than $30 trillion on fossil fuels between 2010 and 2030. Fossil fuel expenditures would again surpass $1 trillion in 2011 and by 2030 we will be spending $750 billion more per year on fossil fuels than the nation did in 2006.
• Oil prices are a main driver of higher expenditures. If oil prices reach $200 per barrel by 2030—an event more
$400,000
$600,000
$800,000
$1,000,000
$1,200,000
$1,400,000
uelExp
enditures(m
illion20
07$)
Natural Gas
Coal
Oil
$0
$200,000
$400,000
$600,000
$800,000
$1,000,000
$1,200,000
$1,400,000
FossilFu
elExpe
nditures
(million20
07$)
Natural Gas
Coal
Oil
Figure ES-1. Projected U.S. Expenditures on Fossil Fuels (2007 dollars), Reference Case

� The High Cost of Fossil Fuels
likely to happen as world oil supplies become increasingly strained—the United States will be spending $1.3 trillion out of $1.6 trillion total fossil fuel costs on oil alone.
• Rising fossil fuel expenditures will affect all 50 states, but states with a greater reliance on fossil fuels, par-ticularly oil, will experience greater increases. (See Appendix A for pro-jected fossil fuel expenditures for all 50 states.)
Investing in clean energy that never runs out can reap economic savings. The United States has the ability today to produce this energy, and to help Americans use energy more effi-ciently in their homes, businesses and vehicles.
• A 2007 analysis by McKinsey & Com-pany estimated that the United States could reduce its emissions of global warming pollution by approximately 1.2 billion metric tons of carbon diox-ide per year (equal to about 20 percent of today’s fossil fuel emissions) with net dollars savings. In other words, these investments are economic winners on their own terms—even ex-cluding benefits for the environment, public health and America’s security.
• A recent Energy Information Admin-istration analysis of the American Re-covery and Reinvestment Act (ARRA) found that the Act’s provisions for residential and commercial energy efficiency improvements will yield significant savings. The EIA projects that the law will reduce residential and commercial energy bills by $13 billion in 2020 and $21 billion in 2030.
• The recent move by President Obama to increase federal vehicle fuel econo-
my standards to 35 miles per gallon by 2016 will deliver $20 billion in net sav-ings to consumers in 2020 at gasoline prices of $2.25 per gallon. If gasoline prices hit $4 per gallon, the net ben-efits would balloon to $70 billion.
• According to the Union of Concerned Scientists, transitioning to a clean en-ergy economy could cut global warm-ing emissions while saving consumers and businesses $465 billion each year by 2030, with $1.7 trillion in net cumulative savings between 2010 and 2030.
The federal government, along with states, should take actions to reduce our dependence on fossil fuels. They should:
• Reduce the nation’s emissions of global warming pollutants deeply enough to prevent dangerous im-pacts from global warming, guided by the latest scientific understand-ing. The United States should adopt an emissions cap and other policies that will reduce global warming pol-lution by 35 percent below 2005 levels by 2020 and by 80 percent below 2005 levels by 2050, and implement strict rules for carbon “offsets” to ensure that efforts to reduce emissions are successful.
• Ensure that a cap-and-trade pro-gram used to achieve those tar-gets directs the revenues gained through the sale of allowances for public purposes. One hundred percent of emission allowances should be auctioned, with the revenues used for investments in clean energy and to benefit consumers.
• Ensure that America generates at least 25 percent of its electricity

Executive Summary 5
from renewable sources of energy such as wind and solar power by 2025.
• Strengthen energy efficiency stan-dards and codes for appliances and buildings, with the goal of reducing energy consumption in new buildings by 50 percent by 2020 and ensuring that all new buildings use zero net energy by 2030.
• Promote the development and implementation of clean trans-portation infrastructure, includ-
ing improving the fuel economy of light- and heavy-duty vehicles, reduc-ing the carbon intensity of transpor-tation fuels, and promoting plug-in vehicles, public transportation and high-speed intercity rail.
• Ramp up investment in solar power through tax credits, specific tar-gets in state renewable electricity standards, requirements for “solar ready homes,” rebate programs, and other measures.
• End subsidies to fossil fuel industries.
6 The High Cost of Fossil Fuels
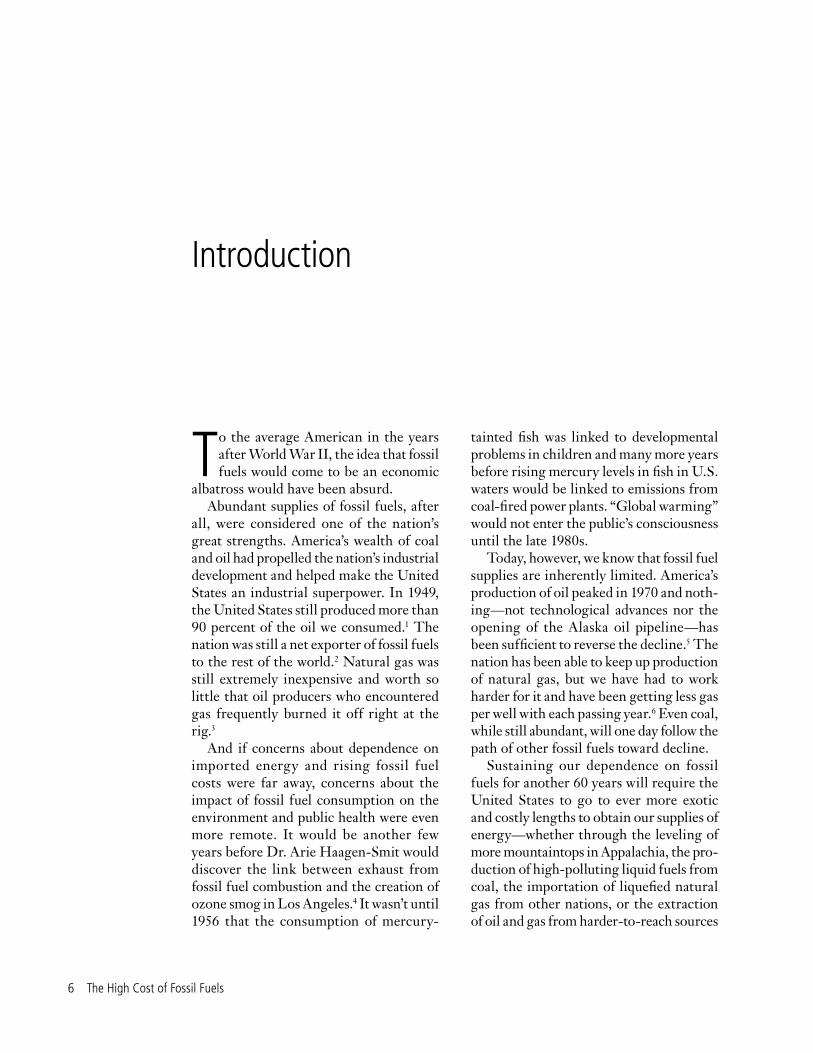
To the average American in the years after World War II, the idea that fossil fuels would come to be an economic
albatross would have been absurd. Abundant supplies of fossil fuels, after
all, were considered one of the nation’s great strengths. America’s wealth of coal and oil had propelled the nation’s industrial development and helped make the United States an industrial superpower. In 1949, the United States still produced more than 90 percent of the oil we consumed.1 The nation was still a net exporter of fossil fuels to the rest of the world.2 Natural gas was still extremely inexpensive and worth so little that oil producers who encountered gas frequently burned it off right at the rig.3
And if concerns about dependence on imported energy and rising fossil fuel costs were far away, concerns about the impact of fossil fuel consumption on the environment and public health were even more remote. It would be another few years before Dr. Arie Haagen-Smit would discover the link between exhaust from fossil fuel combustion and the creation of ozone smog in Los Angeles.4 It wasn’t until 1956 that the consumption of mercury-
tainted fish was linked to developmental problems in children and many more years before rising mercury levels in fish in U.S. waters would be linked to emissions from coal-fired power plants. “Global warming” would not enter the public’s consciousness until the late 1980s.
Today, however, we know that fossil fuel supplies are inherently limited. America’s production of oil peaked in 1970 and noth-ing—not technological advances nor the opening of the Alaska oil pipeline—has been sufficient to reverse the decline.5 The nation has been able to keep up production of natural gas, but we have had to work harder for it and have been getting less gas per well with each passing year.6 Even coal, while still abundant, will one day follow the path of other fossil fuels toward decline.
Sustaining our dependence on fossil fuels for another 60 years will require the United States to go to ever more exotic and costly lengths to obtain our supplies of energy—whether through the leveling of more mountaintops in Appalachia, the pro-duction of high-polluting liquid fuels from coal, the importation of liquefied natural gas from other nations, or the extraction of oil and gas from harder-to-reach sources
Introduction

Introduction 7
deeper underground, farther offshore, or in lower-quality forms.
At the same time, we are now aware of the heavy burden that our consumption of fossil fuels has on our health and the planet. For four decades, America has tried laudably to contain the environmen-tal damage exacted by fossil fuels. We’ve put catalytic converters on cars, scrubbers on smokestacks, and double hulls on oil tankers. We’ve “reclaimed” coal mines as golf courses and offshore oil platforms as artificial reefs. Yet the environmental toll of fossil fuel consumption continues to mount—now in the form of global warm-ing, which threatens catastrophe for the environment and people alike.
The costs of our dependence on fossil fuels—both for the environment and our economy—and the increasing obstacles to
continuing along our current path, now re-quire us to make a change, and to embrace a new energy future. America now has the technology, the know-how, and the motiva-tion to liberate ourselves from dependence on fossil fuels by becoming smarter about how we use energy and getting more of our energy from clean, renewable sources such as the wind and the sun.
As the findings in this report suggest, there is little time to lose. Every year we continue to put off action is another year we consign ourselves to spending on fossil fuels that drains our economy and harms our world.
The challenge of achieving a clean en-ergy future will be great, and it will take a major investment of resources to get there. But the costs of inaction are far greater.

8 The High Cost of Fossil Fuels
Americans use fossil fuels in almost every part of our lives. Gasoline powers our vehicles, coal and natural
gas produce most of our electricity, and business and industry use a variety of fossil fuels to power machinery, to heat and cool buildings, and as ingredients in products.
Most Americans don’t need to be reminded of the financial costs of our dependence on fossil fuels. The gasoline price spikes of 2004 to 2008 strained fam-ily budgets, while rising costs for natural gas and heating oil in recent years led to skyrocketing winter heating bills for Americans in colder parts of the country. Instability in natural gas and coal prices have caused spikes in electric rates and hit fossil fuel-dependent segments of industry particularly hard. To add insult to injury, much of the money we spend on fossil fuels—particularly oil—is sent overseas, enriching foreign governments and busi-nesses at the expense of our domestic economy.
But for every cost of fossil fuel consump-tion that appears on a family’s credit card bill, a business’ books or a government agency’s budget, there is a corresponding
hidden cost. Fossil fuel production and use threaten the environment and our health in myriad ways—from the destruction of fishing grounds by oil spills to higher health care costs due to air pollution to the massive costs that will be imposed on current and future generations by global warming. These costs are not reflected in the price we pay for fossil fuels, but they are very real.
Critics of a cleaner energy path for the United States often warn of the costs of transforming America’s energy infra-structure to one that uses energy more efficiently and relies on renewable sources such as wind and solar power for more of the energy we use. Indeed, achieving a new energy future for America will require significant investment.
But there are two sides to every story. Continuing America’s current energy path threatens to impose its own massive costs on our economy—both directly in terms of the amount of money we pay to heat our homes and power our cars and facto-ries, and indirectly in terms of the large environmental and public health impacts of fossil fuel consumption.
America’s Current Energy Path: Costly and Dangerous Dependence on Fossil Fuels

America’s Current Energy Path 9
Fossil Fuels Are Costly to Consumers and the EconomyAmericans depend on fossil fuels to meet our energy needs. In 2006, for example, 85 percent of all energy consumed in America was derived from coal, natural gas or pe-troleum.7 Of total fossil fuel use, petroleum constituted 48 percent, while coal and natural gas each comprised 26 percent.8
American dependence on fossil fuels is expensive. In 2006, the United States spent nearly 7 percent of its gross domestic product, or $921.2 billion, on fossil fuels for home, business and transportation use.10 This amounted to $3,083 per U.S. resi-dent.11 Oil accounted for the vast majority of this spending, accounting for 72 percent of total U.S. fossil fuel expenditures.12
For most U.S. families, fossil fuels are a big item in the household budget. In 2007, the average American household spent $1,934 on natural gas, electricity and fuel oil for home use, along with $2,384 for gasoline and motor oil in vehicles, for a to-tal of $4,318 of annual spending on energy. That represents about 9 percent of total household expenditures.13 Moreover, as a household’s income declines, the percent-age of household expenditures devoted to energy increases. For households in the middle 20 percent of the national income distribution, energy purchases accounted for 10 percent of total expenses; for those in the lowest 20 percent, they accounted for 11 percent of purchases.14
In other words, for every dollar that an American household spends each year,
“Continuing America’s current energy path threatens to impose its
own massive costs on our economy—both directly in terms of the
amount of money we pay to heat our homes and power our cars and
factories, and indirectly in terms of the large environmental and public
health impacts of fossil fuel consumption.”
3% 3% 1%
8%
3% 3% 1%
Coal, Natural Gas, Petroleum
Nuclear
8%
3% 3% 1%
Coal, Natural Gas, Petroleum
Nuclear
Hydroelectric
Biomass85%
8%
3% 3% 1%
Coal, Natural Gas, Petroleum
Nuclear
Hydroelectric
Biomass
Wind, Solar, Geothermal85%
8%
3% 3% 1%
Coal, Natural Gas, Petroleum
Nuclear
Hydroelectric
Biomass
Wind, Solar, Geothermal85%
8%
3% 3% 1%
Coal, Natural Gas, Petroleum
Nuclear
Hydroelectric
Biomass
Wind, Solar, Geothermal85%
8%
3% 3% 1%
Coal, Natural Gas, Petroleum
Nuclear
Hydroelectric
Biomass
Wind, Solar, Geothermal
Figure 1. Total U.S. Energy Consumption by Fuel Group, 20069

10 The High Cost of Fossil Fuels
about 10 cents are likely to go toward the purchase of energy, with most of that money spent on fossil fuels. For the average middle-income family, that is about seven times more than they spend annually on federal personal income taxes.15
Moreover, much of that money goes overseas. In 2007, America spent more than $360 billion importing fossil fuels, with the vast majority of that money spent on crude oil.16 This spending is a direct transfer of wealth from American consumers to oil companies and foreign governments.
Americans Will Suffer Increasing Economic Burdens from Fossil Fuel Dependence in the Years to Come
Future Energy Cost Forecasts: No Crystal BallAs any American who has tried to balance a household budget in recent years knows, predicting the future price of fossil fuels is never easy. The U.S. Department of
Energy’s Energy Information Administra-tion (EIA) produces periodic projections of energy consumption and price trends. The EIA, like most other analysts, rarely achieves perfect accuracy in its predictions. But the agency’s projections are among the most complete and widely used forecasts of future energy consumption and costs.
Each year, the EIA produces a series of scenarios for energy use and prices based on assumptions about the future. The agency’s “reference case” scenario is its vision of the most likely future. The EIA’s 2009 projections include an updated refer-ence case that reflects changes in projected energy use and economic growth that result from enactment of the American Recovery and Reinvestment Act (ARRA)—otherwise known as the economic recovery bill—signed into law by President Obama in early 2009.
The EIA’s reference case represents the conventional wisdom about the future of energy supplies—a world in which global oil supplies remain relatively plentiful, oil prices remain below the peak prices of 2008, new fossil fuel resources (such as natural gas from shale formations, coal-to-liquids fuels, and oil from deep offshore waters and oil shale) will come to substitute for sources that are on the decline, and domestic coal remains plentiful and af-fordable.17 In short, while not a “best-case scenario,” the EIA’s reference case repre-sents an optimistic view of the availability of fossil fuels in the future.
For a variety of reasons, however, that optimism is open to question. There are several factors that could prevent the fossil fuel resources in EIA’s analysis from actu-ally coming to market:
• Problems with accessing expected new sources of natural gas and oil The EIA’s reference case scenario as-sumes that a natural gas pipeline will be built to carry gas from Alaska to the lower 48 states by 2020 and that
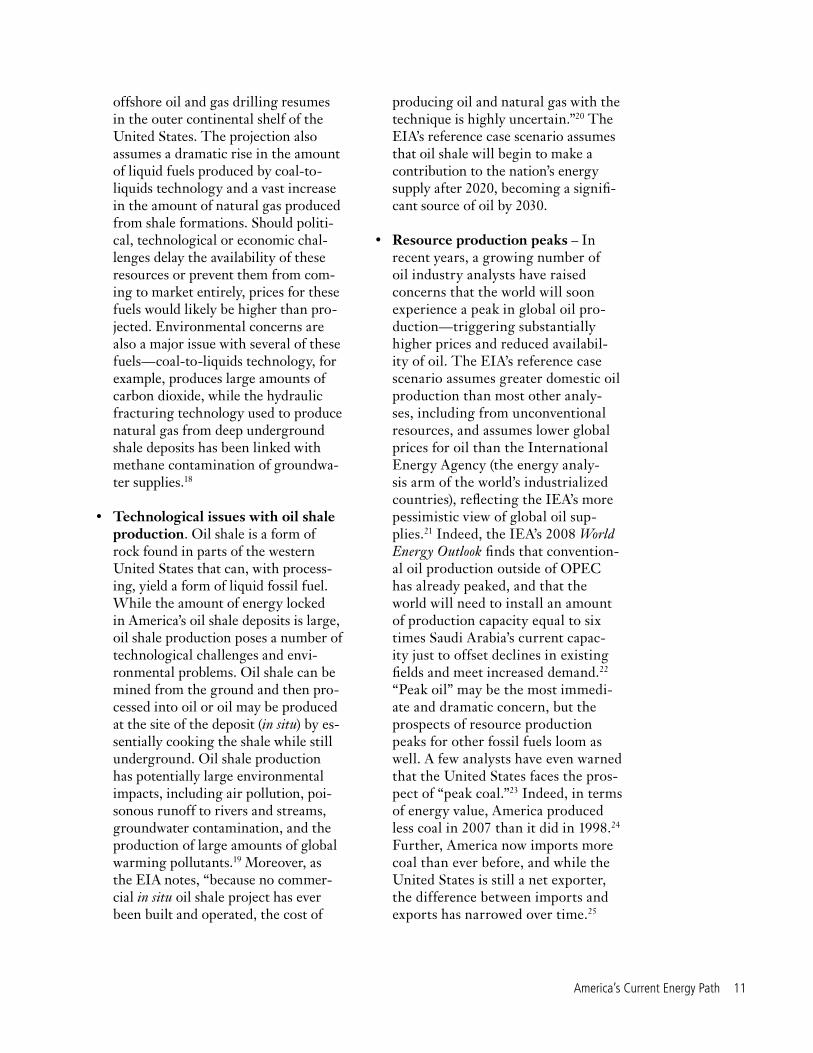
The Lost Hills oil field in central California. Oil currently accounts for 72 percent of all yearly U.S. fossil fuel spending, which exceeded $1 trillion dollars for the first time in 2008. Photo: Richard Masoner, under Creative Commons license from www.flickr.com
America’s Current Energy Path 11
offshore oil and gas drilling resumes in the outer continental shelf of the United States. The projection also assumes a dramatic rise in the amount of liquid fuels produced by coal-to-liquids technology and a vast increase in the amount of natural gas produced from shale formations. Should politi-cal, technological or economic chal-lenges delay the availability of these resources or prevent them from com-ing to market entirely, prices for these fuels would likely be higher than pro-jected. Environmental concerns are also a major issue with several of these fuels—coal-to-liquids technology, for example, produces large amounts of carbon dioxide, while the hydraulic fracturing technology used to produce natural gas from deep underground shale deposits has been linked with methane contamination of groundwa-ter supplies.18
• Technological issues with oil shale production. Oil shale is a form of rock found in parts of the western United States that can, with process-ing, yield a form of liquid fossil fuel. While the amount of energy locked in America’s oil shale deposits is large, oil shale production poses a number of technological challenges and envi-ronmental problems. Oil shale can be mined from the ground and then pro-cessed into oil or oil may be produced at the site of the deposit (in situ) by es-sentially cooking the shale while still underground. Oil shale production has potentially large environmental impacts, including air pollution, poi-sonous runoff to rivers and streams, groundwater contamination, and the production of large amounts of global warming pollutants.19 Moreover, as the EIA notes, “because no commer-cial in situ oil shale project has ever been built and operated, the cost of
producing oil and natural gas with the technique is highly uncertain.”20 The EIA’s reference case scenario assumes that oil shale will begin to make a contribution to the nation’s energy supply after 2020, becoming a signifi-cant source of oil by 2030.
• Resource production peaks – In recent years, a growing number of oil industry analysts have raised concerns that the world will soon experience a peak in global oil pro-duction—triggering substantially higher prices and reduced availabil-ity of oil. The EIA’s reference case scenario assumes greater domestic oil production than most other analy-ses, including from unconventional resources, and assumes lower global prices for oil than the International Energy Agency (the energy analy-sis arm of the world’s industrialized countries), reflecting the IEA’s more pessimistic view of global oil sup-plies.21 Indeed, the IEA’s 2008 World Energy Outlook finds that convention-al oil production outside of OPEC has already peaked, and that the world will need to install an amount of production capacity equal to six times Saudi Arabia’s current capac-ity just to offset declines in existing fields and meet increased demand.22 “Peak oil” may be the most immedi-ate and dramatic concern, but the prospects of resource production peaks for other fossil fuels loom as well. A few analysts have even warned that the United States faces the pros-pect of “peak coal.”23 Indeed, in terms of energy value, America produced less coal in 2007 than it did in 1998.24 Further, America now imports more coal than ever before, and while the United States is still a net exporter, the difference between imports and exports has narrowed over time.25

12 The High Cost of Fossil Fuels
The point of this discussion is not to suggest that the EIA’s reference case forecast of America’s energy future is wrong—only time will tell. However, there are many foreseeable ways in which the optimistic vision of future fossil fuel supplies could go awry. And as Americans have learned, disruptions in the global energy economy can have huge impacts on consumers.
To account for uncertainty in future energy supplies and prices, the EIA also publishes a “high price” scenario, which partially accounts for the potential for higher fossil fuel prices in the years to come. According to the EIA’s Annual En-ergy Outlook, the high-price case “assumes not only that there will be a rebound in oil prices with the return of world economic growth but also that they will continue escalating rapidly as a result of long-term restrictions on conventional liquids production. The restrictions could arise from political decisions as well as resource limitations.”26
In this analysis, we use the EIA’s pro-jections of future fossil fuel prices and
consumption to estimate the future direct economic cost of fossil fuels, nationally and by state, between 2006 and 2030. We do so using two scenarios—the revised refer-ence case scenario published by the EIA in April 2009 and the “high price” scenario published prior to passage of the American Recovery and Reinvestment Act.
America’s Fossil Fuel Bill: At Least $23 Trillion Between 2010 and 2030According to the EIA’s reference case projections, American households, busi-nesses and utilities can expect to spend at least $23 trillion on fossil fuel purchases (in inflation-adjusted 2007 dollars) between 2010 and 2030. For the sake of comparison, the United States’ gross domestic product in 2007 was just below $14 trillion.27 Or, put another way, it would take the entire American workforce almost three years of 2007 income to pay a $23 trillion bill.28
America’s expenditures for fossil fuels spiked dramatically in 2007 and 2008, due largely to the run-up in world oil prices.
$2.0
$2.5
$1.5
$2.0
$2.5
ofdo
llars
$1.0
$1.5
$2.0
$2.5
Trillions
ofdo
llars
$0.0
$0.5
$1.0
$1.5
$2.0
$2.5
Trillions
ofdo
llars
$0.0
$0.5
$1.0
$1.5
$2.0
$2.5
Health care(2007)
Shelter(2007)
Fossil fuels(2008)
Education(2005)
Food(2007)
Military(2007)
Trillions
ofdo
llars
$0.0
$0.5
$1.0
$1.5
$2.0
$2.5
Health care(2007)
Shelter(2007)
Fossil fuels(2008)
Education(2005)
Food(2007)
Military(2007)
Trillions
ofdo
llars
$0.0
$0.5
$1.0
$1.5
$2.0
$2.5
Health care(2007)
Shelter(2007)
Fossil fuels(2008)
Education(2005)
Food(2007)
Military(2007)
Trillions
ofdo
llars
Figure 2. U.S. Annual Expenditure by Category29
America’s Current Energy Path 13
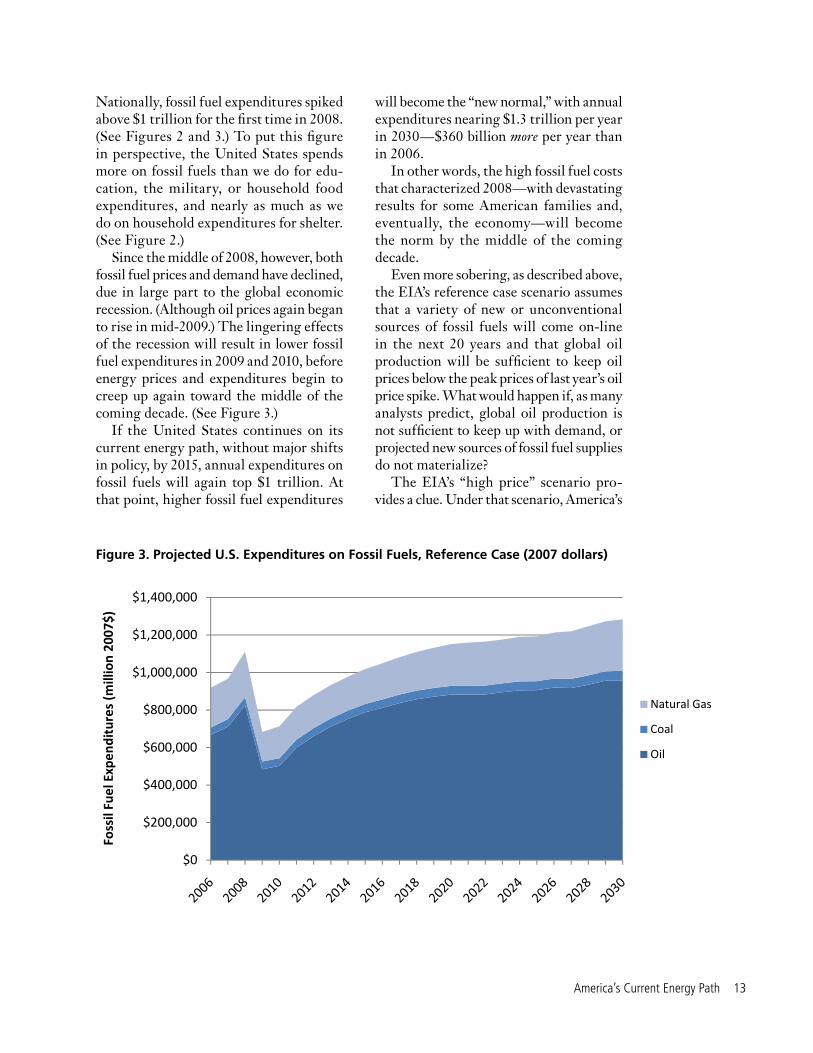
Nationally, fossil fuel expenditures spiked above $1 trillion for the first time in 2008. (See Figures 2 and 3.) To put this figure in perspective, the United States spends more on fossil fuels than we do for edu-cation, the military, or household food expenditures, and nearly as much as we do on household expenditures for shelter. (See Figure 2.)
Since the middle of 2008, however, both fossil fuel prices and demand have declined, due in large part to the global economic recession. (Although oil prices again began to rise in mid-2009.) The lingering effects of the recession will result in lower fossil fuel expenditures in 2009 and 2010, before energy prices and expenditures begin to creep up again toward the middle of the coming decade. (See Figure 3.)
If the United States continues on its current energy path, without major shifts in policy, by 2015, annual expenditures on fossil fuels will again top $1 trillion. At that point, higher fossil fuel expenditures
will become the “new normal,” with annual expenditures nearing $1.3 trillion per year in 2030—$360 billion more per year than in 2006.
In other words, the high fossil fuel costs that characterized 2008—with devastating results for some American families and, eventually, the economy—will become the norm by the middle of the coming decade.
Even more sobering, as described above, the EIA’s reference case scenario assumes that a variety of new or unconventional sources of fossil fuels will come on-line in the next 20 years and that global oil production will be sufficient to keep oil prices below the peak prices of last year’s oil price spike. What would happen if, as many analysts predict, global oil production is not sufficient to keep up with demand, or projected new sources of fossil fuel supplies do not materialize?
The EIA’s “high price” scenario pro-vides a clue. Under that scenario, America’s
$400,000
$600,000
$800,000
$1,000,000
$1,200,000
$1,400,000
uelExp
enditures(m
illion20
07$)
Natural Gas
Coal
Oil
$0
$200,000
$400,000
$600,000
$800,000
$1,000,000
$1,200,000
$1,400,000
FossilFu
elExpe
nditures
(million20
07$)
Natural Gas
Coal
Oil
Figure 3. Projected U.S. Expenditures on Fossil Fuels, Reference Case (2007 dollars)

1� The High Cost of Fossil Fuels
post-recession reprieve from higher energy expenditures will end much more quickly than under the reference case. The high price scenario suggests that U.S. fossil fuel expenditures will exceed $1 trillion again in 2011, rather than 2015 in the reference case. Moreover, energy expenditures would continue to increase dramatically over the course of the next decade. By 2020, Ameri-can households, businesses, power plants and industry would be spending more than $1.5 trillion per year on fossil fuels. And by 2030, the United States would be spending nearly $1.7 trillion annually—an 80 per-cent increase over the amount of money the nation spent on fossil fuels in 2006.
Under the high price case, the United States could be expected to spend more than $30 trillion on fossil fuels between 2010 and 2030. The additional $750 billion per year (compared to 2006 levels) that Americans would spend on fossil fuels in 2030 under the high-price case is money that would be diverted from other invest-
ments the nation might wish to make—in infrastructure, in health care, in education, or simply in increased consumer spending on goods and services. Moreover, much of that money—like much of the money we spend on fossil fuels today—would be sent overseas to pay for imported oil.
It is worth noting that even the EIA’s high price case may not be the worst-case scenario. While the high price case projects a dramatic increase in oil prices—to $200 a barrel in 2030—it projects only very mod-est increases in natural gas and coal prices. Between 2006 and 2030, under the high price case, residential prices for natural gas would increase by an average of only 0.4 percent per year (in inflation-adjusted terms), while the price electric power plants pay for coal would also increase by an aver-age of only 0.4 percent per year.30 Should natural gas or coal resources become more expensive to produce, or less readily avail-able, those projections could prove to be very optimistic.
$400 000
$600,000
$800,000
$1,000,000
$1,200,000
$1,400,000
$1,600,000
$1,800,000
uelExp
enditures(m
illion20
07$)
Natural Gas
Coal
Oil
$0
$200,000
$400,000
$600,000
$800,000
$1,000,000
$1,200,000
$1,400,000
$1,600,000
$1,800,000
FossilFu
elExpe
nditures
(million20
07$)
Natural Gas
Coal
Oil
Figure 4. Projected U.S. Expenditures on Fossil Fuels, High Price Case (2007 dollars)

America’s Current Energy Path 15
The Burden of Fossil Fuel Expenditures Varies by StateThe burden of fossil fuel costs is not evenly distributed across the United States. Some states are far more reliant on fossil fuels than others, suggesting that they may face greater risks from future fossil fuel cost increases.
There are several factors that determine a state’s exposure to fossil fuel costs:
• Energy-intensive industries – The two states with the highest fossil fuel expenditures per person—Wyoming and Louisiana—are sparsely populated states that rely heavily on resource extraction and energy-intensive indus-tries. Some energy-producing states might experience economic benefits from higher fossil fuel prices. But those industries that are large con-sumers of fossil fuels—whether they are steel mills or chemical plants—are likely to be hard hit by rising fuel bills.
• Climate – Fossil fuel expenditures are likely to be higher (all other things being equal) in parts of the country with high winter heating demand or extremely hot summer temperatures. Areas with a temperate year-round climate—such as much of Califor-nia—experience smaller residential fossil fuel demand.
• Transportation – Oil prices have been a big driver of higher fossil fuel bills in recent years. States where residents tend to drive less will tend to have lower overall expenditures for fossil fuels. The two places with the lowest expenditures for fossil fuels per person—the District of Columbia and New York—have a large proportion of residents living in dense urban areas with strong public transportation systems, and so need to purchase less gasoline.
• Electric power mix – States that re-ceive more of their power from renew-able energy sources and nuclear power are less reliant on coal, natural gas and oil for electricity, reducing their fossil fuel expenditures. In addition, states that have invested heavily in energy efficiency improvements—such as California—may also have lower expenditures for fossil fuels. Finally, fluctuations in the cost of various fos-sil fuels may affect states differently. Fossil fuel expenditures will tend to be greater for states that are heavily reli-ant on natural gas, for example, when natural gas prices are high.
In 2006, the states with the largest fossil fuel expenditures per capita were Wyo-ming and Louisiana. In Wyoming, roughly $9,000 was spent on fossil fuel purchases for every man, woman and child in the state. By contrast, the District of Columbia experienced the lowest per capita expen-ditures, followed by New York, Maryland and North Carolina.31
Unsurprisingly, future trends in fossil fuel prices and consumption will have different impacts in different states. Un-der the EIA’s reference case, fossil fuel expenditures per capita could be expected to increase by approximately $2,000 by 2030 in North Dakota, and by more than $1,000 in five states (Wyoming, Missis-sippi, Hawaii, South Dakota and Kansas). In percentage terms, North Dakota can expect an estimated 47 percent increase in fossil fuel expenditures per capita by 2030 under the reference case scenario, with similar large estimated increases in Hawaii (45 percent), Mississippi (41 percent), and Kansas (38 percent).
These large increases are mainly due to a combination of heavy dependence on fossil resources, increasing prices, and high per capita energy demand, although the reasons for the increases also vary by state. Hawaii, for example, is 90 percent

16 The High Cost of Fossil Fuels
dependent on oil for its energy produc-tion.32 Kansas, Mississippi and Wyoming consume among the highest amounts of energy per person in the nation.33
Under the high price case, the pattern of increases is similar, but much more dra-matic. Hawaii, for example, could expect its per-capita expenditures on fossil fuels to double, with similar large approximate increases in North Dakota (94 percent), Mississippi (82 percent) and Kansas (79 percent). It is important to reemphasize the fact that the EIA’s high price case projects only moderate price increases for coal and natural gas. Should that optimistic forecast prove to be incorrect, states that are more reliant on those fuels can expect much
greater increases in expenditures. (For a full listing of states’ projected expenditures on fossil fuels for the reference case, high price case, and by fuel type, please see Appendix A.)
Cumulatively, these fossil fuel expendi-tures will consume a large proportion of each state’s economic resources over the next two decades. Between 2010 and 2030, most states will spend several times the current total annual earnings of all their workers on fossil fuels. Wyoming, for ex-ample, would have to spend 100 percent of the annual earnings of its entire workforce for 7.5 years (at 2007 income levels) in order to pay for the fossil fuels it will consume from 2010 to 2030.
7
8
ngs
6
2010
2030
forceearnin
4
5
elspen
ding
statework f
3
edfossilfue
total2007
1
2
Projecte
inyearsof
0
Wyo
ming
Louisian
aMississippi
rthDakota
estV
irginia
Mon
tana
Texas
Oklah
oma
ewMexico
Maine
Kentucky
Arkan
sas
Alaba
ma
Iowa
uthDakota
Indian
aUtah
Idah
oArizona
Nevad
aHaw
aii
Kansas
Tenn
essee
hCa
rolin
aVermon
tNeb
raska
Florida
Ham
pshire
Missouri
Geo
rgia
Michigan
Ohio
Minne
sota
Wisconsin
hCa
rolin
ann
sylvan
iaOregon
Colorado
New
Jersey
odeIsland
Virginia
Illinois
Washington
Delaw
are
California
Marylan
don
necticut
sachusetts
New
York
fColum
bia
MNor
We ONe
Sou T
Sout
New
H M
Nort
Pen N
Rho
W CoMass
Dist.of
Figure 5. Years of Total 2007 State Workforce Earnings Necessary to Pay for Total Projected Fossil Fuel Use Between 2010 and 2030, by State, Reference Case34

America’s Current Energy Path 17
America Pays a Heavy Price in Environmental and Public Health Damage from Fossil FuelsBeyond the high prices that Americans pay at the gas pump or in home energy bills, the fossil fuels that we use gener-ate a large number of additional costs to society. These are costs that are not cur-rently borne by consumers of fossil fuels, but are rather a hidden tax that is imposed on the rest of society—and even on future generations—to subsidize fossil fuel consumption.
In recent years, economists and others have come to realize the scale and scope of these hidden costs of fossil fuel consump-tion—the severe impact that air pollution has on public health, the massive economic costs that loom from global warming, and the myriad of other costs, large and small, that make America’s dependence on fossil fuels increasingly intolerable.
Global WarmingFossil fuel consumption is the leading contributor to global warming. Global warming has the potential to impose vast and unpredictable impacts on our envi-ronment and our lives. A warmer planet means changing weather, melting ice and shifting ocean currents. These changes go on to cause tertiary impacts, such as altered water resources, agricultural production and fish stocks.
For the human economy, the impacts of global warming carry significant costs, including, in some cases, the cost of hu-man life. According to a British govern-ment review of the economics of global warming led by former World Bank Chief Economist Sir Nicholas Stern, a global temperature increase of 5 to 6 degrees Celsius—which, the review finds, is a “real possibility” within the next 100 years—
could result in the permanent loss of 5 to 11 percent of global GDP, and possibly up to 7 to 14 percent of GDP.35 If losses of 14 percent had occurred in 2007, for ex-ample, they would amount to a worldwide economic cost of more than $7 trillion.36 These costs arise from several impacts of global warming.
Rising Sea Level and Coastal StormsA 2008 report by the Natural Resources Defense Council (NRDC) projects that, if the world’s nations do not take action to reduce global warming pollution, sea level will have risen nearly two feet (23 inches) by 2050 and by close to four feet (45 inches) by 2100. Under that scenario, a combination of flooding and increased storm damage will cost the United States $360 billion per year by 2100.37 A 1991 assessment by the U.S. Environmental Protection Agency also placed the total, multi-year cost of one me-ter of sea-level rise at $270 to $475 billion, though the analysis did not consider the cost of sea level rise to future development, and assumed that the sea would rise much more slowly than it actually has during the intervening years.38
Storm surge during Hurricane Katrina. Flooding and storm damage due to global warming could cost the United States $360 billion per year by 2100. Photo: Don Mc-Closky under Creative Commons license from www.flickr.com

18 The High Cost of Fossil Fuels
In addition to the costs of flood damage, the cost of adapting to sea level rise will also be significant. The NRDC report esti-mated that homeowners and municipalities can expect to spend thousands of dollars on expenses to adapt their properties to a new, warmer world. The cost of elevating a 1,000 square-foot home two feet above its concrete slab, for example, would cost approximately $58,000. Building new seawalls and retrofitting old ones to hold back rising seas could cost $2 million to $20 million per mile of wall.39
Rising sea levels will also impact other kinds of buildings and public infrastruc-ture in difficult-to-quantify ways. In vulnerable low-elevation areas of Florida, for example, a sea level rise of two feet would put thousands of homes, businesses, schools, hospitals, power plants, airports, prisons, and historic landmarks at risk.40 By 2100, key pieces of infrastructure in the New York metropolitan area –including LaGuardia Airport, Newark Airport and the Holland Tunnel—could be flooded by 3 feet of water every five years, on average, as sea level rise magnifies the impacts of coastal storms.41
Warmer temperatures also alter weather patterns, causing an increase in the sever-ity of rain storms. The United States has already seen a 24 percent increase in the intensity of storms with extreme levels of rain or snow between 1948 and 2007.42 Intense precipitation can trigger flooding and erosion, resulting in expensive damage to property, crops and water quality.
The weather-related impacts of global warming extend well beyond extreme precipitation, however, and include, among others, stronger hurricanes and droughts. For example, global warming is likely to increase the intensity of hurricanes, and, according to the Stern Review, even a small increase in the intensity of hurricanes could double damage costs in the United States.43 The 2008 report by the Natural Resources Defense Council further found that under
business-as-usual conditions, high-inten-sity hurricanes fueled by a warming planet could cause as much as $422 billion in damage to Atlantic and Gulf Coast states between 2025 and 2100.44
In addition to costly storms, f lood-ing and droughts, the changing climate will impact many elements of life that Americans hold dear. Warmer winters and thinner snow and ice packs could shorten skiing, ice-fishing and snowmobiling sea-sons. Birders are likely to notice changes in the patterns of migratory birds; fishers and anglers could see a shift in the types of species and the health of the fish they catch. Warming may affect the timing and quality of fall foliage seasons, and native trees may no longer be able to survive in the same soil. Not only is global warming likely to threaten our health and endanger our property, but it also has the potential to radically change America’s landscapes and the ways we enjoy them.
Food ProductionA 2007 study by researchers at the Law-rence Livermore National Laboratory and the Carnegie Institution at Stanford University found that global production of wheat, maize and barley (three of the six largest global crops) experienced signifi-cant losses due to global warming between 1981 and 2002. The study concluded that global wheat growers, for example, lost $2.6 billion and global corn growers lost $1.2 billion in 2002.45
The U.S. Climate Change Science Program also conducted a study to exam-ine the 30-year impacts of an expected 60 parts-per-million rise in the concentration of carbon dioxide in the atmosphere and 1.2 degrees Celsius temperature increase. The study found that, under those condi-tions, corn production in the Midwest will decline 3 percent, and could decline in the South by as much or more.46 Today, a 3 percent loss in Midwest and Southern corn production would cost the 10 most

America’s Current Energy Path 19
vulnerable states in those regions an aver-age of $116 million each year.47
However, grain crops are just a few among the many types of agricultural products that could suffer lower yields as our climate changes. Hotter temperatures and more variable precipitation also impact the productivity of plants and livestock.48 Dairy cows subject to temperatures higher than 77 degrees Fahrenheit, for example, need to use energy to cool themselves, and their milk production declines up to 20 to 30 percent at temperatures of 90 de-grees Fahrenheit and above.49 Heat stress is already a significant issue for livestock farmers across the country; one study estimated the impact of heat stress to the U.S. livestock industry at $2.4 billion in losses each year.50
Warmer temperatures can also lead to growing insect populations: the U.S. Climate Change Science Program study explains that farms in warmer climates (like Florida) already must spend more money on applying more pesticides to their crops than similar farms in cooler regions (like Maryland or New York).51 Another study conducted by researchers at Ithaca College
and the University of Illinois – Urbana observed that early-season soybean crops grown under highly elevated carbon di-oxide conditions can have over 50 percent more insect damage than a control group, a finding that hints that carbon dioxide pollution could lead to increased crop damage from pests.52 Further, as more of our precipitation comes in heavy bursts, farmers may also have to confront the double challenge of more flooding and more drought.53
Public HealthThe altered ecosystems and weather pat-terns of a warmer planet will have profound impacts on human health. In the United States, heat waves will cause increasing numbers of heat-related deaths and ill-nesses. In 1995, for example, heat waves from St. Louis to Chicago and Milwaukee caused more than 550 deaths.54 Weather events such as hurricanes, f loods and droughts could injure or kill growing num-bers of people as their severity increases.55 Hurricane Katrina, for instance, which struck the Gulf Coast in 2005 as a category 3 storm, killed 1,464 people in Louisiana and a total of 346 people in other states.56
Corn growers in the 10 most vulnerable Mid-west and Southern states could lose more than $116 million per year at current price and production levels with even relatively small increases in temperature and atmospheric carbon dioxide levels. Photo: Manoel Silva, from www.sxc.hu
The Los Angeles skyline obscured by smog. Around the country, smog-forming pollution leads to thousands of deaths each year. Photo: Ben Amstutz, under Creative Commons license from www.flickr.com

20 The High Cost of Fossil Fuels
The proliferation of certain vector-borne diseases is also likely to grow. In the U.S., West Nile Virus has thrived in warmer temperatures, killing a total of 580 North Americans during the particularly warm years of 2002 and 2003.57 As warmer year-round temperatures help spawn a larger population of the mosquitoes, which spread the disease, the virus could further expand its range.
Warmer temperatures would also exac-erbate smog, which already reduces lung function, aggravates asthma, causes lung damage in thousands of Americans, and contributes to early death. A 2004 study by the Yale School of Forestry and Envi-ronmental Studies found that increasing the presence of smog-forming ozone by 10 parts per billion would lead to 319 deaths annually in New York City, and 3,767 deaths in other urban areas around the country.58
These combined threats are significant, and are severe enough to have prompted the U.S. Environmental Protect ion Agency to take initial steps to label global warming pollution a threat to public health and regulate global warming pollution under the Clean Air Act.59
Flooding and DroughtThe more intense rainstorms that will result from global warming mean more flooding, which can inflict massive dam-age on the economy. From April through October 1993, for example, widespread flooding along the Mississippi and Mis-souri rivers and their tributaries caused as much as $15 billion in damage across the Midwest.60 In January 1997, a series of ma-jor storms dropped up to 30 inches of rain on California, on top of one of the wettest Decembers on record. More than 23,000 structures were damaged by the flooding, which covered 300 square miles, causing more than $2 billion in damage.61
Though precipitation will be more intense, scientists also predict that these
storms will be interspersed with periods of dryness, elevating the risk of drought. Overall, the science indicates that the num-ber of dry days across the United States and most of the world will increase because of global warming, such that the percent of land enduring severe drought globally could rise to 30 percent by the end of the century compared with 1 percent today. Areas projected to receive less total pre-cipitation, such as the southwestern United States, will be particularly vulnerable.
The effect is also likely to be more pronounced in the summers, which likely will become drier in temperate regions of North America as a result of global warming.61 Farms producing agricultural crops and livestock will be vulnerable to reduced productivity. In certain areas of the country, such as the Southwest and interior West, declining rainfalls and rising temperatures will combine to cause severe and extended drought conditions.63
Air PollutionFossil fuels cause much of the United States’ air pollution. Emissions from vehicles, coal power plants, and burning natural gas, for example, contribute to global warming, pollute the air with soot, create smog, reduce visibility, and cause acid rain.
Air pollution is so pervasive and so damaging to health, property and the envi-ronment that it imposes large costs on our economy. One study estimated that air pol-lution from sources regulated by the clean Air Act cost the American economy $9 tril-lion between 1970 and 2000, including the cost of mortalities due to air pollution.64 Similarly, a 2008 government assessment found that clean air regulations by the En-vironmental Protection Agency produced air quality benefits worth between $79 and $570 million (in 2001 dollars) between 1997 and 2007.65 In both studies, much of the regulated air pollution is attributable to fossil fuel use.

America’s Current Energy Path 21
Oil Spills and Other Fossil Fuel-Related DisastersThe production and transportation of fossil fuels poses severe hazards to the environ-ment, wildlife and human health. Accidents can be extremely damaging, and leave scars on the environment and communities that last for generations.
A 2007 Government Accountability Of-fice report found that 51 large oil spills in the United States between 1990 and 2006 incurred between $860 million and $1.1 billion in removal costs and compensation for damages. This figure does not include damages from hundreds of smaller spills over that same period of time.66 It also does not include damages from the 1989 Exxon Valdez oil spill in Prince William Sound, which cost Exxon at least $1 billion in damages. More than $2 billion has addi-tionally been spent in cleanup and recovery on that accident alone.67 In addition, many communities along the Sound lost much of their livelihood when oil-contaminated waters harmed local fishing stocks.
Oil isn’t the only fossil fuel with the po-tential for major accidents. Many coal-fired power plants, for example, store captured fly ash—which contains toxic substances such as arsenic and heavy metals—in wa-ter-filled ponds near rivers or lakes. These ponds can leach contaminated water into groundwater supplies on a routine basis, but they are also vulnerable to catastrophic collapse. In December 2008, a coal ash storage pond at a Tennessee Valley Au-thority power plant broke, flooding 300 acres with sludge. Cleanup of the spill was expected to cost as much as $825 million, and that does not even begin to count the costs to local residents and the local envi-ronment.68
Major disasters may draw headlines, but fossil fuel production also creates many “routine” impacts on the environ-ment. Coal, for example, leaves a mark on the landscape wherever it is mined. Mountaintop coal mining in places like
West Virginia denudes forests, flattens mountain peaks, and sometimes dumps the toxic remainder into nearby valleys, contaminating streams.69 Acidic drainage from abandoned underground coal mine shafts threatens groundwater quality in many states, including parts of Kentucky, Maryland, Ohio, Pennsylvania, Virginia and West Virginia.70
Gasoline and other petroleum-based products also threaten the environment, not only where oil is drilled, but also where it is stored. Leakage of the gasoline additive methyl tert-butyl ether (MBTE) from un-derground storage tanks into groundwater supplies created massive public outcry in the late 1990s, and continues to contami-nate water across the country.
Recent attempts to extract other kinds of fossil fuels are putting health and safety at risk as well. In states like Colorado and Pennsylvania, natural gas companies are blasting a mix of water, sand and chemicals deep into underground shale deposits in order to break up the shale and draw out natural gas. But the process is dangerous: at least one home in Pennsylvania exploded when gases released by the blasting accu-mulated in its basement, and the blasting
Crews work to clean up a section of the hundreds of miles of coastline contaminated during the 1989 Exxon Valdez oil spill. The disaster cost more than $2 billion in cleanup and recovery expenses, and at least $1 billion in damages.Photo: Jim Brickett, under Creative Com-mons license from www.flickr.com

22 The High Cost of Fossil Fuels
chemical, benzene, which has been linked to anemia and leukemia, has contaminated streams and wells through surface spills and underground use.71
The side-effects of coal, gasoline and nat-
ural gas, in other words, affect Americans almost daily. Not only does the production and use of fossil fuels alter the landscapes of local communities, but once created, the problems are expensive to correct.
National Security and the Cost of Fossil Fuels
America’s dependence on fossil fuels, particularly oil, also threatens our national security.
For decades, many of the United States’ strategic decisions have been motivated, at least in part, by the need to protect access to energy for ourselves and our allies. A May 2009 report by the Center for Naval Analyses, co-authored by 12 retired generals and admirals of the U.S. military, finds that our dependence on fossil fuels undermines U.S. foreign policy, involves us with volatile and unfriendly powers, endangers troops in combat, undercuts our economic stability, and drives climate changes which threaten to destabilize countries and add to an already heavy Ameri-can military burden.72
Our fossil fuel dependence also places a large financial strain directly on the military’s budget: spending on energy-related programs increased from $10.9 billion in 2005 to $13 billion in 2007.73 And, like consumers, the military’s energy spend-ing is susceptible to the jumps and dives of the energy market. An increase in the price of oil of just $10 per barrel, for example, increases Air Force spending by $600 million annually.74
Further, of all the oil consumed in the world, the United States uses 25 percent, and produces just 3 percent.75 The oil that we buy abroad funnels billions of dollars a year out of our domestic economy, and large portions of that money are paid to state-run oil companies in places like Venezuela and Saudi Arabia, whose values and interests do not always align with those of the United States. In 2007, 10 percent of U.S. crude oil imports came from Venezuela (roughly 60 percent of all Venezuelan oil sales), and 12 percent of U.S. crude oil imports came from Saudi Arabia.76

Clean Energy: A Better Choice for Our Future 23
America’s dependence on fossil fuels is costly. But what about the alterna-tive? Wouldn’t a transition to a clean
energy future also be expensive? Make no mistake, America must make
large investments in energy efficiency, renewable energy, clean transportation technology and other clean energy strate-gies if we are going to wean ourselves off of fossil fuels and do our share to curtail global warming. But there is a key differ-ence between spending on clean energy and spending on fossil fuels. When we adopt clean energy technologies—wind turbines, solar panels, energy-efficient buildings and the like—we are making investments. Those investments pay themselves off over time in the form of lower expenditures for fossil fuels and smaller impacts on the environ-ment and public health. By contrast, the money we spend on fossil fuels contributes to the depletion of a precious and finite resource and often makes its way out of the American economy.
Many clean energy investments make sense in strictly economic terms. And many others make good sense when the environment and public health are brought into the picture.
Clean Energy Investments Can Save Money A variety of economic analyses have shown that many clean energy strategies are eco-nomic winners on their own terms—even excluding the benefits for the environment, public health, and America’s security.
• A 2007 analysis by McKinsey & Com-pany estimated that the United States could generate approximately 1.2 billion metric tons of carbon dioxide emission reductions per year (equal to about 20 percent of today’s emissions) at negative marginal cost. In other words, these are investments that will yield a positive return in strictly economic terms over the lifetime of the investment. Energy efficiency im-provements to homes, businesses, ap-pliances, factories and cars are among the steps that can generate positive returns on investment.77
• A recent Energy Information Admin-istration (EIA) analysis of the Ameri-can Recovery and Reinvestment Act (ARRA) found that the act’s provisions
Clean Energy: A Better Choice for Our Future

2� The High Cost of Fossil Fuels
for residential and commercial energy efficiency improvements will yield significant savings. The EIA projects that the law will reduce residential and commercial energy bills by $13 billion in 2020 and $21 billion in 2030.78
• An analysis by the Union of Con-cerned Scientists estimated that the recent move by President Obama to increase federal vehicle fuel economy standards to 35 miles per gallon by 2016 will deliver $20 billion in net sav-ings to consumers in 2020 at gasoline prices of $2.25 per gallon. If gasoline prices hit $4 per gallon, the net ben-efits would balloon to $70 billion.79
• Further analysis by the Union of Concerned Scientists (UCS) shows that transitioning to a clean energy economy could cut global warming emissions while saving consumers and
businesses $465 billion each year by 2030, with $1.7 trillion in net cumula-tive savings between 2010 and 2030.80 The UCS “blueprint” for a clean energy economy includes an economy-wide global warming cap-and-trade program, investments and advances in energy efficiency for buildings across the country, increased use of renewable electricity sources such as wind and solar, and transportation policies to shift away from fossil fuels with smart growth and modern public transportation.
• The Energy Information Administra-tion estimated in 2009 that a proposed federal law that would require 21 percent of the nation’s electricity to come from renewable energy sources such as solar and wind power would have virtually no impact on average electricity prices, while cutting global warming pollution from power plants by up to 12 percent below projected levels by 2030. The maximum im-pact on national average electricity prices is 3 percent in the mid-2020s, an increase of three-tenths of a penny per kilowatt-hour—a very small price to pay for a policy that would reduce dependence on fossil fuels and dra-matically curb pollution.81
• Many forms of renewable energy are affordable today and others will be-come affordable soon with anticipated technological advances and higher-volume production. For example, some analysts predict that the cost of solar photovoltaic systems is poised for a rapid decline, thanks in large part to the success of government incentive programs in Europe and parts of the United States in spurring the construction of new production capacity. Solar market experts at the Prometheus Institute project that
Wind turbines in Butler County, Kansas. An analysis by the Union of Concerned Scientists shows that transitioning to a clean energy economy could cut global warming emissions while saving consumers and businesses $465 billion each year by 2030, with $1.7 trillion in net cumulative savings between 2010 and 2030. Photo: Brent Danley, under Creative Commons license from www.flickr.com

Clean Energy: A Better Choice for Our Future 25
the cost of solar panels will be cut in half between now and 2015 and that solar power will become cheaper than power from the electric grid in some areas.82 Similarly, recent work by Synapse Energy Economics has docu-mented that utility energy efficiency programs that deliver more energy efficiency do so at a lower cost—con-founding the traditional thinking that energy efficiency becomes more expensive as the “low-hanging fruit” is picked.83
In addition to providing a direct return on investment, clean energy investments create jobs here in the United States. Clean energy projects tend to be labor intensive—by one count wind energy produces three times as many jobs as coal.84 In addition, many clean energy jobs—from the instal-lation of energy efficient features in homes to the construction of wind turbines—are local and can never be outsourced.
Clean Energy Benefits the Environment America has access to a broad and deep resource of clean energy improvements that deliver real economic savings to con-sumers. But, as noted above, the dollars-and-cents cost of fossil fuels to consumers is only one measure of their cost to society as a whole. Health threatening pollution, destruction of ecosystems, and global warming are among the other impacts of fossil fuel consumption—impacts with major economic costs.
Whatever the cost of addressing global warming, the cost of inaction is likely to be far greater. The British government’s 2006 Stern Review of the economics of climate change found that the economic impacts of global warming far outweighed the cost of
reducing emissions of global warming pol-lutants.85 The study found that stabilizing the levels of carbon in our atmosphere at 550 parts per million will cost 1 percent of global GDP by 2050, while inaction could cause global per-person consumption to drop by as much as 20 percent.86
Shifting away from fossil fuels and toward cleaner sources of energy will re-lieve America’s economy from many other economic burdens, including:
• Reduced expenditures on health care and reductions in early mortality, absenteeism and lost productivity caused by air pollution. A 2001 study by Resources for the Future estimated that a tax of $25 per ton on carbon dioxide emissions would yield $12-14 per ton worth of benefits in avoided health impacts and avoided need for investment in air pollution controls—without even beginning to tally the benefits in avoided impacts of global warming.87
• Improved water quality resulting from reduced risk of runoff from coal mines, methane contamination of groundwater due to natural gas hydraulic fracturing operations, and leakage from coal ash storage ponds into groundwater supplies and water-ways.
• Reduced pressure on water supplies—particularly if steam generators, which consume vast quantities of water, are replaced by renewable energy sources that use little or no water, such as wind power and solar photovoltaics.
• Reduced risk of catastrophic spills and accidents, including oil spills and the failure of coal ash storage ponds.
The exact value of these benefits of clean energy investments is difficult to quantify.

26 The High Cost of Fossil Fuels
But it is clear that investments in clean energy that do not provide a return on investment to individual consumers often provide a return on investment to society when environmental, public health and other co-benefits are included.
Making it Happen: Policy RecommendationsAmerica has a golden opportunity to break our dependence on fossil fuels and chart a new path toward a clean energy future. The Obama administration has gotten off to a fast start in its opening months. The American Recovery and Reinvestment Act—also known as the economic recov-ery bill—included advances on a variety of fronts, including increased funding for clean energy research and development, a large investment in weatherization as-sistance for low-income homeowners, energy efficiency assistance for state and local governments, and investments in clean transportation infrastructure, in-cluding high-speed rail. More recently, the administration announced its intention to increase fuel economy standards for ve-hicles to 35.5 miles per gallon by 2016—a move that will save almost as much oil as we currently import from Saudi Arabia.88
There is still much more that needs to be done, however. The federal government, along with the states, should take actions that would:
• Reduce the nation’s emissions of global warming pollutants deeply enough to prevent dangerous impacts from global warming, guided by the latest scientific understanding. The United States should adopt an emis-sions cap and other policies that will
reduce global warming pollution by 35 percent below 2005 levels by 2020 and by 80 percent below 2005 levels by 2050, and implement strict rules for carbon “offsets” to ensure that efforts to reduce emissions are successful.
• Ensure that a cap-and-trade program used to achieve those targets directs the revenues gained through the sale of allowances for public purposes. One hundred percent of emission allow-ances should be auctioned, with the revenues used for investments in clean energy and to benefit consumers.
• Ensure that America generates at least 25 percent of its electricity from renewable sources of energy such as wind and solar power by 2025.
• Strengthen energy efficiency stan-dards and codes for appliances and buildings, with the goal of reducing energy consumption in new buildings by 50 percent by 2020 and ensuring that all new buildings use zero net energy by 2030.
• Promote the development and imple-mentation of clean transportation in-frastructure, including improving the fuel economy of light- and heavy-duty vehicles, reducing the carbon intensity of transportation fuels, and promoting plug-in vehicles, public transportation and high-speed intercity rail.
• Ramp up investment in solar power through tax credits, specific targets in state renewable electricity standards, requirements for “solar ready homes,” rebate programs, and other measures.
• End subsidies to fossil fuel industries.

Appendix A 27Appendix A 27
Appendix A. TablesTable 1-A. Fossil Fuel Expenditures Per Capita, Reference Case (2007 dollars)
State 2006 2010 2020 2030 $ Increase % increase 2006-2030 2006-2030
Alabama $3,5�7 $2,797 $�,213 $�,525 $978 28%Arizona $2,�99 $1,978 $2,901 $3,025 $527 21%Arkansas $3,172 $2,387 $3,656 $3,681 $509 16%California $2,�76 $1,763 $2,625 $2,730 $25� 10%Colorado $3,056 $2,329 $3,3�3 $3,398 $3�2 11%Connecticut $2,839 $2,198 $3,15� $3,273 $�3� 15%Delaware $2,832 $2,15� $3,0�6 $2,886 $53 2%Dist. of Columbia $1,505 $1,196 $1,5�2 $1,500 ($5) 0%Florida $2,�76 $1,767 $2,696 $2,6�0 $16� 7%Georgia $2,915 $2,203 $3,19� $3,109 $19� 7%Hawaii $3,�50 $2,502 $�,571 $5,017 $1,567 �5%Idaho $2,68� $2,000 $3,081 $3,105 $�21 16%Illinois $2,737 $2,167 $3,131 $3,367 $630 23%Indiana $3,608 $2,752 $3,998 $�,30� $696 19%Iowa $3,562 $2,867 $�,360 $�,562 $999 28%Kansas $3,177 $2,623 $�,053 $�,396 $1,219 38%Kentucky $3,58� $2,798 $�,310 $�,�16 $832 23%Louisiana $6,602 $�,555 $7,197 $7,2�0 $639 10%Maine $3,608 $2,760 $�,223 $�,39� $785 22%Maryland $2,�6� $1,888 $2,67� $2,569 $105 �%Massachusetts $2,750 $2,1�2 $3,033 $3,180 $�30 16%Michigan $2,782 $2,23� $3,059 $3,265 $�82 17%Minnesota $3,057 $2,�26 $3,635 $3,8�9 $792 26%Mississippi $3,762 $2,9�6 $�,709 $5,292 $1,531 �1%Missouri $2,896 $2,275 $3,382 $3,531 $635 22%Montana $�,262 $3,191 $�,89� $�,963 $702 16%Nebraska $3,276 $2,588 $3,995 $�,269 $993 30%Nevada $3,1�7 $2,�58 $3,51� $3,7�9 $602 19%New Hampshire $3,118 $2,�2� $3,��9 $3,560 $��2 1�%New Jersey $3,15� $2,381 $3,61� $3,89� $7�0 23%New Mexico $3,868 $2,938 $�,378 $�,5�7 $679 18%New York $2,166 $1,685 $2,�32 $2,612 $��5 21%North Carolina $2,�69 $1,888 $2,698 $2,587 $117 5%North Dakota $5,060 $�,201 $6,836 $7,�23 $2,362 �7%Ohio $2,898 $2,273 $3,290 $3,522 $625 22%Oklahoma $�,355 $3,196 $�,868 $5,031 $676 16%Oregon $2,5�0 $1,821 $2,712 $2,85� $313 12%Pennsylvania $2,9�0 $2,23� $3,297 $3,515 $575 20%Rhode Island $2,569 $2,012 $2,768 $2,923 $35� 1�%South Carolina $2,951 $2,222 $3,215 $3,089 $1�7 5%South Dakota $3,201 $2,�88 $3,969 $�,230 $1,029 32%Tennessee $2,900 $2,266 $3,567 $3,638 $738 25%Texas $�,862 $3,368 $5,113 $5,013 $151 3%Utah $3,180 $2,��1 $3,633 $3,7�1 $561 18%Vermont $3,037 $2,3�9 $3,558 $3,630 $593 20%Virginia $2,931 $2,161 $3,229 $3,166 $235 8%Washington $2,538 $1,819 $2,78� $2,926 $388 15%West Virginia $�,�5� $3,599 $�,765 $�,670 $216 5%Wisconsin $2,778 $2,191 $3,121 $3,335 $557 20%Wyoming $9,0�2 $6,728 $10,365 $10,757 $1,715 19%United States $3,083 $2,309 $3,�30 $3,531 $��8 15%

28 The High Cost of Fossil Fuels
Table 1-B. Fossil Fuel Expenditures Per Capita*, High Price Case (2007 dollars)*See Methodology note on 2006 figures
State 2006 2010 2020 2030 $ Increase % increase 2006-2030 2006-2030
Alabama $3,5�8 $3,892 $5,2�6 $5,801 $2,253 63% Arizona $2,500 $2,795 $3,688 $3,7�� $1,2�5 50% Arkansas $3,173 $3,367 $�,607 $�,838 $1,665 52% California $2,�77 $2,500 $3,397 $3,�56 $980 �0% Colorado $3,057 $3,230 $�,187 $�,231 $1,17� 38% Connecticut $2,8�0 $3,029 $�,088 $�,207 $1,367 �8% Delaware $2,832 $2,963 $3,760 $3,653 $821 29% Dist. of Columbia $1,506 $1,�98 $1,77� $1,757 $251 17% Florida $2,�76 $2,55� $3,�09 $3,�10 $933 38% Georgia $2,916 $3,031 $3,95� $3,996 $1,080 37% Hawaii $3,�50 $3,9�� $6,52� $7,113 $3,663 106% Idaho $2,685 $2,829 $3,899 $3,938 $1,253 �7% Illinois $2,737 $2,902 $3,980 $�,361 $1,62� 59% Indiana $3,609 $3,70� $5,107 $5,620 $2,011 56% Iowa $3,56� $3,922 $5,660 $6,035 $2,�72 69% Kansas $3,180 $3,535 $5,179 $5,693 $2,513 79% Kentucky $3,58� $3,871 $5,393 $5,888 $2,30� 6�% Louisiana $6,607 $6,767 $9,391 $9,890 $3,283 50% Maine $3,609 $3,953 $5,677 $5,865 $2,256 63% Maryland $2,�6� $2,569 $3,269 $3,237 $773 31% Massachusetts $2,750 $2,932 $3,921 $�,056 $1,306 �7% Michigan $2,78� $2,931 $3,811 $�,118 $1,33� �8% Minnesota $3,058 $3,303 $�,692 $5,007 $1,9�9 6�% Mississippi $3,76� $�,190 $6,005 $6,8�6 $3,081 82% Missouri $2,897 $3,115 $�,386 $�,633 $1,736 60% Montana $�,266 $�,�35 $6,208 $6,��8 $2,183 51% Nebraska $3,278 $3,5�5 $5,205 $5,663 $2,385 73% Nevada $3,1�7 $3,�87 $�,576 $�,693 $1,5�5 �9% New Hampshire $3,118 $3,350 $�,�91 $�,530 $1,�13 �5% New Jersey $3,15� $3,295 $�,595 $5,032 $1,878 60% New Mexico $3,871 $�,055 $5,�88 $5,765 $1,89� �9% New York $2,167 $2,259 $3,023 $3,287 $1,120 52% North Carolina $2,�70 $2,588 $3,322 $3,300 $830 3�% North Dakota $5,068 $5,681 $8,730 $9,817 $�,7�9 9�% Ohio $2,898 $3,055 $�,193 $�,576 $1,678 58% Oklahoma $�,360 $�,�93 $6,163 $6,625 $2,266 52% Oregon $2,5�2 $2,550 $3,509 $3,6�1 $1,099 �3% Pennsylvania $2,9�1 $3,013 $�,110 $�,519 $1,578 5�% Rhode Island $2,569 $2,728 $3,5�7 $3,659 $1,090 �2% South Carolina $2,951 $3,07� $3,956 $3,956 $1,00� 3�% South Dakota $3,203 $3,�65 $5,213 $5,675 $2,�71 77% Tennessee $2,900 $3,195 $�,�81 $�,833 $1,933 67% Texas $�,86� $�,973 $6,861 $6,981 $2,117 ��% Utah $3,181 $3,375 $�,588 $�,772 $1,590 50% Vermont $3,037 $3,303 $�,677 $�,780 $1,7�� 57% Virginia $2,931 $3,036 $�,068 $�,12� $1,193 �1% Washington $2,538 $2,573 $3,631 $3,77� $1,236 �9% West Virginia $�,�62 $�,557 $5,635 $5,767 $1,305 29% Wisconsin $2,778 $2,938 $3,972 $�,311 $1,533 55% Wyoming $9,050 $9,1�0 $13,026 $1�,2�6 $5,196 57% United States $3,085 $3,219 $�,388 $�,600 $1,516 �9%

Appendix A 29
Table 2-A. Fossil Fuel Expenditures by Fuel Type, Reference Case (millions of 2007 dollars) 2006 2030
State Coal Nat. gas Oil Total Coal Nat. gas Oil Total
Alabama $1,672 $3,793 $10,68� $16,287 $2,007 $5,75� $1�,293 $22,05� Arizona $579 $2,893 $11,933 $15,�05 $1,056 $7,1�9 $2�,201 $32,�07 Arkansas $355 $2,077 $6,�77 $8,909 $5�5 $2,597 $8,786 $11,927 California $159 $19,919 $69,685 $89,763 $218 $22,372 $10�,207 $126,796 Colorado $522 $�,371 $9,673 $1�,566 $672 $5,21� $13,798 $19,68� Connecitcut $1�5 $2,116 $7,66� $9,925 $1�� $2,��5 $9,�83 $12,072 Delaware $1�3 $51� $1,758 $2,�15 $1�3 $�96 $2,283 $2,922 Dist. of Columbia $0 $��9 $�32 $881 $0 $317 $333 $650 Florida $1,761 $8,217 $3�,729 $��,707 $2,3�9 $10,5�8 $62,836 $75,733 Georgia $2,261 $5,050 $19,926 $27,236 $2,�37 $5,�7� $29,�55 $37,366 Hawaii $35 $2 $�,37� $�,�11 $51 $2 $7,302 $7,355 Idaho $15 $80� $3,109 $3,929 $15 $1,283 $�,816 $6,115 Illinois $1,668 $9,703 $23,535 $3�,968 $2,169 $11,301 $31,755 $�5,226 Indiana $2,316 $�,953 $1�,7�3 $22,7�1 $3,076 $6,036 $20,199 $29,312 Iowa $2,0�6 $�83 $8,060 $10,589 $695 $3,061 $9,72� $13,�81 Kansas $399 $2,555 $5,801 $8,75� $6�2 $�,686 $7,597 $12,92� Kentucky $1,9�6 $2,�08 $10,622 $15,068 $2,�10 $2,886 $1�,820 $20,116 Louisiana $36� $9,981 $17,667 $28,012 $556 $11,315 $22,902 $3�,773 Maine $23 $�73 $�,2�9 $�,7�5 $22 $558 $5,620 $6,200 Maryland $828 $2,612 $10,361 $13,802 $85� $2,975 $1�,212 $18,0�1 Massachusetts $357 $�,��7 $12,890 $17,69� $366 $�,985 $16,9�5 $22,296 Michigan $1,188 $8,711 $18,082 $28,109 $1,565 $11,113 $22,235 $3�,913 Minnesota $�09 $3,7�� $11,605 $15,757 $7�3 $6,�60 $17,068 $2�,271 Mississippi $369 $2,956 $7,580 $10,905 $�55 $5,3�8 $10,56� $16,367 Missouri $905 $2,612 $13,392 $16,909 $1,�97 $3,�76 $17,732 $22,705 Montana $253 $781 $3,000 $�,035 $298 $1,010 $3,879 $5,186 Nebraska $250 $1,303 $�,279 $5,779 $387 $1,826 $5,558 $7,771 Nevada $11� $2,076 $5,65� $7,8�� $20� $�,198 $11,65� $16,056 New Hampshire $1�2 $6�� $3,30� $�,090 $168 $829 $�,86� $5,862 New Jersey $216 $6,972 $20,1�5 $27,33� $271 $8,708 $29,19� $38,173 New Mexico $�18 $2,111 $�,983 $7,512 $�81 $2,691 $6,376 $9,5�8 New York $�69 $13,266 $28,017 $�1,77� $517 $15,309 $35,0�9 $50,875 North Carolina $1,961 $2,806 $17,136 $21,903 $2,269 $3,365 $25,995 $31,628 North Dakota $�76 $5�9 $2,201 $3,226 $637 $1,186 $2,680 $�,502 Ohio $2,193 $8,137 $22,661 $33,217 $2,775 $9,192 $28,716 $�0,683 Oklahoma $532 $5,309 $9,739 $15,580 $773 $6,�6� $12,�50 $19,687 Oregon $51 $1,975 $7,350 $9,377 $85 $2,�81 $11,227 $13,79� Pennsylvania $2,�61 $8,�05 $2�,987 $36,�65 $2,790 $10,085 $32,007 $��,882 Rhode Island $0 $892 $1,835 $2,728 $0 $1,035 $2,33� $3,370 South Carolina $1,099 $1,929 $9,750 $12,778 $1,078 $1,869 $13,003 $15,950 South Dakota $�� $�37 $2,0�3 $2,52� $66 $75� $2,566 $3,386 Tennessee $1,381 $2,735 $13,�99 $17,615 $1,826 $3,761 $21,260 $26,8�7 Texas $2,232 $26,589 $8�,99� $113,815 $�,208 $37,�12 $125,�03 $167,022 Utah $513 $1,995 $5,695 $8,203 $726 $2,978 $9,335 $13,039 Vermont $0 $118 $1,767 $1,885 $0 $13� $2,�50 $2,58� Virginia $1,0�6 $3,�73 $17,780 $22,393 $1,090 $3,931 $26,083 $31,10� Washington $130 $2,5�2 $13,505 $16,177 $230 $3,336 $21,667 $25,233 West Virginia $2,3�6 $1,681 $3,932 $8,055 $1,881 $1,876 $�,275 $8,032 Wisconsin $757 $3,870 $10,853 $15,�80 $1,029 $�,883 $1�,601 $20,513 Wyoming $66� $1,102 $2,871 $�,636 $702 $1,37� $3,550 $5,626 United States $38,661 $212,621 $667,735 $921,209 $50,913 $27�,256 $958,803 $1,283,972

30 The High Cost of Fossil Fuels
Table 2-B. Fossil Fuel Expenditures by Fuel Type, High Price Case (millions of 2007 dollars)
2006 2030
State Coal Nat. gas Oil Total Coal Nat. gas Oil Total
Alabama $1,672 $3,793 $10,68� $16,287 $2,�38 $6,389 $19,��7 $28,27� Arizona $579 $2,900 $11,933 $15,�12 $1,215 $8,360 $30,535 $�0,110 Arkansas $355 $2,082 $6,�77 $8,915 $605 $2,986 $12,087 $15,678 California $159 $19,932 $69,685 $89,776 $228 $26,061 $13�,2�6 $160,536 Colorado $522 $�,375 $9,673 $1�,570 $77� $5,93� $17,799 $2�,507 Connecitcut $1�5 $2,117 $7,66� $9,926 $132 $2,723 $12,662 $15,517 Delaware $1�3 $51� $1,758 $2,�15 $1�2 $531 $3,026 $3,699 Dist. of Columbia $0 $�50 $�32 $881 $0 $338 $�2� $761 Florida $1,761 $8,226 $3�,729 $��,715 $2,336 $10,583 $8�,885 $97,80� Georgia $2,260 $5,055 $19,926 $27,2�0 $2,�25 $5,951 $39,6�9 $�8,025 Hawaii $35 $2 $�,37� $�,�11 $53 $2 $10,373 $10,�28 Idaho $15 $806 $3,109 $3,931 $16 $1,�98 $6,2�3 $7,757 Illinois $1,669 $9,709 $23,535 $3�,975 $2,325 $12,676 $�3,582 $58,582 Indiana $2,318 $�,958 $1�,7�3 $22,7�6 $3,297 $7,062 $27,917 $38,276 Iowa $�83 $2,050 $8,060 $10,593 $75� $3,521 $13,561 $17,835 Kansas $399 $2,56� $5,801 $8,763 $691 $5,521 $10,526 $16,739 Kentucky $1,9�6 $2,�11 $10,622 $15,071 $2,933 $3,319 $20,570 $26,821 Louisiana $36� $10,005 $17,667 $28,036 $616 $13,�13 $33,�70 $�7,�99 Maine $23 $�73 $�,2�9 $�,7�5 $22 $610 $7,6�� $8,276 Maryland $828 $2,61� $10,361 $13,803 $853 $3,178 $18,697 $22,728 Massachusetts $357 $�,��8 $12,890 $17,695 $337 $5,�63 $22,6�3 $28,��3 Michigan $1,189 $8,727 $18,082 $28,126 $1,676 $12,796 $29,568 $��,0�0 Minnesota $�09 $3,751 $11,605 $15,765 $592 $7,356 $23,�19 $31,578 Mississippi $370 $3,122 $7,580 $10,913 $55� $6,013 $1�,602 $21,170 Missouri $905 $2,612 $13,392 $16,909 $1,61� $3,83� $2�,3�0 $29,788 Montana $253 $78� $3,000 $�,039 $3�� $1,191 $5,20� $6,738 Nebraska $250 $1,252 $�,279 $5,781 $�17 $2,076 $7,815 $10,308 Nevada $11� $2,077 $5,65� $7,8�5 $23� $�,7�9 $15,111 $20,09� New Hampshire $1�2 $6�� $3,30� $�,090 $15� $900 $6,�05 $7,�59 New Jersey $216 $6,973 $20,1�5 $27,33� $293 $9,507 $39,523 $�9,32� New Mexico $�18 $2,117 $�,983 $7,518 $555 $3,181 $8,369 $12,105 New York $�69 $13,275 $28,017 $�1,78� $556 $16,5�3 $�6,915 $6�,01� North Carolina $1,960 $2,809 $17,136 $21,905 $2,257 $3,690 $3�,�07 $�0,35� North Dakota $�76 $55� $2,201 $3,231 $693 $1,�56 $3,805 $5,955 Ohio $2,19� $8,1�5 $22,661 $33,227 $2,972 $10,�89 $39,39� $52,855 Oklahoma $532 $5,325 $9,739 $15,597 $857 $7,517 $17,553 $25,927 Oregon $51 $1,980 $7,350 $9,381 $89 $2,935 $1�,57� $17,599 Pennsylvania $2,�60 $8,�2� $2�,987 $36,�83 $3,015 $11,933 $�2,755 $57,703 Rhode Island $0 $893 $1,835 $2,728 $0 $1,136 $3,082 $�,219 South Carolina $1,098 $1,931 $9,750 $12,779 $1,076 $2,03� $17,25� $20,365 South Dakota $�� $�39 $2,0�3 $2,526 $71 $891 $3,580 $�,5�2 Tennessee $1,381 $2,739 $13,�99 $17,619 $2,203 $�,313 $29,153 $35,670 Texas $2,232 $26,632 $8�,99� $113,859 $�,670 $�2,86� $185,062 $232,596 Utah $513 $1,999 $5,695 $8,207 $835 $3,�27 $12,369 $16,632 Vermont $0 $118 $1,767 $1,885 $0 $152 $3,251 $3,�03 Virginia $1,0�5 $3,�77 $17,780 $22,397 $1,093 $�,2�5 $35,183 $�0,522 Washington $131 $2,5�6 $13,505 $16,181 $2�0 $3,823 $28,�88 $32,551 West Virginia $2,3�5 $1,696 $3,932 $8,070 $1,869 $2,229 $5,820 $9,918 Wisconsin $757 $3,893 $10,853 $15,�83 $1,103 $5,575 $19,838 $26,516 Wyoming $66� $1,106 $2,871 $�,6�1 $80� $1,667 $�,980 $7,�50 United States $38,661 $212,955 $667,735 $921,5�3 $55,086 $312,032 $1,305,�55 $1,672,572

Appendix A 31Appendix A 31
Reference case High price case
State
Alabama $96,788 $396,�35 �.1 $512,2�� 5.3Arizona $139,968 $500,970 3.6 $637,�09 �.6Arkansas $53,178 $220,�02 �.1 $286,�82 5.�California $1,01�,973 $2,223,739 2.2 $2,911,102 2.9Colorado $135,255 $353,�71 2.6 $��8,�29 3.3Connecticut $122,827 $233,309 1.9 $303,0�2 2.5Delaware $25,851 $57,�62 2.2 $73,271 2.8Dist. of Columbia $67,397 $1�,718 0.2 $17,51� 0.3Florida $�07,�30 $1,258,799 3.1 $1,6�5,566 �.0Georgia $22�,739 $683,719 3.0 $875,131 3.9Hawaii $36,563 $127,677 3.5 $183,787 5.0Idaho $29,26� $106,�53 3.6 $136,761 �.7Illinois $357,257 $832,180 2.3 $1,07�,52� 3.0Indiana $1�1,793 $532,6�7 3.8 $691,733 �.9Iowa $68,99� $261,126 3.8 $3�3,511 5.0Kansas $67,�35 $233,136 3.5 $302,768 �.5Kentucky $89,153 $37�,090 �.2 $�85,30� 5.�Louisiana $9�,817 $663,917 7.0 $897,9�5 9.5Maine $27,737 $118,668 �.3 $159,670 5.8Maryland $163,612 $3�2,213 2.1 $�32,328 2.6Massachusetts $22�,373 $�21,�3� 1.9 $5�5,120 2.�Michigan $232,803 $658,306 2.8 $833,772 3.6Minnesota $152,01� $�28,939 2.8 $560,355 3.7Mississippi $�9,709 $285,338 5.7 $376,763 7.6Missouri $137,6�� $�19,653 3.0 $550,389 �.0Montana $19,127 $98,�32 5.1 $127,�09 6.7Nebraska $�3,�25 $1�3,35� 3.3 $189,503 �.�Nevada $69,�50 $2�7,731 3.6 $321,130 �.6New Hampshire $3�,872 $106,655 3.1 $138,285 �.0New Jersey $267,58� $685,366 2.6 $888,27� 3.3New Mexico $39,7�3 $180,252 �.5 $230,028 5.8New York $636,533 $95�,9�8 1.5 $1,211,852 1.9North Carolina $210,919 $572,2�8 2.7 $728,227 3.5North Dakota $15,�85 $8�,723 5.5 $110,�37 7.1Ohio $271,809 $767,286 2.8 $993,6�7 3.7Oklahoma $73,399 $360,177 �.9 $�70,507 6.�Oregon $88,369 $233,959 2.6 $305,390 3.5Pennsylvania $312,879 $8�3,381 2.7 $1,07�,350 3.�Rhode Island $26,026 $6�,669 2.5 $82,878 3.2South Carolina $89,791 $305,061 3.� $389,1�7 �.3South Dakota $16,6�2 $62,9�9 3.8 $83,951 5.0Tennessee $138,188 $�7�,829 3.� $619,102 �.5Texas $588,839 $2,903,8�9 �.9 $�,002,70� 6.8Utah $59,8�6 $218,�97 3.7 $280,226 �.7Vermont $1�,569 $�9,113 3.� $6�,711 �.�Virginia $230,9�9 $567,�69 2.5 $738,059 3.2Washington $181,666 $�19,9�6 2.3 $551,878 3.0West Virginia $32,63� $169,879 5.2 $207,13� 6.3Wisconsin $137,239 $376,338 2.7 $�86,361 3.5Wyoming $1�,366 $108,255 7.5 $139,731 9.7United States $7,796,11� $22,985,32� 2.9 $30,037,891 3.9
Total yearly worker earnings, 2007
Total spending, 2010-2030
Years to pay for totalspending
Total spending, 2010-2030
Years to pay for totalspending
Table 3. Years of Total 2007 State Workforce Earnings Necessary to Pay for Total Projected Fossil Fuel Use Between 2010 and 2030 (millions of 2007 dollars)

32 The High Cost of Fossil Fuels32 The High Cost of Fossil Fuels
Table 4. Spending on Oil in 2030, High Price Case (millions of 2007 dollars)
State Spending on Oil Total Spending on Percent of Total 2030 Fossil Fuels Spending on Oil 2030 2030
Alabama $19,��7 $28,27� 69%Arizona $30,535 $�0,110 76%Arkansas $12,087 $15,678 77%California $13�,2�6 $160,536 8�%Colorado $17,799 $2�,507 73%Connecticut $12,662 $15,517 82%Delaware $3,026 $3,699 82%Dist. Of Columbia $�2� $761 56%Florida $8�,885 $97,80� 87%Georgia $39,6�9 $�8,025 83%Hawaii $10,373 $10,�28 99%Idaho $6,2�3 $7,757 80%Illinois $�3,582 $58,582 7�%Indiana $27,917 $38,276 73%Iowa $13,561 $17,835 76%Kansas $10,526 $16,739 63%Kentucky $20,570 $26,821 77%Louisiana $33,�70 $�7,�99 70%Maine $7,6�� $8,276 92%Maryland $18,697 $22,728 82%Massachusetts $22,6�3 $28,��3 80%Michigan $29,568 $��,0�0 67%Minnesota $23,�19 $31,578 7�%Mississippi $1�,602 $21,170 69%Missouri $2�,3�0 $29,788 82%Montana $5,20� $6,738 77%Nebraska $7,815 $10,308 76%Nevada $15,111 $20,09� 75%New Hampshire $6,�05 $7,�59 86%New Jersey $39,523 $�9,32� 80%New Mexico $8,369 $12,105 69%New York $�6,915 $6�,01� 73%North Carolina $3�,�07 $�0,35� 85%North Dakota $3,805 $5,955 6�%Ohio $39,39� $52,855 75%Oklahoma $17,553 $25,927 68%Oregon $1�,57� $17,599 83%Pennsylvania $�2,755 $57,703 7�%Rhode Island $3,082 $�,219 73%South Carolina $17,25� $20,365 85%South Dakota $3,580 $�,5�2 79%Tennessee $29,153 $35,670 82%Texas $185,062 $232,596 80%Utah $12,369 $16,632 7�%Vermont $3,251 $3,�03 96%Virginia $35,183 $�0,522 87%Washington $28,�88 $32,551 88%West Virginia $5,820 $9,918 59%Wisconsin $19,838 $26,516 75%Wyoming $�,980 $7,�50 67%United States $1,305,�55 $1,672,572 78%

Appendix B: Methodology 33
Table 4. Spending on Oil in 2030, High Price Case (millions of 2007 dollars)
State Spending on Oil Total Spending on Percent of Total 2030 Fossil Fuels Spending on Oil 2030 2030
Alabama $19,��7 $28,27� 69%Arizona $30,535 $�0,110 76%Arkansas $12,087 $15,678 77%California $13�,2�6 $160,536 8�%Colorado $17,799 $2�,507 73%Connecticut $12,662 $15,517 82%Delaware $3,026 $3,699 82%Dist. Of Columbia $�2� $761 56%Florida $8�,885 $97,80� 87%Georgia $39,6�9 $�8,025 83%Hawaii $10,373 $10,�28 99%Idaho $6,2�3 $7,757 80%Illinois $�3,582 $58,582 7�%Indiana $27,917 $38,276 73%Iowa $13,561 $17,835 76%Kansas $10,526 $16,739 63%Kentucky $20,570 $26,821 77%Louisiana $33,�70 $�7,�99 70%Maine $7,6�� $8,276 92%Maryland $18,697 $22,728 82%Massachusetts $22,6�3 $28,��3 80%Michigan $29,568 $��,0�0 67%Minnesota $23,�19 $31,578 7�%Mississippi $1�,602 $21,170 69%Missouri $2�,3�0 $29,788 82%Montana $5,20� $6,738 77%Nebraska $7,815 $10,308 76%Nevada $15,111 $20,09� 75%New Hampshire $6,�05 $7,�59 86%New Jersey $39,523 $�9,32� 80%New Mexico $8,369 $12,105 69%New York $�6,915 $6�,01� 73%North Carolina $3�,�07 $�0,35� 85%North Dakota $3,805 $5,955 6�%Ohio $39,39� $52,855 75%Oklahoma $17,553 $25,927 68%Oregon $1�,57� $17,599 83%Pennsylvania $�2,755 $57,703 7�%Rhode Island $3,082 $�,219 73%South Carolina $17,25� $20,365 85%South Dakota $3,580 $�,5�2 79%Tennessee $29,153 $35,670 82%Texas $185,062 $232,596 80%Utah $12,369 $16,632 7�%Vermont $3,251 $3,�03 96%Virginia $35,183 $�0,522 87%Washington $28,�88 $32,551 88%West Virginia $5,820 $9,918 59%Wisconsin $19,838 $26,516 75%Wyoming $�,980 $7,�50 67%United States $1,305,�55 $1,672,572 78%
The projected fossil fuel expenditures in this report are based on projections from the U.S. Energy Information
Administration’s (EIA) Annual Energy Outlook 2009 (AEO 2009). The “reference case” scenario described here is based on the revised AEO 2009 reference case sce-nario, which includes the impacts of the American Reinvestment and Recovery Act (ARRA). The “high-price case” described here is based on the high-price case in the original AEO 2009, which does not include the impacts of ARRA.
The EIA publishes state-by-state esti-mates of fossil fuel consumption in its State Energy Data System (SEDS) database. The SEDS database includes consumption esti-mates through 2006. The version of SEDS downloaded on May 8, 2009, was used in this analysis.
State-by-state consumption figures for years 2007 to 2030 were estimated by ap-plying the rate of projected increase for the use of each fossil fuel in each Census region in AEO2009 (adjusted for population, see below) to the baseline energy consumption figures for 2006 from SEDS. For example, projections for coal use in the state of Connecticut would have been derived
by applying the New England-wide rate of increase in coal consumption in AEO 2009 to the actual consumption of coal in Connecticut in 2006 from SEDS.
To account for differences in the pro-jected growth of various states within a given Census region, we adjusted the en-ergy consumption growth rates from AEO 2009 by projected population growth. We did so by combining the regional energy consumption projections in AEO 2009 with population projections from the U.S. Census Bureau to derive the projected in-crease in per-capita energy consumption in each region. We then multiplied the in-crease in per-capita consumption by region by the projected percentage increase in state population to arrive at state-by-state projected rates of increase in consumption, and then applied that rate to the baseline energy consumption figure for each state. The formula for this is as follows:
(Percentage increase in regional per-capita consumption) x (Percentage in-crease in state population) x (State energy consumption in Year 1) = State energy consumption Year 2
National estimates were calculated inde-pendently using a similar methodology and
Appendix B: Methodology

3� The High Cost of Fossil Fuels
substituting national data from the SEDS, AEO, and the U.S. Census Bureau.
Estimates of expenditures on fossil fuels were calculated by multiplying the projected consumption of a fossil fuel in a given economic sector and state by the projected price of the fuel in that sector and Census region. This method was also used to estimate fossil fuel expenditures in the baseline year of 2006. This method will tend to ignore state-by-state (as opposed to region-by-region) variations in fossil fuel prices, but was chosen due to the lack of state-by-state projections for future prices by EIA.
As a result, the data reported here for 2006 fossil fuel expenditures will differ from that reported by EIA. While state-by-state variation in fossil fuel prices explains some of the difference, other factors—in-cluding inflation and any updates made to regional price data since the publication of SEDS—may also be responsible for some of the differences between the 2006 data reported here and those reported by EIA.
In one case—that of natural gas use in Alaska, which EIA includes within the Pa-cific region along with California, Oregon, Washington and Hawaii—state-by-state variations within the region were judged to be very significant. Alaska is a major producer, as well as consumer of natural gas, and its natural gas system does not
currently enjoy a physical connection with the remainder of the United States. As a result, natural gas prices in Alaska are far lower than in the rest of the Pacific region. Because Alaska’s natural gas market oper-ates largely independently of the remainder of the United States, applying the Pacific region price trends to Alaska was deemed inappropriate, and Alaska-specific data were dropped from this analysis.
This analysis is intended only to reflect consumption of fossil fuels and not other forms of energy. Ethanol blended into gasoline is reported by the EIA as part of its motor gasoline consumption figures; therefore, ethanol blending components are included in these figures. However, we did not evaluate forms of energy, such as E85, that include fossil fuels but are not primarily fossil fuels.
Finally, as is apparent in Appendix A, spending figures for the 2006 baseline vary between the reference and high price cases. This results from the fact, mentioned above, that a small set of AEO reference case prices (generally for fuels used in the industrial and transportation sectors) were updated to reflect corrected information for past years between the time the high price case and the revised reference case were published. The differences between the 2006 data in the two cases are minimal, always less than 1 percent.

Notes 35
1 U.S. Dept. of Energy, Energy Information Administration, Annual Energy Review 2007: Table 1.1 Primary Energy Overview, 1949-2007, 23 June 2008.
2 Ibid.
3 Texas State Library and Archives Commission, Hazardous Business: Industry, Regulation, and the Texas Railroad Commission, “Other Responsibilities,” downloaded from www.tsl.state.tx.us/exhibits/railroad/other/page1.html on 29 May 2009.
4 California Air Resources Board, Clean Air—California’s Successes and Future Challenges [presentation], Speaking notes Slide 6, Historical Slide: Dr. Haagen –Smit, downloaded from www.arb.ca.gov/ba/omb/50thfinal/tsld006.htm on 29 May 2009.
5 U.S. Dept. of Energy, Energy Information Administration, Table 5.2 Crude Oil Production and Crude Oil Well Productivity, 1954-2007, 23 June 2008.
6 U.S. Dept. of Energy, Energy Information Administration, Natural Gas Navigator: Natural Gas Gross Withdrawls and Production, 29 May 2009.
7 U.S. Dept. of Energy, Energy Information Administration, State Energy
Data System (SEDS): Table S3. Energy Consumption Estimates by Source, 2006, 5 April 2007.
8 Ibid.
9 Percent of total consumption in Btu’s. Ibid.
10 2006 gross domestic product equaled $13,178.4 billion in 2007 dollars. From U.S. Bureau of Economic Analysis, Current-Dollar and “Real” Gross Domestic Product, 29 April 2009. The United States spent $921.2 billion in 2007 dollars on fossil fuels in 2006. U.S. consumption data from U.S. Dept. of Energy, Energy Information Administration, State Energy Data System, Consumption, British Thermal Units, 1960-2006, 28 November 2008. U.S. price data from U.S. Dept. of Energy, Energy Information Administration, Annual Energy Outlook: Low-Price Case, Table 3. Energy Prices by Sector and Source, March 2009.
11 Total government discretionary spending, including government branches, departments, administrations and agencies, totaled $840.3 billion in 2006. Total government spending, including mandatory spending, was $2,568 in 2006. United States Government Printing Office, Budget of the United States Government,
Notes
36 The High Cost of Fossil Fuels
Fiscal Year 2006, Table S-10, Budget Summary by Category, 28 January 2008. Available at www.gpoaccess.gov/usbudget/fy06/browse.html. 2006 population from U.S. Census Bureau, Table 1. Annual Estimates of the Population of the United States, Regions, States, and Puerto Rico: April 1, 2000 to July 1, 2007, 27 December 2007.
12 The U.S. spent $667 billion on oil in 2006, out of a total $921 billion spent on fossil fuels. U.S. consumption data from U.S. Dept. of Energy, Energy Information Administration, State Energy Data System, Consumption, British Thermal Units, 1960-2006, 28 November 2008. U.S. price data from U.S. Dept. of Energy, Energy Information Administration, Annual Energy Outlook: Low-Price Case, Table 3. Energy Prices by Sector and Source, March 2009.
13 U.S. Bureau of Labor Statistics, Consumer Expenditure Survey, 2007: Table 2. Income Before Taxes: Average Annual Expenditures and Characteristics, 28 November 2008.
14 U.S. Bureau of Labor Statistics, Consumer Expenditure Survey, 2007: Table 1. Quintiles of Income Before Taxes: Average Annual Expenditures and Characteristics, 28 November 2008.
15 Does not include payroll taxes such as Social Security and Medicare. Ibid.
16 U.S. Dept. of Energy, Energy Information Administration, Annual Energy Review 2007: Table 3.7 Value of Fossil Fuel Imports, 1949-2007, 23 June 2008.
17 U.S. Dept. of Energy, Energy Information Administration, Assumptions to the Annual Energy Outlook 2009, March 2009.
18 Abrahm Lustgarten, ProPublica, “Officials in Three States in Water Woes on Gas Drilling,” 26 April 2009.
19 U.S. Dept. of Energy, Office of Petroleum Reserves, Fact Sheet: Oil Shale and the Environment, downloaded from www.fossil.energy.gov/programs/reserves/npr/Oil_Shale_Environmental_Fact_Sheet.pdf on 29 May 2009.
20 U.S. Dept. of Energy, Energy Information Administration, Annual Energy Outlook 2009 with Projections to 2030: Issues in Focus, March 2009.
21 U.S. Dept. of Energy, Energy Information Administration, Annual Energy Outlook 2009 with Projections to 2030: Comparison with Other Projections, March 2009.
22 International Energy Agency, World Energy Outlook 2008, 12 November 2008.
23 Energy Watch Group, Coal: Resources and Production (Final-Version 28032007), 28 March 2007. Available at www.energywatchgroup.org/fileadmin/global/pdf/EWG_Report_Coal_10-07-2007ms.pdf.
24 U.S. Dept. of Energy, Energy Information Administration, Annual Energy Review 2007: Table 1.2 Primary Energy Production by Source, 1949-2007, 23 June 2008.
25 See note 20.
26 U.S. Dept. of Energy, Energy Information Administration, Annual Energy Outlook 2009 with Projections to 2030: Issues in Focus, March 2009.
27 U.S. Dept. of Commerce, Bureau of Economic Analysis, National Economic Accounts, Table 1.1.5 Gross Domestic Product, latest revision 29 May 2009.
28 As a whole, the American workforce earned $7.8 trillion in 2007. From U.S. Dept. of Commerce, Bureau of Economic Analysis, Compensation of Employees, All Industry Total, United States, downloaded from www.bea.gov/regional/gsp/action.cfm on 15 June 2009.
29 U.S. spending on education was $882 billion on all levels, including post-secondary, in 2005. Based on 7.1 percent of GDP from U.S. Dept. of Education, National Center for Education Statistics, The Condition of Education 2009, Indicator 37: Education Expenditures by Country, 2009. Available at nces.ed.gov/programs/coe/2009/pdf/37_2009.pdf; GDP of $12.422 trillion from U.S. Dept. of

Notes 37
Commerce, Bureau of Economic Analysis, Table 1.1.5 Gross Domestic Product, latest revision 29 May 2009. Spending on food was $737 billion for all U.S. households in 2007. From U.S. Bureau of Labor Statistics, Consumer Expenditure Survey, 2007: Table 57. Age of Reference Person: Shares of Annual Aggregate Expenditures and Sources of Income, 28 November 2008. U.S. spending on fossil fuels was $1.08 trillion in 2008. See Methodology, Appendices. U.S. spending on health care was $2.4 trillion in 2007. From National Coalition on Health Care, Health Insurance Costs [factsheet], downloaded from www.nchc.org/facts/cost.shtml on 29 May 2009. U.S. military spending was $547 billion in 2007. From Stockholm International Peace Research Institute, The Top 15 Major Spending Countries in 2007, 2008. U.S. spending on shelter was $1.2 trillion in household expenditures in 2007. From U.S. Bureau of Labor Statistics, Consumer Expenditure Survey, 2007: Table 57.(See this note, above).
30 U.S. Dept. of Energy, Energy Information Administration, Annual Energy Outlook, High Price Case, Table 12. Petroleum Product Prices, March 2009.
31 As a result of state-to-state fossil fuel price variation, the data reported here for 2006 fossil fuel expenditures will differ from that reported by EIA. While state-by-state variation in fossil fuel prices explains some of the difference, other factors—including inflation and any updates made to regional price data since the publication of SEDS—may also be responsible for some of the differences between the 2006 data reported here and those reported by EIA. See Methodology.
32 U.S. Dept. of Energy, Energy Information Administration, State Energy Profiles: Hawaii, 29 May 2009.
33 U.S. Dept. of Energy, Energy Information Administration, State Energy Profiles: Kansas, Mississippi and Wyoming, 29 May 2009.
34 Total 2007 state workforce earnings from U.S. Dept. of Commerce, Bureau
of Economic Analysis, Compensation of Employees, All Industry Total, United States [and by state], downloaded from www.bea.gov/regional/gsp/action.cfm on 15 June 2009.
35 United Kingdom, HM Treasury, Stern Review on the Economics of Climate Change, 30 October 2006, ES-v.
36 Based on 2007 global GDP of $54,583,788 million. World Bank, World Development Indicators database, Gross Domestic Product 2007 [fact sheet], revised 24 April 2009.
37 Frank Ackerman, Elizabeth A. Stanton, et al., Global Development and Environment Institute, Stockholm Environment Institute-US Center, Tufts University, and Natural Resources Defense Council, The Cost of Climate Change: What We’ll Pay if Global Warming Continues Unchecked, May 2008.
38 James Titus et al., “Greenhouse Effect and Sea Level Rise: The Cost of Holding Back the Sea,” Coastal Management, Volume 19, 171-204, 1991.
39 See note 37.
40 Ibid.
41 Cynthia Rosenzwieg and William Solecki, Climate Change Information Resources—New York Metropolitan Region, Columbia University, How Will Climate Change Affect the Region’s Transportation System?[fact sheet], 29 March 2005.
42 Travis Madsen and Emily Figdor, Environment America Research & Policy Center, When It Rains, It Pours: Global Warming and the Rising Frequency of Extreme Precipitation in the United States, December 2007.
43 See note 35.
44 See note 37.
45 David Lobell and Christopher Field, Lawrence Livermore National Laboratory and Carnegie Institution, Global Scale Climate-Crop Yield Relationships and the Impacts of Recent Warming, 16 March 2007.

38 The High Cost of Fossil Fuels
46 Net yield decline is 3 percent over 30 years. The study projects yield to increase 1 percent due to elevated carbon dioxide levels and decrease 4 percent due to elevated temperatures. United States Climate Change Science Program, The Effects of Climate Change on Agriculture, Land Resources, Water Resources, and Biodiversity in the United States, May 2008.
47 Timothy Telleen-Lawton, Environment America Research & Policy Center, Hotter Fields, Lower Yields: How Global Warming Could Hurt America’s Farms, April 2009.
48 See note 46.
49 Gerald M. Jones and Charles C. Stallings, Virginia Cooperative Extension, Reducing Heat Stress for Dairy Cattle, October 1999.
50 N.R. St. Pierre, B. Cobanov and G. Schnitkey, “Economic Losses from Heat Stress by U.S. Livestock Industries,” Journal of Dairy Science 86: E52-E77, 2003.
51 See note 46.
52 Carbon dioxide concentration raised to 550 ppm, the level the researchers expect our atmosphere to reach by 2050. Jason Hamilton et al., “Anthropogenic Changes in Tropospheric Composition Increase Susceptibility of Soybean to Insect Herbivory”, Environmental Entymology, 34(2): 479-485, 2005.
53 See note 42.
54 U.S. Environmental Protection Agency, Office of Policy, Planning and Evaluation, Climate Change and Public Health [fact sheet], EPA 236-F-97-005, October 1997.
55 Anthony Costello et al., The Lancet and the University College of London Institute for Global Health Commission, “Managing the Effects of Climate Change,” The Lancet, 373:1693-733, 16 May 2009.
56 Louisiana Dept. of Health and Hospitals, Hurricane Katrina Deceased Reports: Reports of Missing and Deceased August 2, 2006, downloaded from
www.dhh.louisiana.gov/offices/page.asp?ID=192&Detail=5248 on 1 June 2009.
57 Doug Struck, The Washington Post, “Climate Change Drives Disease to New Territory,” 5 May 2006.
58 Michael Conlon, Reuters, “Study Links Smog Increases to Urban US Deaths,” 17 November 2004.
59 Kate Galbraith, The New York Times, “E.P.A. Proposal Calls Greenhouse Gases a Danger to Public Health,” 23 March 2009.
60 See note 42.
61 Ibid.
62 Ibid.
63 United States Global Change Research Program, Global Climate Change Impacts in the United States: Water, June 2009.
64 Trent Yang, Massachusetts Institute of Technology, master’s thesis, Economic and Policy Implications of Urban Air Pollution in the United States 1970 to 2000, January 2004. Available at dspace.mit.edu/bitstream/handle/1721.1/28315/55636406.pdf?sequence=1.
65 White House Office of Management and Budget Office of Information and Regulatory Affairs, 2008 Report to Congress on the Benefits and Costs of Federal Regulations and Unfunded Mandates on State, Local, and Tribal Entities, January 2009.
66 U.S. Government Accountability Office, Maritime Transportation: Major Oil Spills Occur Infrequently, but Risks to the Federal Oil Spill Fund Remain, September 2007. Available at www.gao.gov/highlights/d071085high.pdf.
67 The New York Times, “Lessons of the Exxon Valdez” [editorial], The New York Times, 22 March 2009.
68 Associated Press, “Coal Ash Spill Cleanup Could Cost $825 Million,” Associated Press, 12 February 2009.
69 Ayesha Rascoe, “U.S. Seeks to End Bush Mountaintop Coal Mining Rule,” Reuters, 27 April 2009.
70 U.S. Geological Survey, Acid Mine
Notes 39
Drainage: Introduction [fact sheet], downloaded from energy.er.usgs.gov/health_environment/acid_mine_drainage/ on 1 June 2009.
71 Abrahm Lustgarten, ProPublica, “Buried Secrets: Is Natural Gas Drilling Endangering U.S. Water Supplies?,” 13 November 2008.
72 General Charles F. Wald et al., Center for Naval Analyses, Powering America’s Defense: Energy and the Risks to National Security, May 2009.
73 Alan R. Shaffer, Principal Deputy Director of Defense Research and Engineering, Testimony before the Subcommittee on Readiness of the House Armed Services Committee, 3 March 2009.
74 House Armed Services Subcommittee on Terrorism, Unconventional Threats and Capabilities, Joint Terrorism, Unconventional Threats and Capabilities Subcommittee and Readiness Subcommittee Hearing Focuses on Energy Efficiency and Alternative Energy Programs Throughout Department of Defense [press release], 26 September 2006.
75 See note 72.
76 Saudi Arabia 12 percent U.S. imports in 2007 from U.S. Dept. of Energy, Energy Information Administration, Saudi Arabia: Oil Exports and Shipping, August 2008. Venezuela 10 percent U.S. imports in 2007 from U.S. Dept. of Energy, Energy Information Administration, Venezuela: Background, January 2009.
77 1.2 billion metric tons carbon dioxide from McKinsey & Company, Reducing U.S. Greenhouse Gas Emissions: How Much at What Cost?, U.S. Greenhouse Gas Abatement Mapping Initiative Executive Report, December 2007. Percent of today’s emissions based on U.S. 2008 fossil fuel-based emissions of 5,802 MMTCO2, from U.S. Dept. of Energy, Energy Information Administration, U.S. Carbon Dioxide Emissions from Energy Sources 2008 Flash
Estimate, May 2009.
78 U.S. Dept. of Energy, Energy Information Administration, An Updated Annual Energy Outlook 2009 Reference Case Reflecting Provisions of the American Recovery and Reinvestment Act and Recent Changes in the Economic Outlook, April 2009.
79 Union of Concerned Scientists, Obama Clean Car Standards Deliver Massive Oil Savings [press release], 19 May 2009.
80 Union of Concerned Scientists, Climate 2030: A National Blueprint for a Clean Energy Economy, May 2009.
81 U.S. Dept. of Energy, Energy Information Administration, Impacts of a 25-Percent Renewable Electricity Standard as Proposed in the American Clean Energy and Security Act Discussion Draft, downloaded on 29 May 2009 from www.eia.doe.gov/oiaf/servicerpt/acesa/execsummary.html.
82 GTM Research, PV Technology, Production and Cost, 2009 Forecast, 7 March 2009.
83 Doug Hurley, Kenji Takahaski, Bruce Biewald, Jennifer Kallay and Robin Maslowski, Synapse Energy Economics and Northeast Energy Efficiency Council, Costs and Benefits of Electric Utility Energy Efficiency in Massachusetts, August 2008.
84 S. Tegen, National Renewable Energy Laboratory, Comparing Statewide Economic Impacts of New Generation from Wind, Coal and Natural Gas in Arizona, Colorado and Michigan, Technical Report NREL/TP-500-37720, May 2006.
85 See note 35.
86 Ibid.
87 Dallas Burtraw et al., Resources for the Future, Ancillary Benefits of Reduced Air Pollution in the United States from Moderate Greenhouse Gas Mitigation Policies in the Electricity Sector, December 2001.
88 See note 79.

�0 The High Cost of Fossil Fuels