Embed Size (px)
Citation preview

8/3/2019 The Hidden Costs of Community Colleges - American Institutes for Research study
http://slidepdf.com/reader/full/the-hidden-costs-of-community-colleges-american-institutes-for-research-study 1/22
The Hidden Costs of Community Colleges
Mark Schneider
Vice President
AIR®
Co-President
College Measures LLC
Lu (Michelle) Yin
Researcher
AIR®
October 2011
www.air.org

8/3/2019 The Hidden Costs of Community Colleges - American Institutes for Research study
http://slidepdf.com/reader/full/the-hidden-costs-of-community-colleges-american-institutes-for-research-study 2/22
American Institutes for Research® ii
The Hidden Costs of Community Colleges
Contents
Executive Summary . . . . . . . . . . . . . . . . . . . . . . . . . . . . . . . . . . . . . . . . . . . . . . . . . . . . . . . . . . . . 1
Introduction . . . . . . . . . . . . . . . . . . . . . . . . . . . . . . . . . . . . . . . . . . . . . . . . . . . . . . . . . . . . . . . . . . 3
The Hidden Costs of Low Retention Rates in Community Colleges . . . . . . . . . . . . . . . . . . . . . . . . . 4
How Much Does First-Year Attrition From Community Colleges Cost Taxpayers? . . . . . . . . . . . . . . . . 5
The Cumulative Costs of Failure . . . . . . . . . . . . . . . . . . . . . . . . . . . . . . . . . . . . . . . . . . . . . . . . . . 8
State Results . . . . . . . . . . . . . . . . . . . . . . . . . . . . . . . . . . . . . . . . . . . . . . . . . . . . . . . . . . . . . . . . . 9
State Data Table . . . . . . . . . . . . . . . . . . . . . . . . . . . . . . . . . . . . . . . . . . . . . . . . . . . . . . . . . . . . . 12
Reducing the Hidden Costs of Low Community College Retention and Completion Rates . . . . . . . . 14
Technical Appendix . . . . . . . . . . . . . . . . . . . . . . . . . . . . . . . . . . . . . . . . . . . . . . . . . . . . . . . . . . . 16
Support for this project was provided by the Bill & Melinda Gates Foundation.

8/3/2019 The Hidden Costs of Community Colleges - American Institutes for Research study
http://slidepdf.com/reader/full/the-hidden-costs-of-community-colleges-american-institutes-for-research-study 3/22
American Institutes for Research® iii
The Hidden Costs of Community Colleges
List of Tables
Table 1. Five-Year Costs for First-Year, Full-Time, Community College Students Who
Subsequently Dropped Out: 2004–05 Through 2008–09 Academic Years . . . . . . . 8
Table 2. States in Order of Total State or Local Expenditures on First-Year Community
College Students Who Subsequently Dropped Out: 2008–09 Academic Year . . . . 10
Table 3. States in Order of How Much Federal Student Aid Was Spent on First-Year
Community College Students Who Subsequently Dropped Out: 2008–09
Academic Year . . . . . . . . . . . . . . . . . . . . . . . . . . . . . . . . . . . . . . . . . . . . . . . . . 11
Table 4.Five-Year Cumulative Expenditures on First-Year-Only Community CollegeStudents, by State: 2004–05 Through 2008–09 Academic Years . . . . . . . . . . . . 13

8/3/2019 The Hidden Costs of Community Colleges - American Institutes for Research study
http://slidepdf.com/reader/full/the-hidden-costs-of-community-colleges-american-institutes-for-research-study 4/22
American Institutes for Research® iv
The Hidden Costs of Community Colleges
List of Figures
Figure 1. State and Local Appropriations to First-Year Community College Students
Who Subsequently Dropped Out . . . . . . . . . . . . . . . . . . . . . . . . . . . . . . . . . . . . . 6
Figure 2. Government Grants to First-Year Community College Students
Who Subsequently Dropped Out . . . . . . . . . . . . . . . . . . . . . . . . . . . . . . . . . . . . . 6
Figure 3. Total Costs of First-Year Community College Students
Who Subsequently Dropped Out . . . . . . . . . . . . . . . . . . . . . . . . . . . . . . . . . . . . . 7
Copies of this paper can be downloaded at http://www.air.org/les/AIR_Hidden_Costs_of_Community_Colleges_Oct2011.pdf, and questionscan be addressed to authors at [email protected]. or [email protected]. Proper citation is as follows: Schneider, M., & Yin, L. (2011). The hidden
costs of community colleges. Washington, DC: American Institutes for Research.
The Hidden Costs of Community Colleges

8/3/2019 The Hidden Costs of Community Colleges - American Institutes for Research study
http://slidepdf.com/reader/full/the-hidden-costs-of-community-colleges-american-institutes-for-research-study 5/22
American Institutes for Research® 1
The Hidden Costs of Community Colleges
Executive Summary
Community colleges are an essential component of
America’s higher education system. Last year, they
enrolled well over 6 million students, a number that
continues to grow. Community colleges also are
essential to meeting the Obama administration’s
goal of having the United States regain its position
as the nation with the highest concentration of
college-educated adults in the world. Labor force
data show that many of the certificates and
associate’s degrees awarded by community colleges
generate signicant returns on the investment that
students and taxpayers make in these institutions.
And compared to the costs of attending a bachelor’s
degree-granting institution, attending a community
college is usually far less costly to the student.
Therefore, it is not surprising that community
colleges now earn a high level of attention and
respect from policymakers across the country.
However, not everything is rosy. This report focuses
on the high costs of the low retention and completion
rates that are far too typical of community colleges.
Community colleges have multiple missions, and
their performance ultimately needs to be evaluated
on multiple metrics. However, one key mission of
community colleges is the awarding of associate’sdegrees and certicates to students who enroll with
the intention of earning these credentials. Focusing
on only rst-time, full-time, degree- and certicate-
seeking students in community colleges and
using data from the U.S. Department of Education,
this report shows that community colleges are
generating costs to the taxpayer that are usually
not part of the discussion of their role in America’s
system of higher education.

8/3/2019 The Hidden Costs of Community Colleges - American Institutes for Research study
http://slidepdf.com/reader/full/the-hidden-costs-of-community-colleges-american-institutes-for-research-study 6/22
American Institutes for Research® 2
The Hidden Costs of Community Colleges
During the last ve years, spanning the 2004–05
academic year through the 2008–09 academic
year (the last year for which comparable data are
now available) and counting only rst-time, full-time,
beginning degree- or certicate-seeking students
included in federal statistics:
State and local governments appropriated close
to $3 billion to community colleges to help pay
for the education of students who did not return
for a second year.
States spent more than $240 million in student
grants to support students who did not return to
their community college for a second year.
The federal government spent approximately
$660 million in student grants to support
students who did not return to their community
college for a second year.
In total, almost $4 billion in federal, state,
and local taxpayer monies in appropriations
and student grants went to rst-year, full-time,community college students who dropped out.
Given the central role that community colleges play
in the nation’s plans to regain its position as the
number one country in the world when it comes to
college-educated adults, and given the increasing
scal dif culties facing individual states and the
nation as a whole, it is clear that “business as
usual” is far too expensive. Better ways are needed
to ensure that the students who enter a community
college expecting to earn an associate’s degree or
a certicate nish the rst lap and ultimately cross
the nish line.
Data on individual campuses and comparative
tools to explore these and other measures of
community college performance are available
through CollegeMeasures.org at http://www.
collegemeasures.org. An interactive map with state
results can be found at http://www.collegemeasures.
org/ccattrition.

8/3/2019 The Hidden Costs of Community Colleges - American Institutes for Research study
http://slidepdf.com/reader/full/the-hidden-costs-of-community-colleges-american-institutes-for-research-study 7/22
American Institutes for Research® 3
The Hidden Costs of Community Colleges
Despite their contributions, community colleges have
long been neglected by federal higher education
policy, and community college leaders have
long been accustomed to being disappointed by
Washington politicians.1 As President Obama noted
at his American Graduation Initiative speech in July
2009, “All too often, community colleges are treated
like the stepchild of the higher education system;
they’re an afterthought, if they’re thought of at all.”2
But in the last few years, things have changed.
Community colleges now receive far more attention
than ever, and along with the new attention has
come new money from the federal government
and from large private foundations, especially the
Bill & Melinda Gates Foundation and the Lumina
Foundation. Today, community colleges are no longer
“afterthoughts” but are key to achieving the Obama
1 See David Moltz’s article “Hope Amid Disappointment” in the March
16, 2010, issue of Inside Higher Ed at http://www.insidehighered.com/
news/2010/03/16/agi/.
2 President Obama’s remarks on the American Graduation Initiative,
delivered on July 14, 2009, are available at http://www.whitehouse.gov/
the_press_of ce/Remarks-by-the-President-on-the-American-Graduation-
Initiative-in-Warren-MI/.
Community colleges are an essential part of
America’s system of higher education. They award
certicates and two-year degrees; they provide
transfer pathways into four-year baccalaureate
programs; and they provide a venue for adult
learners wishing to brush up on skills or to learn
more about topics that interest them. Community
colleges also enroll large numbers of students at
relatively low tuition. This low price plus their open-
access policies make them especially important to
the task of educating the growing number of low-
income and racial- or ethnic-minority students now
seeking the benets of postsecondary education.
The importance of community colleges is reected
in their enrollments, which increased by about 25
percent during the last decade and now top more
than 6 million students. In addition to these already
substantial enrollments, President Obama has called
for 5 million more community college graduates by
the year 2020—a challenging and dif cult task.
Introduction
8/3/2019 The Hidden Costs of Community Colleges - American Institutes for Research study
http://slidepdf.com/reader/full/the-hidden-costs-of-community-colleges-american-institutes-for-research-study 8/22
American Institutes for Research® 4
The Hidden Costs of Community Colleges
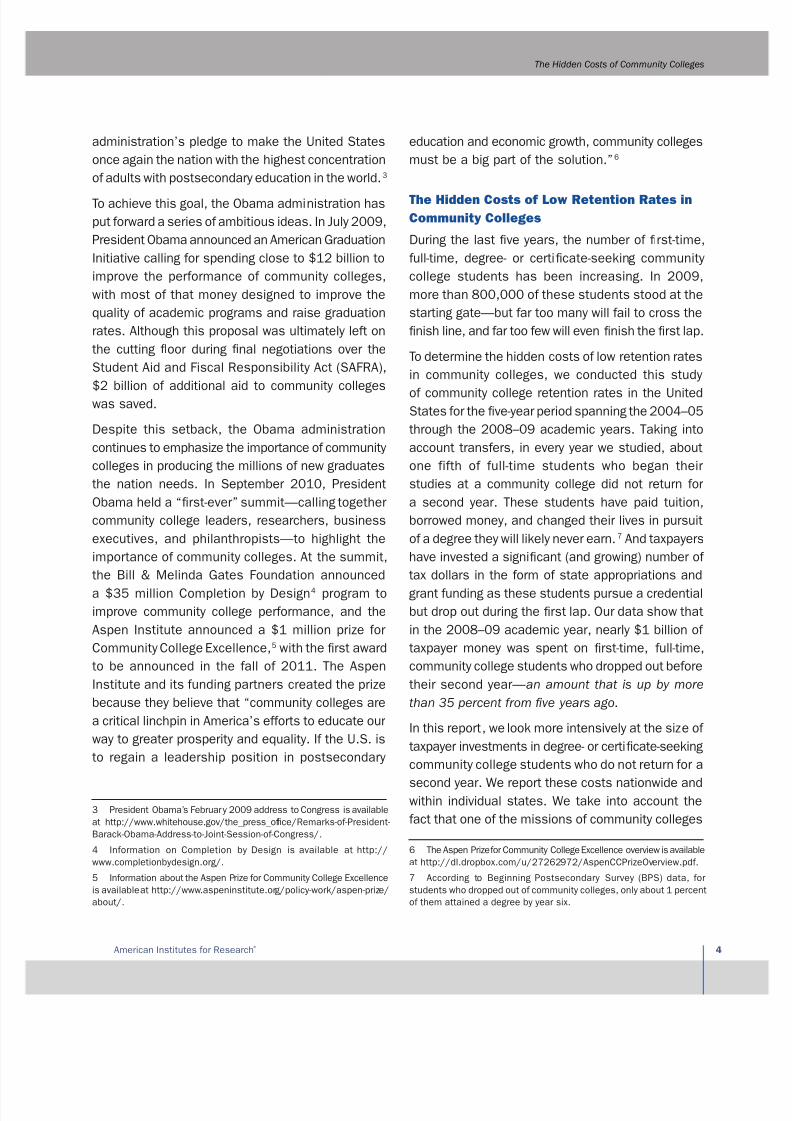
education and economic growth, community colleges
must be a big part of the solution.”6
The Hidden Costs of Low Retention Rates in
Community Colleges
During the last ve years, the number of rst-time,
full-time, degree- or certicate-seeking community
college students has been increasing. In 2009,
more than 800,000 of these students stood at the
starting gate—but far too many will fail to cross the
nish line, and far too few will even nish the rst lap.
To determine the hidden costs of low retention rates
in community colleges, we conducted this study
of community college retention rates in the UnitedStates for the ve-year period spanning the 2004–05
through the 2008–09 academic years. Taking into
account transfers, in every year we studied, about
one fifth of full-time students who began their
studies at a community college did not return for
a second year. These students have paid tuition,
borrowed money, and changed their lives in pursuit
of a degree they will likely never earn.7 And taxpayers
have invested a signicant (and growing) number of
tax dollars in the form of state appropriations and
grant funding as these students pursue a credential
but drop out during the rst lap. Our data show that
in the 2008–09 academic year, nearly $1 billion of
taxpayer money was spent on rst-time, full-time,
community college students who dropped out before
their second year—an amount that is up by more
than 35 percent from five years ago.
In this report, we look more intensively at the size of
taxpayer investments in degree- or certicate-seeking
community college students who do not return for a
second year. We report these costs nationwide andwithin individual states. We take into account the
fact that one of the missions of community colleges
6 The Aspen Prize for Community College Excellence overview is available
at http://dl.dropbox.com/u/27262972/AspenCCPrizeOverview.pdf.
7 According to Beginning Postsecondary Survey (BPS) data, for
students who dropped out of community colleges, only about 1 percent
of them attained a degree by year six.
administration’s pledge to make the United States
once again the nation with the highest concentration
of adults with postsecondary education in the world.3
To achieve this goal, the Obama administration has
put forward a series of ambitious ideas. In July 2009,
President Obama announced an American Graduation
Initiative calling for spending close to $12 billion to
improve the performance of community colleges,
with most of that money designed to improve the
quality of academic programs and raise graduation
rates. Although this proposal was ultimately left on
the cutting oor during nal negotiations over the
Student Aid and Fiscal Responsibility Act (SAFRA),
$2 billion of additional aid to community colleges
was saved.
Despite this setback, the Obama administration
continues to emphasize the importance of community
colleges in producing the millions of new graduates
the nation needs. In September 2010, President
Obama held a “rst-ever” summit—calling together
community college leaders, researchers, business
executives, and philanthropists—to highlight the
importance of community colleges. At the summit,
the Bill & Melinda Gates Foundation announced
a $35 million Completion by Design4 program to
improve community college performance, and the
Aspen Institute announced a $1 million prize for
Community College Excellence,5 with the rst award
to be announced in the fall of 2011. The Aspen
Institute and its funding partners created the prize
because they believe that “community colleges are
a critical linchpin in America’s efforts to educate our
way to greater prosperity and equality. If the U.S. is
to regain a leadership position in postsecondary
3 President Obama’s February 2009 address to Congress is available
at http://www.whitehouse.gov/the_press_of ce/Remarks-of-President-
Barack-Obama-Address-to-Joint-Session-of-Congress/.
4 Information on Completion by Design is available at http://
www.completionbydesign.org/.
5 Information about the Aspen Prize for Community College Excellence
is available at http://www.aspeninstitute.org/policy-work/aspen-prize/
about/.

8/3/2019 The Hidden Costs of Community Colleges - American Institutes for Research study
http://slidepdf.com/reader/full/the-hidden-costs-of-community-colleges-american-institutes-for-research-study 9/22
American Institutes for Research® 5
The Hidden Costs of Community Colleges
the low community college retention and completion
rates. Simply saying that the nation needs more
community college graduates and continuing to
pump more money and more students into theexisting system is not the answer. Indeed, during
the last ve years, as more and more students have
entered community colleges seeking associate’s
degrees and certicates, completion rates have
fallen and the hidden costs of community colleges
have continued to rise.
How Much Does First-Year Attrition From
Community Colleges Cost Taxpayers?
Figure 1 presents an estimate of the state and
local appropriations spent on rst-time, full-time,
degree-seeking students who enrolled in community
colleges across the nation but did not return for a
second year or transfer to another campus.
We tracked these numbers over the last ve years,
ending with the last year for which the federal
government has reported comparable numbers
through the U.S. Department of Education’s
Integrated Postsecondary Education Data System
(IPEDS).11 In the 2004–05 academic year, state and
local governments appropriated more than $500
million for full-time community college students who
dropped out before their second year. This number
has increased every year, to more than $650 million
in the most recent year for which we have data—an
increase of almost a third.
Figure 2 shows another avenue by which taxpayers
are spending money on community college students
who subsequently drop out. The federal government
underwrites the education of many community
college students through grants, mostly Pell Grants.Earlier in the ve years we studied, the federal
government spent between $110 million and $120
million on grants to students who dropped out during
11 We dene community colleges as U.S.-based, two-year, degree-
granting public institutions. Using IPEDS, we identied 1,058 institutions
for this study. The Technical Appendix describes how we arrived at our
estimates of dropouts.
is to help students transfer to four-year colleges,
adjusting estimates of the number of rst-year
dropouts for transfer students.8 (Costs broken out
for each campus, and for both public and privateschools, are available online through reporting tools
developed by CollegeMeasures.org at http://www.
collegemeasures.org.)
There is an ongoing debate about why community
colleges have such low success rates with
their students. One part of the explanation for
low success rates has to do with the dif culty
of educating the many students who enroll in
community colleges but might not be college-ready.
Another part has to do with the lack of knowledge
about what works for whom in remedial education
as well as other education programs. Still another
part of the explanation has to do with the lack of
support services that community colleges offer.9
The list goes on.10
Although we do not contribute to this body of
research, our data suggest that all stakeholders
need to pay far more attention to the high costs of
8 Institutions whose mission includes “substantial preparation for
students to enroll in another eligible institution without having completed
their programs” are required to report to the U.S. Department of Education’s Integrated Postsecondary Education Data System (IPEDS)
the number of students who transfer out. However, there is no clear
denition of this key term, leaving institutions to decide for themselves
whether this is part of their mission. We used the transfer-out numbers
reported by community colleges themselves to adjust the number of
rst-year dropouts. Institutions that have chosen not to report these
numbers were not “credited” with these transfer students, since we
had no way of knowing how many students have transferred. (For more
details, see the Technical Appendix on pages 16–17.)
9 For example, in a 2010 report, ACT found that more than 40
percent of the community colleges responding to its survey have no
one responsible for coordinating retention efforts and more than half
have no goals related to rst-year student retention. See What Works
in Student Retention? at http://act.org/research/policymakers/pdf/
droptables/CommunityColleges.pdf.
10 The Community College Resource Center at Teachers College,
Columbia University, is arguably the single best repository of what
is known about student success in community colleges. This center
traces low student success rates to overly complicated bureaucratic
structures that students must navigate; limited engagement of faculty
in policies and practices to increase student success; poor alignment of
course curricula, outcomes, and assessments; low standards; and poor
practices concerning collection and use of data to inform a continuous
improvement process. See the center’s summary statement at http://
ccrc.tc.columbia.edu/Publication.asp?uid=845.

8/3/2019 The Hidden Costs of Community Colleges - American Institutes for Research study
http://slidepdf.com/reader/full/the-hidden-costs-of-community-colleges-american-institutes-for-research-study 10/22
American Institutes for Research® 6
The Hidden Costs of Community Colleges
Figure 2. Government Grants to First-Year Community College Students Who Subsequently Dropped Out
$0
$50 million
$100 million
$150 million
$200 million
$250 million
$300 million
2004–05 2005–06 2006–07 2007–08 2008–09
State Grants Federal Grants Total Grants
Figure 1. State and Local Appropriations to First-Year Community College Students Who Subsequently Dropped Out
$400 million
2004–05 2005–06 2006–07 2007–08 2008–09
$450 million
$500 million
$550 million
$600 million
$650 million
$700 million

8/3/2019 The Hidden Costs of Community Colleges - American Institutes for Research study
http://slidepdf.com/reader/full/the-hidden-costs-of-community-colleges-american-institutes-for-research-study 11/22
American Institutes for Research® 7
The Hidden Costs of Community Colleges
When we add together both sources of government
student grants, the nation’s taxpayers are now
spending about $240 million per year on grants to
community college students who leave before theirsecond year.
In Figure 3, we combine these appropriations and
student grants to estimate taxpayer losses in these
sources of community college revenues. In the
2008–09 academic year, the nation’s taxpayers
spent more than $900 million on full-time, degree-
seeking community college students who dropped
out during their rst year, a sizable increase from
the $660 million spent ve years earlier.
Remember, this is just a piece of the taxpayer cost,since our estimates do not cover part-time students
or other government monies (for example, capital
expenditures) that help support community colleges.
their rst year of community college. Toward the end
of the Bush administration and continuing through
the Obama administration, the Pell Grant program
expanded dramatically. In the 2007–08 academicyear, Pell Grants to rst-year community college
dropouts soared by about 25 percent from previous
years, to about $140 million, increasing by more
than 25 percent to $180 million in the 2008–09
academic year.
States also have student grant programs. Although
these programs are smaller than the federal
government’s, state grant programs have grown
substantially during the ve-year time period for
which we have data. As these grant programs have
grown, so has the amount of money spent on rst-
year community college dropouts: from $39 million
in the 2004–05 academic year to more than $60
million in 2008–09.
Figure 3. Total Costs of First-Year Community College Students Who Subsequently Dropped Out
$600 million
$650 million
$700 million
$750 million
$800 million
$850 million
$900 million
$950 million
2004–05 2005–06 2006–07 2007–08 2008–09

8/3/2019 The Hidden Costs of Community Colleges - American Institutes for Research study
http://slidepdf.com/reader/full/the-hidden-costs-of-community-colleges-american-institutes-for-research-study 12/22
American Institutes for Research® 8
The Hidden Costs of Community Colleges
The federal government spent approximately
$660 million in student grants to support full-time
students who did not return to their community
college for a second year.
In total, almost $4 billion in federal, state, and
local taxpayer monies in appropriations and
student grants went to first-year community
college dropouts.
The Cumulative Costs of Failure
So far, we have looked at these losses on an annual
basis. In Table 1, we show the cumulative costs
during the last ve years:
State and local governments appropriated close
to $3 billion to community colleges to help pay
for the education of full-time, degree-seeking
students who did not return for a second year.
States spent more than $240 million in additional
money in student grants to support full-time
students who did not return to their community
college for a second year.
Table 1. Five-Year Costs for First-Year, Full-Time, Community College Students Who Subsequently Dropped Out:
2004–05 Through 2008–09 Academic Years
Total Appropriations Total State Grants Total Federal Grants Total Costs
$2.95 billion $241 million $660 million $3.85 billion
8/3/2019 The Hidden Costs of Community Colleges - American Institutes for Research study
http://slidepdf.com/reader/full/the-hidden-costs-of-community-colleges-american-institutes-for-research-study 13/22
American Institutes for Research® 9
The Hidden Costs of Community Colleges
cutting back many other federal programs that
support higher education.12 But during the last ve
years, more than $650 million in federal student
aid, mostly Pell Grants, went to community college
students who dropped out after their rst year.
Table 3 presents the order of all 50 states in which
federal student grant dollars went to these students.
California spent about $24 million, and New Yorkand Texas spent about $14 million in the 2008–09
academic year. In eight other states—Florida,
Mississippi, Georgia, Illinois, New Jersey, North
Carolina, Ohio, and Alabama—the expenditures
were more than $5 million. In 10 more states, the
expenditures were $3 million or more. All together,
these expenditures represent substantial costs,
even as the federal government is struggling to meet
its commitment to America’s college students with
nancial needs.
12 Among the casualties sacriced to keep Pell Grants alive were
subsidized graduate loans, year-round Pell Grants, and Leveraging
Educational Assistance Partnership (LEAP) Grants, which provided grants
to states for need-based nancial aid. Subsidized interest on student
loans during the grace period is about to be added to this list. See, for
example, “Senate Budget Would Preserve Pell” in the September 21,
2011, issue of Inside Higher Ed at http://www.insidehighered.com/
news/2011/09/21/senate_panel_approves_education_budget_for_
scal_year_2012.
Although the federal government has made a big
investment in community colleges, state and local
government investments are far bigger. And while
federal grants to community college students
are larger than state grants, state programs still
represent a signicant investment of scarce dollars.
In short, state governments need to pay attention
to just how much they spend on community college
students who drop out during their rst year.
Table 2 highlights how much state taxpayers in all
50 states are paying for students who drop out
before their second year. Combining state grants
with state or local appropriations, eight states spent
$20 million or more in the 2008–09 academic year,
with California topping this list at $130 million. Texas
and New York came in next (although far behind),
spending $60 million and $45 million respectively
in that single year.
In the last few years, especially after the 2006–07
academic year, the federal government increased
direct student aid to students with nancial need,
mostly through Pell Grants. As the costs for this
laudable program have escalated, Congress and the
Obama administration have struggled with nding
the money needed to fund this program without
State Results

8/3/2019 The Hidden Costs of Community Colleges - American Institutes for Research study
http://slidepdf.com/reader/full/the-hidden-costs-of-community-colleges-american-institutes-for-research-study 14/22
American Institutes for Research® 10
The Hidden Costs of Community Colleges
Table 2. States in Order of Total State or Local Expenditures on First-Year Community College Students Who Subsequently
Dropped Out: 2008–09 Academic Year
State Appropriations State Appropriations
California $130,000,000 Connecticut $8,400,000
Texas $60,000,000 New Mexico $8,400,000
New York $45,000,000 South Carolina $8,200,000
Wisconsin $32,000,000 Louisiana $6,900,000
North Carolina $27,000,000 Arkansas $6,400,000
Florida $25,000,000 Indiana $6,200,000
Illinois $24,000,000 Missouri $5,300,000
Michigan $20,000,000 Nebraska $4,700,000
Alabama $17,000,000 Utah $4,500,000
Georgia $17,000,000 Wyoming $4,300,000
Maryland $17,000,000 Hawaii $3,900,000
Ohio $17,000,000 Kentucky $3,900,000
Pennsylvania $16,000,000 Colorado $2,600,000
Arizona $15,000,000 Delaware $2,500,000
Minnesota $14,000,000 Idaho $2,300,000
Mississippi $14,000,000 Maine $2,100,000
New Jersey $13,000,000 West Virginia $1,500,000
Iowa $12,000,000 Rhode Island $1,400,000
Kansas $12,000,000 Montana $1,200,000
Massachusetts $11,000,000 New Hampshire $908,000
Virginia $11,000,000 North Dakota $687,000
Washington $11,000,000 Nevada $557,000
Oregon $9,000,000 South Dakota $483,000
Tennessee $9,000,000 Alaska $112,000
Oklahoma $8,500,000 Vermont $94,000

8/3/2019 The Hidden Costs of Community Colleges - American Institutes for Research study
http://slidepdf.com/reader/full/the-hidden-costs-of-community-colleges-american-institutes-for-research-study 15/22
American Institutes for Research® 11
The Hidden Costs of Community Colleges
Table 3. States in Order of How Much Federal Student Aid Was Spent on First-Year Community College Students Who
Subsequently Dropped Out: 2008–09 Academic Year
State Federal Grants State Federal Grants
California $24,000,000 Arkansas $2,500,000
New York $14,000,000 Arizona $2,500,000
Texas $14,000,000 Louisiana $2,400,000
Florida $8,900,000 Washington $2,400,000
Mississippi $6,800,000 New Mexico $2,300,000
Georgia $6,600,000 Oregon $2,200,000
Illinois $5,900,000 Kansas $1,900,000
New Jersey $5,500,000 Colorado $1,500,000
North Carolina $5,200,000 Connecticut $1,500,000
Ohio $5,200,000 West Virginia $1,200,000
Alabama $5,100,000 Nebraska $745,000
Michigan $4,900,000 Maine $618,000
South Carolina $4,400,000 Utah $507,000
Minnesota $3,800,000 Montana $486,000
Pennsylvania $3,800,000 Idaho $479,000
Tennessee $3,600,000 Hawaii $475,000
Indiana $3,500,000 Rhode Island $443,000
Missouri $3,500,000 Wyoming $414,000
Virginia $3,500,000 Delaware $393,000
Massachusetts $3,000,000 South Dakota $319,000
Wisconsin $3,000,000 North Dakota $222,000
Iowa $2,800,000 New Hampshire $214,000
Maryland $2,800,000 Nevada $79,000
Kentucky $2,600,000 Vermont $62,000
Oklahoma $2,600,000 Alaska $9,000

8/3/2019 The Hidden Costs of Community Colleges - American Institutes for Research study
http://slidepdf.com/reader/full/the-hidden-costs-of-community-colleges-american-institutes-for-research-study 16/22
American Institutes for Research® 12
The Hidden Costs of Community Colleges
State Data Table
In this section of the report, we present state-
by-state the ve-year cumulative expenditures to
support rst-year-only community college students.
(See Table 4.) We present these data in the same
categories of expenditures used earlier in this
report: appropriations and state and federal grants
to students. In addition, we combine these numbers
for an estimate of the total costs of support for
rst-year students who subsequently dropped out.
We believe that these numbers should alert
taxpayers and their representatives to the high
costs that a state incurs when, as is unfortunately
the case, large numbers of students fail to return to
their community college for a second year.

8/3/2019 The Hidden Costs of Community Colleges - American Institutes for Research study
http://slidepdf.com/reader/full/the-hidden-costs-of-community-colleges-american-institutes-for-research-study 17/22
American Institutes for Research® 13
The Hidden Costs of Community Colleges
Table 4. Five-Year Cumulative Expenditures on First-Year-Only Community College Students, by State: 2004–05
Through 2008–09 Academic Years
State Appropriations State Grants Federal Grants Combined Costs of Attrition
Alabama $80,000,000 $4,200,000 $20,000,000 $100,000,000
Alaska $345,000 $6,000 $27,000 $378,000
Arkansas $32,000,000 $1,600,000 $11,000,000 $44,000,000
Arizona $56,000,000 $468,000 $9,200,000 $65,000,000
California $390,000,000 $25,000,000 $64,000,000 $480,000,000
Colorado $9,200,000 $2,600,000 $6,800,000 $19,000,000
Connecticut $38,000,000 $994,000 $5,200,000 $44,000,000
Delaware $13,000,000 $847,000 $1,500,000 $15,000,000
Florida $140,000,000 $16,000,000 $36,000,000 $190,000,000
Georgia $92,000,000 $18,000,000 $21,000,000 $130,000,000
Hawaii $15,000,000 $115,000 $1,700,000 $17,000,000
Idaho $10,000,000 $274,000 $2,100,000 $13,000,000
Illinois $110,000,000 $8,600,000 $22,000,000 $140,000,000
Indiana $27,000,000 $2,900,000 $10,000,000 $40,000,000
Iowa $49,000,000 $1,100,000 $11,000,000 $62,000,000
Kansas $56,000,000 $174,000 $7,800,000 $64,000,000
Kentucky $19,000,000 $5,400,000 $12,000,000 $37,000,000
Louisiana $34,000,000 $1,500,000 $9,400,000 $45,000,000
Maine $11,000,000 $1,000,000 $2,800,000 $15,000,000
Maryland $75,000,000 $2,400,000 $9,900,000 $87,000,000
Massachusetts $57,000,000 $4,100,000 $11,000,000 $73,000,000
Michigan $100,000,000 $7,700,000 $18,000,000 $130,000,000
Minnesota $71,000,000 $7,500,000 $17,000,000 $95,000,000
Mississippi $67,000,000 $1,900,000 $29,000,000 $98,000,000
Missouri $25,000,000 $5,400,000 $13,000,000 $43,000,000
Montana $5,500,000 $626,000 $2,300,000 $8,500,000
Nebraska $23,000,000 $348,000 $3,700,000 $27,000,000
Nevada $7,400,000 $440,000 $967,000 $8,800,000New Hampshire $4,300,000 $422,000 $860,000 $5,600,000
New Jersey $67,000,000 $11,000,000 $20,000,000 $98,000,000
New Mexico $39,000,000 $2,100,000 $8,600,000 $50,000,000
New York $200,000,000 $34,000,000 $53,000,000 $290,000,000
North Carolina $130,000,000 $4,300,000 $20,000,000 $150,000,000
North Dakota $4,800,000 $237,000 $1,400,000 $6,500,000
Ohio $80,000,000 $8,500,000 $21,000,000 $110,000,000
Oklahoma $42,000,000 $3,400,000 $12,000,000 $57,000,000
Oregon $49,000,000 $2,200,000 $7,700,000 $58,000,000
Pennsylvania $70,000,000 $3,100,000 $14,000,000 $87,000,000
Rhode Island $7,600,000 $311,000 $1,500,000 $9,400,000
South Carolina $46,000,000 $16,000,000 $17,000,000 $79,000,000
South Dakota $3,100,000 $160,000 $1,400,000 $4,700,000Tennessee $45,000,000 $7,500,000 $14,000,000 $67,000,000
Texas $290,000,000 $12,000,000 $59,000,000 $360,000,000
Utah $20,000,000 $439,000 $2,200,000 $22,000,000
Vermont $399,000 $67,000 $249,000 $717,000
Virginia $47,000,000 $3,100,000 $12,000,000 $62,000,000
Washington $52,000,000 $5,600,000 $8,700,000 $66,000,000
West Virginia $6,300,000 $1,100,000 $4,600,000 $12,000,000
Wisconsin $110,000,000 $4,100,000 $10,000,000 $130,000,000
Wyoming $19,000,000 $854,000 $1,800,000 $21,000,000

8/3/2019 The Hidden Costs of Community Colleges - American Institutes for Research study
http://slidepdf.com/reader/full/the-hidden-costs-of-community-colleges-american-institutes-for-research-study 18/22
American Institutes for Research® 14
The Hidden Costs of Community Colleges
Reducing theHidden Costs of LowCommunity College
Retention andCompletion Rates
of choice among courses that students currently
have. Complete College America, for example, calls
for block schedules, with xed and predictable
classroom meeting times, so that students know
with certainty when they need to be on campus
and when they can go to work. The report also calls
for shorter academic terms, less time off between
terms, and year-round scheduling.
Shortening the time to degree completion by allowing
students to earn credits for proven competencies
rather than simply through seat time is another
reform that is gaining attention. This approach is
central to the philosophy of Western Governors
University, which has entered into agreements
with a number of states to provide postsecondary
degrees online. Competency-based education also
is central to the practices of Valencia College, a
highly successful community college in Florida, with
a three-year graduation rate almost twice as high as
the national average for community colleges.
Harnessing technology is commonly called upon
as a way forward. Combining adaptive learning,
adaptive testing, and social media into new “hybrid”
learning platforms looks especially promising, and
Community colleges are a key part of America’s
system of higher education and must play a central
role in fullling the nation’s effort to increase the
education level of its population. Part of their appeal
is their perceived low price to students. However,
this report shows that something that seems so
inexpensive can in fact be very costly, once we take
into account the low levels of student success.
As the evidence mounts regarding high costs to
students and taxpayers, improving the ef ciency and
effectiveness of community colleges is becoming
increasingly important. More effort is being
expended to identify avenues that could increase
student success and reduce costs.
One of the most powerful calls for changing business
as usual is the recent report Time Is the Enemy 13 by
Complete College America. In this repor t, Complete
College America identies several changes in the
way in which higher education is organized that could
create faster and shorter pathways to completion.
The called-for reforms would change the very way in
which courses are scheduled and limit the extent
13 Time Is the Enemy is available online at http://www.completecollege.
org/docs/Time_Is_the_Enemy.pdf.

8/3/2019 The Hidden Costs of Community Colleges - American Institutes for Research study
http://slidepdf.com/reader/full/the-hidden-costs-of-community-colleges-american-institutes-for-research-study 19/22
American Institutes for Research® 15
The Hidden Costs of Community Colleges
information can change consumer preferences,15
but such information is in short supply.
Finally, a word of caution: The national movement to
reform higher education’s business and instructional
models is in the early stages. Much is yet to be
learned. Indeed, if the history of other education
reforms is a prologue to the future, many of the
innovations that the nation is now pursuing will likely
prove to be ineffective when subjected to rigorous
testing in the complicated and dif cult world of
community colleges. But today, new ideas and new
energy are being focused on xing the undeniable
problem of low community college retention and
completion rates. And as this report shows, perhaps
the only thing more expensive than fixing this
problem is not xing it.
15 See Andrew P. Kelly and Mark Schneider, Filling in the Blanks:
How Information Can Affect Choice in Higher Education, available at
http://www.aei.org/docLib/ llingintheblanks.pdf.
Carnegie Mellon’s Open Learning Initiative is often
singled out as the current “best in class.” Although
technological xes have been used previously, the
current environment seems to hold promise byincreasing exibility and personalizing the rate at
which students attain necessary skills.
One of the most consistently identied barriers
to higher persistence and graduation rates is the
number of community college students in need of
remediation. Simply put, the current approach to
remediation has not worked, leading to calls for new
and more effective approaches. Statway, created
by the Carnegie Foundation for the Advancement
of Teaching, is a promising approach to remedial
mathematics education.14 Built on the premise that
statistics, data analysis, and quantitative reasoning
are essential for a growing number of occupations
and professions, Statway’s hope is that this focus
will lead to more engagement by students and
increased student success.
States also need to create incentives to improve
community college retention and completion rates.
Today, one of the most common approaches is
to introduce performance budgeting—rewarding
colleges with more money if they improve the
success of their students. This approach began
with Tennessee in the mid-1970s but has recently
gained momentum, with as many as half the states
experimenting with various formulas for rewarding
institutional performance.
Finally, while Complete College America should be
commended for its giant step forward in creating
better metrics of student success, data collection
and data dissemination are still in the dark ages.
Students, their families, taxpayers, and governmentof cials all need better information about student
learning, the true costs of producing certicates and
associate’s degrees, and the labor market success
of graduates from programs and campuses. Accurate
14 For more information on Statway, see http://www.carnegiefoundation.
org/statway/.

8/3/2019 The Hidden Costs of Community Colleges - American Institutes for Research study
http://slidepdf.com/reader/full/the-hidden-costs-of-community-colleges-american-institutes-for-research-study 20/22
American Institutes for Research® 16
The Hidden Costs of Community Colleges
Technical Appendix
is well known, this survey is focused on rst-time,
full-time, degree- or certicate-seeking, beginning
students, which is only a proportion of students
enrolled in community colleges—and the ones most
likely to persist and graduate.
IPEDS does not differentiate between students who
dropped out and students who transferred into a
four-year institution or another community college atthe one-year mark; however, we needed to estimate
that number for our analysis. To do so, we employed
data from the most recent wave of BPS, a nationally
representative sample that tracks students through
postsecondary education. We used BPS data to
distinguish between dropouts and transfers in the
GRS cohort at the end of each year. BPS does not
allow us to estimate these numbers at the individual
campus level, so we created overall estimates
separately for public, not-for-prot, and for-prot
sectors. We then applied these sector estimates
to campus counts obtained from IPEDS.
To calculate the cost of rst-year attrition in community
colleges, we needed to estimate the number of rst-
year dropouts from each institution. To do so, we
used data from the U.S. Department of Education’s
Integrated Postsecondary Education Data System
(IPEDS)16 and the Beginning Postsecondary Students
(BPS) Longitudinal Study.17 We focused on public,
two-year, degree-granting institutions of higher
education (“community colleges”) that participate
in Title IV federal student nancial aid programs.
We classified students into four categories at
the end of their rst year at a community college:
Enrolled, Graduated, Dropped Out, or Transferred.
We obtained data on the size of cohort and number
of students graduated or still enrolled by institution
from the IPEDS Graduation Rate Survey (GRS). As
16 The IPEDS website is available at http://nces.ed.gov/ipeds/.
17 The Beginning Postsecondary Students Longitudinal Study (BPS)
surveys cohorts of rst-year, beginning students at the end of their rst
year, and then three and six years after rst starting in postsecondary
education. It collects data on student demographics, school and work
experiences, persistence, transfer, and degree attainment. The BPS
website is available at http://nces.ed.gov/surveys/bps/.

8/3/2019 The Hidden Costs of Community Colleges - American Institutes for Research study
http://slidepdf.com/reader/full/the-hidden-costs-of-community-colleges-american-institutes-for-research-study 21/22
American Institutes for Research® 17
The Hidden Costs of Community Colleges
in school and complete their associate’s degrees.18
Hence, our estimates of the cost of attrition are
likely far lower than a full accounting would produce.
It is important to remember that all estimates are
based on data from individual campuses reported
to IPEDS with an adjustment based on national data
from BPS. State numbers reported in this study are
based on aggregating individual campus-level data
to the state level and are not based on state-level
analysis. It may be possible to improve the individual
campus-level predictions, with more complex models
combining detailed BPS student-level estimates with
IPEDS campus-level data; however, at this stage of
our analysis of community colleges, we used overall
national patterns for community colleges from BPS
to adjust campus IPEDS numbers.
Finally, although we presented results at state and
the national levels, estimates for every two-year
college that participates in IPEDS are available
through CollegeMeasures.org at http://www.
collegemeasures.org.
18 Complete College America documents the low graduation rates of
part-time students. According to the report Time Is the Enemy , only 7.4
percent earn a two-year degree in four years and only 11.8 percent earn
a one-year certicate within two years. See http://www.completecollege.
org/docs/Time_Is_the_Enemy.pdf.
In the most recent BPS, more than 5,500 students
were enrolled in public two-year colleges; by the end
of their rst year, 69.7 percent were still enrolled,
7 percent had graduated with an associate’s degree,1.7 percent had earned certicates, 16.7 percent
had transferred to a different institution without
obtaining a degree, and 11.1 percent had dropped
out without obtaining a degree. We combined these
last two numbers (27.8 percent) to estimate the
number of students who left their community college.
We calculated that approximately 40 percent of the
students (11.1 percent/27.8 percent) who failed to
return to their institution for the second year dropped
out. We then applied this ratio to our IPEDS data to
estimate the number of dropouts at the end of year
one for each of 1,058 two-year public colleges and
for each academic year, starting with 2004–05 and
ending with 2008–09.
The second task of this report was to estimate the
cost to taxpayers for educating a student attending
a two-year public community college for one year.
We focused on several key sources of government
support: direct state and local appropriations to the
campus, federal grants to students, and state grants
to students. IPEDS also reports the total numberof full-time equivalent (FTE) students on each
campus, and we divided total appropriation and
grants by total FTE.
We multiplied these FTE measures by the total
number of dropouts to estimate the cost of rst-
year attrition. Other sources of government support
(such as direct federal appropriations or capital
expenditures were not included in our calculations).
In addition, we focused on first-time, full-time,
beginning students who are most likely to remain

8/3/2019 The Hidden Costs of Community Colleges - American Institutes for Research study
http://slidepdf.com/reader/full/the-hidden-costs-of-community-colleges-american-institutes-for-research-study 22/22