Embed Size (px)
Citation preview
The Hidden Costs and Lasting Legacies of Violence onEducation: Evidence from Colombia
Valentina Duquea
aSchool of Social Work, Columbia University, 1255 Amsterdam Avenue, NYC, NY 10027
Abstract
This paper studies the medium- to long-term effects of exposure to violence inearly childhood (in-utero to age 5) on educational outcomes. To study this ques-tion, this paper exploits the massive escalation of violence and crime in Colombiain the 1980s and 1990s. Results show that one standard deviation increase in thehomicide rate, in at least one year during early life, is associated with 0.1 feweryears of education, with a 1-percentage-point decline in school enrollment and a3-percentage-point increase in the probability that a child is behind grade. Thefindings also show that in utero and early-childhood exposure to violence has amore pronounced impact on human capital attainment than exposure at otherstages of the life course (i.e., school age, adolescence). Furthermore, extensiverobustness tests provide little evidence that selective sorting, mobility, fertility,or survival could drive estimates of violence on education.
Keywords: Education, Early-life shocks, Violence, Human developmentJEL: J13, I20, D74, O15
Email address: [email protected] (Valentina Duque)
Preprint submitted to Elsevier August 23, 2014
One of the most pressing problems faced by developing countries is highcrime and violence. In Latin America, for example, crime and violence havereached “epidemic levels”—the homicide rate is over 0.1 homicides per thou-sand inhabitants—making it the world’s most violent region (United Nations,2013). A decline in human capital is a particularly destructive consequenceof violence on individuals—extending beyond direct human losses, injuries, andproperty damage—that can lead to poverty and inequality through its effects onwages and productivity (Mincer, 1974; Schultz, 1961; Becker, 1962). Therefore,studying how violence affects human capital is important.
Early childhood is especially relevant to study as education during the firstyears of life sets children on their path for future outcomes. Violence exposure inthe early stages could lead to large deficits that are difficult to reverse. Althoughthe evidence on the short- (and medium-) term impacts of violence exposure oneducation and health is growing, there is a relative dearth of empirical evidenceon how these shocks extend over time.
This study examines the long-term impacts of exposure to crime and vi-olence, from the prenatal period to age five, on an individual’s educationalattainment. I focus on Colombia, which has experienced enormous changesin its homicide rate in the last three decades, in both urban and rural areas,due to the proliferation of organized crime (from the late-1980s to mid-1990s)and the recrudescence of its 50-year-long low-intensity armed conflict (from themid-1990s to mid-2000s). From 1980 to 2002, the homicide rate in Colombiawent from 0.2 homicides per every 1,000 inhabitants to almost 0.9 (an increaseof more than 300%), and from 2002 to 2010 it declined to approximately 0.4homicides per every 1,000 inhabitants (a decline of approximately 55%).
The identification strategy I use in this paper exploits the temporal andgeographic variation in cohorts of individuals exposed to high crime and violencein Colombia in their early lives. Using Census-2005’s detailed information onthe date and municipality of birth, and long-run outcomes (i.e., education) foreach individual, I am able to identify the violence to which a person was exposedin utero and in early childhood (as well as in later stages). I estimate modelsthat control for a rich set of variables including geographic and time fixed-effectsand trends, as well as models that account for sibling fixed-effects, to providerigorous evidence of the effects of violence on education. Results show that anincrease of one standard deviation in violence in at least one year in early-life,is associated with 0.1 fewer years of schooling, a 1-percentage-point decline inschool enrollment, and a 2-percentage-point increase in the probability that achild is behind grade. So an individual who is exposed to more than one year ofhigh homicide rate in early-life can experience up to 0.4 fewer years of schoolingas an adult, than someone who was not exposed. Similarly, school enrollmentcould decrease by almost 4 percentage points and being behind grade couldincrease up to 6 percentage points. These findings are important consideringthe huge inequality in education in developing countries.
Results are robust to an extensive set of falsification tests and analyses ofpotential sources of selection bias. I find no placebo effects of homicide ratesthree (and four) years prior to birth, providing support for the validity of the
2
identification strategy. While the results are conditional on survivorship and onindividuals remaining in the country, they do not seem to be driven by selectionon sorting, mobility, fertility, survival, or other unobserved time-varying factorsassociated with violence that could affect educational attainment.
The study contributes to previous research in several ways. First, it providesnew findings on the relatively understudied link between violence exposure in thefirst years of life and long-term human capital outcomes, as most studies havefocused on school-age exposure to violence (6–17 years of age Shemyakina, 2011;Akresh and de Walque, 2011; Chamarbagwala and Moran, 2011; Rodriguez andSanchez, 2012). Focusing on exposure in early-life is important given recentresearch showing that adverse experiences in utero and in early childhood af-fect an individual’s long-term socioeconomic success (Barker, 1998; Cunha andHeckman, 2007; Almond and Currie, 2011a,b). Second, by exploring how vio-lence over the life course, from in utero to adolescence, affects education, thispaper shows that in-utero and early-childhood exposure has a more pronouncedimpact on human capital than exposure at other stages (i.e., school-age, ado-lescence, etc.). This finding is particularly relevant considering that, althoughprior research has demonstrated the negative impact that exposure to violencehas on individuals, to date, no research has studied whether violence at a par-ticular developmental time has more pronounced impacts on later-life outcomes.From a policy perspective, targeting interventions to children who were exposedto violence in early childhood might be more efficient in terms of costs and ben-efits than targeting them at other stages (Doyle et al., 2009). Third, I use anarguably more objective measure of violence—the homicide rate– than thoseemployed in previous literature that usually lack temporal or geographic vari-ation, or that rely on victims self-reports of damages and loses during wars.By using homicide rates, I can identify with more precision changes in violenceexposure in key developmental stages such as in-utero and in each year of anindividual’s life from age 0 to 5 (and up to age 17). Fourth, while most ofthe previous literature has focused on civil wars or internal conflicts, this paperalso considers the effects of violence originating from the escalation of urbancrime—associated with the consolidation of the drug cartels in the late 80s andearly 90s that mostly affected urban populations in Colombia (Levitt and Rubio,2000). Thus, the results of this paper could extend to other settings with highcrime and violence but without massive forms of violence such as a civil war.One example is the case of Mexico, which has recently experienced a dramaticincrease in the level of crime associated with the drug-business.
The remainder of the paper is organized as follows. Section 1 presents thetheoretical predictions and a brief description of the existing literature anddescribes the nature of the violence in Colombia. Sections 2 and 3 presentthe data and the empirical strategy, respectively. Section 4 shows the findingson the long-term impacts of violence on education. Lastly, Section 5 performssome robustness tests to show that the results can be interpreted as lower-boundestimates of the impact of violence, and Section 6 provides a brief conclusion.
3
1. Background
In this section, I describe some of the literature on the effects of violence ex-posure on educational outcomes and on the potential mechanisms through whichviolence could affect education. I also present a brief description of violence inColombia.
1.1. Early-Life Violence Exposure and Human Capital
A growing body of evidence documents that adverse conditions before agesix can have persistent impacts on later-life well-being (Barker, 1998; Cunhaand Heckman, 2007; Almond and Currie, 2011a,b). Several studies have shownthat exposure to famines and malnutrition, weather shocks, disease and pan-demics, radiation fallout, and pollution in-utero and during the first years of lifereduce adult health, educational attainment, and wages (Aguilar and Vicarelli,2012; Almond, 2006; Almond et al., 2009; Maccini and Yang, 2009; Almond andMazumder, 2011; Van den Berg et al., 2007, 2012). Based on this evidence, it isreasonable to expect that cohorts exposed to the huge increase in homicide ratesin Colombia that occurred during their early lives would experience a decline inlater-life human capital.
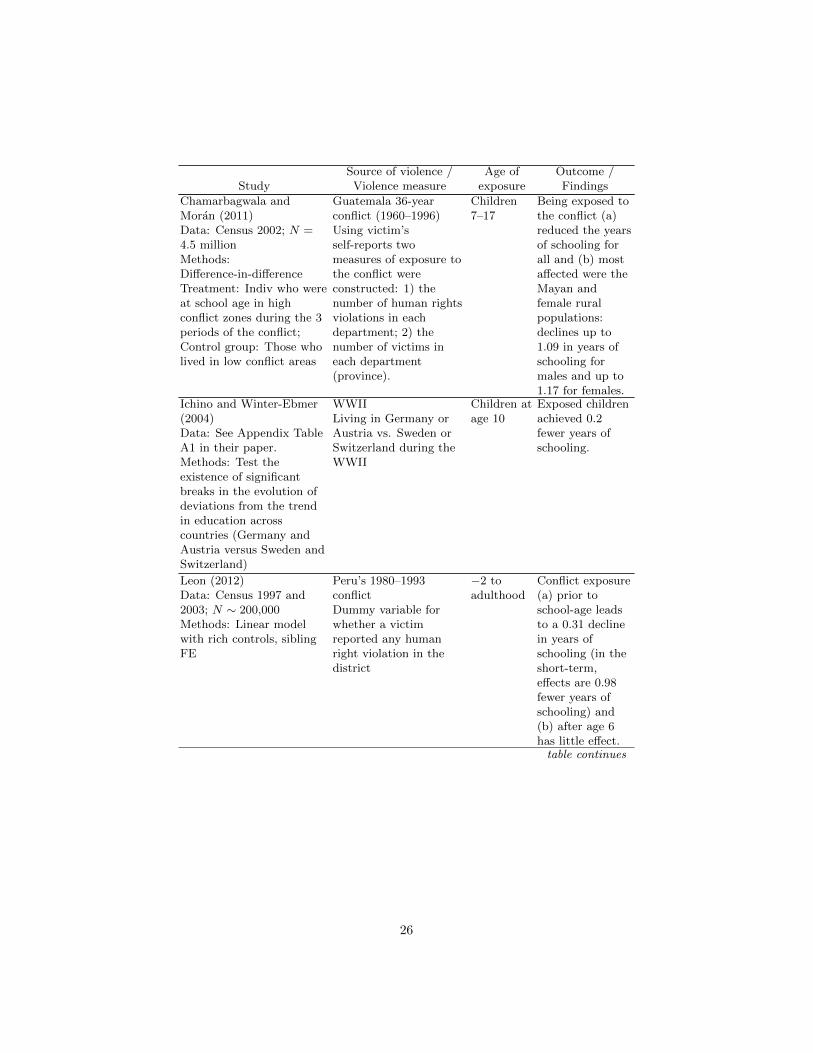
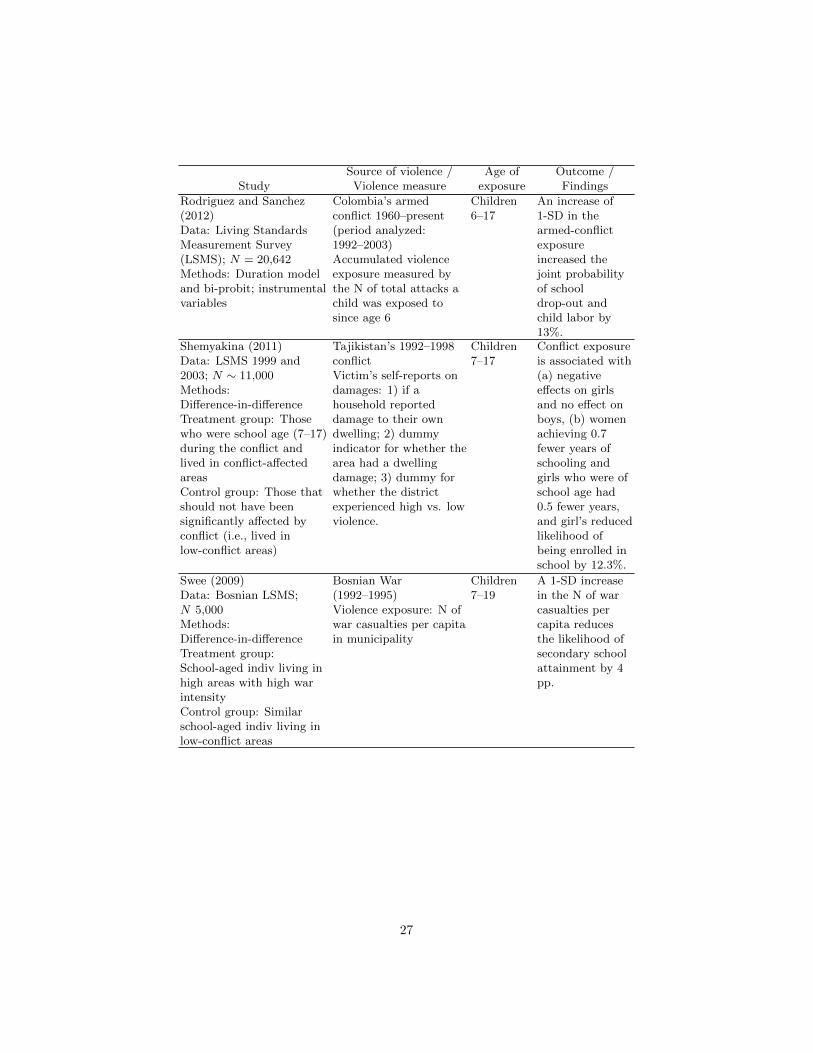
Table 1 provides an overview of the studies investigating the relationshipbetween violence shocks and education. As the table shows, these studies haveconsistently found a negative association. By comparing children exposed towars (or conflicts) in the area of residence with non-exposed children, Akresh andde Walque (2011) found effects around 0.5 fewer years of education (Rwanda);Shemyakina (2011) found 0.6 (Tajikistan); Rodriguez and Sanchez (2012) found0.2 (Colombia); Chamarbagwala and Moran (2011) found impacts between 0.12and 1.09 (Guatemala); Akbulut-Yuksel (2011) found 0.4 (Germany), and Leon(2012) estimated an effect of at least 0.3 fewer years of schooling (Peru). Othershave found that violence reduces school enrollment (Bosnia) Swee (2009) andincreases grade failure (Mexico) Caudillo and Torche (2014).
Moreover, previous literature has mostly focused on armed conflicts or civilwars that represent huge episodes of mass mortality (see column 2 in Table1).While these are important shocks to analyze, little research has explored theeffects of other forms of less-extreme violence such as urban crime that canalso impose huge costs to individuals and that are relatively more common. Inaddition, the measures used in previous literature to model changes in violence(also shown in column 2), have mostly relied on either geographic or temporalvariation, or on self-reports of victims of war that have a number of limitations.Lastly and most importantly, these studies have exclusively focused on exposuresthat occur after age 5 (see column 3 in Table1).
Compared with previous literature, this paper makes several contributions:First, this is one of the first papers to study the long-term effects of early-lifeexposure to violence on future educational outcomes and provide evidence thatin-utero and early childhood violence shocks have a more pronounced impact
4
than shocks experienced at other developmental stages of life.1. This paper isalso the first to study the links between early-life exposure and long-term edu-cational outcomes using an objective measure of violence—the homicide rate.2
Several studies have used victim’s own reports of human rights violations duringperiods of war—which are likely to suffer from bias as individuals who self-reportare likely to be selective—or have employed violence measures that provide littlespatial or temporal variation which limits their ability to identify the effects ofshocks of this nature from other confounding factors (Leon, 2012; Shemyakina,2011). By using municipal-level homicides in a given year, I am able to ex-amine the effect of violence in each specific year over the life course, providingmore accurate evidence of the relationship between education and violence thanprovided by the prior research. I also add to the literature by using data onColombia that incorporates two sources of violence—urban crime and armedconflict—so I am able to exploit greater variation in the homicide rate acrossgeographic units and years. Lastly, this paper moves forward from previousresearch by performing an extensive analysis of selection related to endogenoussorting, mobility, fertility, and survival, as well as falsification tests that allowme rule out the presence of confounding factors, trends, and potential sourcesof bias.
[Table 1 around here]
1.2. Potential Pathways through Which Violence Could Affect Educational Out-comes
The literature has documented several mechanisms through which violenceexposure in early life could reduce educational outcomes. First, it could limitthe amount and quality of resources in the local community (supply-side mech-anisms) available for child human capital formation. For example, high vio-lence can disrupt the economy (i.e., reduce household economic resources Minoiuand Shemyakina, 2014), destroy infrastructure (e.g., hospitals, schools Akbulut-Yuksel, 2011), reduce the quality of public services (exodus of medical doctors,teachers Leon, 2012; Rodriguez and Sanchez, 2012), and limit investments (e.g.,during wars, resources are shifted away from education and health to militaryspending).
1Another group of studies has explored the effects of violence shocks on health outcomes,concentrating on the in-utero and early-childhood stages (Camacho, 2008; Mansour and Rees,2012; Valente, 2011; Akresh et al., 2012). However, as in the case of the literature on education,little is known about the long-term consequences of this early-life exposure.
2Homicides are the most common offense associated with a conflict and with urban crime,and they are the primary threat to the civilian population. Homicide rates are highly cor-related with the occurrence of other terrorist actions, such as attacks, explosions, landmineexplosions, and abductions (Sanchez and Nunez, 2007), and they are more reliable than othermeasures of crime, which are not always registered by the police (Levitt and Rubio, 2000).Alderman et al. (2006) also explore the effects of early-life exposure to violence. However, thefocus of their paper is to analyze the link between early-life malnutrition and future humancapital. They employ an instrumental-variable approach that models child malnutrition withcivil war and drought exposure in Zimbabwe.
5
Second, since this paper focuses on violence in early life, an important mech-anism by which violence could reduce education operates through maternalhealth, nutrition, and stress. The fetal-origins hypothesis predicts that changesin the prenatal environment can “program” the fetus in ways that can affectadult health (Barker, 1998). Nutritional deprivation and chronic stress in preg-nancy can lead to significant declines in fetal and newborn health and cognitiveoutcomes through changes in the immune and behavioral systems, which mayin turn lead to permanent alterations in the body’s systems (Denckel-Schetter,2011; Gluckman and Hanson, 2005). For instance, Aizer et al. (2012) found thatin-utero exposure to elevated levels of cortisol, negatively affects the cognition,health, and educational attainment of the offspring.
Third, stress at later stages may compromise the family environment throughits effects on parental mental health and family relationships, which are likelyto affect human capital outcomes (Campbell et al., 1991). Fourth, violencecould also increase the risk of malnutrition. Recent studies have shown thatearly exposure to war reduces birth weight (e.g. Camacho, 2008; Mansour andRees, 2012; Brown, 2014) and height-for-age (Valente, 2011; Akresh et al., 2012;Bundervoet et al., 2009). Others have found that malnutrition in childhood(i.e., low height-for-age) is associated with delayed school enrollment, fewergrades attained, and lower probability of enrolling in school (Glewwe et al.,2001; Bundervoet, 2012; Alderman et al., 2006).
1.3. Colombia’s Recent Violent History
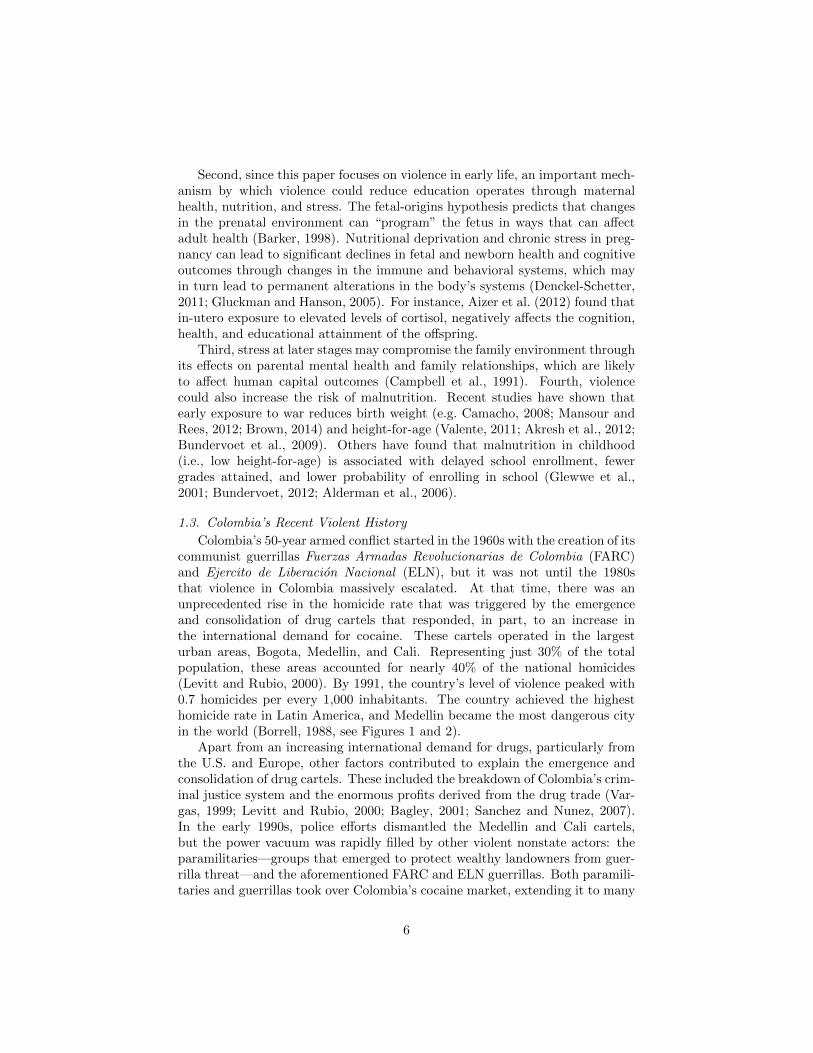
Colombia’s 50-year armed conflict started in the 1960s with the creation of itscommunist guerrillas Fuerzas Armadas Revolucionarias de Colombia (FARC)and Ejercito de Liberacion Nacional (ELN), but it was not until the 1980sthat violence in Colombia massively escalated. At that time, there was anunprecedented rise in the homicide rate that was triggered by the emergenceand consolidation of drug cartels that responded, in part, to an increase inthe international demand for cocaine. These cartels operated in the largesturban areas, Bogota, Medellin, and Cali. Representing just 30% of the totalpopulation, these areas accounted for nearly 40% of the national homicides(Levitt and Rubio, 2000). By 1991, the country’s level of violence peaked with0.7 homicides per every 1,000 inhabitants. The country achieved the highesthomicide rate in Latin America, and Medellin became the most dangerous cityin the world (Borrell, 1988, see Figures 1 and 2).
Apart from an increasing international demand for drugs, particularly fromthe U.S. and Europe, other factors contributed to explain the emergence andconsolidation of drug cartels. These included the breakdown of Colombia’s crim-inal justice system and the enormous profits derived from the drug trade (Var-gas, 1999; Levitt and Rubio, 2000; Bagley, 2001; Sanchez and Nunez, 2007).In the early 1990s, police efforts dismantled the Medellin and Cali cartels,but the power vacuum was rapidly filled by other violent nonstate actors: theparamilitaries—groups that emerged to protect wealthy landowners from guer-rilla threat—and the aforementioned FARC and ELN guerrillas. Both paramili-taries and guerrillas took over Colombia’s cocaine market, extending it to many
6
rural areas, and escalated the armed conflict to one of its bloodiest stages duringthe latter half of the 1990s and early 2000s.
From 2002 to 2010, the dynamic of the conflict changed. After the fail-ure of the peace dialogues with FARC in 2001, the government implementednew military strategies to combat the guerrillas and destroy their illicit crops(Pizarro, 2011). Many combatants from FARC quit fighting, the governmentgained control in many rural areas, and the paramilitaries demobilized. Thenew government actions lead to a drop in the homicide rate that can be seenin Figures 1 and 2. In spite of significant military and police improvements, bythe end of the 2000s Colombia was still a violent country, ranked fifth in theworld by violent deaths per capita (Declaration, 2011). In this study, I exploitthe large variation in violence across municipalities and over time to estimatethe effect of violence on education.
2. Data
To investigate the effects of violence on education, I use 2005 Census dataobtained from IPUMS-International (MinnesotaPopulationCenter2011). TheCensus includes a representative sample of four million individuals, accountingfor 10% of the total population, and provides rich demographic and socioeco-nomic information on each member of the household. One virtue of using theCensus is that it reports the municipality3 and date of birth for each individual,and the municipality where an individual’s mother lived while she was pregnant.This information enables me to identify the level of violence to which a personwas exposed in-utero. Since I cannot identify the individual’s exact locationafter birth, I assume that a person’s location during early childhood is the sameas his/her municipality of birth. I discuss how selective migration might affectmy results in the Robustness Checks section (5).
Data on violence come from the National Police Department and include allhomicides that occurred in each of the 1,100 municipalities in Colombia since1979.4 The homicide rate is defined as total number homicides per thousandinhabitants in a municipality in a year.
The outcome of interest in this study is educational attainment. I considerthree measures:
1. Years of schooling, a discrete variable, indicates the total number of com-pleted years of education that an individual has attained. This outcomeis measured for adults between 19 and 23 years of age. I focus on this
3Colombia has 1,100 municipalities, less than half of which have populations of less than20,000 inhabitants. The Census groups these low-population municipalities into larger entities,making the total number of municipalities in the Census 532. Combining municipalities inthis manner does not represent a problem for data analysis since each municipality in thegrouped areas is clearly identified.
4This study uses data from the Vital Statistics Death Records and contrasts these numberswith homicide records from the National Police Department, thereby making the violencemeasure used here more reliable.
7
age group (the oldest age group in my sample) since the data on violencebegins in 1979.
2. School enrollment, a dummy variable, takes the value of one when a childis reported to be attending an academic institution and zero otherwise.This outcome is measured for children aged 14 to 18 years.
3. Child is behind grade, a dummy variable, takes the value of one whena child’s age minus his/her years of education is more than six (the ageat which by law all children must be enrolled in first grade of primaryeducation General Education Law in Colombia, 1994); and zero otherwise.This outcome is measured conditional on being enrolled in school for thosebetween 14 and 18 and it reflects whether a child is not on track in theschool cycle.
Table 2 presents descriptive information on the sample composition of youngadults and children. Results show that the average years of schooling for thesample 19 to 23 years of age is 8.3 and 63% of those between 14 and 18 areenrolled in school, of whom 40% more than half are behind grade. In terms oftheir demographic and socioeconomic characteristics, 81% are White, 10% areBlack, and 6.5% are indigenous populations. Table 2 also provides informationon mothers’ characteristics for the sample of 14- to 18-year-olds—those morelikely to live with their parents. Mothers are 44 years of age, 82% are White,11% are Black, and 7% are of indigenous descent. Less than 45% of mothersare married, 33% cohabitate, 8% are single, and 14% are either divorced orwidowed. As expected from the general population, the sample is highly urban,almost 60% of mothers live in urban areas. Lastly, Table 2 shows the GDP percapita (1.35 million pesos5), the average years of schooling of education of theadult population (those of age 30) in each municipality and year (6.21), and theaverage homicide rate to which children and young adults in the sample wereexposed to in their early life (0.51 homicides per 1,000 inhabitants).
[Table 2 around here]
Table 2 also shows the descriptive characteristics by whether children wereexposed to high or low violence in early life. High (low) violence is defined aswhether an individual was exposed to an average homicide rate above (below)the average homicide rate in the period of interest which was 0.51 homicides per1,000 inhabitants. These differences suggest that children tend to have betteroutcomes if they were exposed to less violence in their early-life. For example,young adults report more years of schooling and children are more likely to beenrolled in school if they lived in less-violent areas decades ago. Children arealso more likely to be behind grade if they were exposed to low-violent in theirearly lives. Mothers of children exposed to high homicide rates are more likelyto be White and less likely to be Black or a member of an indigenous group.Perhaps the most striking difference is that mothers of high-violence-exposed
5The exchange rate is approximately 2,000 pesos = $1 US.
8
children are more educated and are more likely to be single. Lastly, differencesat the regional level indicate that violent areas are also wealthier and have aslightly less-educated population (although this difference is very small). Thesedifferences in the raw data point to the importance of controlling for individualand maternal characteristics (in addition to time and geographic factors) inorder to identify the effect of violence on education.
3. Methods
In the absence of experimental data, this study relies on exploiting the tem-poral and spatial variation in cohorts exposed to Colombia’s violent conflict.The validity of this method depends on the assumption that changes in violencewithin municipality–year are uncorrelated with other determinants of educa-tional outcomes. While this assumption cannot be tested directly, I will provideindirect evidence that this assumption holds and that it is feasible to estimatethe impact of violence on education using this approach.
I use two empirical models. The first is a linear model that controls for a richset of covariates and municipality, year, and month of birth fixed-effects, anddepartment (equivalent to a state in the U.S.) time trends. The second accountsfor sibling fixed-effects. Controlling for sibling fixed-effects helps remove thepotential bias associated with both the probability that a family resides in areasprone to violence and with low parental investment in education. For the binaryoutcomes, school enrollment and whether a child is behind grade, I employ alinear probability model and a linear probability model with sibling fixed-effects,respectively.6 The following equation describes the linear specification:
Yimjdtb = β0 +γkViolencej,t+k +X ′imβ1 +Z ′
jdtβ2 +αj +αt +αb +µd(t)+εimjdtb,(1)
where the subscript i refers to an individual, m to the mother, j municipality ofbirth, d department of birth, t year of birth, and b month of birth. The variableY denotes the educational outcome. The term Violence represents the homiciderate observed in municipality of birth j and year of birth t for each individualand will denote the level of violence to which that individual was exposed to atbirth. The subscript k takes the value of -3, -2, -1, 0, 1, 2,..., 5, representing eachyear of age, from (prior to) birth to age 5.7 So for instance, the homicide rate towhich an individual was exposed to at age 1 will be given by the homicide rateobserved in year t+ 1 where k takes the value of 1. X is a matrix of individualand maternal characteristics that includes dummies for child’s gender, child’sand mother’s race (White, Black, indigenous, unknown), mother’s age (less than26, 26–35, 36–45, 46–55, more than 55), education (less than primary, primary,
6Using other functional forms such as a logistic regression provided marginal effects thatwere almost identical in magnitude to those obtained from the linear probability models.
7The period t = −2 will capture the effects of a violence shock experienced prior to con-ception on the mother’s health or on the household’s welfare, which in turn may affect healthduring pregnancy (Camacho, 2008; Leon, 2012).
9
secondary, more than secondary), marital status (married, cohabiting, divorced,widowed, single, unknown), and an indicator for whether the household is urbanversus rural. Z is a vector that includes economic controls such as the GDPper capita at the department level8 and a proxy for investments in education atthe municipality level.9 These regional measures help to account for differencesin economic development and educational investments across municipalities anddepartments. The terms αj , αt, and αb are vectors of municipality, year, andmonth-of-birth fixed-effects, respectively, and ε is the random error term. Themunicipality fixed-effects control for any time-invariant municipality level fac-tors correlated with both violence conditions and with the provision and qualityof education. The year and month of birth fixed-effects will absorb year andmonth-specific factors that could affect both the whole economy and an individ-ual’s education. They also control for national time trends in the dynamics ofviolence. µd(t) is a flexible department-specific (cubic) time trend intended tocapture differences in long-term development and in the outcomes over time andacross departments. Errors are clustered at the year and municipality levels toaccount for the within-municipality-year serial correlation in the observations.The key coefficient of interest is γk. I estimate Equation 1 separately for eachspecific year of exposure to violence in early-life.
To estimate sibling fixed-effects models, I use Equation 2. The only co-variates included in this model are child’s gender and age (in matrix X), theindicators for economic development and investments in education (in vectorZ), the municipality, year, and month of birth dummies (the vectors αj , αt andαb, respectively), and the department time trends.
Yimjdtb = β0 +γkViolencej,t+k +X ′imβ1 +Z ′
jdtβ2 +αj +αt +αb +µd(t)+εimjdtb,(2)
In addition to the effects of violence during the period of interest, I runaugmented versions of Equations 1 and 2 in which I also include the impactof the homicide rate two and three years before birth (t = −2 and t = −3).Including these prior-to-conception homicide rates serves as a placebo test forthe identification strategy; in theory, they should not be associated with anindividual’s later-life educational attainment.
4. Results
4.1. Long-Term Effects of Violence
Figures 3–6 show the effects on education of violence experienced in early-life.Results are presented as profiles, where I plot the effect of violence associatedwith each year of exposure from age −1 (the year an individual was in-utero)
8The GDP per capita is only available at the department level for the period of interest.9This proxy is constructed as the average years of education of the adult population in
each municipality and year. Here I assume that the adult population, those over 30 years ofage, has completed their investments in education. Using other reference ages for the adultpopulation (e.g., 27, 35) does not affect the coefficient of interest βt.
10
to age 5. In each figure, the dot represents the coefficient βt obtained fromEquation 1 (and Equation 2). The 95% confidence intervals are depicted by thestandard error bars.
4.2. Years of Schooling
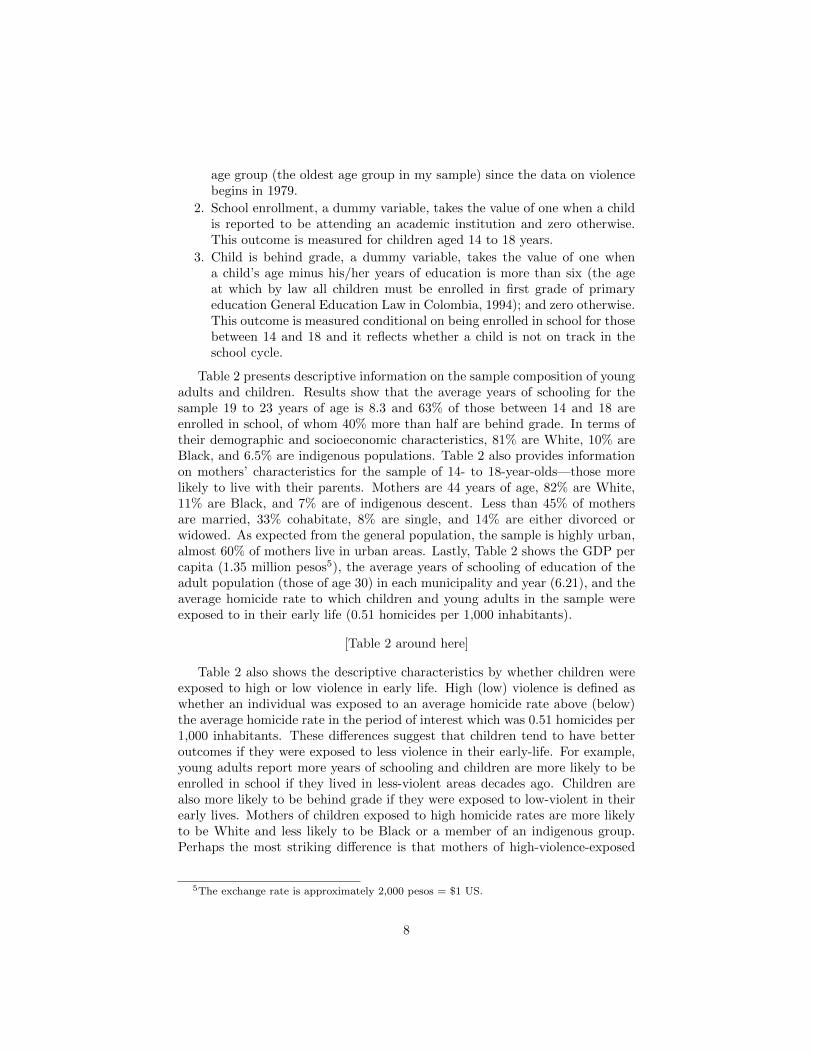
Figures 3 and 4 present the effects of violence on years of schooling usingthe baseline specification (Equation 1) and the model with sibling fixed-effects(Equation 2). Results show that exposure to violence has a significant andnegative impact on future years of education. I find that a one standard devia-tion increase in homicide rates (i.e., 0.61 homicides per 1,000 inhabitants) whilein-utero (at t = −1) reduces the years of education by 0.05 and that exposureduring childhood (ages one to five) is associated with a 0.08 year decline for eachyear of exposure. 0.08 years of schooling is equivalent to a 1.0% with respectto the mean or a 0.02 of a standard deviation; however, an individual who isexposed to more than one year of high homicide rate in early-life can experienceup to 0.4 fewer years of schooling as an adult. To put these results in per-spective, Barro and Lee (2013) document that the average years of schooling inLatin America increased by just 1.07 from 2000 to 2010. Moreover, the figuresalso show that placebo test (homicide rates two and three years prior to birth)shows no impact of violence on years of schooling providing some evidence onthe validity of the identification strategy.
My estimates are consistent to those found in previous studies. For example,Akresh and de Walque (2011) found effects around 0.5 fewer years of education(Rwanda); Shemyakina found 0.6 (Tajikistan); Rodriguez and Sanchez (2012)found 0.2 (Colombia); and Chamarbagwala and Moran (2011) found effectsbetween 0.12 and 1.09 (Guatemala). Leon (2012) also focused on the prenataland early-childhood periods and found that violence in Peru reduced years ofschooling by at least 0.3.
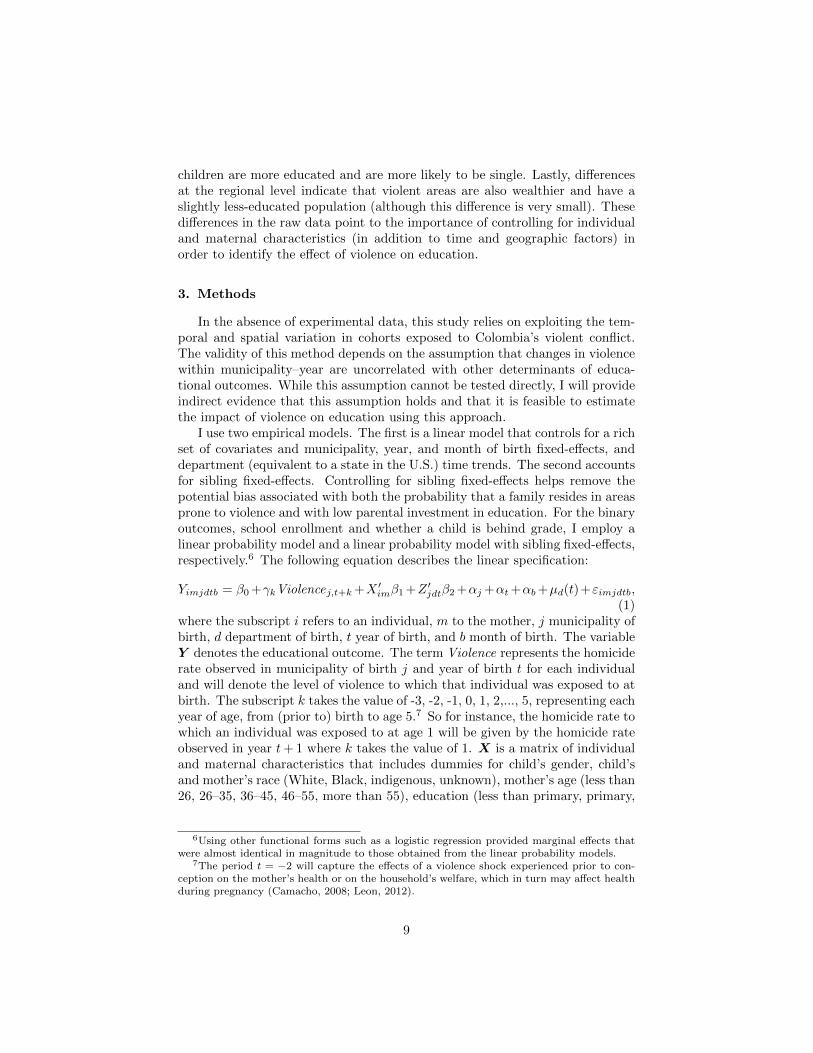
The findings from the sibling fixed-effects model show consistent but largerestimates, which could suggest that controlling for unobserved family time-invariant characteristics is important to identify the effect of homicide rates oneducation as it helps remove the potential bias associated with both the prob-ability that a family resides in areas prone to violence, and with low parentalinvestment in education.10 Almond et al. (2009) found that impacts of exposureto radioactive fallout from Chernobyl were stronger within families, comparingan exposed with an unexposed sibling. They interpreted this finding as evidencethat parents could have reinforced the negative impact of the childs human-capital shock through lower parental investment. I find that a one standarddeviation increase in the homicide rate is associated with a 0.09 to 0.18 declinein years of schooling.
Although the sample I used to estimate the sibling fixed-effects models cor-responds to only 45% of the total sample of young adults, this group has signif-icantly better socioeconomic characteristics than those in the full sample. For
10The GDP per capita is only available at the department level for the period of interest.
11
example, they are more likely to have more-educated mothers and to live infamilies where parents are more likely to be married (these summary statisticsare not shown here), which is consistent with the idea that in Colombia manyyoung adults after age 18 stay at home with their parents to attend college.Thus, the effects of violence on education for this group may result in a lower-bound estimate of homicide rates. In what follows, I focus the discussion on thesibling fixed-effects models given that they provide more compelling evidencefor the effect of violence on education.
[Insert Figures 3 and 4 around here]
4.3. School Enrollment and Being Behind Grade
Figures 5 and 6 show findings on school enrollment and on whether a childis not on track for those between 14 and 18 years old, using linear probabilitymodels with sibling fixed-effects. The results indicate that educational outcomesare particularly sensitive to violence exposure around birth. For example, I findthat children living in areas with a high homicide rate around birth (i.e., a onestandard deviation increase in violence) experience a decline in the probabilityof school enrollment by almost 0.01 and that the probability that a child isbehind grade, conditional on being enrolled in school, increases by 0.02. Theseestimates are equivalent to a 1.6% and a 4.7% decline with respect to the mean.The effect of violence on whether a child is behind grade could be considered asa milder impact than that on school enrollment since it is conditioned on thisoutcome being one.
These results provide some information on the potential mechanisms bywhich violence operates. Since the effect is concentrated around birth and notparticularly after, maternal conditions during pregnancy such as stress, health,or nutrition are likely to play a significant role.
[Insert Figures 5 and 6 around here]
5. Robustness Checks
5.1. Continuous Exposure to Violence over the Life Course
So far in this study, I have investigated the unconditional impact of violenceon education in each year of an individual’s early-life. I now ask whether theseeffects are robust to exposure at other stages (i.e., primary-school and high-school ages). Exploring how violence affects different stages over the life cycleis important because individuals could be continuously exposed to violence orbe exposed in different stages in their lives. Thus, identifying sensitive periodscould help inform policy-makers on how to target efforts and resources.
To test for whether the effects found in this study are robust to the inclusionof posterior exposure to violence, I estimate Equation 3.
Yimjtb = β0+∑
γkViolencej,t+k+X ′imβ1+Z ′
jdtβ2+αj+αt+αb+µd(t)+εimjdtb
(3)
12
The only difference with respect to Equation 1 is that I now condition eachindividual exposure to violence at a given age, to previous and subsequent ex-posure to violence. The term
∑γkViolencej,t+k adds each individual vector of
violence from in-utero (t = -1) to a year prior to 2005 (year in which the Cen-sus was collected). So for instance, the educational attainment of a 20-year-oldperson in 2005 is regressed on the homicide rate he or she was exposed to whilein-utero, at birth, at age 1, and so on until the homicide rate experienced at age19. By including all homicide rates at different years, this model also tests forthe presence of serial correlation in homicide rates within municipalities. Figure7 shows the results of Equation 3 on years of schooling. The findings indicatethat exposure to violence during early-ife has the most pronounced impacts onfuture years of education, compared to exposure at other stages. The magni-tude of the coeffients are consistent to those found in Figure 3; for each yearof exposure to a high homicide rate in early-life (an increase of one standarddeviation), years of schooling decline by 0.09. 11 Leon (2012) also finds strongerimpacts of violence when exposure occurs prior to school entry and small or noeffects when individuals are exposed after preeschool-age.
[Insert Figure 7 around here]
5.2. Effects of Violence on Health
A question that I also ask is whether violence exposure could affect individualhealth as previous studies have shown (Akbulut-Yuksel, 2011; Camacho, 2008;Valente, 2011; Brown, 2014). Using Census data that include a battery of healthquestions, I construct an indicator for whether an individual suffers from apermanent disability,12 and I test whether changes in exposure to homicide ratesare associated with changes in this outcome. I found that exposure to violenceduring the first years of life increased the probability of having this condition by0.3%. While having a permanent disability is a very extreme health condition,this result could suggest that even more subtle health problems might also beassociated with violence exposure. Results are not shown but are available uponrequest.
5.3. Sources of Selection Bias
To correctly estimate the effect of exposure to violence on education, thispaper analyzes four potential sources of selection bias: geographic sorting, mo-bility, fertility, and survival.
11Results on school enrollment and on the likelihood that a child is behind grade providesimilar findings to those observed in Figures 6 and 7. Even after controlling for exposure toviolence at other stages in life, violence around birth has the most pronounced impact onthese outcomes. Results on school enrollment and child being upgraded are not shown herebut are available upon request.
12The battery of health questions in the Census data ask about specific disabilities, such as,blindness, deafness, muteness, and disabilities affecting upper extremities, lower extremities,personal care, mobility, mental health, and psychological limitations. Using these extremeconditions, I constructed a dummy variable that indicated whether the individual suffers fromany disability. Approximately 3% of the sample reports to have any permanent disability.
13
Geographic sorting. Table 2 shows statistically significant differences in the sam-ple composition by violence exposure in early life. Although these differencescould be due in part to violence, there are other factors correlated with violencethat could also affect them. For instance, violence-prone municipalities couldbe disadvantaged in other ways: They might be poor or provide few publicgoods. A way to control for these differences is to include municipality and yearfixed-effects in the regression. However, if these differences are time-varying,or if there are differences into who is affected by violence within municipalities,then the fixed-effects would not account for these differences and there will beselective sorting within areas.
To test for the presence of selective sorting, I performed a simple test com-paring the characteristics of mothers exposed to violence during pregnancy (andduring their child’s early years) to those not exposed in these periods. In thepresence of selective sorting, the association between violence exposure andmother characteristics should be significant even after controlling for munici-pality and year fixed-effects. Equation 4 presents the model I used to test forselective sorting.
Ximjtb = β0 + γkViolenceij,t+k + αj + αt + αb + εimjtb, (4)
where X represents a set of dummy variables for mother’s age, race, education,and marital status as described in Equation 1;13 Violence refers to the homiciderate observed during the year of pregnancy and during each of the child’s earlyyears; αj , αt, and αb represent fixed-effects for the child’s birth municipality,year, and month, respectively.
Appendix Table 1 shows the results on selective sorting. In general, the co-efficients on violence show little evidence on selective sorting based on mother’sage, race, and education after accounting for municipalities fixed-effects. Whilesome coefficients are significant, for example, mother’s age, being a minority, orhaving less than a high school education are negatively associated with violence,results show that after controlling for these geographic time-invariant charac-teristics (as well as year and month FE) absorbs a big portion of this potentialsource of selection bias.
Mobility. Another potential source of selection bias is related to endogenous mi-gration in response to (or in expectation of) high violence. Selective migrationcould be a problem for my analysis if households who migrate due to high vio-lence are different from those who do not migrate in ways that could potentiallyaffect a child’s education. For instance, if families who migrate are wealthieror more educated than those who stay, then I could overestimate the negativeeffect of violence.
Since the Census does not provide information on households’ migrationhistory, which would allow me to test with high precision a family’s migration
13The sample only focuses on the mothers of children between 14 to 18 because this groupof children still live with their parents and so I can control for their mothers’ characteristicsin the regression models.
14
response due to violence, I examine whether some families are more or less likelyto change their place of residence after being exposed to a high homicide ratein particular moments in time. In order to perform this test, I select all themothers in my sample (the mothers of the sample of children and young adultsI analyze here), and I examine whether a mother experiencing high violenceduring her pregnancy (or during her child’s early years) predicts that she movesto another municipality.14
Equation 5 describes the model I use to test for the presence of selectivemigration.
Yimjtb = β0 + γk1Violenceij,t+k + γk2Violenceij,t+k ×Xim
+ β1Xim + αj + αt + αb + εimjtb (5)
where Y is a dummy indicator that takes the value of 1 when a mother mchanges her place of residence, and 0 otherwise. So for example, a motherwould be classified as a migrant mother (the outcome equals 1) if she givesbirth to her child in Bogota and then she is sampled in Medellin in 2005.15
Violence is measured during pregnancy, and in child’s age 1, 3, and 5. Xincludes mother characteristics as in the main specification. The terms αj ,αt, and αb control for the first child’s municipality of birth fixed-effects (i.e.,baseline municipality of a mother’s residence), and for a child’s year and monthof birth fixed-effects. The coefficient of interest, γk2, identifies whether thereis selective migration on that specific mother characteristic. Appendix Table2 shows results on selective mobility for both the sample of mothers of youngadults and those of children, when exposure to violence occurs in pregnancy, andin child’s age 1, 3, and 5. In general, I find little evidence of selective migrationin terms of mother characteristics. This is shown by the lack of significancein almost all the interaction terms in the regression and by the test of jointsignificance of the model (the F -statistic is relatively high, 12 or above).
While these tests for selective migration find little evidence for endogenousmigration, it is true that internal forced displacement in Colombia has beenone of the most dramatic consequences of the armed conflict.16 Identifyinginternally displaced populations (IDP) in the Census 2005 is only possible forthose who have recently been forced to move (in the last 5 years).17 Although
14For mothers with two or more children between 14 and 23 in 2005, I focus on how exposureto violence during a mother’s pregnancy of her first child (or during the early stages of herfirst child) predicts that she moves to another municipality before she gives birth to her secondchild.
15For mothers with two or mother children, the outcome would take the value of 1 if, forexample, a mother’s first child is born in Bogota and her second child is born in Medellin. Irestrict the sample to those cases who report to be living in their child’s municipality of birth.
16The total displaced population in the country reached over 3.5 million since 1997, whichis equivalent to 8% of the total population (United Nations High Commissioner for Refugees,2010). Displaced groups commonly have very low socioeconomic indicators, including educa-tional attainment and health status.
17This is consistent with the fact that forced migration is a relatively recent consequence ofthe conflict. Statistics from Accion Social reveal forced displaced populations since the 1990s.
15
I cannot identify IDPs prior to year 2000, the number of IDPs in the Census issmall (they represent 5% of the recent migrants and are approximately 2% ofthe total sample), providing some additional evidence that internal migrationin the sample is not particularly driven by violence.
In addition to these two pieces of evidence—the multivariate analysis and thefact that IDPs are a relatively small portion of the Census—I also test whetherthe estimates of violence on educational outcomes are robust to controlling forthe proportion of IDPs that was expelled from each municipality and year inColombia.18 Results indicate that controlling for IDPs in Equation 5 does notsubstantially change the estimates of homicide rates on education. Lastly, Iestimate Equation 5 for both the sample of movers (those who were born ina different municipality to where they were sampled in 2005) and non-movers.Results are remarkably similar, suggesting that the estimates of violence oneducation may not suffer, substantially, from selective migration. These findingsare not shown here due to space limitations, but they are available upon request.
Fertility. Violence can also affect a woman’s fertility decisions by either reducingthe number of children she wants to have or by delaying her decision to becomepregnant. If violence affects some women more than others, this may result ina biased estimate of the impacts of violence on education.19 For example, ifmore educated women are less likely to have an additional child in the presenceof high violence, then those more likely to have children are the less educatedmothers who are less likely to invest in their children’s education even in theabsence of violence.
In order to test for the presence of this potential source of selection bias, Iexamine whether violence is associated with the number of children a motherhas, by observable characteristics. Equation 6 describes the model used to testthis hypothesis.
Ximjtb = β0 + γk1Violenceij,t+k + γk2Violenceij,t+k ×Nchildm
+ β1Nchildm + αj + αt + αb + εimjtb (6)
where Nchild represents a mother’s report on her number of children in 2005; theinteraction term between violence and the number of children indicates whetherthere exists selective fertility on that specific maternal characteristic. The termαj stands for oldest (first) child’s municipality of birth FE, whereas αt and αb
represent each child’s year and month of birth FE, respectively. I should notethat these results are conditional on both child and mother surviving in 2005,and children living in a household with their mothers.
18This information was obtained from the National Agency Accion Social—CumulativeIDP’s (Registro Unico de Poblacion Desplazada por la Violencia).
19An example of violence inducing negative selection on fertility was shown by Valente(2011). The author found that high-caste and highly educated women in Nepal were rela-tively less likely to become pregnant after being exposed to the violent conflict, or when theyanticipated more violence during the pregnancy.
16
Results are presented in Appendix Table 3, and they show that black moth-ers or those with fewer years of education (i.e., mothers with less than primaryeducation) are more likely to have an additional child in the presence of highviolence during their child’s early-life. While this is evidence of (negative) se-lective fertility, I claim that this bias is actually small and does not representa huge concern for my long-term estimates of violence on education. My claimfocuses on the magnitude of the coefficient that acompanies the interaction termrelative to the magnitude of the association between the violence and householdsize. For instance, in the case of years of education –perhaps the most importantmeasure of SES –, selection on fertility only accounts for a tenth to a half of themagnitude of β1, net fertility, suggesting that on the margin, while this estimateis statistically significant and may indice negative selection due to violence, itis very small.
Survival. Lastly, I analyze how violence affects the probability of survival. Se-lective survival can occur if, for instance, violence increases the probability ofmortality of the frailer fetuses or children, leading to healthier babies surviving.In this case, the effects of violence on education would result in a lower-boundestimate on the true impact.
One way to test for the presence of selective survival in the Census is toexplore whether violence during pregnancy (for example) affects the sex ratioor the cohort size at birth. Several studies have shown that boys are biologicallyweaker and more susceptible to diseases and premature death than girls (Naeyeet al., 1971; Waldron, 1985), and that they are more vulnerable to environmentalfactors (Pongou, 2013). Hence, exploring the relationship between violence andthe cohort size or the sex ratio can help understand whether there exists selectionon mortality. Equation 7 shows the model used to test for this type of threat.
Yjt = β0 + γkViolencej,t+k + αj + αt + εjt, (7)
where Y is measured using the sex ratio20 or cohort size21 in municipality jand in year t; Violence is measured in t+ k as in equation 1. Appendix Table 4shows the associations between violence in-utero, at birth, and in ages 1 through5, and the sex ratio and cohort size. The findings show that, except for a fewcases where violence is positively associated with an increase in cohort size, ingeneral, violence does not seem to be associated with changes in the sex ratioor in the cohort size, which could suggest little evidence for selective mortality.
6. Discussion and Conclusions
A growing body of literature has shown that shocks in the prenatal, infancy,and childhood periods can have long-term consequences on future health, edu-cation, and wages. Despite of this growing evidence, most studies investigating
20The ratio of males to females.21The count of all births that occurred in a given municipality and year.
17
the effects of violence on education have focused on individuals who were ex-posed at school age, and little is known about how violence exposure in otherlife stages impacts long-term individual outcomes.
I investigate the consequences of exposure to high violence, from in-uteroto current age, on future educational attainment. I moved beyond previousresearch by focusing on early-life exposure and by using a more precise measureof violence—the homicide rate—than used in most previous studies. My focuson Colombia provides an interesting case to study due to the large variationin crime and violence associated with the proliferation of drug cartels and therecrudescence of its armed conflict. I found that exposure to homicide ratewhile in-utero reduced the years of schooling by 0.05, and that exposure duringchildhood (ages one to five) was associated with 0.08 fewer years of schoolingfor each year of exposure. So an individual who lived throughout his/her earlylife in a violent municipality is likely to attain approximately 0.4 fewer years ofschooling as an adult, than someone who was not exposed. Similarly, I foundthat children exposed to a high homicide rate around birth are less likely to beenrolled in school (by 4 percentage points) and more likely to be behind grade(by 6 percentage points). Most important, results show that exposure duringthe prenatal to childhood periods have the most pronounced impacts in termsof future losses in education, compared to exposure at other stages in life.
While the results for years of schooling and for child school enrollment wereobtained from two different samples (individuals between 19 and 23 years ofage and children between 14 and 18) and from to two different waves of vi-olence, they can be reconciled. The estimated effect of exposure to violenceon school enrollment around birth (a decline of between 1 and 2 percentagepoints) is equivalent to an expected loss in 0.1 years of education, which iswithin the estimated impact of violence around birth on an individual’s futureyears of schooling. Some back-of the-envelope calculations using Galdo’s (2013)estimates on the effects of violence on adult monthly earnings for the case ofPeru’s conflict suggest that the decline in years of schooling in Colombia couldbe associated with a 2.5% in future wages.
This study faces several limitations. First, since the data on homicide ratesis at the yearly level, I cannot identify with more precision critical periodsof an individual’s life that can be affected by violence. For example, I cannotexplore the effect of a high homicide rate in each trimester while in-utero, whichcould provide some suggestive evidence for potential mechanisms (e.g., maternalstress, maternal malnutrition; see Camacho, 2008; Mansour and Rees, 2012;Brown, 2014). Second, while Census data contain rich information on a largeand representative sample of Colombians, they do not include data on wherethe children lived throughout their early life (nor information on householdmigration). Nevertheless, I have provided evidence suggesting that results arenot driven by selective migration, and in any case, the bias seemed to be small,resulting in a lower-bound estimate of the true effect. Third, although homiciderates are highly correlated with the occurrence of other terrorist actions (e.g.,massacres, landmine explosions, etc.) and they are more reliable than othermeasures of crime that are not always registered by the police, it is also true
18
that exposed cohorts were likely to be exposed to other terrorist attacks duringtheir early life, which could have caused significant declines in their well-being,accentuating the effects of municipality homicide rates. Since I did not accountfor other violent events, it is likely that the estimates of homicide rate couldoverestimate the impact of violence on education.
The results shown in this paper have important public-policy implications.First, they contribute to the growing evidence suggesting that conditions expe-rienced during early life have a long reach; second, they offer some suggestiveevidence that could help inform policy-makers of when in the life course inter-ventions targeted to mitigate impacts of violence can be most effective. Futureresearch that investigates the link between violence and human capital shouldfocus on determining the relevant pathways of transmission by which violenceaffects human capital accumulation, particularly those operating at the house-hold/individual level—about which less is known—and on identifying effectivepublic policies that help mitigate the negative impacts of violence. Anotherextension would be to explore the effects of violence on other domains of humancapital, for example, on cognitive and non-cognitive skills.
19
Acknowledgements
I would like to thank my advisors Doug Almond and Julien Teitler for guid-ance and support. I would also like to thank Fabio Sanchez, Neeraj Kaushal,Dhaval Dave, Jane Waldfogel, Florencia Torche, Suresh Naidu, Adriana Cama-cho, Irv Garfinkel, Lars Hojsgaard Andersen, Natasha Pilkauskas, and PabloOttonello for the very useful feedback and suggestions. I am also indebted tothe participants at the Population Association of America (PAA) Annual Meet-ing 2013 (New Orleans), Households in Conflict Network (HiCN) 2012 (Aix-en-Provence, France), Student Policy Seminar at the School of Social Work,and Sustainable Development Colloquium (Columbia University), and the As-sociation for Public Policy and Management (APPAM) Annual Meeting 2012Conference Poster Session (Baltimore). All errors are my own.
20
References
Aguilar, A., Vicarelli, M., 2012. El nino and mexican children: Medium-termeffects of early-life weather shocks on cognitive and health outcomes, workingpaper.
Aizer, A., Stroud, L., Buka, S., 2012. Maternal stress and child outcomes: Ev-idence from siblings. Tech. Rep. 18422, National Bureau for Economic Re-search.
Akbulut-Yuksel, M., 2011. The long-run effects of warfare and destruction onchildren: Evidence from World War II. Tech. Rep. Discussion Papers 4407,Institute for the Study of Labor.
Akresh, R., de Walque, D., 2011. Armed conflict and schooling: Evidence fromthe 1994 rwandan genocide. Tech. rep., World Bank.
Akresh, R., Lucchetti, L., Thirumurthy, H., 2012. Wars and child health: Evi-dence from the eritrean-ethiopian conflict. Journal of Development Economics99, 330–340.
Alderman, H., Hoddinott, J., Kinsey, B. H., 2006. Long term consequences ofearly childhood malnutrition. Oxford Economic Papers 58 (3), 450–474.
Almond, A., Mazumder, B., 2011. Health capital and the prenatal environ-ment: The effect of ramadan observance during pregnancy. American Eco-nomic Journal: Applied Economics 3 (4), 56–85.
Almond, D., 2006. Is the 1918 influenza pandemic over? long-term effects of inutero influenza exposure in the post-1940 u.s. population. Journal of PoliticalEconomy 114 (4), 672–712.
Almond, D., Currie, J., 2011a. Handbook of Labor Economics. Vol. 4B. Elsevier,Amsterdam, Ch. Human Capital Development Before Age 5, pp. 1315–1486.
Almond, D., Currie, J., 2011b. Talk to me softly: The fetal origins hypothesis.Journal of Economic Perspectives 25 (3), 153–172.
Almond, D., Edlund, L., Palme, M., 2009. Chernobyls subclinical legacy: Prena-tal exposure to radioactive fallout and school outcomes in sweden. QuarterlyJournal of Economics 124, 1729–72.
Bagley, B., 2001. Drug trafficking, political violence, and U.S. policy in Colombiain the 1990s.URL http://www.mamacoca.org
Barker, D. J. P., 1998. Mothers, Babies and Health in Later Life, 2nd Edition.Churchill Livingston, Edinburgh, UK.
Barro, R. J., Lee, J. W., 2013. A new data set of educational attainment in theworld, 1950–2010. Journal of Development Economics 104 (C), 184–198.
21
Becker, G., 1962. Investment in human capital: A theoretical analysis. Journalof Political Economy 70 (5 Supp), 9–49, part 2: Investment in Human Beings.
Borrell, J., 1988. Colombia the most dangerous city: Welcome to Medellin, cokecapital of the world. TIME Magazine 131 (12), 45–48.
Brown, R., 2014. The mexican drug war and early-life health: The impact ofviolent crime on birth outcomes, job Market Paper.
Bundervoet, T., 2012. War, health, and educational attainment: A panel ofchildren during burundis civil war. Tech. Rep. 114, Households in ConflictNetwork.
Bundervoet, T., Verwimp, P., Akresh, R., 2009. Health and civil war in ruralburundi. Journal of Human Resources 44 (2), 536–563.
Camacho, A., 2008. Stress and birth weight: Evidence from terrorist attacks.American Economic Review: Papers and Proceedings 98 (2), 511–515.
Campbell, S. B., Marsh, C. L., Pierce, E. W., Ewing, L. J., Szumowski, E. K.,1991. Hard to manage preschool boys: Family context and the stability ofexternalizing behavior. Journal of Abnormal Child Psychology 19, 301–318.
Caudillo, M., Torche, F., 2014. Exposure to local homicides and early educa-tional achievement in mexico. Sociology of EducationForthcoming.
Chamarbagwala, R., Moran, H. E., 2011. The human capital consequences ofcivil war: Evidence from guatemala. Journal of Development Economics 94,41–61.
Cunha, F., Heckman, J. J., 2007. The technology of skill formation. AmericanEconomic Review 97 (2), 31–47.
Declaration, G., 2011. Global burden of armed violence 2011.URL http://www.genevadeclaration.org/
measurability/global-burden-of-armed-violence/
global-burden-of-armed-violence-2011.html
Denckel-Schetter, C., 2011. Psychological science on pregnancy: Stress pro-cesses, biopsychosocial models, and emerging research issues. Annual Reviewof Psychology 62, 531–558.
Doyle, O., Harmon, C. P., Heckman, J. J., Tremblay, R. E., 2009. Investing inhuman capital development: Timing and economic efficiency. Economics ofHuman Biology 7 (1), 1–6.
Galdo, J., 2013. The long-run labor-market consequences of civil war: Evidencefrom the shining path in peru. Economic Development and Cultural Change61 (4), 789–823.
22
General Education Law in Colombia, 1994. Ley 115 de 1994.URL http://www.dnp.gov.co/LinkClick.aspx?fileticket=
FgK886xb00o%3d&tabid=1354
Glewwe, P., Jacoby, H., King, E., 2001. Early childhood nutrition and academicachievement: A longitudinal analysis. Journal of Public Economics 81, 345–368.
Gluckman, P. D., Hanson, M. A., 2005. The Fetal Matrix: Evolution, Develop-ment, and Disease. Cambridge University Press, Cambridge.
Ichino, A., Winter-Ebmer, R., 2004. The long-run educational cost of WorldWar II. Journal of Labor Economics 22 (1), 57–86.
Leon, G., 2012. Civil conflict and human capital accumulation: The long termeffects of political violence in peru. Journal of Human Resources 47 (4), 991–1022.
Levitt, S., Rubio, M., 2000. Understanding crime in Colombia and what can bedone about it. Tech. Rep. 3735, Fedesarrollo.
Maccini, S., Yang, D., 2009. Under the weather: Health, schooling, and eco-nomic consequences of early-life rainfall. American Economic Review 99 (3),1006–1026.
Mansour, H., Rees, D., 2012. Armed conflict and birth weight: Evidence fromthe al-aqsa intifada. Journal of Development Economics 99 (1), 190–199.
Mincer, J., 1974. Schooling, experience and earnings. Tech. rep., National Bu-reau of Economic Research, New York.
Minoiu, C., Shemyakina, O., 2014. Armed conflict, household victimization, andchild health in cte d’ivoire. Journal of Development Economics 108, 237–255.
Naeye, R. L., Burt, L. S., Wright, D. L., Blanc, W. A., Tatter, D., 1971. Neonatalmortality, the male disadvantage. Pediatrics 48, 902–906.
Pizarro, E., 2011. Las FARC (1949–2011) de guerrilla campesina a maquina deguerra, editorial Norma.
Pongou, R., 2013. Why is infant mortality higher in boys than in girls? a newhypothesis based on preconception environment and evidence from a largesample of twins. Demography 50 (2), 421–444.
Rodriguez, C., Sanchez, F., 2012. Armed conflict exposure, human capital in-vestments, and child labor: Evidence from Colombia. Defence and PeaceEconomics 23 (2), 161–184.
Sanchez, F., Nunez, J., 2007. Determinantes del crimen violento en un paısaltamente violento: El caso de Colombia. In: Snchez, F. (Ed.), Las Cuentasde la Violencia. Grupo Editorial Norma.
23
Schultz, T. W., 1961. Investments in human capital. American Economic Review51 (1), 1–17.
Shemyakina, O., 2011. The effect of armed conflict on accumulation of schooling:Results from tajikistan. Journal of Development Economics 95 (2), 186–200.
Swee, E. L., 2009. On war and schooling attainment: The case of bosnia andherzegovina. Tech. Rep. 57, Households in Conflict Network.
United Nations, 2013. Regional human development report 2013–2014. citizensecurity with a human face: Evidence and proposals for Latin America.
United Nations High Commissioner for Refugees, 2010. The State of the WorldsRefugees. Oxford Press, New York.
Valente, C., 2011. Children of the revolution: Fetal and child health amidstviolent civil conflict. Tech. Rep. 2011018, Sheffield Economics Research PapersSeries.
Van den Berg, G. I., Lindeboom, M., Portrait, F., 2007. Long-run longevityeffects of a nutritional shock early in life: The dutch potato famine of 1846–1847. Tech. Rep. Discussion Papers 3123, Institute for the Study of Labor.
Van den Berg, G. I., Pinger, P. R., Schoch, J., 2012. Instrumental variableestimation of the causal effect of hunger early in life on health later in life.Tech. Rep. 2012:6, Institute for Evaluation of Labour Market and EducationPolicy.
Vargas, R., 1999. Drogas, Mascaras, y Juegos. Tercer Mundo Editores, Bogota.
Waldron, I., 1985. Too Young to Die: Genes or Gender? United Nations, NewYork, Ch. Sex Differences in Infant and Early Childhood Mortality: MajorCauses of Death and Possible Biological Causes.
24
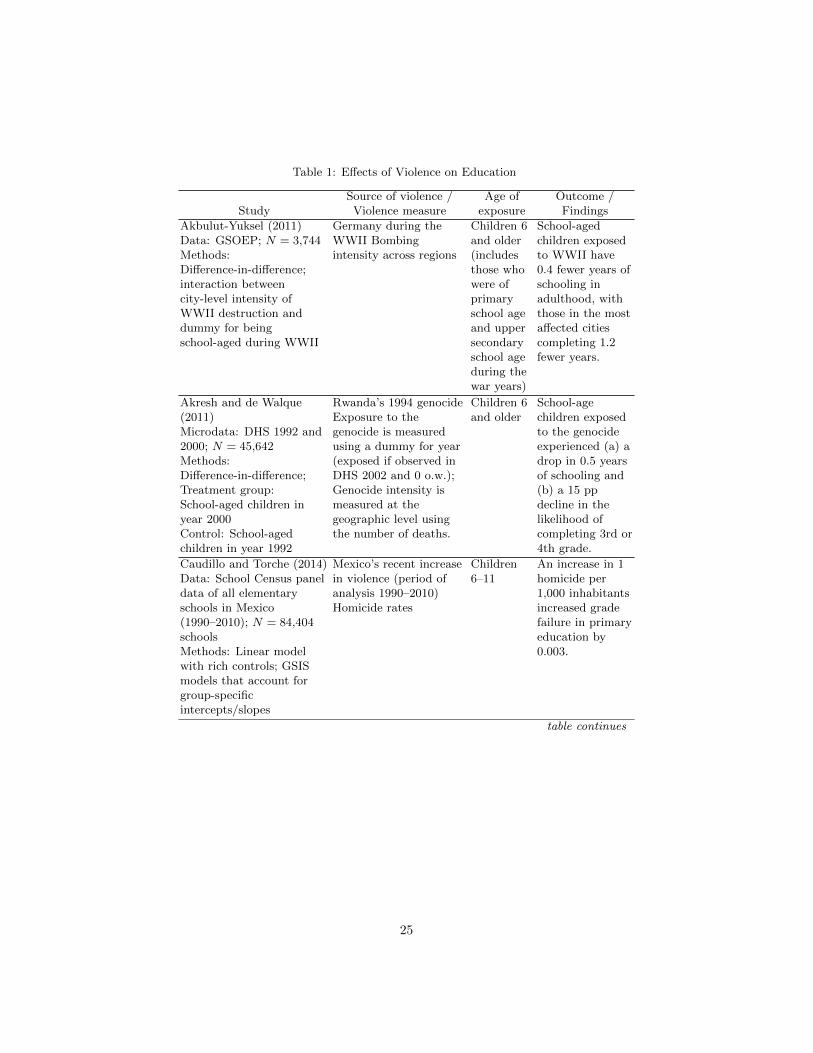
Table 1: Effects of Violence on Education
StudySource of violence /Violence measure
Age ofexposure
Outcome /Findings
Akbulut-Yuksel (2011)Data: GSOEP; N = 3,744Methods:Difference-in-difference;interaction betweencity-level intensity ofWWII destruction anddummy for beingschool-aged during WWII
Germany during theWWII Bombingintensity across regions
Children 6and older(includesthose whowere ofprimaryschool ageand uppersecondaryschool ageduring thewar years)
School-agedchildren exposedto WWII have0.4 fewer years ofschooling inadulthood, withthose in the mostaffected citiescompleting 1.2fewer years.
Akresh and de Walque(2011)Microdata: DHS 1992 and2000; N = 45,642Methods:Difference-in-difference;Treatment group:School-aged children inyear 2000Control: School-agedchildren in year 1992
Rwanda’s 1994 genocideExposure to thegenocide is measuredusing a dummy for year(exposed if observed inDHS 2002 and 0 o.w.);Genocide intensity ismeasured at thegeographic level usingthe number of deaths.
Children 6and older
School-agechildren exposedto the genocideexperienced (a) adrop in 0.5 yearsof schooling and(b) a 15 ppdecline in thelikelihood ofcompleting 3rd or4th grade.
Caudillo and Torche (2014)Data: School Census paneldata of all elementaryschools in Mexico(1990–2010); N = 84,404schoolsMethods: Linear modelwith rich controls; GSISmodels that account forgroup-specificintercepts/slopes
Mexico’s recent increasein violence (period ofanalysis 1990–2010)Homicide rates
Children6–11
An increase in 1homicide per1,000 inhabitantsincreased gradefailure in primaryeducation by0.003.
table continues
25
StudySource of violence /Violence measure
Age ofexposure
Outcome /Findings
Chamarbagwala andMoran (2011)Data: Census 2002; N =4.5 millionMethods:Difference-in-differenceTreatment: Indiv who wereat school age in highconflict zones during the 3periods of the conflict;Control group: Those wholived in low conflict areas
Guatemala 36-yearconflict (1960–1996)Using victim’sself-reports twomeasures of exposure tothe conflict wereconstructed: 1) thenumber of human rightsviolations in eachdepartment; 2) thenumber of victims ineach department(province).
Children7–17
Being exposed tothe conflict (a)reduced the yearsof schooling forall and (b) mostaffected were theMayan andfemale ruralpopulations:declines up to1.09 in years ofschooling formales and up to1.17 for females.
Ichino and Winter-Ebmer(2004)Data: See Appendix TableA1 in their paper.Methods: Test theexistence of significantbreaks in the evolution ofdeviations from the trendin education acrosscountries (Germany andAustria versus Sweden andSwitzerland)
WWIILiving in Germany orAustria vs. Sweden orSwitzerland during theWWII
Children atage 10
Exposed childrenachieved 0.2fewer years ofschooling.
Leon (2012)Data: Census 1997 and2003; N ∼ 200,000Methods: Linear modelwith rich controls, siblingFE
Peru’s 1980–1993conflictDummy variable forwhether a victimreported any humanright violation in thedistrict
−2 toadulthood
Conflict exposure(a) prior toschool-age leadsto a 0.31 declinein years ofschooling (in theshort-term,effects are 0.98fewer years ofschooling) and(b) after age 6has little effect.table continues
26
StudySource of violence /Violence measure
Age ofexposure
Outcome /Findings
Rodriguez and Sanchez(2012)Data: Living StandardsMeasurement Survey(LSMS); N = 20,642Methods: Duration modeland bi-probit; instrumentalvariables
Colombia’s armedconflict 1960–present(period analyzed:1992–2003)Accumulated violenceexposure measured bythe N of total attacks achild was exposed tosince age 6
Children6–17
An increase of1-SD in thearmed-conflictexposureincreased thejoint probabilityof schooldrop-out andchild labor by13%.
Shemyakina (2011)Data: LSMS 1999 and2003; N ∼ 11,000Methods:Difference-in-differenceTreatment group: Thosewho were school age (7–17)during the conflict andlived in conflict-affectedareasControl group: Those thatshould not have beensignificantly affected byconflict (i.e., lived inlow-conflict areas)
Tajikistan’s 1992–1998conflictVictim’s self-reports ondamages: 1) if ahousehold reporteddamage to their owndwelling; 2) dummyindicator for whether thearea had a dwellingdamage; 3) dummy forwhether the districtexperienced high vs. lowviolence.
Children7–17
Conflict exposureis associated with(a) negativeeffects on girlsand no effect onboys, (b) womenachieving 0.7fewer years ofschooling andgirls who were ofschool age had0.5 fewer years,and girl’s reducedlikelihood ofbeing enrolled inschool by 12.3%.
Swee (2009)Data: Bosnian LSMS;N 5,000Methods:Difference-in-differenceTreatment group:School-aged indiv living inhigh areas with high warintensityControl group: Similarschool-aged indiv living inlow-conflict areas
Bosnian War(1992–1995)Violence exposure: N ofwar casualties per capitain municipality
Children7–19
A 1-SD increasein the N of warcasualties percapita reducesthe likelihood ofsecondary schoolattainment by 4pp.
27
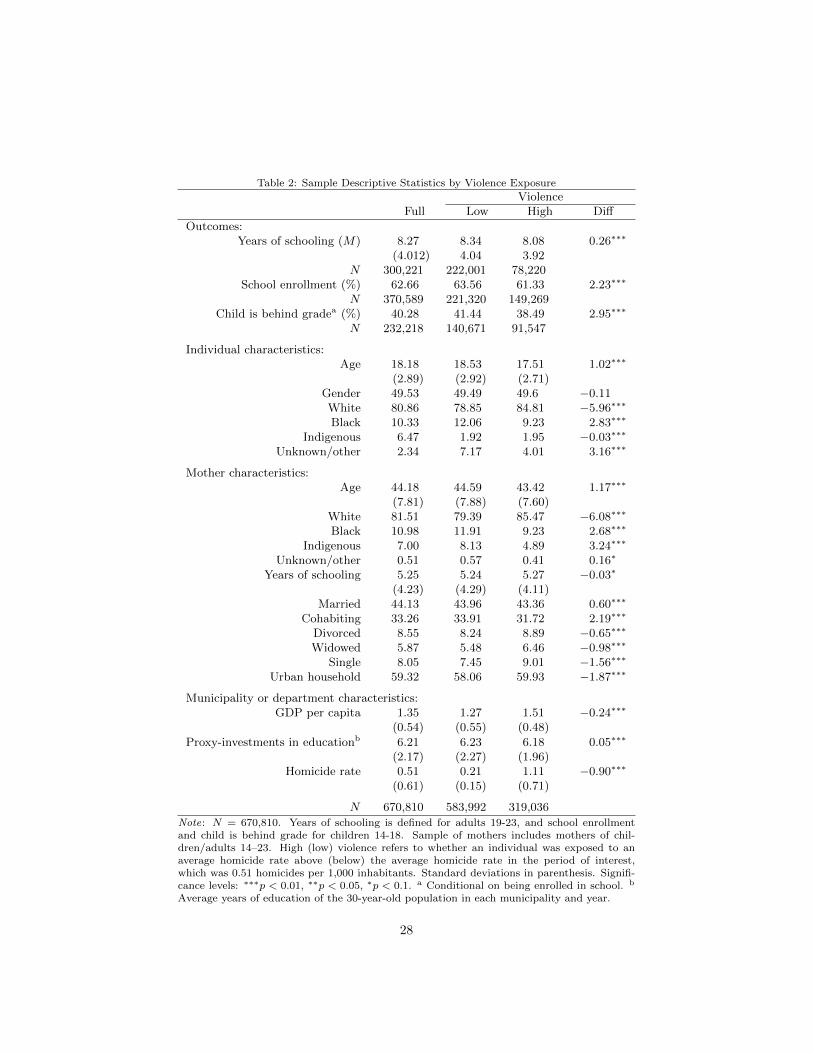
Table 2: Sample Descriptive Statistics by Violence Exposure
ViolenceFull Low High Diff
Outcomes:Years of schooling (M) 8.27 8.34 8.08 0.26∗∗∗
(4.012) 4.04 3.92N 300,221 222,001 78,220
School enrollment (%) 62.66 63.56 61.33 2.23∗∗∗
N 370,589 221,320 149,269Child is behind gradea (%) 40.28 41.44 38.49 2.95∗∗∗
N 232,218 140,671 91,547
Individual characteristics:Age 18.18 18.53 17.51 1.02∗∗∗
(2.89) (2.92) (2.71)Gender 49.53 49.49 49.6 −0.11White 80.86 78.85 84.81 −5.96∗∗∗
Black 10.33 12.06 9.23 2.83∗∗∗
Indigenous 6.47 1.92 1.95 −0.03∗∗∗
Unknown/other 2.34 7.17 4.01 3.16∗∗∗
Mother characteristics:Age 44.18 44.59 43.42 1.17∗∗∗
(7.81) (7.88) (7.60)White 81.51 79.39 85.47 −6.08∗∗∗
Black 10.98 11.91 9.23 2.68∗∗∗
Indigenous 7.00 8.13 4.89 3.24∗∗∗
Unknown/other 0.51 0.57 0.41 0.16∗
Years of schooling 5.25 5.24 5.27 −0.03∗
(4.23) (4.29) (4.11)Married 44.13 43.96 43.36 0.60∗∗∗
Cohabiting 33.26 33.91 31.72 2.19∗∗∗
Divorced 8.55 8.24 8.89 −0.65∗∗∗
Widowed 5.87 5.48 6.46 −0.98∗∗∗
Single 8.05 7.45 9.01 −1.56∗∗∗
Urban household 59.32 58.06 59.93 −1.87∗∗∗
Municipality or department characteristics:GDP per capita 1.35 1.27 1.51 −0.24∗∗∗
(0.54) (0.55) (0.48)
Proxy-investments in educationb 6.21 6.23 6.18 0.05∗∗∗
(2.17) (2.27) (1.96)Homicide rate 0.51 0.21 1.11 −0.90∗∗∗
(0.61) (0.15) (0.71)
N 670,810 583,992 319,036
Note: N = 670,810. Years of schooling is defined for adults 19-23, and school enrollmentand child is behind grade for children 14-18. Sample of mothers includes mothers of chil-dren/adults 14–23. High (low) violence refers to whether an individual was exposed to anaverage homicide rate above (below) the average homicide rate in the period of interest,which was 0.51 homicides per 1,000 inhabitants. Standard deviations in parenthesis. Signifi-cance levels: ∗∗∗p < 0.01, ∗∗p < 0.05, ∗p < 0.1. a Conditional on being enrolled in school. b
Average years of education of the 30-year-old population in each municipality and year.
28
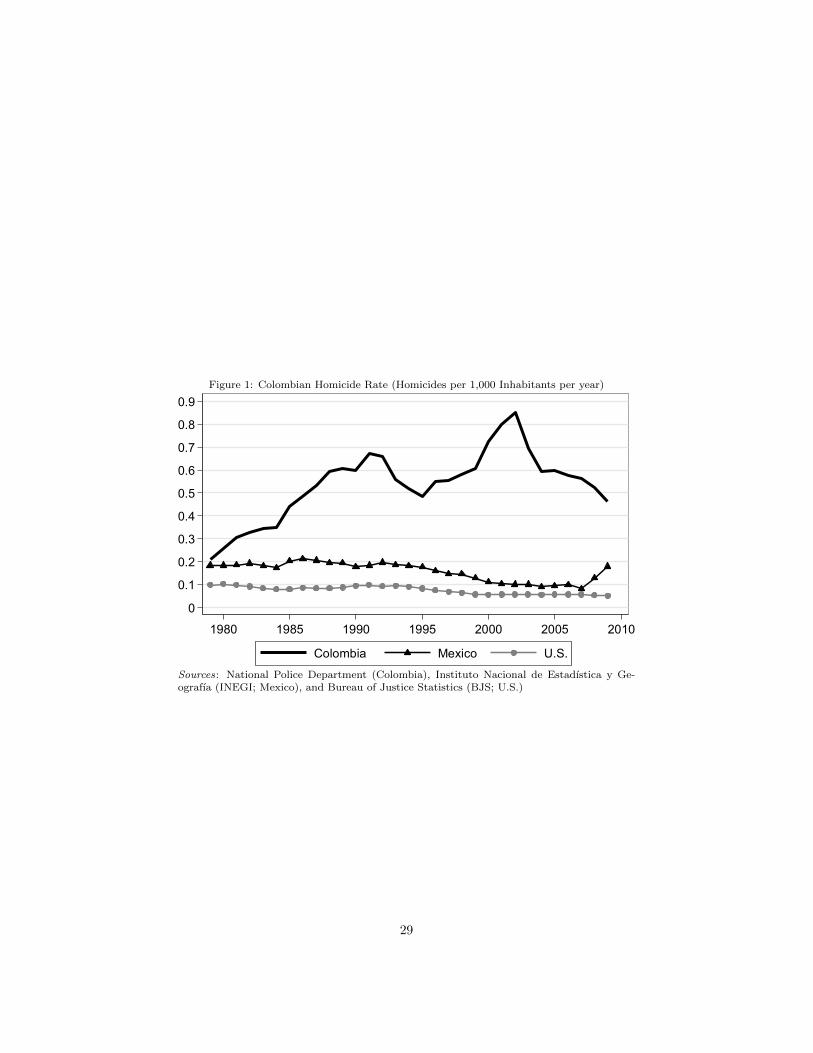
Figure 1: Colombian Homicide Rate (Homicides per 1,000 Inhabitants per year)
0
0.1
0.3
0.5
0.7
0.9
0.2
0.6
0.4
0.8
1980 1985 1990 1995 2000 2005 2010
Colombia Mexico U.S.Sources: National Police Department (Colombia), Instituto Nacional de Estadıstica y Ge-ografıa (INEGI; Mexico), and Bureau of Justice Statistics (BJS; U.S.)
29
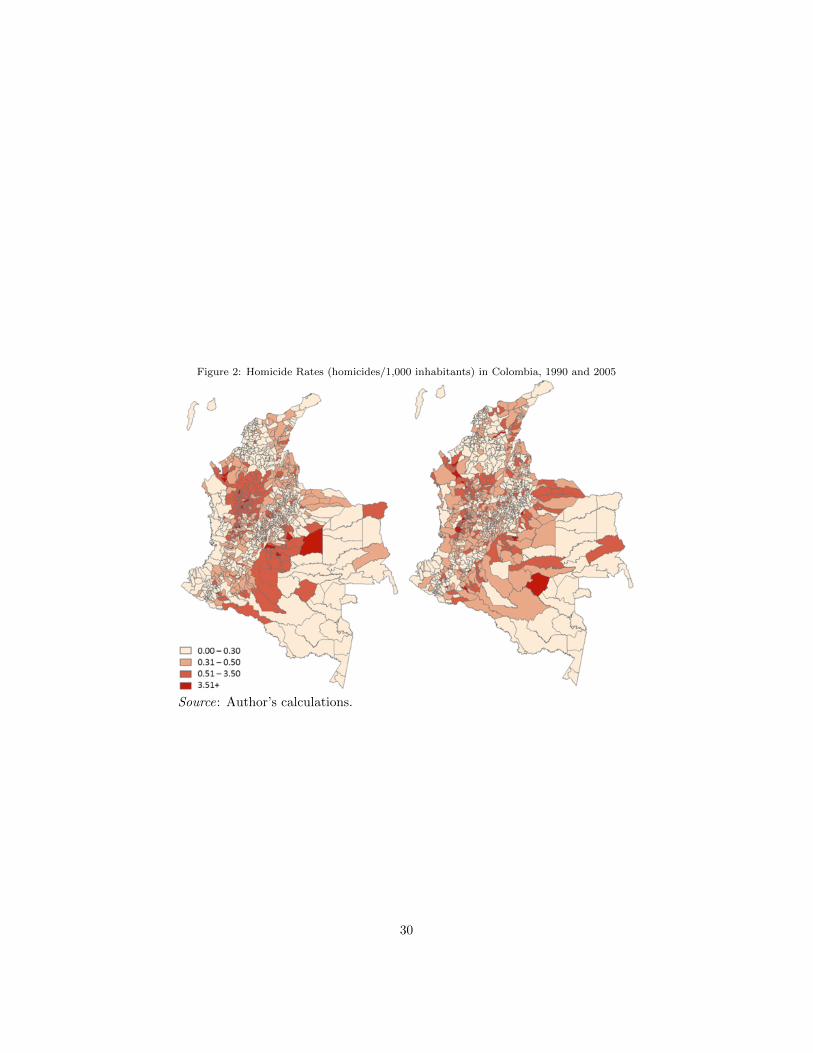
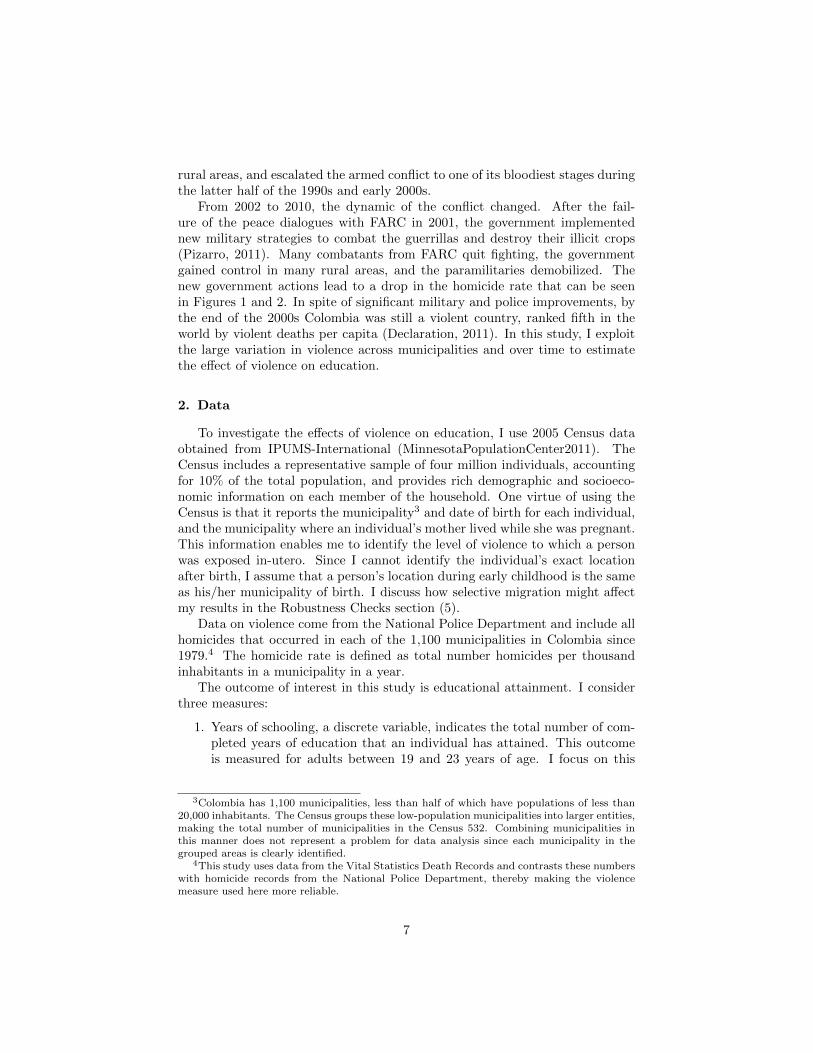
Figure 2: Homicide Rates (homicides/1,000 inhabitants) in Colombia, 1990 and 2005
Source: Author’s calculations.
30
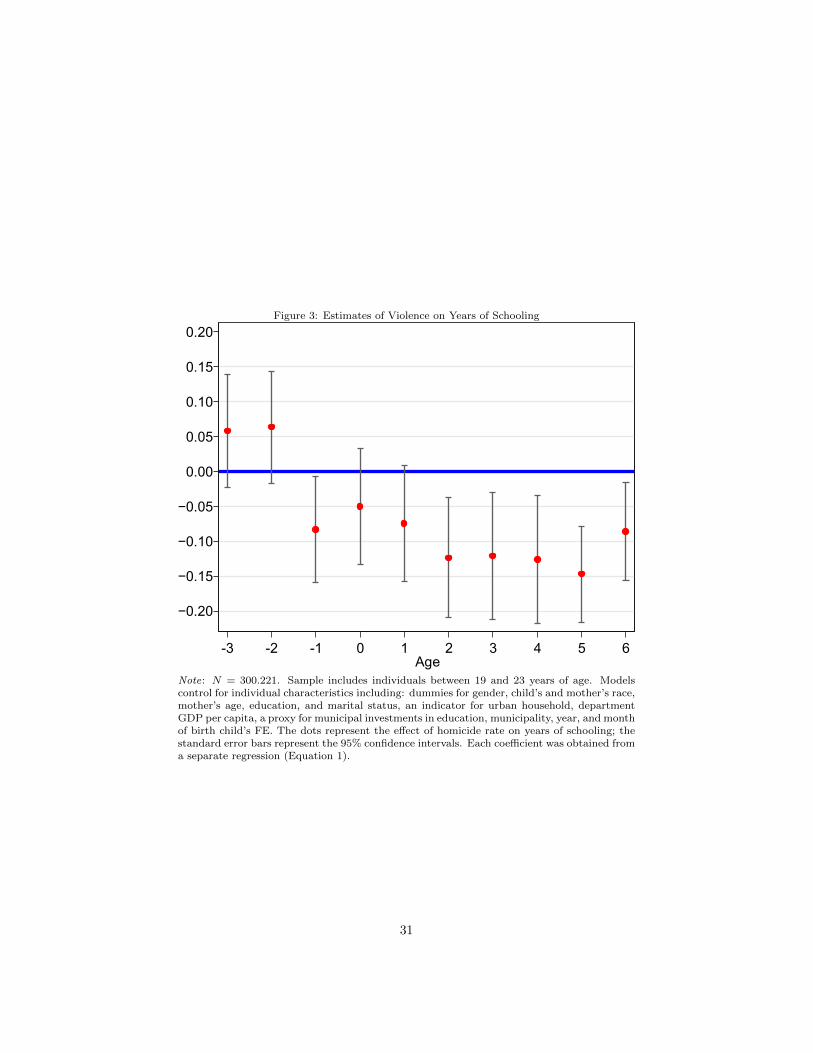
Figure 3: Estimates of Violence on Years of Schooling
0.20
0.15
0.10
0.05
0.00
−0.05
−0.10
−0.15
−0.20
-3 -2 -1 0 1 2 3 4 5 6Age
Note: N = 300.221. Sample includes individuals between 19 and 23 years of age. Modelscontrol for individual characteristics including: dummies for gender, child’s and mother’s race,mother’s age, education, and marital status, an indicator for urban household, departmentGDP per capita, a proxy for municipal investments in education, municipality, year, and monthof birth child’s FE. The dots represent the effect of homicide rate on years of schooling; thestandard error bars represent the 95% confidence intervals. Each coefficient was obtained froma separate regression (Equation 1).
31
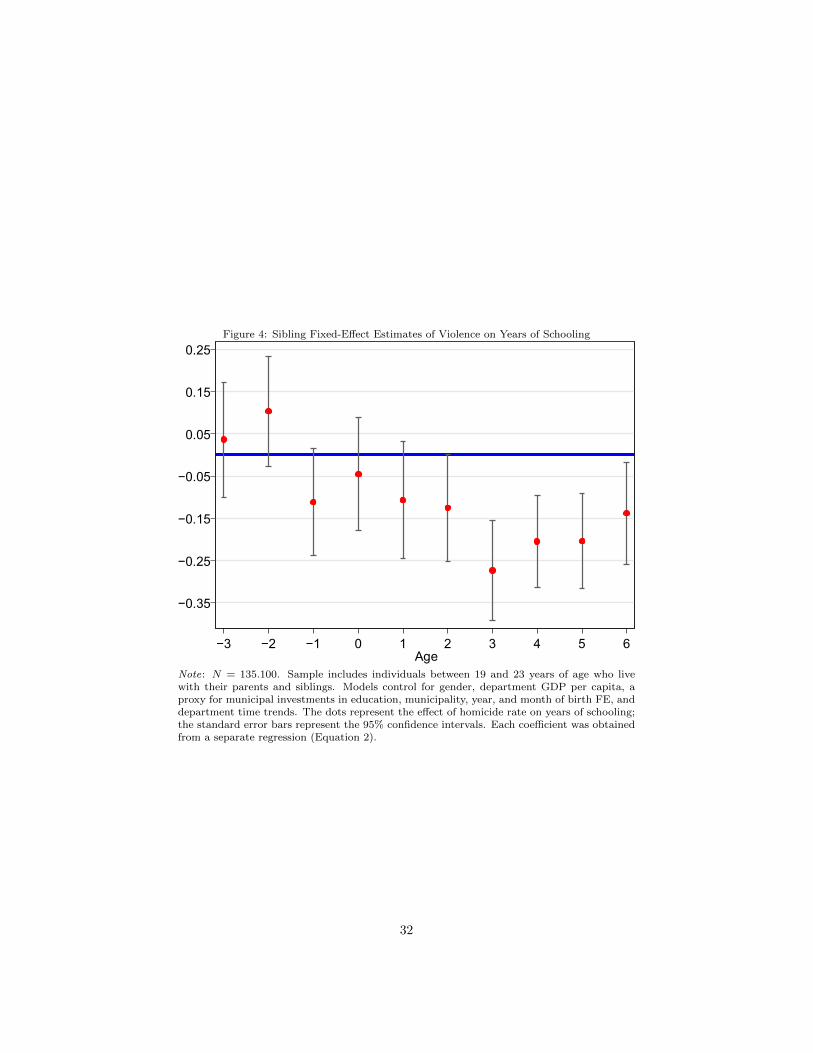
Figure 4: Sibling Fixed-Effect Estimates of Violence on Years of Schooling
−0.05
−0.35
−0.15
0.15
−0.25
0.25
0.05
−3 −2 −1 0 1 2 3 4 5 6Age
Note: N = 135.100. Sample includes individuals between 19 and 23 years of age who livewith their parents and siblings. Models control for gender, department GDP per capita, aproxy for municipal investments in education, municipality, year, and month of birth FE, anddepartment time trends. The dots represent the effect of homicide rate on years of schooling;the standard error bars represent the 95% confidence intervals. Each coefficient was obtainedfrom a separate regression (Equation 2).
32
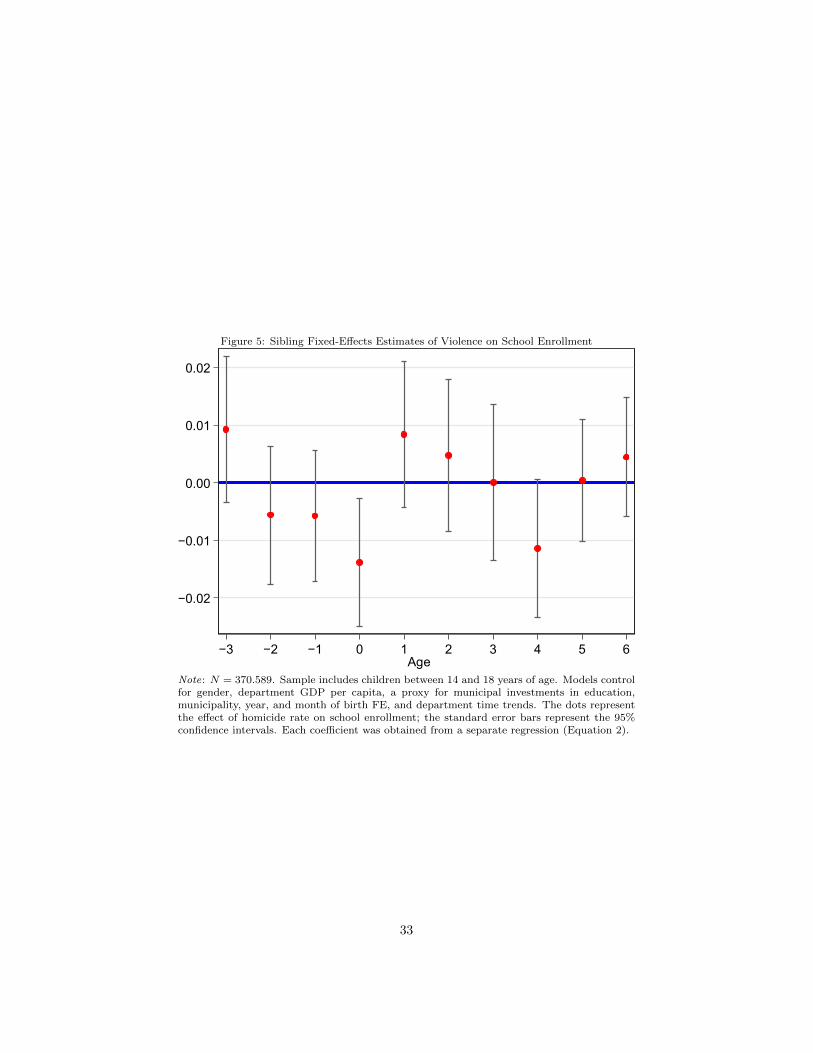
Figure 5: Sibling Fixed-Effects Estimates of Violence on School Enrollment
0.00
−0.02
0.01
−0.01
0.02
−3 −2 −1 0 1 2 3 4 5 6Age
Note: N = 370.589. Sample includes children between 14 and 18 years of age. Models controlfor gender, department GDP per capita, a proxy for municipal investments in education,municipality, year, and month of birth FE, and department time trends. The dots representthe effect of homicide rate on school enrollment; the standard error bars represent the 95%confidence intervals. Each coefficient was obtained from a separate regression (Equation 2).
33
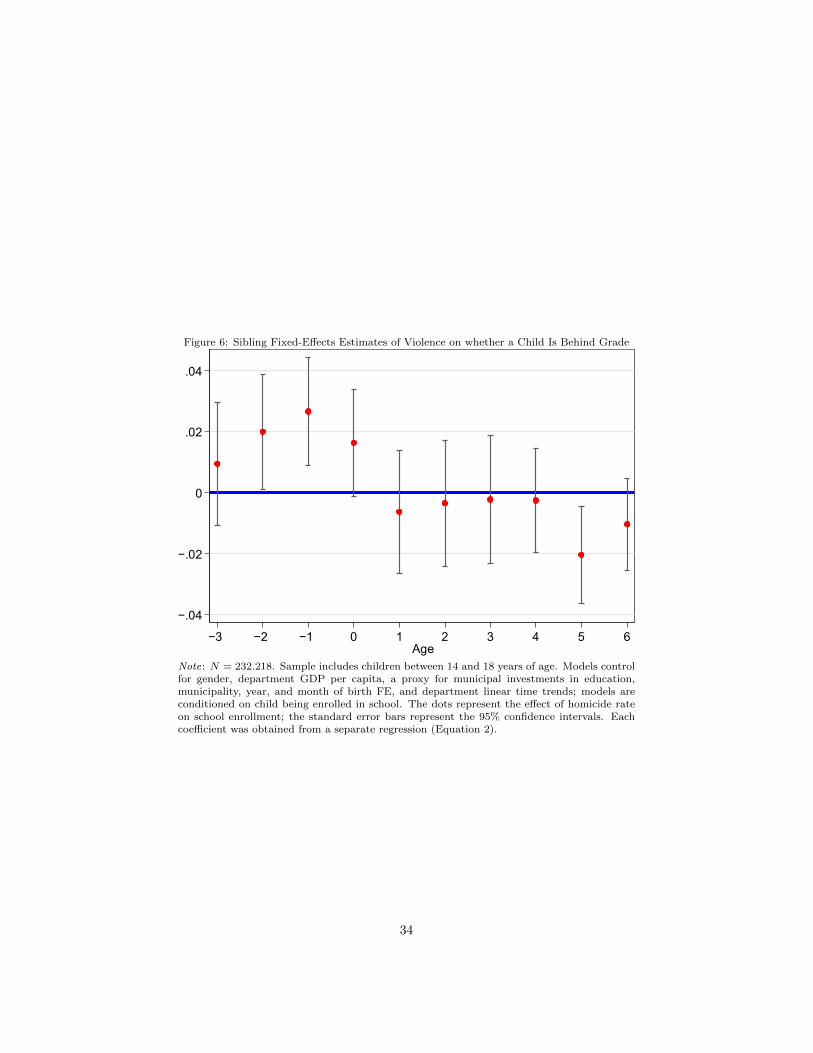
Figure 6: Sibling Fixed-Effects Estimates of Violence on whether a Child Is Behind Grade
−.04
−.02
0
.02
.04
−3 −2 −1 0 1 2 3 4 5 6Age
Note: N = 232.218. Sample includes children between 14 and 18 years of age. Models controlfor gender, department GDP per capita, a proxy for municipal investments in education,municipality, year, and month of birth FE, and department linear time trends; models areconditioned on child being enrolled in school. The dots represent the effect of homicide rateon school enrollment; the standard error bars represent the 95% confidence intervals. Eachcoefficient was obtained from a separate regression (Equation 2).
34
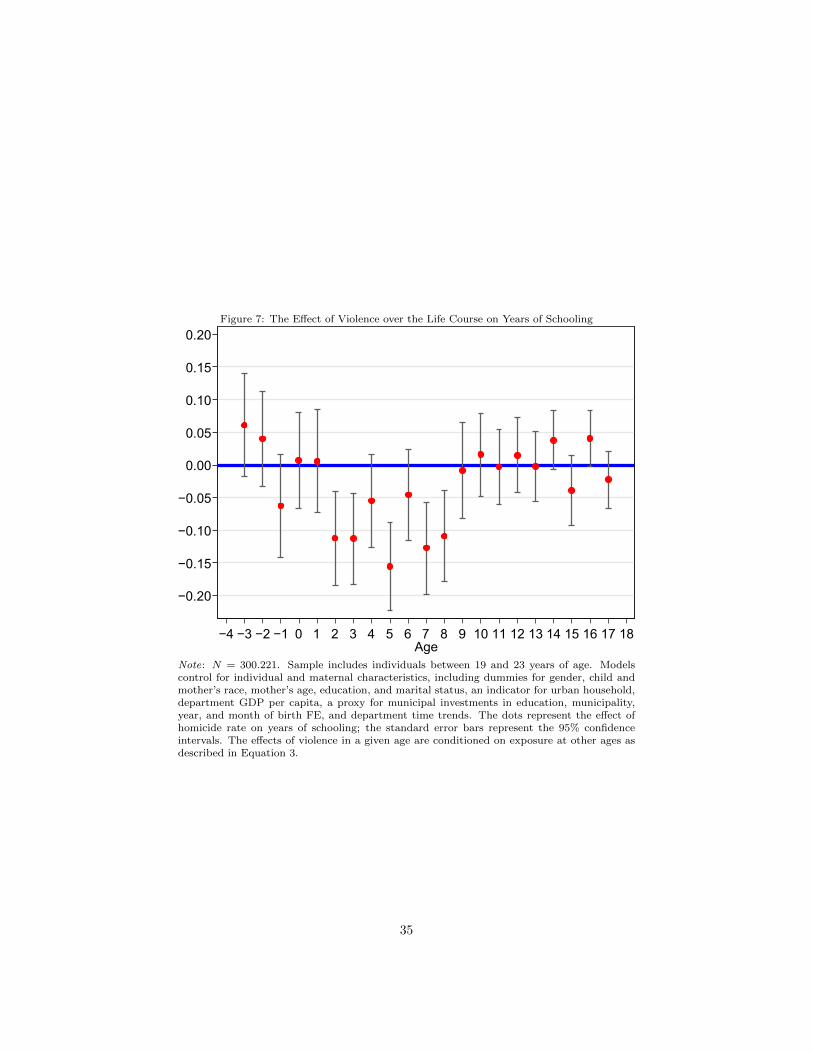
Figure 7: The Effect of Violence over the Life Course on Years of Schooling
0.00
−0.20
−0.10
0.05
0.15
−0.15
0.10
0.20
−0.05
−4 −3 −2 −1 0 1 2 3 4 5 6 7 8 9 10 11 12 13 14 15 16 17 18Age
Note: N = 300.221. Sample includes individuals between 19 and 23 years of age. Modelscontrol for individual and maternal characteristics, including dummies for gender, child andmother’s race, mother’s age, education, and marital status, an indicator for urban household,department GDP per capita, a proxy for municipal investments in education, municipality,year, and month of birth FE, and department time trends. The dots represent the effect ofhomicide rate on years of schooling; the standard error bars represent the 95% confidenceintervals. The effects of violence in a given age are conditioned on exposure at other ages asdescribed in Equation 3.
35
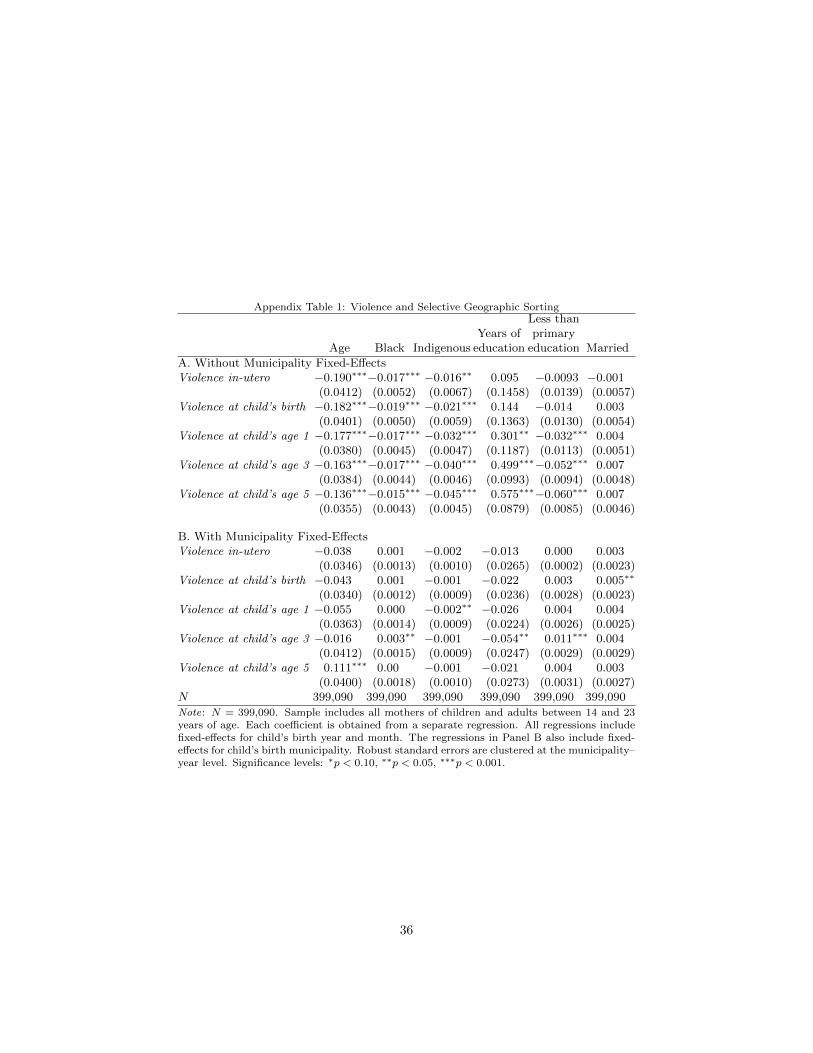
Appendix Table 1: Violence and Selective Geographic Sorting
Age Black IndigenousYears of
education
Less thanprimary
education Married
A. Without Municipality Fixed-EffectsViolence in-utero −0.190∗∗∗−0.017∗∗∗ −0.016∗∗ 0.095 −0.0093 −0.001
(0.0412) (0.0052) (0.0067) (0.1458) (0.0139) (0.0057)Violence at child’s birth −0.182∗∗∗−0.019∗∗∗ −0.021∗∗∗ 0.144 −0.014 0.003
(0.0401) (0.0050) (0.0059) (0.1363) (0.0130) (0.0054)Violence at child’s age 1 −0.177∗∗∗−0.017∗∗∗ −0.032∗∗∗ 0.301∗∗ −0.032∗∗∗ 0.004
(0.0380) (0.0045) (0.0047) (0.1187) (0.0113) (0.0051)Violence at child’s age 3 −0.163∗∗∗−0.017∗∗∗ −0.040∗∗∗ 0.499∗∗∗−0.052∗∗∗ 0.007
(0.0384) (0.0044) (0.0046) (0.0993) (0.0094) (0.0048)Violence at child’s age 5 −0.136∗∗∗−0.015∗∗∗ −0.045∗∗∗ 0.575∗∗∗−0.060∗∗∗ 0.007
(0.0355) (0.0043) (0.0045) (0.0879) (0.0085) (0.0046)
B. With Municipality Fixed-EffectsViolence in-utero −0.038 0.001 −0.002 −0.013 0.000 0.003
(0.0346) (0.0013) (0.0010) (0.0265) (0.0002) (0.0023)Violence at child’s birth −0.043 0.001 −0.001 −0.022 0.003 0.005∗∗
(0.0340) (0.0012) (0.0009) (0.0236) (0.0028) (0.0023)Violence at child’s age 1 −0.055 0.000 −0.002∗∗ −0.026 0.004 0.004
(0.0363) (0.0014) (0.0009) (0.0224) (0.0026) (0.0025)Violence at child’s age 3 −0.016 0.003∗∗ −0.001 −0.054∗∗ 0.011∗∗∗ 0.004
(0.0412) (0.0015) (0.0009) (0.0247) (0.0029) (0.0029)Violence at child’s age 5 0.111∗∗∗ 0.00 −0.001 −0.021 0.004 0.003
(0.0400) (0.0018) (0.0010) (0.0273) (0.0031) (0.0027)N 399,090 399,090 399,090 399,090 399,090 399,090
Note: N = 399,090. Sample includes all mothers of children and adults between 14 and 23years of age. Each coefficient is obtained from a separate regression. All regressions includefixed-effects for child’s birth year and month. The regressions in Panel B also include fixed-effects for child’s birth municipality. Robust standard errors are clustered at the municipality–year level. Significance levels: ∗p < 0.10, ∗∗p < 0.05, ∗∗∗p < 0.001.
36
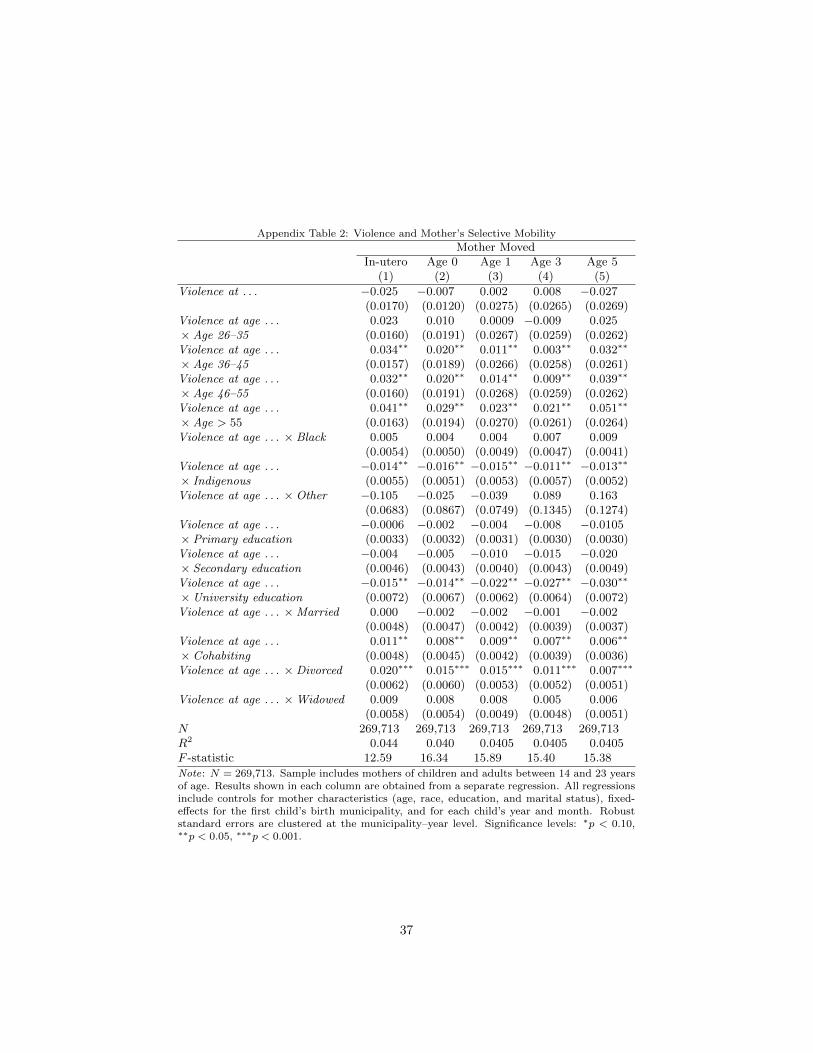
Appendix Table 2: Violence and Mother’s Selective Mobility
Mother MovedIn-utero Age 0 Age 1 Age 3 Age 5
(1) (2) (3) (4) (5)
Violence at . . . −0.025 −0.007 0.002 0.008 −0.027(0.0170) (0.0120) (0.0275) (0.0265) (0.0269)
Violence at age . . . 0.023 0.010 0.0009 −0.009 0.025×Age 26–35 (0.0160) (0.0191) (0.0267) (0.0259) (0.0262)Violence at age . . . 0.034∗∗ 0.020∗∗ 0.011∗∗ 0.003∗∗ 0.032∗∗
×Age 36–45 (0.0157) (0.0189) (0.0266) (0.0258) (0.0261)Violence at age . . . 0.032∗∗ 0.020∗∗ 0.014∗∗ 0.009∗∗ 0.039∗∗
×Age 46–55 (0.0160) (0.0191) (0.0268) (0.0259) (0.0262)Violence at age . . . 0.041∗∗ 0.029∗∗ 0.023∗∗ 0.021∗∗ 0.051∗∗
×Age > 55 (0.0163) (0.0194) (0.0270) (0.0261) (0.0264)Violence at age . . . × Black 0.005 0.004 0.004 0.007 0.009
(0.0054) (0.0050) (0.0049) (0.0047) (0.0041)Violence at age . . . −0.014∗∗ −0.016∗∗ −0.015∗∗ −0.011∗∗ −0.013∗∗
× Indigenous (0.0055) (0.0051) (0.0053) (0.0057) (0.0052)Violence at age . . . ×Other −0.105 −0.025 −0.039 0.089 0.163
(0.0683) (0.0867) (0.0749) (0.1345) (0.1274)Violence at age . . . −0.0006 −0.002 −0.004 −0.008 −0.0105× Primary education (0.0033) (0.0032) (0.0031) (0.0030) (0.0030)Violence at age . . . −0.004 −0.005 −0.010 −0.015 −0.020× Secondary education (0.0046) (0.0043) (0.0040) (0.0043) (0.0049)Violence at age . . . −0.015∗∗ −0.014∗∗ −0.022∗∗ −0.027∗∗ −0.030∗∗
×University education (0.0072) (0.0067) (0.0062) (0.0064) (0.0072)Violence at age . . . ×Married 0.000 −0.002 −0.002 −0.001 −0.002
(0.0048) (0.0047) (0.0042) (0.0039) (0.0037)Violence at age . . . 0.011∗∗ 0.008∗∗ 0.009∗∗ 0.007∗∗ 0.006∗∗
× Cohabiting (0.0048) (0.0045) (0.0042) (0.0039) (0.0036)Violence at age . . . ×Divorced 0.020∗∗∗ 0.015∗∗∗ 0.015∗∗∗ 0.011∗∗∗ 0.007∗∗∗
(0.0062) (0.0060) (0.0053) (0.0052) (0.0051)Violence at age . . . ×Widowed 0.009 0.008 0.008 0.005 0.006
(0.0058) (0.0054) (0.0049) (0.0048) (0.0051)N 269,713 269,713 269,713 269,713 269,713R2 0.044 0.040 0.0405 0.0405 0.0405F -statistic 12.59 16.34 15.89 15.40 15.38
Note: N = 269,713. Sample includes mothers of children and adults between 14 and 23 yearsof age. Results shown in each column are obtained from a separate regression. All regressionsinclude controls for mother characteristics (age, race, education, and marital status), fixed-effects for the first child’s birth municipality, and for each child’s year and month. Robuststandard errors are clustered at the municipality–year level. Significance levels: ∗p < 0.10,∗∗p < 0.05, ∗∗∗p < 0.001.
37
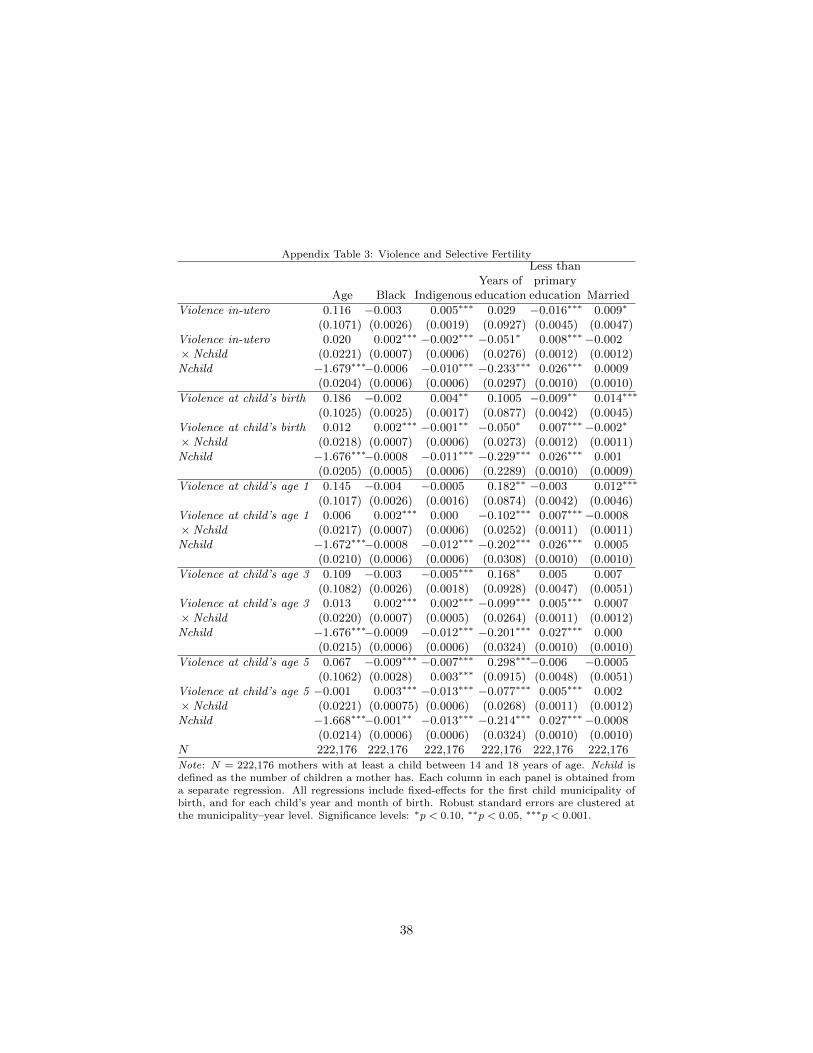
Appendix Table 3: Violence and Selective Fertility
Age Black IndigenousYears of
education
Less thanprimary
education Married
Violence in-utero 0.116 −0.003 0.005∗∗∗ 0.029 −0.016∗∗∗ 0.009∗
(0.1071) (0.0026) (0.0019) (0.0927) (0.0045) (0.0047)Violence in-utero 0.020 0.002∗∗∗ −0.002∗∗∗ −0.051∗ 0.008∗∗∗−0.002×Nchild (0.0221) (0.0007) (0.0006) (0.0276) (0.0012) (0.0012)Nchild −1.679∗∗∗−0.0006 −0.010∗∗∗ −0.233∗∗∗ 0.026∗∗∗ 0.0009
(0.0204) (0.0006) (0.0006) (0.0297) (0.0010) (0.0010)
Violence at child’s birth 0.186 −0.002 0.004∗∗ 0.1005 −0.009∗∗ 0.014∗∗∗
(0.1025) (0.0025) (0.0017) (0.0877) (0.0042) (0.0045)Violence at child’s birth 0.012 0.002∗∗∗ −0.001∗∗ −0.050∗ 0.007∗∗∗−0.002∗
×Nchild (0.0218) (0.0007) (0.0006) (0.0273) (0.0012) (0.0011)Nchild −1.676∗∗∗−0.0008 −0.011∗∗∗ −0.229∗∗∗ 0.026∗∗∗ 0.001
(0.0205) (0.0005) (0.0006) (0.2289) (0.0010) (0.0009)
Violence at child’s age 1 0.145 −0.004 −0.0005 0.182∗∗ −0.003 0.012∗∗∗
(0.1017) (0.0026) (0.0016) (0.0874) (0.0042) (0.0046)Violence at child’s age 1 0.006 0.002∗∗∗ 0.000 −0.102∗∗∗ 0.007∗∗∗−0.0008×Nchild (0.0217) (0.0007) (0.0006) (0.0252) (0.0011) (0.0011)Nchild −1.672∗∗∗−0.0008 −0.012∗∗∗ −0.202∗∗∗ 0.026∗∗∗ 0.0005
(0.0210) (0.0006) (0.0006) (0.0308) (0.0010) (0.0010)
Violence at child’s age 3 0.109 −0.003 −0.005∗∗∗ 0.168∗ 0.005 0.007(0.1082) (0.0026) (0.0018) (0.0928) (0.0047) (0.0051)
Violence at child’s age 3 0.013 0.002∗∗∗ 0.002∗∗∗ −0.099∗∗∗ 0.005∗∗∗ 0.0007×Nchild (0.0220) (0.0007) (0.0005) (0.0264) (0.0011) (0.0012)Nchild −1.676∗∗∗−0.0009 −0.012∗∗∗ −0.201∗∗∗ 0.027∗∗∗ 0.000
(0.0215) (0.0006) (0.0006) (0.0324) (0.0010) (0.0010)
Violence at child’s age 5 0.067 −0.009∗∗∗ −0.007∗∗∗ 0.298∗∗∗−0.006 −0.0005(0.1062) (0.0028) 0.003∗∗∗ (0.0915) (0.0048) (0.0051)
Violence at child’s age 5 −0.001 0.003∗∗∗ −0.013∗∗∗ −0.077∗∗∗ 0.005∗∗∗ 0.002×Nchild (0.0221) (0.00075) (0.0006) (0.0268) (0.0011) (0.0012)Nchild −1.668∗∗∗−0.001∗∗ −0.013∗∗∗ −0.214∗∗∗ 0.027∗∗∗−0.0008
(0.0214) (0.0006) (0.0006) (0.0324) (0.0010) (0.0010)N 222,176 222,176 222,176 222,176 222,176 222,176
Note: N = 222,176 mothers with at least a child between 14 and 18 years of age. Nchild isdefined as the number of children a mother has. Each column in each panel is obtained froma separate regression. All regressions include fixed-effects for the first child municipality ofbirth, and for each child’s year and month of birth. Robust standard errors are clustered atthe municipality–year level. Significance levels: ∗p < 0.10, ∗∗p < 0.05, ∗∗∗p < 0.001.
38
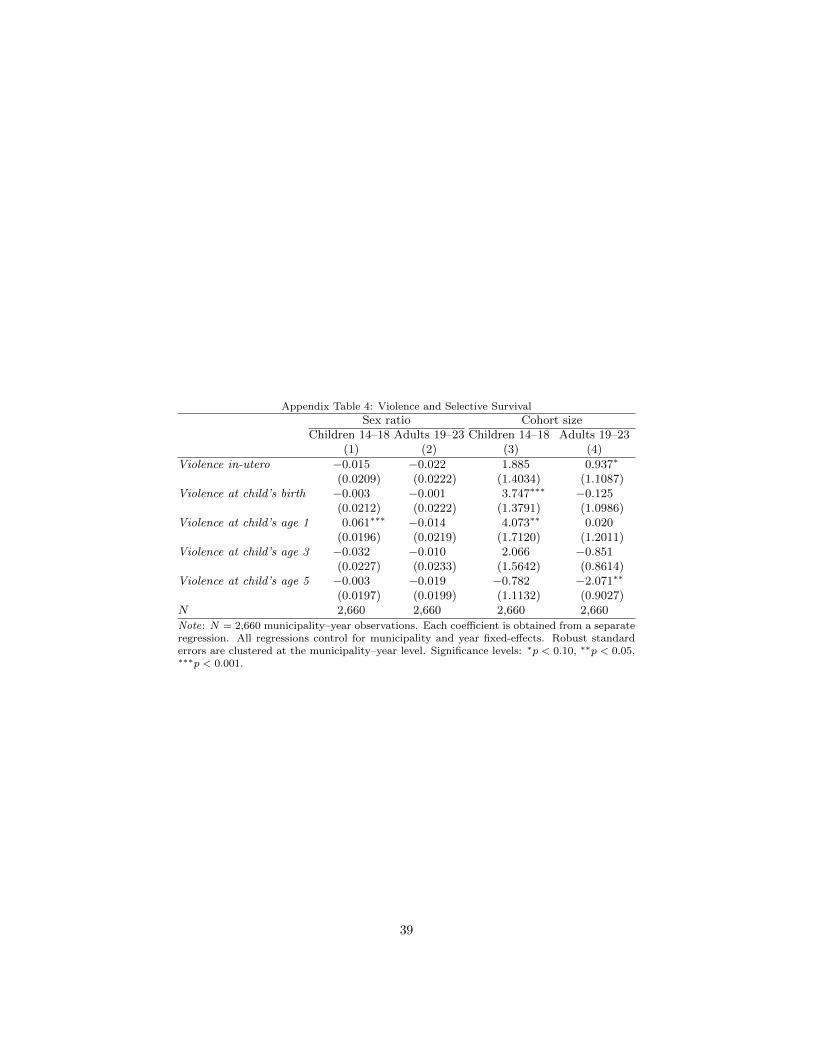
Appendix Table 4: Violence and Selective Survival
Sex ratio Cohort sizeChildren 14–18 Adults 19–23 Children 14–18 Adults 19–23
(1) (2) (3) (4)
Violence in-utero −0.015 −0.022 1.885 0.937∗
(0.0209) (0.0222) (1.4034) (1.1087)Violence at child’s birth −0.003 −0.001 3.747∗∗∗ −0.125
(0.0212) (0.0222) (1.3791) (1.0986)Violence at child’s age 1 0.061∗∗∗ −0.014 4.073∗∗ 0.020
(0.0196) (0.0219) (1.7120) (1.2011)Violence at child’s age 3 −0.032 −0.010 2.066 −0.851
(0.0227) (0.0233) (1.5642) (0.8614)Violence at child’s age 5 −0.003 −0.019 −0.782 −2.071∗∗
(0.0197) (0.0199) (1.1132) (0.9027)N 2,660 2,660 2,660 2,660
Note: N = 2,660 municipality–year observations. Each coefficient is obtained from a separateregression. All regressions control for municipality and year fixed-effects. Robust standarderrors are clustered at the municipality–year level. Significance levels: ∗p < 0.10, ∗∗p < 0.05,∗∗∗p < 0.001.
39