Embed Size (px)
Citation preview

1
The HHS Accelerator Data Project:
Interim Report
May 2013

2
The HHS Accelerator Data Project (Accelerator Data) is a City-led, cross sector initiative to help New York
City’s nonprofit sector manage data, benchmark performance, and share information with their peers,
funders and other stakeholders. First developed in 2010 as the NYC Human Service Data Project, the
initiative is positioned as long-term effort to increase accessibility and understanding of nonprofit
financial and performance data to strengthen the health and human services sector.
This memo provides an update on the work of Accelerator Data including 1) an overview of the initiative
2) a review of work to date and 3) next steps and key considerations.
History and Development
The conceptual framework for Accelerator Data was conceived in a public-private workgroup of the NYC
Strengthening Nonprofits Task Force, led by Linda I. Gibbs, the Deputy Mayor for Health and Human
Services. The taskforce urged the City to take leadership in convening stakeholders in the increasingly
complex area of collecting, reporting and sharing data on human service program performance and
outcomes. Launched as the NYC Human Service Data Project (HS Data), the initiative was funded by the
Federal Health and Human Services American Recovery and Reinvestment Act (ARRA) Strengthening
Communities Fund, and additionally supported by Blue Ridge Foundation and the DMHHS Management
Innovation division’s HHS Accelerator project. HS Data was overseen by a steering committee of
nonprofit and philanthropic representatives co-chaired by Matt Klein, the Executive Director of the Blue
Ridge Foundation and Louisa Chafee, Director of Management Innovation at DMHHS.
In its first two years, HS Data developed as an inclusive effort supported by professional consulting firms
that engaged hundreds of nonprofit agencies and the NYC philanthropic community. Stakeholders
participated in developing the initiative’s scope, focus, methodology and assessing its technology needs.
This effort laid significant groundwork for an ambitious undertaking widely understood to require multi-
year efforts to build and support collaboration in benchmarking for all health and human service
subsectors.
As the initiative’s development phase was completed, a key consideration for the next phase became
identifying an IT platform for the work to continue in an accessible and transparent environment that
supports the spirit of collaboration with which it was conceived. The launch of HHS Accelerator, the
City’s new IT-based health and human services procurement system emerged as a logical home for the
work as a centralized portal positioned to become the virtual interface for New York City nonprofits. As
part of the DMHHS Management Innovation division, Accelerator Data will have broadest opportunity to
engage and impact all health and human service subsectors and providers to realize its ambitious
mission to make data collection and reporting less burdensome and more meaningful to providers and
funders alike.
Focus and Goals
The initial phase of Accelerator Data worked to build consensus on the importance of increasing
nonprofit capacity to use data in strategic decision making and produce sector-level data to inspire
positive change. As work progressed, Accelerator Data focused on the way that the performance results

3
of NYC-funded human service programs are 1) defined, 2) reported to the City, and 3) made more
broadly available.
Defining results. A central premise of Accelerator Data is that in any human service field there
are at least a few results that most practitioners and observers can agree are important to
achieve. Accelerator Data aims to identify these key results through a broadly inclusive process
and to standardize their definitions for use by City agencies in their respective service
procurements.
Reporting results. The Accelerator Data initiative is one piece of an overall effort to simplify and
modernize the way that contracted service providers interact with City agencies. Within this
broad reform, Accelerator Data’s ultimate goal is to reduce the administrative burden
associated with traditional practices of reporting performance results.
Sharing results. Historically, information reporting flows mostly one-way, from contracted
service providers to government funding agencies. Accelerator Data’s goal is to promote
mechanisms to make aggregated performance data (i.e., data that is not client-specific) more
open and accessible so that providers and others gain perspective on their relative performance.
The initial phase of Accelerator Data’s work has resulted in development of three key vehicles for
ongoing collaboration in streamlining human service data:
Performance Measures – collaborative efforts to establish agreed upon key outcomes for
leading human services subsectors to standardize performance management and facilitate
understanding of how an organization is doing compared to its peers
Financial Measures – an IT-based tool to promote nonprofits’ understanding of fiscal health by
establishing agreed upon key indicators for organizations to perform enterprise-level fiscal
health analysis and calculate program costs
Document Vault – a virtual document repository to reduce nonprofits’ administrative burden by
allowing them to store key institutional documents in an online repository and make them
available to any of their public and private funders.
Approach and Methodology Throughout 2010, the Accelerator Data steering committee established core goals for the initiative,
investigated other similar and analogous efforts to use common metrics, and developed more familiarity
with technology advancements. The initiative was introduced to funders and service providers, and
feedback was solicited on plans and approach. This initial work led to the initiative to focus on two
areas for understanding health and human service performance:
Program performance and impact
Organizational financial health

4
Beginning in March 2011, Accelerator Data partnered with consultants Root Cause and FMA to facilitate
work in these two areas.
Performance Measures
In collaboration with Root Cause, Accelerator Data launched the effort to develop methodology for
identifying and defining key performance measures NYC’s Health and Human Services Sector. Root
Cause also tested this methodology in three pilot subsectors based on funding stream composition, the
presence of existing management data, control of systems of record, and dialogue between providers
and NYC agencies. Pilot subsectors were:
Workforce development
Senior services
Criminal justice involved adults
Root Cause’s methodology to develop key performance measures included the following process.
1) Review of academic and subsector publications and government documents as well as
interviews with academic, government, and provider experts.
2) Design, distribution, collection and analysis of two surveys completed by service providers in
each subsector. Survey response data, in conjunction with desk research, was used to develop
draft taxonomies for each subsector.
3) Gathering of feedback on draft taxonomies through three consecutive working groups per
subsector, including providers, agencies, funders, and research institutions convened by the
Accelerator Data team.
Root Cause received feedback to finalize the taxonomy of indicators for each of the three subsectors,
including definitions and antecedent terms as well as filters to ensure accurate comparisons in
benchmarking. In each subsector, Root Cause employed this methodology as well as collaborated with
City initiatives with similar goals.
Workforce Development
In the workforce development subsector, Root Cause worked with the New York City Workforce
Development Cabinet, a working group comprising several City Agencies that fund workforce
development programs. The Workforce Development Cabinet has been working to standardize their
respective definitions for common indicators to reduce the reporting burden on the providers and to
more easily analyze the services being funded. Root Cause focused its work on developing definitions for
four key indicators currently in the process of being standardized by city agencies in the Cabinet as well
as for three new indicators that the Cabinet was interested in defining in the future:
• Job Placements
• Average wage
• Training and skills development
• Job retention rates

5
• Work Readiness (new)
• Job quality (new)
• Job advancement (new)
See Appendix A for draft Workforce Development measures developed in pilot phase. Accelerator Data is
currently refining and finalizing the draft measures.
Senior Services
For the senior services subsector, Root Cause also collaborated closely with NYC Department for the
Aging (DFTA), specifically around their Innovative Senior Centers, as they were in the process of
developing a new database allowing providers to submit their reporting data online to the agency, as
well as to produce reports for their own internal use. This collaboration ensured alignment between
DFTA and Accelerator Data taxonomies. Root Cause identified and defined two outcome indicators that
are useful to senior services providers and meet the needs of the oversight agency:
Improved Nutrition
Increased Social Connections
Research also established that it is necessary to define each one of the above indicators separately for
home-bound clients and for center-based clients. As a result, four separate definitions were created.
Since the draft measures were completed, DFTA has continued the work that was started during this
pilot phase and has fully developed a complete set of performance measures for each of its programs.
They are incorporating these measures into a case management system to be launched over the next
year.
See Appendix B for draft Senior Services measures developed in pilot phase.
Criminal Justice Involved Adults
Root Cause learned that prior to their research, little work had been done to develop common metrics
in the field of criminal justice. The Alternatives to Incarceration (ATI)/Re-entry Coalition is one of the
first efforts designed to make its members’ work more understandable to the funding community. For
this reason, Root Cause, with input from the Accelerator Data team, NYC agencies, and providers
narrowed the scope of work in this field and focused on defining common indicators for ATI. The NYC
Department of Probation (DOP), NYC Department of Corrections (DOC), and Office of the Criminal
Justice Coordinator (CJC) were engaged throughout the process due to their expertise and active role in
this subsector. Through stakeholder engagement, Root Cause defined the following seven indicators:
• Number of individuals interviewed
• Number of individuals eligible for ATI
• Number of individuals enrolled in ATI
• Number of successful completions
Number of unsuccessful completions
• Number of successful ATI sentences
• Recidivism

6
See Appendix C for draft Criminal Justice Involved Adults measures developed in pilot phase. Accelerator
Data is currently refining and analyzing the draft measures.
Financial Measures
In collaboration with FMA, Accelerator Data worked to identify key performance metrics to understand
and measure organizational financial health. FMA drafted an enterprise‐level dashboard of key financial
indicators critical to monitoring organizational financial health and applicable across a wide range of
nonprofit subsectors.
FMA proposed an organizational financial health dashboard consisting of 15 essential metrics presented
as a set of graphs with supporting definitions and guidelines for interpretation. FMA split financial
metrics into two categories, as noted below: (A) those that represent basic information reflecting and
organization’s financial health and should be accessible to other organizations and stakeholders, and (B)
those that represent information relevant to an organization’s internal management and should be
made publically available only in the aggregate for sector trends analysis. FMA also recommended that
for most relevant benchmarking, providers should be able to customize financial metrics reports by
geography, budget size, program area, and funding source concentration (public, private, etc.). Key
metrics include the following:
Operating Margin Including and Excluding Depreciation (A)
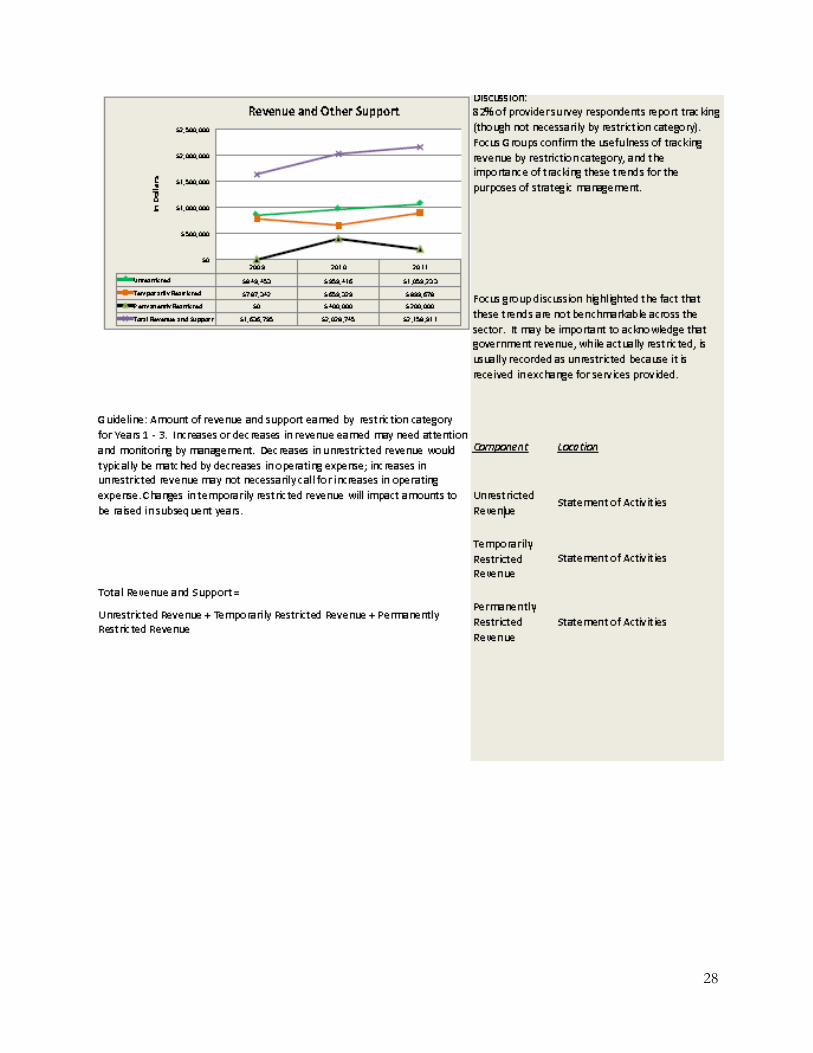
Total Revenue and Support (A)
Unrestricted Revenue Composition (A)
Board Giving Rate (A)
Major Expense Categories as Percent Total Expenses (B)
Months Cash on Hand (B)
Months Working Capital (A)
Current Ratio (A)
Debt to Net Assets (A)
Net Asset Balances (A)
Line of Credit Reporting (A)
Months Liquid Unrestricted Net Assets (B)
Current Asset Composition (B)
Accumulated Depreciation as % Net Assets (B)
FMA also submitted a recommended methodology for estimating the cost of program delivery. FMA
developed this methodology by incorporating best practices in the field and through feedback from
external stakeholders. The methodology includes the following steps:
Define programs
Identify and calculate expense items
Attribute specific program expenses to appropriate programs

7
Allocate common expenses shared by programs and administrative functions
Allocate management and general expenses to program
Use knowledge of full cost of program to negotiate pricing for service delivery and make
informed decisions for fiscal health
See Appendix D for draft financial measures developed in pilot phase.
Next Steps
Having completed a rigorous development phase and determined a permanent home and platform,
Accelerator Data is poised to implement tools and processes to help nonprofits better understand and
utilize their organization’s data.
The next phase of Accelerator Data includes four key components:
Financial Reports for Nonprofits
New Performance Measures Definitions
Alignment with HHS Accelerator
Collaborative Community Stakeholder Development
Financial Reports for Nonprofits
Starting in Spring 2013, Accelerator Data will launch the initial phase of financial health reporting for providers to evaluate their organization’s fiscal health in comparison to sector averages. Aggregate financial reports of NYC client and community service providers will be published on the Accelerator Data webpage. Organization names will not be published on the website, only averages. Providers will be able to request a customized report for their own organization to see how they are performing in relation to their peer group. The initial launch will include 4 of the 15 key fiscal health metrics identified by FMA: 1. Debt to Net Asset – provides a snapshot of organization’s assets and liabilities. 2. Net Asset Balances – reflects an organization’s net worth to help management measure its ability to
reinvest profits towards its mission. 3. Major Expense Categories as Percent of Total Expenses – shows overview of an organization’s
spending activity. 4. Current Asset Composition – provides an internal management view to measure liquidity and cash
flow. Accelerator Data will start with these 4 metrics, provider feedback on report efficacy and impact will be analyzed and the nonprofit sector will be engaged to refine and expand development of reports. These 4 metrics were selected particularly because each data point comprising the formulas is derived from the Form 990. Using source data from a custom extract of the 990 Data from the IRS, the reports can be produced without requiring new data entry from providers (a central project principle). New Performance Measures Definitions

8
Based on methodology established by Root Cause, Accelerator Data is currently identifying key performance measures for Shelter Services. These services are defined as temporary housing provided to clients in need of emergency transitional shelter having been displaced from their homes. Expansion to additional subsectors will benefit from iterative process refinement. To support this effort and ensure maximum stakeholder involvement, Accelerator Data will identify two policy co-chairs – one from a City Agency and the other from the nonprofit sector – to lead participants in development of performance measures. While the Accelerator Data central team will still manage the administrative function of identifying and convening stakeholders and monitoring project progress, the co-chairs will provide essential feedback and guidance to help draft surveys, create agenda for workgroup meetings, and develop performance measures definitions. By bringing key policy leaders into the discussion, Accelerator Data ensures continued stakeholder participation, accountability, and practical institutionalization of future measures. Alignment with HHS Accelerator
The HHS Accelerator initiative, launched by Mayor Michael R. Bloomberg and led by the Deputy Mayor for Health and Human Services Linda I. Gibbs, is reengineering, simplifying and speeding the procurement process for City agencies and client and community service organizations. Improvement of the procurement process is achieved by implementing a series of policy reforms, restructuring of rules and regulations, centralizing portions of procurement oversight, and building a web-based system to support these reforms. HHS Accelerator is dedicated to supporting the nonprofit sector by improving business relationships with the NYC Agencies they contract with to provide client and community services. The central HHS Accelerator provider portal (www.nyc.gov/hhsaccelerator) will serve as the landing page to access information on initiatives that support the sector, including Accelerator Data, where providers can currently access financial reports and project updates.
HHS Accelerator reflects a number of Accelerator Data’s related principles and presents numerous new
opportunities to support the nonprofit sector.
HHS Accelerator comprises the following components:
Document Vault: a secure online repository for providers to store and share
administrative documents (launched February 2013)
Prequalification Application: a questionnaire requesting basic information and
institutional documents relating to organizational capacity, compliance with filings
regulations and experience delivering relevant services in order to prequalify to
compete for NYC client and community services contracts(launched February 2013)
Procurement: a centralized system for providers to learn about upcoming NYC
client and community services procurements, receive RFPs and submit proposals,
view award selection results and submit additional documents required upon
award selection (anticipated launch Q4 2013)
Financials: a financial management module that allows providers to manage
budgets, invoices and payments for NYC client and community services contracts
(anticipated launch Q4 2013)

9
First, terminology used to define human services and related outcomes has been standardized. The
foundation of the HHS Accelerator web-based application is the New York City Client and Community
Services Catalog (CCS Catalog), a glossary that lists and defines the myriad services provided by the
human services sector across NYC. The City Agencies that procure client and community services have
agreed to all terms and definitions published in this standardized classification system. The CCS Catalog
is linked to all HHS Accelerator system functions, including provider profiles, the NYC Procurement
Roadmap (list of all upcoming and current NYC CCS procurements) and registered contracts.
With the development of the CCS Catalog, the City of New York has a unique opportunity to develop
standard performance measures for each service area in the glossary. As HHS Accelerator develops the
Procurement and Financials Roadmaps, additional subsectors for performance measures will be
identified based on upcoming procurements. Measures can be incorporated into new City contracts,
with standard metric definitions allowing for meaningful comparison of performance in “an apples-to-
apples” way. Organizations can benchmark themselves against peers, learn from high performers, and
attract funding based on the quality of their services. Common definitions of key results also can reduce
the overall reporting burden for service providers. Instead of responding to unique demands of
individual contracts with slight variations in their performance definitions, organizations would be able
to track and report their results consistently across funding streams.
Second, by IT enabling the procurement process for client and community services in a central portal,
HHS Accelerator offers a unique opportunity for sector-based analysis that can help providers
understand not only their business relationship with the City but also relative performance and the
service delivery landscape in NYC. This aligns with Accelerator Data’s guiding principle to use
information providers report to the City to offer them meaningful reports in return. Data from the
prequalification application can be aggregated to identify shifting performance realities and challenges
for organizations in areas such as board governance, internal controls and policy, and corporate filing
practices. Since the central portal will also be leveraged to enable management of budgeting, invoicing
and payments, aggregate data can be immensely helpful to leaders and finance executives both in
nonprofits and City Agencies. Not only will IT enablement bring greater accuracy, transparency and
speed to finance management it will also allow nonprofit leaders to execute multi-year analyses.
Prospective forecasting and forensic auditing will help leaders make critical and well informed decisions
about programs, costs and operations. In turn, the City can aggregate nuanced nonprofit data across
multiple Agencies to examine policy impacts on fiscal health in new ways, and support engagement of
state, federal and philanthropic partners.
Finally, the opportunity also exists to leverage the IT infrastructure in order to provide the sector with
maximally useful reports. While the conceptual framework and collaborative cross-sector conversation
continue to build, HHS Accelerator will develop IT strategy for user interface and delivery of reports. The
IT strategy will leverage data and functionality of HHS Accelerator system where possible. Opportunities
are limitless and bound only by technological capacity which can be periodically enhanced to meet
emerging sector and City needs.

10
Collaborative Community Stakeholder Development
The key to the success of Accelerator Data is continued cross-sector collaboration and engagement of
stakeholders, including representatives from the nonprofit sector and private and public funders.
Continued development of HHS Accelerator Data will be led by Deputy Mayor Gibbs, managed by the
Management Innovation Team. This work will be governed by the Strengthening Nonprofits (SNP) Task
Force, Human Services Council Business Solutions (HSC) Workgroup, and the HHS Accelerator Executive
Steering Committee. The Business Solutions Workgroup will lead the effort to identify and ensure full
participation of nonprofit stakeholders. The Management Innovation Team will continue to facilitate
cross sector communication and participation by senior fiscal and program staff from City Agencies.
This partnership will allow the initiative to achieve its ultimate goals to help reduce administrative
burden, provide meaningful metrics and reporting, and improve the delivery of client and community
based services.

11
Appendix A: DRAFT - Workforce Development Performance Measures
Workforce Development Performance Indicators
Indicator 1: Job Placements
Definition: A count of placements into unsubsidized jobs that meet the following criteria:
Direct and indirect placement into jobs
Pay the legal industry minimum wage1
Part-time jobs that equal 20 hours/week or the equivalent of 20 hours/week x minimum legal, industry hourly wage
2
Full-time jobs that equal 35 or more hours/week
Client able to show proof of placement.
Antecedent Terms:
Subsidized: Wage subsidized by government
Proof of placement: Evidence of paystub, employer letter, or other proof of payment to establish that client is enrolled on an employer’s payroll.
3
Antecedent Terms to be defined:
Direct placement
Indirect placement
Notes:
1 Self-employment or for fee-for-service activities that pay below minimum wage cannot be counted toward an
eligible job placement.
2 The definition for an equivalent standard defines instances where a client may work fewer than 20 hours per week,
but has average weekly earnings minimally equivalent to a client that works 20 hours per week at minimum wage. For instance, assuming the minimum wage is $7.25 per hour, if a client on average, works 10 hours per week at $14.50, this client’s job should be counted as a “part-time” placement. The client’s total average earnings are equivalent to working 20 hours/week at the legal, hourly minimum wage. 3 Providers indicated that burden of providing proof of payment should not just be placed solely on the client; an
employer could also provide evidence of employment. In the future, providers may also have opportunities to access wage information through city databases.
Indicator 2: Wage Level
Average Wage: Total of weekly or hourly wages for participants at time of job placements divided by the total number
of participants placed. 1,2
For jobs with hours that vary week to week, provide an average wage across [X] weeks3
Median Wage: To be defined 4
Notes:
1 Many providers thought that knowing hourly wage was preferable to knowing weekly wage.
2 This indicator will automatically calculate average wage based on information entered into “Job Placement” indicator
category.

12
3 No agreement on number of weeks for jobs with varying hours.
4 Providers indicated that large organizations, such as those serving an average of 50,000 or more people, may find
median wage to be a more accurate representation of wage.
Indicator 3: Job Retention Rate
Definition: The count of participants who are employed at each of following milestones [30, 90, 180, and 365 days] in
any job divided by the total number of participants placed.1
Antecedent Terms:
Participant/Client: Used interchangeably, a participant or client is any individual who has completed an intake form and has started to receive a service.
2, 3
Enrolled: Any individual who is eligible for and has started receiving services from the organization4, 5, 6
Job: Job must meet the criteria defined by the “job placements” indicator.
Notes:
1 The timeframe used to establish the denominator of “total number of participants placed” needs to be defined.
2 Providers discussed whether or not to include the qualifier, “and has started to receive a service” since many private
funders do not include this language. No agreement reached.
3 Organizations vary in their selectiveness used to screen applicants. Depending on their mission, some organizations
have an open-door policy, serving thousands of people per year while other organizations may have higher enrollment
standards, accepting only applicants that meet specific qualifications. These policies affect the magnitude of client
placements or enrollments reported, impacting the denominator used to measure job retention rate. Understanding
an organization’s level of selectiveness is critical, because it reflects how organizations allocate their staffing and
financial resources. Providers suggested that filters might be established to understand the effort and resources used
in 1) outreach; 2) recruiting; 3) intake/application; 4) assessment; 5) enrollment. These filters would allow
organizations to compare the level of rigor used at each step. For instance, it would be helpful to identify
organizations that spent two hours with a client on the intake process versus an organization that spent 10 minutes to
review an application and accept a client. Providers also noted that filters based on a program’s service population are
critical in evaluating the level of resources required.
4 Providers indicated that in youth programs, there may be a difference between the use of “enrolled” and “engaged.”
5 No agreement reached on whether “qualifying” should be inserted before “services from the organization.”
6 Providers discussed whether or not there should be a “pre-enrollment” category that could be used to define a
person who is in between the “participant/client” and the “enrolled” stage.
Indicator 4: Occupational Skills Development
Definition: Total number of unduplicated participants served in workforce programs who have:
a) Completed the curriculum AND
b) Demonstrated proof of skills acquisition OR

13
c) Obtained an industry credential
Antecedent Terms:
“Proof of skills acquisition” is defined by industry standards1
“Completed” is defined by the organization
Notes:
1 Providers noted that since “proof of skills acquisition” should be focus on the increase in occupation skills, as
opposed to work- readiness skills, these skills should be defined by industry standards versus the organization. Using
these industry standards is especially important if provider data will be benchmarked at an aggregate level. Also, due
to the varying level of resources required for training in each specific industry, “proof of skills” should be segmented
by industry. Work-readiness skills relating to work behaviors, developing resume, etc. should be defined by the
organization, although some minimal criteria might be established.
Indicator 5: Work Readiness
Definition: Participant is document-ready and able to work immediately AND
a) Completed Work Readiness training OR
b) Demonstrates basic work behaviors
Antecedent Terms:
Document-ready: Clients must be able to provide documents that verify they are legally eligible for employment
(i.e. they should be able to complete the I-9 form).1
Able to Work: Client is physically able to work and has addressed barriers such as transportation, child-care, etc.
“Work Readiness training” is defined by the organization2
“Work behavior” is defined by the organization (e.g. punctual, cooperates with others)
Antecedent Terms to be defined:
Document-ready
Notes:
1 This antecedent term was not explicitly defined by providers, but Root Cause has proposed a draft definition.
2 Although defined by the organization, some minimal criteria might be established.
Indicator 6: Job Quality
Indicator: Job Quality
Definition: No agreed upon definition; criteria should focus on:
Living versus minimum wage
Availability of benefits- health insurance and paid-leave are most important.

14
Indicator 7: Job Advancement
Definition: No agreed upon definition; criteria should focus on:
Increased wages
Increased responsibility
Providers should only be required to track indicator within 365 day timeframe.
Antecedent Terms:
Wages: Wages due to external factors such as union policy should also be included
“Increased responsibility” refers to promotions, title changes, or additional responsibility as reported by the participant.
Workforce Development Filters
Filter Proposed categories
Age group
14-17
18-24
25+
Gender Male Female
Ethnicity Hispanic Non-Hispanic
Race
American Indian and Alaska Native
Asian
Black or African American
Native Hawaiian and Other Pacific Islander
White
Other race
Geography By zip code
By borough By community district
Income level
At or below 100% FPL
Above 100% but at or below 125% FPL
Above 125% but at or below 150% FPL
Above 150% but at or below 200% FPL
Above 200% FPL
Benefits received
Medicaid
Medicare
Social security
Pension
Food stamps
SSI/SSD
Unemployment
Other
Education level
No high school diploma or GED
High school diploma or GED
Some college
4-year college degree
Post-secondary degree
Population
Characteristics
Youth
Disconnected (youth)
Criminal justice-involved
Homeless
Disabled
Economically disadvantaged
Immigrant
Refugee
Participant Screening
Selective
Moderately Selective
Non-Selective

15

16
Appendix B – DRAFT Senior Services Performance Measures
Service Area: Nutritional Support and Meals
Outcome Indicator 1-A: Improved nutrition - Home delivered meal recipients
Measured by Survey questions to be used in collecting
the data: Answer options
Unduplicated number of meal
recipients reporting that the home
delivered meal program helps
them achieve a higher percentage
of DRI (Dietary Reference
Intakes)*
1.1 How many servings of fruit do you eat
per day? (A serving would equal one
medium apple)
a) 0 b) 1 c) 2
d) 3 or more e) I can’t eat this type of
food
1.2 How many servings of vegetables do
you eat per day? (A serving would
equal a handful of broccoli, or a cup of
carrots)
a) 0 b) 1 c) 2
d) 3 or more e) I can’t eat this type of
food
1.3 How many servings of whole or
enriched bread, cereal, rice, pasta,
noodles, or tortillas do you eat per
day?(A serving would equal one slice
of bread, one cup of cereal, or ½ cup
of cooked rice)
a) 0 b) 1 c) 2 d) 3
e) 4 f) 5 g) 6 or more h) I can’t eat this type of
food
1.4 How many servings of milk, cheese,
yogurt, or calcium rich soy products do
you eat per day? (A serving would
equal one cup of milk, one cup of
yogurt, or 2 oz. of cheese)
a) 0 b) 1 c) 2
d) 3 or more e) I can’t eat this type of
food
1.5 How many servings of high protein
food do you eat per day, such as meat,
poultry, tofu, fish, beans, peas, eggs,
or nuts? (A serving would equal ½ cup
of cooked beans, or 3 oz. of fish, meat,
or chicken)
a) 0 b) 1 c) 2
d) 3 or more e) I can’t eat this type of
food
1.6 Do you have any diet restrictions? a) Yes b) No
2.1 If you were not participating in this
meal program, would you have other
options for getting enough food daily?
a) Yes b) No
2.2 If you answered yes to the previous
question, please list the other options
that you have for getting enough food
a) Family b) Friends c) Fast food d) Other (please list)__________

17
daily:
Note: The purpose of Questions 1.1-1.6 is to assess the quality of nutrition and the meal recipient’s DRI. These questions
were added to the definition during the final working group, further work is necessary to determine the calculation that
would link the data from the questions’ responses to the indicator. NYC DFTA will work to finalize the work around the
associated calculations in future working groups that they are convening as part of their new database project. The
calculation will be shared with HSData.
Question 2.2 was added as a control question to ensure that survey participants, who answer “yes” to question 2.1, have
another source for adequate nutrition.
*Please note that this indicator should not be compared across home delivered meals and congregate meals. The percent
of meal recipients who achieve higher DRI through the senior center meals may be smaller than the percent who achieve
higher DRI through home delivered meals. Senior center meal participants are typically more mobile have more options,
and therefore are less consistent in using the meal service.
Antecedent Terms:
1. Dietary Reference Intakes (DRI)—A set of nutrient-based reference values that expand upon and replace the former Recommended Dietary Allowances (RDAs) and are based on scientifically grounded relationships between nutrient intakes and indicators of adequacy, as well as the prevention of chronic diseases
2. Meal recipient - Anyone who currently receives home-delivered meal services
Service Area: Nutritional Support and Meals
Outcome Indicator 1-B: Improved nutrition - Senior center meal participants
Measured by Survey questions to be used in collecting
the data: Answer options
Unduplicated number of
participants reporting that the
congregate meal program helps
them achieve a higher percentage
of DRI (Dietary Reference Intake)*
1.1 How many servings of fruit do you eat
per day? (A serving would equal one
medium apple)
f) 0 g) 1 h) 2
i) 3 or more j) I can’t eat this type of
food
1.2 How many servings of vegetables do
you eat per day? (A serving would
equal a handful of broccoli, or a cup of
carrots)
f) 0 g) 1 h) 2
i) 3 or more j) I can’t eat this type of
food
1.3 How many servings of whole or
enriched bread, cereal, rice, pasta,
noodles, or tortillas do you eat per
day?
i) 0 j) 1 k) 2 l) 3
m) 4 n) 5 o) 6 or more p) I can’t eat this type of
food
1.4 How many servings of milk, cheese,
yogurt, or calcium rich soy products do
f) 0 g) 1 h) 2
i) 3 or more j) I can’t eat this type of
food

18
you eat per day?
1.5 How many servings of high protein
food do you eat per day, such as meat,
poultry, tofu, fish, beans, peas, eggs,
or nuts?
f) 0 g) 1 h) 2
i) 3 or more j) I can’t eat this type of
food
1.6 Do you have any diet restrictions? c) Yes d) No
2.1 If you were not participating in this
meal program, would you have other
options for getting enough food daily?
c) Yes d) No
2.2 If you answered yes to the previous
question, please list the other options
that you have for getting enough food
daily:
e) Family f) Friends g) Fast food h) Other (please list)__________
Note: The purpose of Questions 1.1-1.6 is to assess the quality of nutrition and the meal participant’s DRI. These questions
were added to the definition during the final working group, further work is necessary to determine the calculation that
would link the data from the questions’ responses to the indicator. NYC DFTA will work to finalize the work around the
associated calculations in future working groups that they are convening as part of their new database project. The
calculation will be shared with HSData.
Question 2.2 was added as a control question to ensure that survey participants, who answer “yes” to question 2.1, have
another source for adequate nutrition.
*Please note that this indicator should not be compared across home delivered meals and congregate meals. The percent
of meal recipients who achieve higher DRI through the senior center meals may be smaller than the percent who achieve
higher DRI through home delivered meals. Senior center meal participants are typically more mobile have more options,
and therefore are less consistent in using the meal service.
Antecedent Terms:
1. Dietary Reference Intakes (DRI)—A set of nutrient-based reference values that expand upon and replace the former Recommended Dietary Allowances (RDAs) and are based on scientifically grounded relationships between nutrient intakes and indicators of adequacy, as well as the prevention of chronic diseases
2. Participant - Anyone who currently receives(participates in) congregate meal services at a senior center
Service Area: Overarching indicator across all service areas
Outcome Indicator 2-A: Increased social connections – Home delivered meal recipients
Measured by Survey questions to be used in collecting the data: Answer options

19
Unduplicated number of meal
recipients reporting that the home-
delivered meal is an important
source of social interaction
1. How many days a week do you receive a delivery from the home delivered meals program)?*
a) 1 b) 2 c) 3 d) 4
e) 5 f) 6
2. On the days that you receive meal delivery, is the contact with the meal delivery person your primary source of face-to-face social interaction?
a) Yes b) No
3. Is it important to you to have this interaction? a) Yes b) No
Note: “The meal recipients reporting that the … meal is an important source of social interaction” are the people who made
the following selection:
Question 2, choice a) AND/OR
Question 3, choice a)
*Question 1 does not directly determine the calculation, but it is used to set the logic of the questions that follow and to
provide additional background.
Antecedent Terms:
1. Meal recipient - Anyone who currently receives home-delivered meal services
Outcome Indicator 2-B: Increased social connections – Senior center participants
Measured by Survey questions to be used in collecting the data: Answer options
Unduplicated number of
participants reporting that the
senior center is an important
source of social connection
1. Is this senior center an important source of in-person social connection to you?
a) Yes b) No
2. Is this senior center the most important source of in-person social connection?
a) Yes b) No
3. Do you connect with other people outside of this center?
a) Yes b) No
4. On average, how many days per week do you come to this center?*
a) 1 b) 2 c) 3
d) 4 e) 5 f) 6
5. Do you go to other senior centers? **
a) Yes b) No
6. If you answer yes to the previous question, how
many days per week do you go to other centers? **
a) 1 b) 2 c) 3
d) 4 e) 5 f) 6
Note: The “participants reporting that the senior center is an important source of social connection” are the people who
made the following selection:
Question 1, choice a), AND/OR

20
Question 2, choice a), AND/OR
Question 3 choice b)
The people who answer b), c), d), e), or f) to the fourth question, regardless of their answers to the previous 3 questions
should be included in the count.
*Question 4 is a control question to make sure that people who may answer “no” to the first 2 questions, or “yes” to the
3rd
question, but come 3+ times a week are still included in the count. The data for this question may be collected not
through the survey but through attendance sheets or “card swipes” in the new database.
** Questions 5 and 6 are control questions to verify if senior centers are important sources of social connection on a
system level. These questions will capture people who may answer “no” to the first 2 questions, or “yes” on the third one,
AND come less than 3 times a week to this center, but go to other centers 3+ times, which would indicate that senior
centers are important source for social connection to them.
Antecedent Terms:
1. Participant - Anyone who currently receives(participates in) senior center services 2. Social connection – In this context, social connection refers to the act of being among people
Senior Services Filters
Filter Proposed categories
Age group 60-74 75-84
85+
Ethnicity Hispanic Non-Hispanic
Race American Indian and Alaska Native
Asian
Black or African American
Native Hawaiian and Other Pacific Islander
White
Other race
Geography By zip code
By borough
By community district
Income level At or below 100% FPL
Above 100% but at or below 125% FPL
Above 125% but at or below 150% FPL
Above 150% but at or below 200% FPL
Above 200% FPL
Benefits received Medicaid Food stamps

21
Medicare
Social security
Pension
SSI/SSD
Other
Education level No high school diploma or
GED
High school diploma or GED
Some college
4-year college degree
Post-secondary degree
Disabled Physical impairment
Cognitive impairment
Mental illness
Chronic disease
Living situation (living alone or with others) Living alone
Living with others – related
Living with others – non-
related
Building type (for home-bound persons) Elevator building Non-elevator building
Employment status Employed full time
Employed part-time
Retired
Actively looking for work
Unable to work
Length of time on the service (for home-bound meal
recipients, total number of years the person has been on
the service*)
0-5 years
6-10 years
More than 10
*Determined by when they
were first assessed and put
on service
Length of time* on service (for senior center participants) 0-5 years
5-10 years
10+ years
*Determined by when the
person first started coming
to the senior center

22
Appendix C – DRAFT Criminal Justice Involved Adults Performance Measures
Service Area: Alternatives to Incarceration (ATI)
Indicator #1: Definition: Rate Calculation:
Number of individuals
interviewed1
Number of individuals interviewed to determine if they are
eligible candidates for ATI program N/A
Antecedent Terms:
Eligible:2 o Incarceration-bound without ATI, for the required length of time o The program has made a determination that the individual is suitable for the program’s services
Notes:
1 “Number of individuals interviewed” is a surrogate indicator that shows that an attorney has consented. The “number of
people screened” was discussed as a potential indicator referring to the part of the intake process preceding interviewing, and
it was eliminated because it is not meaningful for benchmarking. “Screened” can mean anything from scanning the court
calendar, to doing initial assessment and selecting the people who are eligible on paper.
2 The providers pointed out that “eligibility” needs to be studied and further understood. There was a strong recommendation
that the city perform a baseline study to determine indicators for incarceration-bound, similar to a study done by CJA in 2003.
This study would have to be updated frequently because the criteria determining incarceration-bound population changes by
borough and overtime.
Indicator #2: Definition: Rate Calculation:
Number of individuals eligible
for ATI
Number of individuals interviewed by the program AND
found eligible for ATI and the defendant is interested and
willing to engage
Number of individuals
found eligible for
ATI/Number of individuals
interviewed
Antecedent Terms:
Eligible:1 o Incarceration-bound without ATI, for the required length of time o The program has made a determination that the individual is suitable for the program’s services
Notes:
1 The providers pointed out that “eligibility” needs to be studied and further understood. There was a strong recommendation
that the city performs a baseline study to determine indicators for incarceration-bound, similar to a study done by CJA in 2003.
This study would have to be updated frequently because the criteria determining incarceration-bound population changes by
borough and overtime.

23
Indicator #3: Definition: Rate Calculation:
Number of individuals enrolled
in ATI Number of individuals placed in ATI by court mandate
Number of individuals
enrolled in ATI/Number of
individuals eligible for ATI
Antecedent Terms:
Eligible:1 o Incarceration-bound without ATI, for the required length of time o The program has made a determination that the individual is suitable for the program’s services
Court mandate: To be defined Notes:
1 The providers pointed out that “eligibility” needs to be studied and further understood. There was a strong recommendation
that the city performs a baseline study to determine indicators for incarceration-bound, similar to a study done by CJA in 2003.
This study would have to be updated frequently because the criteria determining incarceration-bound population changes by
borough and overtime.
Indicator #4: Definition: Rate Calculation:
Number of successful
completions
Number of individuals who complete the ATI program, as
defined by the provider, judge, and the D.A. (in mandatory
sentencing). This includes:
The individuals who persist in that program for the length of the ATI mandate, AND
Individuals who transfer, with approval from the judge, to another program and persist in the new program for the length of the ATI mandate
Number of successful
completions/(Number of
individuals enrolled in the
ATI program minus the
number deceased or
physically incapable of
attending)
Antecedent Terms:
Enrolled: the program and the sentencing judge (and sometimes the District Attorney (D.A.)) agree that the person is in the program.
Indicator #5: Definition: Rate Calculation:
Number of unsuccessful
completions
Number of individuals who terminate early from the program
for failure to meet the conditions of the ATI program.
Type of unsuccessful completions:(Dropdown menu)1
a) Unsatisfactory attendance b) Failure to meet program requirements
c) Significant re-arrest
d) Failure to initially engage in program service2
e) Never showed3
f) Other
Number of unsuccessful
completions/(Number of
individuals enrolled in the
ATI program minus the
number deceased or
physically incapable of
attending)
24
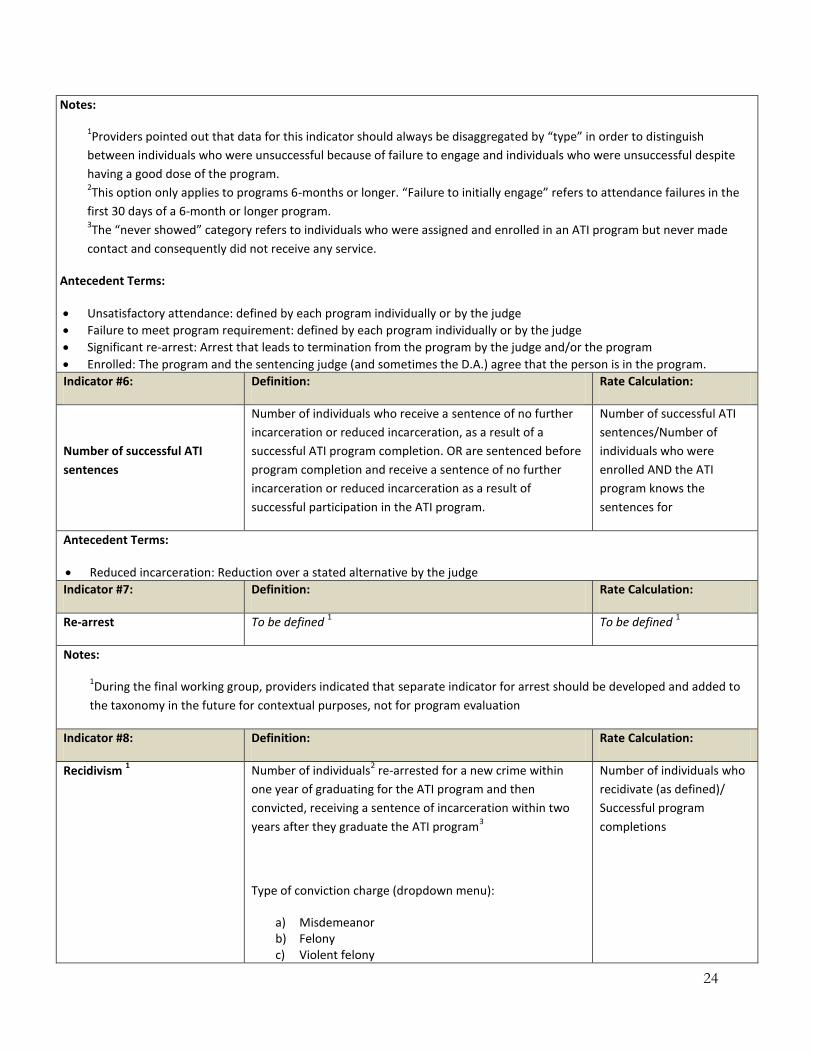
Notes:
1Providers pointed out that data for this indicator should always be disaggregated by “type” in order to distinguish
between individuals who were unsuccessful because of failure to engage and individuals who were unsuccessful despite
having a good dose of the program. 2This option only applies to programs 6-months or longer. “Failure to initially engage” refers to attendance failures in the
first 30 days of a 6-month or longer program. 3The “never showed” category refers to individuals who were assigned and enrolled in an ATI program but never made
contact and consequently did not receive any service.
Antecedent Terms:
Unsatisfactory attendance: defined by each program individually or by the judge
Failure to meet program requirement: defined by each program individually or by the judge
Significant re-arrest: Arrest that leads to termination from the program by the judge and/or the program
Enrolled: The program and the sentencing judge (and sometimes the D.A.) agree that the person is in the program.
Indicator #6: Definition: Rate Calculation:
Number of successful ATI
sentences
Number of individuals who receive a sentence of no further
incarceration or reduced incarceration, as a result of a
successful ATI program completion. OR are sentenced before
program completion and receive a sentence of no further
incarceration or reduced incarceration as a result of
successful participation in the ATI program.
Number of successful ATI
sentences/Number of
individuals who were
enrolled AND the ATI
program knows the
sentences for
Antecedent Terms:
Reduced incarceration: Reduction over a stated alternative by the judge
Indicator #7: Definition: Rate Calculation:
Re-arrest To be defined 1 To be defined
1
Notes:
1During the final working group, providers indicated that separate indicator for arrest should be developed and added to
the taxonomy in the future for contextual purposes, not for program evaluation
Indicator #8: Definition: Rate Calculation:
Recidivism 1 Number of individuals
2 re-arrested for a new crime within
one year of graduating for the ATI program and then
convicted, receiving a sentence of incarceration within two
years after they graduate the ATI program3
Type of conviction charge (dropdown menu):
a) Misdemeanor b) Felony c) Violent felony
Number of individuals who
recidivate (as defined)/
Successful program
completions

25
Notes:
1Recidivism data should only be collected on programs that are 6 months or longer
2Only those who have completed the program successfully are included in the rate calculation
3Both the providers and the representatives of the city agencies agreed with this definition, however it was stated that it
is still necessary to figure out how to collect the necessary data. Resources are an issue for all parties involved.
Criminal Justice Involved Adults Filters
Filter Proposed categories
Age group at time of intake 15 and under (JO)
16-18
16-24
18-24
25-35
36 and over
Gender Male Female
Ethnicity Hispanic Non-Hispanic
Race American Indian and Alaska Native
Asian
Black or African American
Native Hawaiian and Other Pacific Islander
White
Other race
Geography Zip code of residence
Community district
Borough of residence
Borough of adjudication
Charge By class (A, B Felony, A, B Misdemeanor, etc.)
By type of crime (drugs, physically incurious, property, etc.)
Court (where people are coming form) Criminal court Supreme court
Program type (special populations) Mental health program
Drug program
Other specialized program
Non-specialized program
Program type (conviction charge) Misdemeanor Felony
Violent felony

26
Appendix D: DRAFT Financial Measures (Mock-Up Dashboards)

27
28

29

30

31

32

33

34

35

36

37

38