Embed Size (px)
Citation preview
The helping hand, the lazy hand, or the grabbing hand? Central vs. local government
shareholders in publicly listed firms in China
YAN-LEUNG CHEUNG
City University of Hong Kong
P. RAGHAVENDRA RAU
Purdue University
ARIS STOURAITIS City University of Hong Kong
February 2008
Cheung, Stouraitis: City University of Hong Kong, 83 Tat Chee Avenue, Kowloon Tong, Hong Kong, People's Republic of China (email: [email protected], [email protected]); Rau: Krannert Graduate School of Management, Purdue University, MGMT, KRAN, 403 West State Street, West Lafayette, IN 47907-2056, U.S.A. (email: [email protected]). We would like to thank Kee-Hong Bae, Sankar De, Dave Denis, Mara Faccio, Larry Lang, Xiaohong Liu, Florencio Lopez-de-Silanes, Sugata Marjit, John McConnell, Hua Zhang, participants at the 2005 European Finance Association meeting, Moscow, the 2005 Asian Finance Association meeting, Kuala Lumpur, the 4th Asian Corporate Governance Conference, Seoul, the 2005 Corporate Finance and Governance conference at City University of Hong Kong, the 2007 IFC Corporate Governance Seminar, Istanbul, and seminar participants at Tulane University, Wake Forest University, Stockholm School of Economics, University of Bologna, University of California at Santa Barbara, University of Columbia-Missouri, and the University of Palermo for helpful comments. We also thank He Wanwei, Ge Hui, Jiang Ping, Jing Lihua, Kwok Wai Ho, Helen Tse, Anita Wong, Wu Lingling, Zhou Kaiguo, and Lynda Zhou for research assistance, and Lu Tong for helping us obtain some of the data used in this study.
The helping hand, the lazy hand, or the grabbing hand? Central vs. local government
shareholders in publicly listed firms in China
Abstract
We analyze related party transactions between Chinese publicly listed firms and their state-
owned enterprise (SOEs) shareholders to examine whether companies benefit from the presence
of government shareholders and politically connected directors appointed by the government.
We find that related party transactions between firms and their government shareholders seem to
result in expropriation of the minority shareholders in firms controlled by local government
SOEs or with a large proportion of local government affiliated directors on their board, and in
provinces where local government bureaucrats are less likely to be prosecuted for
misappropriation of state funds. On the other hand, firms controlled by the central government
(or with a large proportion of central government affiliated directors) are benefited in their
related party transactions with their central government SOEs.
Keywords: Law and economics; Government ownership; China; State-Owned Enterprises
(SOE); Related party transactions; Political connections
JEL Classification: G15; G34; K33
- Page 1 -
I. Introduction
Do minority shareholders in state-owned publicly listed firms benefit from the presence
of government shareholders and politically connected directors? The political connections
literature argues that the answer is yes. Politically connected firms have been shown to borrow
on preferential terms from state-owned banks or to receive government sponsored bailouts if
they are in distress. Prior literature on government ownership argues that the answer is no, citing
evidence that state-owned firms are inefficient and do not maximize shareholder value.
In this paper, we examine related party transactions between a sample of publicly listed
state-owned enterprises (SOE) in China and their wholly state-owned shareholders to answer this
question. Specifically, we examine three hypotheses. The helping hand hypothesis argues that
companies benefit from the presence of government shareholders and government affiliated
directors. The lazy hand hypothesis argues that government shareholders are inefficient. They are
unable to monitor managers effectively and do not care about maximizing shareholder value.
Finally, the grabbing hand hypothesis argues that government shareholders extract resources
from publicly listed companies, either to perform a social role or because government affiliated
directors are corrupt.
Our paper differs from extant literature on government ownership and political
connections because of two specific characteristics of the Chinese market – which are also
representative of some of the world’s largest emerging markets – that have not been examined in
prior research. These characteristics allow for a richer set of potential outcomes compared to
those examined in prior research.
The first of these is the distinction between central and local governments. The law and
finance literature (see for example, La Porta, Lopez-de-Silanes, Shleifer, and Vishny, 1998) has
mainly examined differences in firm policies and characteristics on a country-level basis, with
classifications based on the rule of law at the central government level. Country-specific analyses
have mostly focused on countries where central governments are strong (e.g. Nazi Germany
under Hitler (Ferguson and Voth, 2008), Indonesia under Suharto (Leuz and Oberholzer-Gee,
2006) or Malaysia under Mahathir Mohammed or Anwar (Johnson and Mitton, 2003)).
However, there may be differences between the incentives and behavior of central and local
governments on a wide range of issues (Bardhan, 2002). For example, local governments may
have fewer resources than the central government to perform a social role, leading them to search
- Page 2 -
for alternative sources of revenue. Alternatively, the actions of local governments may be less
visible to the press or to central and judicial authorities, and their bureaucrats may feel less likely
to be prosecuted for corruption, which suggests more opportunities for personal enrichment by
local government officials. Strong local governments are found in large parts of the world (e.g.
China, India, Russia, Brazil, Argentina etc.), where more than half of the world’s population
lives. According to the Investment Climate Surveys conducted by the World Bank during 2002-
2003, almost two-thirds of more than 13,000 companies from 60 emerging markets surveyed,
state that local governments influence the laws that affect them.1 Cases where foreign companies
have been victims of local government decisions that run contrary to agreements with federal
governments have been reported in India,2 Russia,3 and Mexico,4 among others. In spite of this
widespread anecdotal evidence, actions by local governments have not been examined
empirically in the academic literature. Strong local or provincial governments in China often act
independently of the central government in Beijing.5 This decentralized structure creates a richer
set of potential outcomes, which is consistent with the experience of many of the world’s largest
and most populous countries.
The second interesting aspect of the Chinese market is the relation between government
ownership and political connections. The political connections literature finds a positive relation
between the presence of politically connected directors on the board and shareholder value. This
is not surprising since in these firms, the firm chooses directors who will presumably help
maximize shareholder value. In contrast, in China – and in other economies with large state-
owned sectors – politically connected directors are usually appointed by the government to the
boards of publicly listed firms. In other words, the presence of a government shareholder is
strongly related to the existence of political connections in these firms. It is an empirical question
whether these directors will behave in the same way as politically connected directors chosen by
the managers of non-state-owned firms.
1 Data available at www.worldbank.org/wdr2005 2 Eun, C.S., Resnick, B.G., “Enron versus Bombay politicians’, International Financial Management, 3rd ed., McGraw Hill, 2005. 3 Thornhill, J., “Investors look for Russian climate change: Prospects for cutting through the bureaucracy,” Financial Times, 24 November 1994. 4 Knight, D., “Mexico must pay U.S. company $17 million,” Business and Industry Interpress Service, 31 August, 2000. 5 In accordance with the saying “the hills are high, and the Emperor is far away” (Pu Songling, The bonds of matrimony, 17th century Chinese novel).
- Page 3 -
In this paper, we analyze a unique hand-collected dataset in order to identify whether the
type of government shareholder and the presence of government affiliated directors helps or
hurts the minority shareholders in the firm. Specifically, in a sample of Chinese publicly listed
firms where the government holds a stake through a wholly state-owned enterprise (SOE), we
examine a sample of 192 filings of related party transactions between the firm and the SOE
during 2001-2002. Djankov, La Porta, Lopez-di-Silanes, and Shleifer (2007) argue that these
types of potentially self-dealing transactions can provide direct opportunities for controlling
shareholders to benefit or extract resources from listed companies under their control. Since it is
difficult to compute the “fair” value of any assets changing hands, we measure the transfer of
value to or from the listed firm by examining the ratio of the total shareholder value created or
destroyed (the market-adjusted stock price reaction at the announcement of the related party
transaction using event-study methodology multiplied by the firm’s market capitalization) over
the announced size of the deal. This measure can be interpreted as the fraction of the deal that the
government extracts as a “tax” from (or as a measure of the “subsidy” it grants to) publicly listed
firms conducting related party transactions with their state-owned controlling shareholders.
We find that there is a transfer of wealth away from minority shareholders of publicly
listed firms in China to their SOE shareholders when the firms conduct related party transactions
with the SOE. The transfer is substantial – minority shareholders in the firm lose up to a third of
the value of the related party transaction, suggesting that our results are economically significant.
However, it is concentrated in firms controlled by local government SOEs and in firms where
more than 20% of the board consists of directors affiliated with a local government. In line with
prior literature on political connections and the helping hand, related party transactions
conducted by firms controlled by the central government (or by firms where more than 20% of
the directors are affiliated with the central government), are beneficial to the minority
shareholders of the listed firms.
Interestingly, the proportion of state ownership is not significant in explaining the
magnitude of the wealth transfer. What is significant is the type of government shareholder and
the political affiliation of the firm’s directors. It is however difficult to disentangle the marginal
effects of the two since they are inter-related – in China, the controlling government shareholder
typically chooses the politically connected directors on the company’s board.
- Page 4 -
The differential effect of local and central government shareholders is inconsistent with
the literature on the lazy hand, which argues that any government ownership is detrimental to
shareholder value. Moreover, we note that both parties to the deals that we examine are state-
owned – we are examining transactions between partially state-owned publicly listed firms and
their wholly state-owned SOE parents. In contrast to our findings, the lazy hand literature does
not predict that related party deals should be systematically detrimental to the values of partially
state-owned publicly listed firms and beneficial to their non-listed wholly state-owned parents.
In addition, we also rule out three alternative variations of the lazy hand hypothesis. First,
the most inefficient state-owned firms in our sample may simply do bad deals. We show that our
sample firms are not inefficient, since they do not under-perform relative to other state- or non-
state-owned firms (and actually out-perform the market). Second, the market may react to the
announcement of an asset acquisition or sale, and the related nature of the deal may have no
impact. In contrast to related party transactions, we show that similar arms’ length transactions
by state-owned firms with similar type of government shareholders and affiliated directors do not
destroy firm value. In fact, the same firms that destroy value when they undertake related party
transactions with their SOE parents, create value when they undertake arms’ length transactions
with third parties. Third, the related party transaction announcement may reveal that these firms
are in some sort of distress, which is not reflected in their past performance, and the market may
react to this information. Again, we find that these firms do not under-perform the rest of the
market in the period following the related party deal.
Finally, we examine why local government shareholders and local government affiliated
directors are associated with transactions that are detrimental to shareholder value, by analyzing
a hand-collected sample of 801 corruption cases that have been prosecuted by Chinese judicial
authorities, and find that the expropriation by the local government controlled SOEs is
concentrated in provinces where local government bureaucrats are less likely to be prosecuted
for misappropriation of state funds, suggesting that the wealth transfer to government
bureaucrats may be driven by corruption. We also analyze data on the financial performance of
provinces and find no evidence that the transfer of resources is motivated by a social role. The
social role argument suggests a transfer of resources to the local governments of under-
performing regions (provinces with large budget deficits and high unemployment), but we show
that most of the expropriation is concentrated in China’s richest provinces.
- Page 5 -
Our paper makes two contributions to the law and economics literature. First, we
examine how related party transactions can act as a channel through which government
ownership and political connections affect the value of publicly listed firms, a channel that has
not been empirically examined in this context. Second and more important, to the best of our
knowledge, this is the first paper to examine the value of government ownership and connections
at the national and local levels separately. We argue that the results derived in the prior literature
on the positive effects of political connections may be due to the fact that these papers have
examined the effect of connections to the central or national government. Connections to local
government and local government ownership may result in expropriation of the minority
shareholders in the listed firms. Since strong local governments are found in large parts of the
world, where more than half of the world’s population lives, we argue that a more nuanced view
of the value of political connections is appropriate.
Overall, we conclude that related party transactions offer a channel through which
shareholders can be benefited or expropriated. In our sample, benefits are concentrated in firms
controlled by the central government while expropriation is concentrated in firms controlled by
local governments. Local governments may have more freedom to expropriate because their
actions have less visibility to central authorities, to the press, or to judicial authorities. Among
different local governments, the expropriation is concentrated in provinces that also have the
least visibility, that is, where government bureaucrats are less likely to be prosecuted for
corruption. For local governments at least, our results are most consistent with the “grabbing
hand” model of government (Frye and Shleifer, 1997; Shleifer and Vishny, 1998).6 For central
governments in contrast, our results are consistent with the helping hand model of government.
Our evidence on local governments is consistent with widespread anecdotal evidence on
the use of off-budget sources of revenue by Chinese provincial authority bureaucrats. Such non-
6 Our paper is different from the extant literature on tunneling. Most of the tunneling literature (see for example, Johnson, La Porta, Lopez-di-Silanes, and Shleifer, 2000; Bertrand, Mehta and Mullainathan, 2002; La Porta, Lopez-di-Silanes, and Zamarippa, 2003; Cheung, Rau, and Stouraitis, 2006) focuses on the role of individual controlling shareholders or directors in expropriating wealth from the minority shareholders in the firm. Firm value is often negatively related to the separation of cash flow and control rights of their controlling shareholders. In contrast, we examine the transfer of wealth from firms to government bureaucrats. Cash flow rights play no role in this case. The transfer occurs when corrupt officials take advantage of their SOE control rights to transfer wealth to their own control, which can then be misappropriated directly. The closest relevant paper to ours is Fan, Wong, and Zhang (2007) who show that Chinese firms going public with politically connected CEOs underperform those without politically connected CEOs by 18% in the three years after the initial public offering (IPO). They attribute the result to bureaucratic rent-seeking than with shareholder value maximization but their findings are also consistent with the social role argument.
- Page 6 -
tax revenue (which includes revenue from state-owned assets) is growing rapidly, and in many
localities, exceeds tax revenue. Given its off-budget nature, its use is not transparent, leaving
room for corruption.7 Part of this revenue may be misappropriated directly by local government
officials, as our data on corruption cases suggest. According to numerous press reports, however,
another part has been appropriated in the form of salary bonuses,8 building luxury headquarters
office complexes with lavish facilities,9 and extravagant entertainment or travel expenses for
provincial government staff. 10 The central government has been trying to strengthen its
monitoring mechanisms of provincial governments in an effort to tackle land expropriation and
corruption.11
The paper is organized as follows. Section II describes the prior literature while Section
III describes the institutional background of the Chinese economy. Section IV describes the data
and Section V our research design. Sections VI to IX report our main empirical results. Section
X concludes.
II. Prior literature
The helping hand hypothesis (see Shleifer and Vishny, 1998) is motivated by prior
academic research which has mostly argued that shareholders in firms with close ties to
governments gain from political connections. One strand of this literature (see for example,
Roberts, 1990, Jayachandran, 2006, Fisman, 2001, Ferguson and Voth, 2008, Johnson and
Mitton, 2003, Leuz and Oberholzer-Gee, 2006, Knight, 2007, or Faccio, 2006) typically uses
stock market data to demonstrate that the value of politically connected companies is affected by
changes in the political landscape. While this strand shows that political connections add value to
the firm, it remains silent about the exact source of this value. Other papers have identified
specific benefits from political connections including being allowed to borrow on preferential
7 See “Better manage non-tax revenue”, Chinadaily.com.cn, February 14, 2007. 8 See “Central government seeks strengthened authority to improve efficiency”, Xinhua Economic News Service, March 15, 2007. 9 “Check willful local spending”, Chinadaily.com.cn (February 1, 2007); “China’s official opulence”, Los Angeles Times, December 18, 2006. 10 See “Corrupt official receptions shock Zhongnanhai”, Hong Kong Economic Journal, November 10, 2006. According to official statistics, US$47 billion was charged by government officials for personal dining expenses throughout China in 2004 alone. 11 “China sends out inspectors to monitor local government land use”, Xinhua Economic News Service, December 18, 2006; “Rural unrest in China”, Economist.com, March 15, 2007.
- Page 7 -
terms from state-owned banks (see for example, Khwaja and Mian, 2005), and government
sponsored bailouts (Faccio, Masulis, and McConnell, 2006).
The lazy hand hypothesis is motivated by the literature on state-owned enterprises
and privatization (see Megginson and Netter (2001) for a survey of this literature) and argues
that state-owned enterprises do a poor job of monitoring management, they underperform, and
performance improves after privatization. Bai et. al (2004) find, for example, that state-owned
Chinese firms trade at a discount compared to other firms. Chang and Wong (2004) show that
the decision-making power of local party committees relative to managers is associated
negatively with firm performance in China. The worst performing state-owned firms may simply
be expected to do the worst deals.
The final hypothesis, the grabbing hand hypothesis, is motivated by Frye and Shleifer
(1997), and Shleifer and Vishny (1998) who argue that governments may have a “grabbing
hand”, leading them to expropriate shareholder wealth from public firms. The expropriation may
be facilitated by the presence of politically connected directors on company boards. There are
two reasons why government shareholders might expropriate wealth from minority shareholders.
Shleifer and Vishny (1998) imply that government bureaucrats are corrupt and enrich themselves
through these transactions. These bureaucrats remain largely independent of courts, imposing
predatory regulations on firms, and imposing their will in commercial disputes with these firms.
Enrichment may be direct (for example, misappropriation of funds) or indirect (for example, on-
the-job consumption of lavish perks). Alternatively, government shareholders might play a social
role, expropriating wealth from the minority shareholders in order to benefit other members of
society.
While there is a rich theoretical literature on rent seeking and corruption (Shleifer and
Vishny, 1993, 1994, Durnev and Fauver, 2007), there is little empirical evidence on the channels
through which the grabbing hand might be manifested. Since this kind of behavior is usually
illegal and hence undisclosed, evidence on the government’s grabbing hand is largely anecdotal.
Zingales (1994) describes how the Italian wholly state-owned company IRI sold its stake in a
software company to STET, a company that it partially owned along with private investors, at a
substantial premium. Other evidence comes from press reports. China Shipping Development
signed a charter agreement with its wholly state-owned parent in 2004 which, according to
analyst assessments, resulted in a net transfer of US$45 million from the listed company to its
- Page 8 -
parent.12 In another example, Zhu Kuan, a company controlled by the government of the city of
Zhuhai, defaulted on US$750 million loaned by Standard Chartered, Morgan Stanley, Lehman
Brothers and others. During workout negotiations in 2003, the Zhuhai government transferred
land worth US$125 million out of Zhu Kuan’s control and into the hands of the city, thus
reducing the liquidation value of the listed firm.13 According to press reports, China’s Land and
Resources Ministry identified more than 130,000 cases where farmland was illegally
expropriated by local governments and granted to well-connected developers, without adequate
compensation for the farmers involved.14
III. Institutional background, state ownership, and political connections in China
Prior to the beginning of economic reforms in 1978, all Chinese firms were solely state-
owned. Following the economic reform program, the state divested stakes in many firms, but
retained shareholdings in most companies, and there were few outright privatizations. Stock
exchanges were established in Shanghai and Shenzhen, in 1990-1991. By 2003, there were 1,286
companies listed, with total market capitalization RMB5 trillion (US$600 billion). In early 2007,
the daily turnover of the combined Chinese stock markets overtook Hong Kong to become the
second largest in Asia after Tokyo.
Chinese listed shares are classified according to the residency of their owner as domestic
(A shares) or foreign (B, H and N shares). A-shares (worth RMB4,470 billion, US$541 billion,
in 2003) are available exclusively to Chinese domestic investors. B-shares (worth RMB272
billion, US$33 billion) were available for trade only by non-residents until 2001. Chinese
companies were permitted to list on the Stock Exchange of Hong Kong (SEHK) as H-shares in
1993. H-shares are subject to stricter SEHK listing requirements. N-shares are traded in the U.S.
in the form of American Depository Receipts (ADRs), mostly as Level I ADRs, which are traded
over-the-counter and are not subject to the disclosure requirements of the SEC’s Exchange Act.
All shares have the same voting and cash flow rights by law.15
12 South China Morning Post, 1 March 2004 13 BusinessWeek, December 1, 2003. 14 “Illegal land grab cases increase in China”, Japan Economic Newswire, March 21, 2007. 15 State shares are held by government agencies (the Bureau of State Property Management and local finance bureaus) and by solely state-owned enterprises. During our sample period, they could not be traded, but could be transferred to domestic corporations when approved by the China Securities Regulatory Commission (CSRC).
- Page 9 -
Li, Zhao, and Li (2006) document that most members of the board of directors in Chinese
publicly listed firms are current or former party members. There are two types of directors –
executive and independent non-executive. Executive board members are usually either former
managers (who managed the firm before it was taken public) or officers of the central
government, local government, Community Party of China, or the military. Executive directors
can also be managers of other central government-controlled companies. Independent non-
executive directors are from other social organizations and institutions, such as local universities,
industry associated committees, etc. When the director’s tenure expires, the new director is
usually directly appointed by the SOE controlling shareholder. Neither type of director is
compensated according to the market, with a cash compensation still linked to their government
pay. During the period we study, none of them held company stock options.
The China Securities Regulatory Commission (CSRC) is responsible for supervising and
regulating issuing and trading activities but lacks the necessary investigative and prosecuting
power and resources. Investors have few avenues to prevent expropriation and to seek redress.
Due to inefficiencies in the judicial system, individual investors are unlikely to sue in the courts
for suspected infringements, and even if they did, court decisions are not universally enforced.
IV. Data
We obtain our related party transactions data from 192 filings of related party
transactions by listed companies submitted to Chinese stock exchange authorities during 2001-
2002. Related party transactions are transfers of resources or liabilities between a listed company
and the legal entities or individuals who control it. Transactions with value greater than RMB1
million (US$ 121,000) or 0.5% of net assets, must be reported to the exchange within two
working days following the signing of the contract.16 For each transaction, we obtain the hard
copy of the filing describing the transaction and the related parties. Our transactions involve
acquisitions of assets or shares by the listed company from its state-owned parent by paying
some form of consideration (81 cases), sales of assets by the listed company to its state-owned
parent (40 cases), asset swaps between the listed company and its controlling SOE (25 cases),
trading of goods or services between the listed company and its controlling SOE (33 cases),
direct cash payments, loans or provision of loan guarantees by the listed company to its state-
16 Rules governing the listing of securities (Shanghai Stock Exchange 2002; Shenzhen Stock Exchange 2002)
- Page 10 -
owned parent (13 cases), and cash assistance to the listed company by the controlling SOE (22
cases). Our data consist of 214 related party transactions because on a few occasions, firms may
use the same announcement to announce two or more transactions of different types.17
We also collect a comparison sample of 427 arm’s length (non-related) acquisitions of
assets and equity, asset sales, and sales of equity stakes undertaken by Chinese publicly listed
firms during 2001-2002 from the China Stock Market and Accounting Research (CSMAR)
database (218 announcements by acquirers and 209 by sellers).18
Daily and monthly stock returns, financial data, ownership structure (state shareholdings
and B-shares), the proportion of external directors on the board, and names of auditors for the
universe of Chinese publicly listed firms are obtained from CSMAR. We obtain the affiliation of
directors (central government, local government, and membership to the Communist party) from
IPO prospectuses in the China Stock Initial Public Offerings Research Database (CSIPOR),
company annual reports, and company web sites. We measure control according to who is the
major shareholder in the listed firm and the SOE. For each firm and SOE, we track back
ownership to the ultimate controlling shareholder. These are mainly provincial governments or
ministries (central government). The IPO prospectuses state whether each director is working for
a local/provincial/city government or for a ministry/central government agency. We obtain lists
of H-shares from the website of the CSRC, and lists of ADRs from the website of JP Morgan
Chase at www.adr.com.
We estimate market-adjusted abnormal returns for A-shares by subtracting the returns of
the value-weighted market index from the raw returns earned by the sample firms (with
reinvestment of cash dividends). We then multiply this by the market capitalization of the firm
and divide by the announced size of the deal, to get a measure of the value created or destroyed
in the transaction. We also obtain figures for Gross Regional Product (GRP), unemployment, and
17 Our data is hand-collected from the exchange’s archives, from filings submitted to stock exchange authorities in hard copy, limiting our ability to extend our sample period. We do not expect that our results are sensitive to the particular time period that our sample covers. Out of a total 351 filings, we exclude 75 cases where the related party is not state-owned, and 59 cases that announce joint ventures between a listed company and its controlling shareholders. The formation of joint ventures does not represent a complete transfer of resources, because no cash changes hands and the listed firm retains some control over the cash flows emanating from the pledged assets. Only when the joint venture is dissolved can we evaluate its full impact. Announcements of joint venture dissolutions are included in our sample as asset acquisitions or sales. We also exclude 4 cases where the listed company conducts transactions with its own subsidiaries, which are not controlled by the listed firm’s parent. 18 CSMAR is one of the most commonly used databases for China-related research. However, since it is less detailed than our hand-collected database - it contains data only on mergers and acquisitions transactions, and not other types of related party transactions for example - we do not use it as our source for the connected transactions.
- Page 11 -
budget deficit for China’s 28 provinces and the four cities with independent province status
(Chongqing, Shanghai, Shenzhen, and Tianjin), from the Statistical Yearbook of China and the
Shenzhen Statistics Yearbook. Our sample for the universe of Chinese publicly listed firms
consists of 2,031 firm-year observations.
Finally, we obtain data for 801 corruption cases that have been prosecuted by Chinese
judicial authorities by searching the web sites of the Chinese news agency Xinhua
(www.xinhuanet.com/lianzheng), and the publications Legal Daily (www.legaldaily.com.cn),
and Procuratorial Daily (www.jcrb.com). To be included in our sample, the corruption described
in the news report must also have occurred during 2001-2002.
V. Research design
Our analysis proceeds in three steps. First, we report the wealth effects of related party
transactions. We examine whether the presence of different types of government shareholders
(local or central government) and government affiliated directors in the firm is associated with a
transfer of resources away from (or to) the publicly listed firm by the controlling SOE
shareholders (Section VI).
Second, we test whether this transfer of resources reflects the helping hand, the grabbing
hand, or the lazy hand. More specifically, we examine whether our results reflect expropriation
of minority shareholders or whether they are consistent with other explanations. To do this, we
first compare the valuation effects of these related party transactions with the valuation effects of
similar arms length transactions (Section VII). Subsequently, we compare the operating
performance of our sample firms that undertake related party transactions with their government
SOE shareholder both with the universe of Chinese publicly listed firms, and with firms
undertaking similar arm’s length transactions. We conclude this part by testing whether the
valuation effects are due to the related nature of the deal or to several alternative variants of the
lazy hand hypotheses (Section VIII). We find that our results are not consistent with the lazy
hand hypothesis. For local governments, our evidence is most consistent with the grabbing hand,
while for central governments, our evidence is more consistent with the helping hand.
Finally, we test the nature of the grabbing hand for local governments, namely whether it
plays a social role or whether it is related to corruption (Section IX). We investigate whether the
provinces where the expropriation is concentrated are poorly performing (suggesting that the
- Page 12 -
local governments involved may need resources in order to perform a social role) or whether
they are provinces where misappropriation of state funds by government officials is less likely to
be prosecuted (suggesting that the expropriation is likely to be related to corruption).
VI. Wealth transfers in related party transactions
Table 1 reports descriptive statistics for related party transactions with SOE related
parties. In column 1, we report statistics for all transactions. In columns 2-4, we sub-divide the
sample according to the type of the government controlling shareholder. In columns 5-6, we sub-
divide the sample according to the political affiliation of the firm’s directors. We report
significance levels for differences in columns 7-8.
In column 1, the median value of a related party transaction between a listed firm and its
controlling SOE shareholder is RMB37 million (US$4.5 million), representing 0.9% of the
market value of the listed company. Although the transactions appear small relative to stock
market capitalization, they typically represent the entire listed firm’s absolute net profit figure,
and can have a significant impact on profitability and cash flow.19 The firms conducting these
related party transactions are not under-performing relative to their industries. Their return on
equity and market to book ratios are similar to their industry peers. Similarly, their debt ratios are
not higher compared to their industry peers. On average, these related party transactions reduce
shareholder value. The publicly listed firms in our sample lose around 24% of the value of the
median related party transaction, similar to a large “tax” imposed on publicly-listed firms by
their controlling government shareholders. On average, these results suggest the presence of a
grabbing hand.
In columns 2-4, the type of government shareholder controlling the listed firm appears
very significant in explaining this transfer of resources. Firms ultimately controlled by a local
provincial government transfer a median 27% of the size of the deal to their controlling SOE
shareholder with related party transactions (column 2). Firms ultimately controlled by the central
government but with strong local ties, transfer 327% (column 3). These are firms controlled by
provincial universities. Although all educational institutions are ultimately controlled by the
Ministry of Education, they have a lot of local autonomy, they are located in the provinces, and 19 The figure is much larger if calculated over tradable free float rather than over the entire market capitalization. State-owned shares were non-tradable during the period under study and their inclusion inflates the firm’s market value.
- Page 13 -
they have a significant proportion of directors affiliated with the local government. This makes
them more akin to local government controlled firms. On the other hand, firms controlled by the
central government do not appear to transfer resources to their controlling shareholders, on
average (column 4). These firms have the largest proportion of central government affiliated
directors on their boards and the lowest proportion of local government affiliated directors in the
sample. We also note that there are no statistically significant differences in operating
performance or leverage between local and central government controlled firms.
In columns 5-6, we compare firms that have least 20% of local government affiliated
directors on their boards with firms having a similar percentage of central government affiliated
directors. Whereas locally connected firms dissipate away the entire value of the related party
transaction (column 5), centrally connected firms appear to benefit from such transactions
(column 6). The difference between the two sub-samples is highly statistically significant. Again
we note that the two groups of firms do not differ in operating performance or leverage
characteristics, suggesting that a priori our results are not consistent with the lazy hand
hypothesis.
In Table 2, we regress the total value destroyed as a proportion of the size of the related
party deal on indicator variables for the type of government shareholder and proxies for political
connections. In each specification, the first model includes only the variables of interest above,
while the second model controls for the proportion of state ownership, the proportion of external
directors on the board, the presence of foreign shareholders in the firm (B-shares, H-shares,
ADRs), the quality of the firm’s auditor and firm size. Panel A reports regressions where the type
of government shareholder and political connection variables are regressed separately, while in
Panel B, we use both sets of variables together.
Panel A shows that the dummy variable indicating local government control of SOEs is
significantly negatively related to the amount of value created in the related party transaction
(model 1), although it is marginally not significant at conventional levels in model 2. In models 3
and 4, the proportion of local government affiliated directors is also positively related to a
statistically significant transfer of resources. The coefficients suggest that a higher proportion of
local government affiliated directors in the firm leads to a larger transfer of resources away from
the firm. Models 5 and 6 show that this result is driven by firms where local government
affiliated directors represent more than 20% of the board. Interestingly, firms where central
- Page 14 -
government affiliated directors represent more than 20% of the board do not destroy value with
related party transactions. The coefficients of the proportion of central government directors are
significantly positive, suggesting that these firms receive benefits when they conduct related
party transactions with their controlling SOE shareholders. If our results are related to corruption,
then physical distance from the capital may affect the transfer of resources away from publicly
listed firms. Firms controlled by the local government of the city of Beijing will have almost the
same visibility to the press, to judicial authorities or to the central government as firms controlled
directly by the central government. In models 7 and 8, we classify firms headquartered in Beijing
as central government firms. Our results are qualitatively similar and in fact a little stronger
compared to models 1 and 2, suggesting that firms controlled by the provincial government of
the city of Beijing may be more similar to central government controlled firms.
Panel B shows that when we include both the indicator variables for the type of
government shareholder and the political connections variables, the political connections
variables dominate in models 1 and 2. Models 3 and 4 show that even the presence of one central
government affiliated director makes a difference – when none of the directors are affiliated to
the central government, the value created in the transaction is negatively affected. Since the type
of government controlling the firm is related to the proportion of connected directors on the
board, we run separate regressions for local and central government controlled firms (regressions
5 through 8). In central government firms, the proportion of local government affiliated directors
is not important (models 7-8) while in local government controlled firms, the proportion of
central government affiliated directors has a positive effect (models 5-6). However, since the
sample size for central government controlled firms is small, we hesitate to draw any stronger
conclusions on the relative strength of these two effects. Nevertheless, in line with prior literature
on political connections, the presence of central government affiliated directors is significantly
positively related to the value created in the transaction. Interestingly, the proportion of state
ownership per se is not significant in explaining the wealth transfer. It is the type of government
ownership and the political affiliation of the directors that are significant.20
20 In specifications that are not reported in order to economize on space, the difference between the proportions of local government versus central government affiliated directors is also significant, in line with the coefficients obtained in the table. In contrast, the proportion of directors who are members of the Communist Party is not significant. Finally, the proportion of state ownership is not significant even if we exclude the variables proxying for the type of SOE and the political affiliation of the directors from the regression.
- Page 15 -
These results suggest that only publicly listed SOEs with local government ties (either
because they are directly controlled by a local government or because they have a large
proportion of directors on their board affiliated with a local government) appear to transfer
resources away from the listed firm when conducting related party transactions with their
controlling wholly government owned SOEs. In sharp contrast, the presence of a central
government shareholder and central government affiliated directors has a significant positive
effect on the value created in the related party transaction.
VII. Are related party transactions different from arms’ length transactions?
An alternative explanation for our results is that the transfer of resources that we observe
for local government controlled firms conducting related party transactions with SOEs may be
due to the type of corporate transaction undertaken, and not to the related nature of the deal.
There are two issues here. First, the market may react to the announcement of an asset
acquisition or sale, and the related party nature of the deal may have no impact. Second, if local
government shareholders are indeed inefficient in monitoring managers, we might expect to find
all deals carried out by these firms to perform poorly, regardless of whether the deal is with a
related party. We therefore compare related party transactions with SOEs with similar arms’
length (non-related) transactions in Table 3.
In Panel A, in contrast to the statistically significant transfer of resources away from
publicly listed firms that conduct related party transactions with their local government
controlled SOE shareholders (rows 1-4), arms’ length transactions by the same type of firms are
associated with highly statistically significant gains (rows 5-10). P-values for tests of differences
are reported in rows 11-16. We observe significant differences in the wealth transfer as a
proportion of the value of the deal (column 2) between all related party deals with SOE related
parties and all arms’ length deals (rows 1, 5, 11), all related party deals with SOE related parties
and all arms’ length deals with SOE third parties (rows 1, 6, 12), related party deals by firms
controlled by a local government and arms’ length deals with third parties that are under the
control of the same local government (rows 2, 7, 13), related party and arms’ length deals by
local government controlled firms (rows 2, 8, 14), related party and arms’ length deals by firms
with more than 20% of local government affiliated directors on their boards (rows 3, 9, 15). In
rows 4, 10, and 16, we also compare sub-samples of related party transactions and arms’ length
- Page 16 -
transactions undertaken by the same firms. Despite the small sample sizes, the difference
between the two is also significant at the 10% level in row 16. Overall, the differences between
related party and arm’s length transactions are all highly statistically significant, suggesting that
it is the related nature of the deal that is behind the transfer of resources away from local
government controlled firms and not the type of transaction undertaken or the type of firm
undertaking the transaction..21
In Table 3, Panel B, these six results are robust in cross-sectional regressions of the
proportional value gain or transfer, after controlling for firm size, state ownership, and corporate
governance variables. These regressions are performed in sub-samples that combine related party
transactions with SOEs with arms’ length transactions. Related party transactions by local
government controlled firms (or firms with more than 20% of local government affiliated
directors on their boards) in the first row of the table are associated with a transfer of resources
away from publicly listed firms to their controlling SOEs relative to all sub-samples of arms’
length transactions from Panel A (columns 1-6). In contrast, related party transactions by central
government controlled firms (or firms with more than 20% of central government affiliated
directors on their boards) are not associated with wealth transfer away from listed firms
compared to the arms’ length deals (columns 7-8).
Overall, our results show that it is the presence of local government controlled SOE
related parties, that drives the value-destruction of related party deals, and not the type of the
deal. Our results are consistent with the expropriation of the minority shareholders of local
government controlled firms that conduct related party transactions with their SOE shareholders.
These firms destroy value when they undertake related party transactions but experience
increases in value when they undertake similar arms’ length transactions.
VIII. Do related party transactions with SOEs reflect the helping hand, the lazy hand,
or the grabbing hand?
The differential effect of local and central government shareholders is prima facie
inconsistent with the literature on the lazy hand, which argues that any government ownership is
21 Our results are not sensitive to grouping together acquirers and sellers in arms’ length transactions. Related party transactions statistically different irrespective of the sub-sample they are compared with.
- Page 17 -
detrimental to shareholder value. However, there are two alternative variations of the lazy hand
hypothesis that might also explain our results.
VIII.A. Are the firms doing the worst deals simply the most inefficient state-owned firms?
The first alternative hypothesis is that central governments are more likely to retain
control of the best firms while local governments can only retain control of the most inefficient
state-owned firms. Therefore the results we document may simply reflect the inefficiency of
local government firms, not the type of ownership. There are two ways this inefficiency might be
manifested. Local government controlled firms may be more inefficient in general, compared to
central government controlled firms. Alternatively, local government controlled firms that
conduct related party transactions may be more inefficient specifically, than local government
controlled firms without related party transactions. Consequently, differences in wealth transfers
may simply reflect differences in efficiency. In this section, we report results from six different
more direct tests for this hypothesis.
Our first test is a direct comparison of the operating performance of local government
controlled firms that conduct related party transactions with the rest of the Chinese market. In
Table 1 above, we showed that among firms that conduct related party transactions with SOEs,
the performance of local government controlled firms is not significantly different from the
performance of central government firms. In Table 4, we compare the operating performance and
capital structure characteristics of firms undertaking related party transactions with SOEs with
the universe of Chinese publicly listed firms (Panel A) and with firms that conduct arm’s length
transactions (Panel B). In Panel A, local government controlled firms with related party
transactions (column 2), firms with more than 20% of the board local government affiliated
directors (column 3), central government controlled firms (column 4), and firms with more than
20% of the board central government affiliated directors (column 5) do not perform significantly
worse than the universe of Chinese publicly listed firms without related party transactions
(column 1). Debt levels are also similar – local government controlled firms are not more highly
levered than the remaining firms. The significance tests are reported in columns 7-11.
One might argue that despite these results, the firms doing the worst deals might still be
the most inefficient state-owned firms if there is a difference in the performance of firms that
conduct value-enhancing and value-destroying related party transactions. For example, although
- Page 18 -
local government controlled firms do not have worse performance compared to the remaining
Chinese firms on average, this may be driven by local government controlled firms that receive
benefits from their controlling shareholders. Firms conducting value-destroying transactions may
still be poor performers. In column 6, we show that this is not the case. In fact, the sub-sample of
firms that transfer wealth to their controlling shareholders with the related party transactions
(firms with value-destroying related party transactions) do not under-perform relative to the
universe of Chinese firms. If anything, they actually out-perform, earning a raw return on equity
of 8% (compared to 6.8% for the remaining Chinese firms without related party transactions) and
industry-adjusted return on equity of 1.2% (compared to –0.1% for the remaining firms). Both
differences are statistically significant at the 10% level in column 11.
In Table 4, Panel B, we compare the performance and leverage characteristics of firms
that conduct related party transactions with their SOE controlling shareholders with similar firms
that conduct arms’ length transactions. In line with the earlier results, neither local government
controlled firms (and firms with more than 20% local government affiliated directors on their
boards) nor central government controlled firms (and firms with more than 20% central
government affiliated directors on their boards) that conduct related party transactions in
columns 5-8 underperform relative to firms with similar type of government shareholders or
political connections that conduct arms’ length transactions in columns 1-4 (the significance tests
are reported in columns 9-12).
We next test if performance is related to the likelihood of being controlled by central or
local governments. Our second test consists of logit regressions of the likelihood of local versus
central government control and political affiliation of directors as a function of operating
performance in Table 5, Panels A and B. Panel A reports specifications estimated after
combining the samples of related party and arms’ length transactions, whereas Panel B reports
specifications estimated in the sample of firms with related party transactions only. The
likelihood of being a local government controlled firm (or a firm with more than 20% local
government affiliated directors on its board) in columns 1-2 in both panels is not significantly
related to either ROE or to the market-to-book ratio. The likelihood of being a central
government controlled firm with strong local ties (the firms experiencing the largest wealth
transfers in the related party transactions of Table 1) is positively related to ROE and the market
to book ratio in column 3 in both panels. On the other hand, the likelihood of being a central
- Page 19 -
government controlled firm (or a firm with more than 20% central government affiliated
directors on its board) is negatively related to performance in columns 4-5. Overall, therefore,
local government controlled firms (or firms with more than 20% local government affiliated
directors on their board) – the firms that experience wealth transfers to their government
shareholders in related party transactions – are less likely to be underperforming firms. It is the
central government controlled firms that are more likely to be underperforming, and these firms
receive benefits from their controlling shareholders when they conduct related party transactions.
Our third test investigates the flip side of our second test – whether the type of
shareholder and political affiliations of directors influences the operating performance of our
sample firms. We report ordinary least squares regressions of industry adjusted ROE, market-to-
book, and debt-equity ratio on type of government shareholder and political affiliation variables
in Table 5, Panels C and D. In both panels, we estimate the regressions after combining the
related party and arms’ length transactions samples. In Panel C, we regress the performance
variables on a dummy variable indicating local government control of the firm, a continuous
variable indicating the proportion of local government affiliated directors on the board, and a
dummy variable indicating the presence of more than 20% of local government affiliated
directors. We also include a dummy variable indicating that the transaction is with a related
party, and interact this related party dummy variable with the three variables indicating the type
of government shareholder and the political affiliation of the directors. Panel D is similar but the
variables indicate central government control and central government affiliation of the directors.
Our results in both panels do not provide any evidence that firm performance is in any way
related to the type of government shareholder, the political affiliation of the directors or the
conduct of related party transactions.
In our fourth test (not reported in tables for brevity), we re-estimate all the wealth transfer
regressions of Table 2 and 3 above, using Heckmann’s two-step procedure. In the first step, a
probit model estimates the likelihood of being a local government controlled firm (or a firm with
more than 20% local government affiliated directors on its board) as a function of the three firm
performance variables from above and firm size (the natural logarithm of total assets) after
combining the samples of related party and arms’ length transactions. In the second step, we
include the inverse Mill’s ratio from the probit model in the ordinary least squares regression of
wealth transfer on type of government shareholder and the remaining control variables. In line
- Page 20 -
with the results reported in Table 5, none of the firm performance variables are significant in
determining the likelihood of local government control (or directors) in the first step probit
model. Our results from the second step are qualitatively similar to those reported in Tables 2
and 3.
In our fifth test, in Table 6, we regress the value created in the transaction on pre-
announcement operating performance and leverage. We find that while the industry-adjusted
market-to-book ratio is not statistically significant, the firm’s industry-adjusted ROE is
significantly related to the value transfer, suggesting that firms with better performance
experience a larger value transfer to their controlling SOE shareholders (while under-performing
firms experience a value transfer from their controlling SOE). A dummy variable for “special
treatment” firms (firms that are under “probation” at the stock exchange because they have had
two consecutive years of losses) is positive but not significant in this specification. Therefore,
out-performing firms are the ones that experience value destruction when they conduct related
party transactions.
The evidence is not consistent with the hypothesis that local government controlled firms
transferring resources to their controlling SOE shareholders are the worst performing and most
inefficient state-owned firms doing bad deals for their shareholders. It is more likely that SOE
controlling shareholders use their control rights to extract resources out of local government
state-owned firms that have performed well (while at the same time providing assistance to
central government controlled firms that performed badly).
A final possibility is that local government controlled firms may not underperform
relative to their industry, but may be located in industries that are underperforming (with central
government controlled firms concentrated in out-performing industries). The raw performance
figures that we reported in Tables 1 and 4 are in line with the industry-adjusted figures,
suggesting that this is not the case. As an additional sixth test (which we do not report in tables
for brevity), we partition our sample of firms with related party transactions into different
industries and compare the wealth transfer to the controlling shareholders of local and central
government controlled firms within each industry. In each industry, local government controlled
firms experience a larger wealth transfer to their controlling shareholders, compared to central
government controlled firms, in line with the results reported so far.
- Page 21 -
A related question at this point is whether firms controlled by local governments are also
more likely to receive assistance than firms controlled by central governments. Unfortunately,
we can only provide a weak negative answer to this question owing to the small number of
central government controlled firms. We separate the sample into firms with positive (negative)
industry-adjusted ROE, market-to-book, and leverage, and a fourth sub-sample where the firm is
under- (out-) performing in all three (8 sub-samples overall). Within each subsample, we then
calculate the proportion of local firms that get assistance (get expropriated), and compare this
with the proportion of central firms that get assistance (get expropriated). Across the board (8
sub-samples), the proportion of central firms that get expropriated is lower (the proportion
benefiting is higher). But owing to the small sample size, the difference in proportions between
local and central firms is not statistically significant. When we classify the sample into firms
where more than 20% of the directors are central government affiliated (versus local government
affiliated), we do find that central government affiliated firms are significantly more likely to
receive assistance when they perform poorly. However, the small sample size makes it difficult
to draw any strong conclusions.
VIII.B. Do related party transactions signal future deteriorating performance?
A second alternative interpretation of the results related to the lazy hand is that the
pattern in announcement period returns is not due to expropriation, but because the market
believes that these firms are in distress in some way. Although this may not be reflected in their
past performance, the announcement of the related party transaction signals the information to
the market. Alternatively, it could be that local governments are simply taking funds away from
firms with no future investment opportunities and placing them in firms with better future
investment opportunities. Thus, it is possible that the negative price reaction is due to both the
expropriation itself and the bad news about investment opportunities that such expropriation
reveals. In this section, we examine changes in stock and operating performance for years [−1,
+1] relative to the year of the related party transaction (year 0). To economize on space, we do
not report these results in tables.
The industry-adjusted ROE and market-to-book ratios of firms controlled by local
governments that conduct related party transactions with SOEs decline by −0.2% and −0.6
respectively from one year before the transaction to one year after. These declines are slightly
- Page 22 -
smaller than the remaining Chinese listed firms that do not report related party transactions,
which experience −1.1% and −0.6 respectively, over the same time frame. The differences
between the two groups are not statistically significant.
We also compute long-horizon cumulative abnormal returns (CARs) using a size
benchmark, formed by sorting our universe of Chinese listed firms into 5 independent quintiles
on the basis of their market capitalization in the month before the announcement date. Abnormal
returns are calculated for each firm as the difference between its monthly return and that of its
control portfolio, every month from 12 months before to 12 months after the event date. CARs
are calculated by averaging across all sample firms every month and then summing these
averages over time. We test the statistical significance of these results using bootstrapping (as
applied by Rau and Vermaelen, 1999). 22
During the 12-month period following the related party transaction, our sample firms
earn bias-adjusted abnormal returns of 0.9% (p-value 0.449). Local government controlled firms
earn 4.1% (p-value 0.273). Overall, the firms that transfer resources with related party
transactions to their controlling SOE shareholders do not under-perform relative to the remaining
Chinese listed firms during the 12-month period following the announcement. Similarly, they
also do not under-perform during the 12-month period preceding the announcement, again
earning insignificant CARs.
In summary therefore, the announcement of related party transactions with SOEs does
not appear to signal future deteriorating stock or operating performance. These firms do not
under-perform prior to the transaction. In addition, it is the best firms that do the worst deals.
Consequently, the results that we document are more likely to be consistent with expropriation of
minority shareholders (and the grabbing hand of government) than with the deteriorating
performance of the sample firms (and the lazy hand of government).
22 For each firm in the sample, we randomly select with replacement, a Chinese listed firm that has the same matching portfolio ranking at that point in time. This matching firm is treated as though it had announced a transaction at that point in time. We carry out this process for each firm in the sample, ending up with a pseudo-portfolio consisting of a set of randomly drawn firms, matched in portfolio characteristics and time to the firms in the sample. We repeat this process till we have 1000 pseudo-portfolios and thus, 1000 abnormal return observations. This gives us an empirical distribution for the abnormal returns drawn under the null model specific to our hypotheses. Since the empirical distribution computed through bootstrapping is not centered at zero, following Rau and Vermaelen (1998), we subtract the mean CAR for the empirical distribution from the CAR value for the sample. This bias-adjusted CAR value gives us a better idea of the economic significance of the results (their statistical significance is not affected).
- Page 23 -
There are two additional reasons why our results are more consistent with the direct
transfer of resources away from listed companies than with a situation of inefficient managers
being unable to maximize firm value. First, as we showed in Table 1, the expropriation is
concentrated in firms controlled by local governments and is not present in firms controlled by
the central government. While this is consistent with expropriation (local governments may have
more freedom to expropriate because their actions have less visibility to central authorities, to the
press, or to judicial authorities), the literature on the under-performance of state-owned firms
does not make such predictions. Also, in contrast to related party transactions, in the previous
section we showed that similar arms’ length transactions by state-owned firms do not destroy
firm value. Second, we examine deals between publicly listed partially state-owned firms and
their wholly state-owned parents. Since the managers of listed firms should have better
incentives to maximize firm value, it is not clear why the deals should be systematically
detrimental to the listed firms’ values. Overall, for local government controlled firms, our
evidence is most consistent with the “grabbing hand” model of government (Frye and Shleifer,
1997; Shleifer and Vishny, 1998). In contrast for central government controlled firms, our
evidence is consistent with the helping hand model of government.
IX. Corruption or social role for local government controlled firms?
Our results show that local government control and a large proportion of directors
affiliated with a local government are associated with value-destroying related party transactions
(as opposed to central government control and the presence of directors affiliated with the central
government which are associated with value-enhancing transactions). In this section, we
investigate the potential motivations behind the actions of the SOEs that control the listed firms
and behind the local governments that control the SOEs. We therefore restrict our analysis to
local government controlled firms.
We identify two potential motivations. First, the transfer of resources from listed firms to
local governments may be because local governments (or the SOEs) need resources in order to
supplement their budgets and provide social services. This does not mean that minority
shareholders of publicly listed firms are not expropriated, but it suggests that at least other
groups in society may benefit. Jin and Qian (1998) show that the share of township-village firms
relative to private firms, is higher when the community government’s influence is greater and the
- Page 24 -
level of market development is lower. Channeling resources from the listed firms to these firms,
may help the provincial government reduce rural nonfarm unemployment. Alternatively, the
transfer of resources may be related to corruption activity in the provinces if it ultimately results
in a transfer of wealth to government bureaucrats. Bureaucrats of local governments may find it
easier to misappropriate state funds in provinces where they are less likely to be detected and
prosecuted.
The analysis of the potential motivations behind related party transactions between listed
firms and their controlling state-owned shareholders is reported in Table 7. Panel A reports
univariate analysis and Panels B and C report results of least squares regressions.
IX.A. Are expropriating SOEs located in poorly performing regions?
If local governments expropriate publicly listed firms in order to perform a social role,
we should expect that most of the expropriation is concentrated in the provinces with the highest
unemployment and governments with large budget deficits. In Panel A, we classify the provinces
whose local governments control the firms in our sample into above- or below-median based on
budget deficit (scaled by the province’s Gross Regional Product, GRP), unemployment, and
GRP per capita. The medians are calculated across all 32 Chinese provinces annually,
irrespective of whether there are firms from each province in our sample. Firms conducting
related party transactions with SOEs controlled by the local governments of regions with above
median budget deficit, above median unemployment, and below median GRP per capita are not
subject to expropriation in columns (1), (3), and (5). In contrast, firms controlled by local
governments from regions with below median budget deficit and unemployment and above
median GRP per capita in columns (2), (4), and (6) are more likely to experience expropriation.
Furthermore, there are four times as many observations from outperforming regions as there are
from under-performing ones. In columns (7) and (8), we classify provinces as under- (out-)
performing if they under- (out-) perform the median across all three measures. Again, firms from
under-performing provinces are not subject to expropriation, while firms from outperforming
provinces are, and there are still three times as many observations in the latter sub-sample. We
obtain qualitatively similar results using the 25% and 75% quartiles to separate regions into
under- and over-performing. Overall, SOEs do not appear to expropriate when they are located in
- Page 25 -
poor regions, where the local governments that control them may need resources in order to
perform a social role.23
IX.B. Provincial anti-corruption effectiveness and related party transactions with SOEs
Alternatively, the expropriation we document may be related to corruption. Our analysis
of this motivation is based on a hand-collected sample of 801 corruption cases that have been
prosecuted by judicial authorities in China. We focus on prosecution since prior research (see
Olken (2007), for example) show that top-down government monitoring is more important than
grass-roots participation in curbing abuses. Out of these 801 corruption cases, 103 cases involve
misappropriation of state funds by government officials (the remaining cases involve mostly
bribery, but also a few less frequent cases such as abuse of power). These numbers of publicly
disclosed cases appear small relative to perceptions of corruption in China. This is not surprising,
since the judicial system in China is widely perceived as lacking independence. Consequently,
we do not expect to find direct evidence that match the names of government officials who
control listed firms with those that have been prosecuted in corruption cases. Our analysis has to
rely on indirect proxies for corruption.
Our anti-corruption effectiveness index is constructed as the first principal component of
four variables, namely the ratio of the proportion of misappropriation of state funds by
government officials cases over the proportion of the province’s GRP contribution to China’s
total GDP, the total discovered amount of state funds misappropriated by government officials,
the amount misappropriated by government officials per case, and the amount of state funds
misappropriated per government official arrested. All measures are calculated by province. The
variables included in the index are all highly correlated with each other. Our rationale is that if 23 We also examine additional variables that were not significant in explaining the value destruction as a fraction of the size of the related party deal, namely pyramidal control and length of time that has elapsed from the firm’s IPO (although both were associated with a significant negative market reaction, none could explain the fraction of the deal that is “taxed” away by the controlling SOE shareholders). Pyramids may provide additional opportunities to expropriate and to conceal expropriation (Bertrand, Mehta, and Mullainathan, 2002). The examination of the timing of the transaction relative to the firm’s IPO is motivated by the possibility that local government SOEs may prop up firms that they plan to list in the stock market in order to satisfy listing requirements and obtain a good IPO price. Following the listing, these resources may be transferred back to the SOE through related party transactions. Furthermore, we collect evidence on the performance of the non-listed SOEs that control the listed firms in our sample. Again this variable is not significant in explaining the proportion of the “tax” that firms transfer to their controlling shareholders, although it is significant in explaining the market reaction. Finally, we also include a dummy variable for companies with directors in Forbes magazine’s “China’s richest 200” list, whose coefficient was significantly negative. It has been suggested in the press that many individuals appearing on China’s richest lists have subsequently been prosecuted for corruption.
- Page 26 -
judicial authorities are more thorough in investigating cases, they will uncover larger amounts of
misappropriated funds, both per case and per official arrested. Our procedure yields the
following anti-corruption effectiveness index:
Anti-corruption effectiveness = 0.23 × Misappropriation share over GRP share +
0.56 × Total amount misappropriated in the province + 0.56 × Amount
misappropriated per case + 0.56 × Amount misappropriated per official arrested
In Table 7, Panel A, columns 9-10, we divide our sample according to whether the
province has an above- or below-median anti-corruption effectiveness index. Since the median is
calculated over the 32 provinces (and not over the observations in our sample), there are almost
twice as many observations by firms located in provinces with a low index compared to
provinces with a high index. Only firms located in provinces with a low index appear subject to
expropriation in column 9, which is consistent with the conjecture that the expropriation may be
related to corruption.
We examine this issue deeper in Panels B and C. Our sample includes both cases where
firms have been expropriated and a smaller number of cases where firms may have benefited
from related party transactions with their controlling SOE shareholders. If our conjecture on
corruption being the motivation behind cases where listed firms have been expropriated by their
controlling SOEs is correct, we should expect to find corruption to be significant only in cases
where firms have been expropriated. Only in these cases is wealth transferred from the listed
firm to the controlling SOE or the local government, and therefore available for further
misappropriation by government bureaucrats.
In Table 7, Panels B and C, we divide our sample into value-destroying and value
enhancing related party transactions. We regress the fraction of the related party transaction
dissipated away on the anti-corruption effectiveness index in column 1, adding successively the
provincial budget deficit, unemployment, and GRP per capita in columns 2-4. In Panel B, we
find that the anti-corruption effectiveness index is positive and highly statistically significant (at
the 1% level in column 1) in explaining the market reaction to value-destroying related party
transactions. Higher anti-corruption effectiveness in a province is associated with a less negative
market reaction for firms undertaking related party transactions. This holds even after adding
controls for provincial economic performance in columns 2-4. On the other hand, as conjectured,
- Page 27 -
the anti-corruption effectiveness variable has no explanatory power for value-enhancing related
party transactions in Panel C.
In summary, our analysis shows that there is a transfer of assets from listed firms to their
controlling SOE shareholders. Most of the transfer is concentrated in firms controlled by local
government SOEs or with a large proportion of local government affiliated directors on their
boards (as opposed to central government controlled SOEs). The results are mainly driven by
SOEs controlled by local governments of the better performing regions, and therefore cannot be
attributed to a social role motive. Instead we find that the transfer of assets to local government
controlled SOEs is concentrated in provinces where local government bureaucrats are less likely
to be prosecuted for misappropriation of state funds, suggesting that these transfers are more
likely to be correlated with wealth transfer to local government bureaucrats.
IX.C. Do expropriated firms lose on average?
What happens when firms make repeated related party transactions? Perhaps they gain in
some transactions and lose in others, which would be consistent with the hypothesis that the
results we document are driven by chance. However we find no evidence that firms which are
expropriated in one related party transaction consistently benefit in others (we do not report these
results in tables for brevity). There are 29 firms in our sample that conduct more than one related
party transaction with their controlling SOEs during our sample period (overall, these firms
conduct 69 transactions). When we estimate the total value change associated with the
transaction (CAR multiplied by the market capitalization of the listed firm) and sum the net total
across all related party transactions conducted by each firm, we find that 62% of these firms (18
out of 29) experience an overall net value destruction. The aggregate value destruction
experienced by these firms is RMB5 billion (US$605 million). On the other hand, the 11 firms
with an overall net benefit gain, on aggregate, RMB4.1 billion (US$495 million). Across all 29
firms with multiple related party transactions, the aggregate value destruction is RMB0.9 billion
(US$110 million).
X. Conclusions
Our results are most consistent with the hypothesis that minority shareholders in Chinese
publicly listed firms are subject to expropriation when they enter into related party transactions
- Page 28 -
with their local government shareholders, but are benefited when they enter into transactions
with central government shareholders. Our results are strongest for firms where the state-owned
shareholders are controlled by one of China’s local (provincial) governments or for firms that
have a large proportion of directors affiliated with a local government on their boards. On
average, one third of the value of the related party transactions is dissipated by these listed firms.
Local government controlled firms represent the majority of the state-owned firms in China.
Therefore, the expropriation appears to be of considerable economic significance.
While the previous literature suggests that state-owned firms do not maximize firm value,
our results are more consistent with the direct transfer of resources away from minority
shareholders than with the poor performance of state-owned firms. The expropriation of
resources by the state-controlled firms is more pronounced in provinces where corrupt
government officials are less likely to be prosecuted. Our evidence is in line with widespread
anecdotal evidence that documents corruption among local government bureaucrats in China.
Our findings for local governments are consistent with Frye and Shleifer (1997), and
Shleifer and Vishny (1998), who argue that the government may have a “grabbing hand”, and we
describe one of the ways in which the grabbing hand grabs. The differences in the behavior of
the central and local governments in China (and of the directors that are affiliated with them) we
highlight are new. China may be representative of a number of other large countries (such as
India, Russia, Mexico, Brazil, Argentina etc.), that are characterized by strong local governments
with autonomy in influencing economic policy. Our evidence also suggests that the effects of
local government ownership may differ from those of central government ownership.
Consequently, focusing only on the level of state ownership, rather than on the type, as most of
the literature on state-owned enterprises has done, may miss part of a larger picture.
We leave some puzzles unanswered. Why might central government incentives be
different from local government incentives? Why is it that the central government follows the
helping hand while the local government follows the grabbing hand? One reason might be that
the possibility of adverse publicity is higher at the central government level but less likely in
remote provinces. Under what conditions would adverse publicity prevent expropriation? Further
research is needed to answer these questions.
- Page 29 -
References
Bai, Chong-En, Qiao Liu, Joe Lu, Frank M. Song, and Junxi Zhang, 2004, Corporate governance
and market valuation in China, Journal of Comparative Economics 32, 599-616.
Bardhan, Pranab, 2002, Decentralization of governance and development, Journal of Economic
Perspectives, 16, 185-205.
Bertrand, Marianne, Paras Mehta, and Sendhil Mullainathan, 2002, Ferreting out tunneling: An
application to Indian business groups, Quarterly Journal of Economics 118, 121-148.
Chang, Eric C., and Sonia M. L. Wong, 2004, Political control and performance in China's listed
firms, Journal of Comparative Economics 32, 617-636.
Cheung, Yan-Leung, P. Raghavendra Rau, and Aris Stouraitis, 2006, Tunneling, propping, and
expropriation: Evidence from connected party transactions in Hong Kong, Journal of Financial
Economics 82, 343-386.
Djankov, Simeon, Rafael La Porta, Florencio Lopez-de-Silanes, and Andrei Shleifer, 2007, The
law and economics of self-dealing, Journal of Financial Economics, forthcoming.
Durnev, Art, and Larry Fauver, 2007, Stealing from thieves: Firm governance and performance
when states are predatory, unpublished working paper, McGill University.
Faccio, Mara, Ronald W. Masulis, and John J. McConnell, 2006, Political connections and
corporate bailouts, Journal of Finance 61, 2597-2635.
Faccio, Mara, 2006, Politically connected firms, American Economic Review 96, 369-386.
Fan, Joseph P. H., T. J. Wong, and Tianyu Zhang, 2007, Politically-connected CEOs, corporate
governance and post-IPO performance of China's newly partially privatized firms, Journal of
Financial Economics 84, 330-357.
Ferguson, Thomas, and Hans-Joachim Voth, 2008, Betting on Hitler - the value of political
connections in Nazi Germany, Quarterly Journal of Economics 123, 101-137.
Fisman, Raymond, 2001, Estimating the value of political connections, American Economic
Review 91, 1095-1102.
- Page 30 -
Frye, Timothy, and Andrei Shleifer, 1997, The invisible hand and the grabbing hand, American
Economic Review 87, 354-358.
Jayachandran, Seema, 2006, The Jeffords effect, Journal of Law and Economics, 49, 397–425.
Jian, Ming and T.J. Wong, 2003, Earnings management and tunneling through related party
transactions: Evidence from Chinese corporate groups, Hong Kong University of Science &
Technology working paper.
Jin, Hehui, and Yingyi Qian, 1998, Public versus private ownership of firms: Evidence from
rural China, Quarterly Journal of Economics 113, 773-808.
Johnson, Simon, Rafael La Porta, Florencio Lopez-de-Silanes, and Andrei Shleifer, 2000,
Tunneling, American Economic Review 90, 22-27.
Johnson, Simon, and Todd Mitton, 2003, Cronyism and capital controls: Evidence from
Malaysia, Journal of Financial Economics 67, 351-382.
Khwaja, Asim Ijaz, and Atif Mian, 2005, Do lenders favor politically connected firms? Rent
provision in an emerging financial market, Quarterly Journal of Economics 120, 1371-1411.
Knight, Brian, 2007, Are Policy Platforms Capitalized into Equity Prices? Evidence from the
Bush/Gore 2000 Presidential Election, Journal of Public Economics, 91, 389–409.
La Porta, Rafael, Florencio Lopez-de-Silanes, Andrei Shleifer, and Robert W. Vishny, 1998,
Law and finance, Journal of Political Economy 106, 1113-1155.
La Porta, Rafael, Florencio Lopez-de-Silanes, and Guillermo Zamarippa, 2003, Related lending,
Quarterly Journal of Economics 119, 231-268.
Leuz, Christian, and Felix Oberholzer-Gee, 2006, Political relationships, global financing and
corporate transparency: Evidence from Indonesia, Journal of Financial Economics 81, 411-439.
Li, Genyou, Xiping Zhao, and Huanzu Li, 2001, Board structure and corporate performance in
China, Industrial Economy of China, 5, 48-53.
Megginson, William L., and Jeffry M. Netter, 2001, From state to market: A survey of empirical
studies on privatization, Journal of Economic Literature 39, 321-389.
- Page 31 -
Olken, Benjamin A., 2007, Monitoring corruption: Evidence from a field experiment in
Indonesia, Journal of Political Economy 115, 200-249.
Rau, P. Raghavendra, and Theo Vermaelen, 1998, Glamour, value and the post-acquisition
performance of acquiring firms, Journal of Financial Economics 49, 223-253.
Roberts, Brian, 1990, A dead Senator tells no lies: Seniority and the distribution of federal
benefits, American Journal of Political Science 34, 31-58.
Shleifer, Andrei, and Robert W. Vishny, 1993, Corruption, Quarterly Journal of Economics 108,
599-617.
Shleifer, Andrei, and Robert W. Vishny, 1994, Politicians and firms, Quarterly Journal of
Economics 109, 995-1025.
Shleifer, Andrei, and Robert W. Vishny, 1998, The grabbing hand: Government pathologies and
their cures, Cambridge, Mass.: Harvard University Press.
White, Halbert, 1980, A heteroskedasticity-consistent covariance matrix estimator and a direct
test for heteroskedasticity, Econometrica: Journal of the Econometric Society 48, 817-838.
Zingales, Luigi, 1994, The value of the voting right: A study of the Milan stock exchange
experience, Review of Financial Studies 7, 125-148.
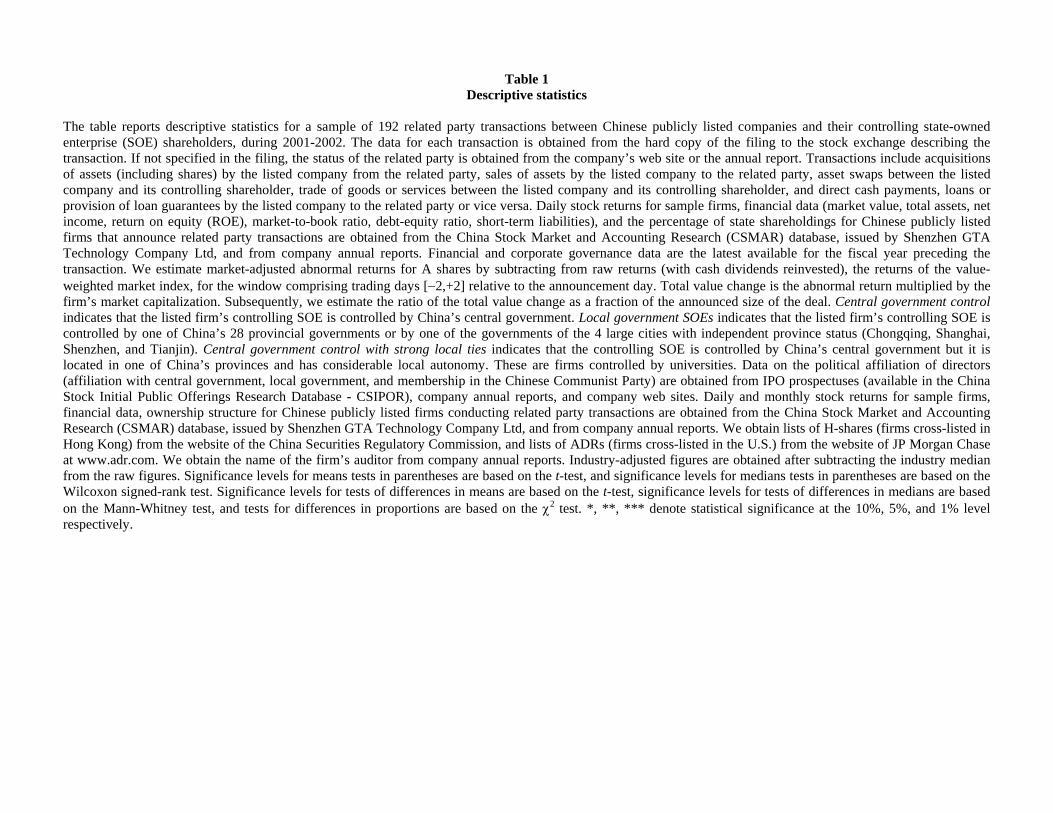
Table 1 Descriptive statistics
The table reports descriptive statistics for a sample of 192 related party transactions between Chinese publicly listed companies and their controlling state-owned enterprise (SOE) shareholders, during 2001-2002. The data for each transaction is obtained from the hard copy of the filing to the stock exchange describing the transaction. If not specified in the filing, the status of the related party is obtained from the company’s web site or the annual report. Transactions include acquisitions of assets (including shares) by the listed company from the related party, sales of assets by the listed company to the related party, asset swaps between the listed company and its controlling shareholder, trade of goods or services between the listed company and its controlling shareholder, and direct cash payments, loans or provision of loan guarantees by the listed company to the related party or vice versa. Daily stock returns for sample firms, financial data (market value, total assets, net income, return on equity (ROE), market-to-book ratio, debt-equity ratio, short-term liabilities), and the percentage of state shareholdings for Chinese publicly listed firms that announce related party transactions are obtained from the China Stock Market and Accounting Research (CSMAR) database, issued by Shenzhen GTA Technology Company Ltd, and from company annual reports. Financial and corporate governance data are the latest available for the fiscal year preceding the transaction. We estimate market-adjusted abnormal returns for A shares by subtracting from raw returns (with cash dividends reinvested), the returns of the value-weighted market index, for the window comprising trading days [−2,+2] relative to the announcement day. Total value change is the abnormal return multiplied by the firm’s market capitalization. Subsequently, we estimate the ratio of the total value change as a fraction of the announced size of the deal. Central government control indicates that the listed firm’s controlling SOE is controlled by China’s central government. Local government SOEs indicates that the listed firm’s controlling SOE is controlled by one of China’s 28 provincial governments or by one of the governments of the 4 large cities with independent province status (Chongqing, Shanghai, Shenzhen, and Tianjin). Central government control with strong local ties indicates that the controlling SOE is controlled by China’s central government but it is located in one of China’s provinces and has considerable local autonomy. These are firms controlled by universities. Data on the political affiliation of directors (affiliation with central government, local government, and membership in the Chinese Communist Party) are obtained from IPO prospectuses (available in the China Stock Initial Public Offerings Research Database - CSIPOR), company annual reports, and company web sites. Daily and monthly stock returns for sample firms, financial data, ownership structure for Chinese publicly listed firms conducting related party transactions are obtained from the China Stock Market and Accounting Research (CSMAR) database, issued by Shenzhen GTA Technology Company Ltd, and from company annual reports. We obtain lists of H-shares (firms cross-listed in Hong Kong) from the website of the China Securities Regulatory Commission, and lists of ADRs (firms cross-listed in the U.S.) from the website of JP Morgan Chase at www.adr.com. We obtain the name of the firm’s auditor from company annual reports. Industry-adjusted figures are obtained after subtracting the industry median from the raw figures. Significance levels for means tests in parentheses are based on the t-test, and significance levels for medians tests in parentheses are based on the Wilcoxon signed-rank test. Significance levels for tests of differences in means are based on the t-test, significance levels for tests of differences in medians are based on the Mann-Whitney test, and tests for differences in proportions are based on the χ2 test. *, **, *** denote statistical significance at the 10%, 5%, and 1% level respectively.
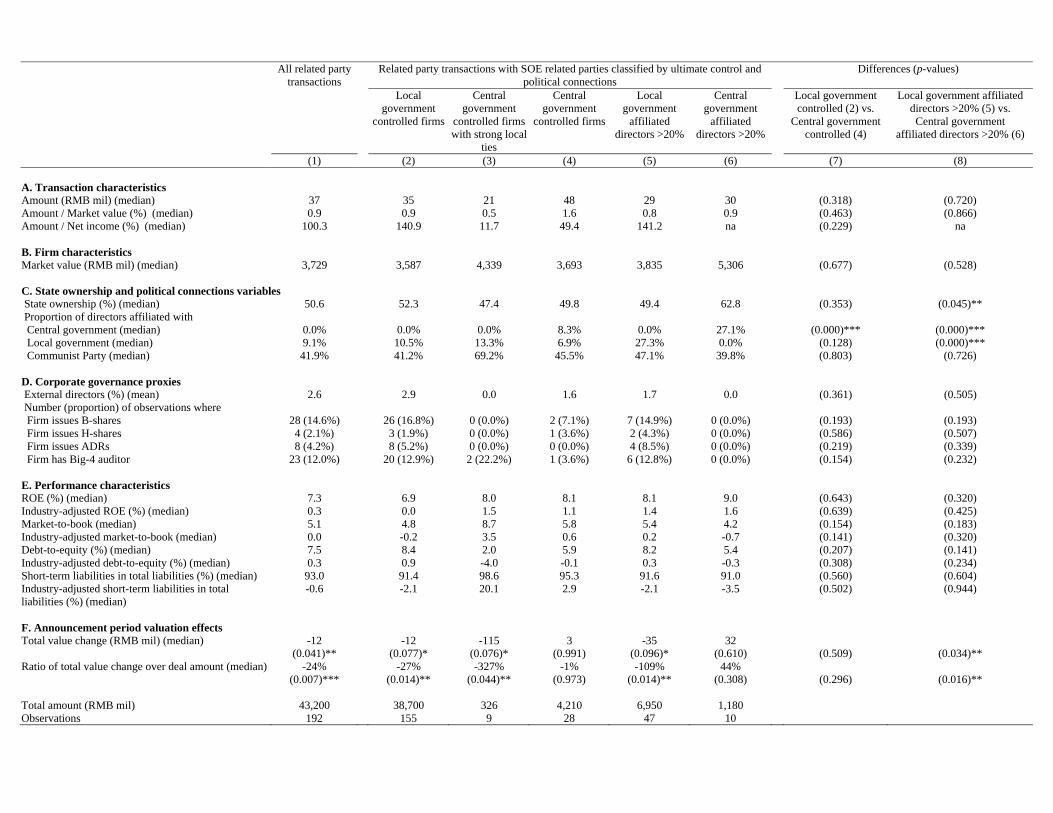
All related party transactions
Related party transactions with SOE related parties classified by ultimate control and political connections
Differences (p-values)
Local government
controlled firms
Central government
controlled firms with strong local
ties
Central government
controlled firms
Local government
affiliated directors >20%
Central government
affiliated directors >20%
Local government controlled (2) vs.
Central government controlled (4)
Local government affiliated directors >20% (5) vs. Central government
affiliated directors >20% (6)
(1) (2) (3) (4) (5) (6) (7) (8) A. Transaction characteristics Amount (RMB mil) (median) 37 35 21 48 29 30 (0.318) (0.720) Amount / Market value (%) (median) 0.9 0.9 0.5 1.6 0.8 0.9 (0.463) (0.866) Amount / Net income (%) (median) 100.3 140.9 11.7 49.4 141.2 na (0.229) na B. Firm characteristics Market value (RMB mil) (median) 3,729 3,587 4,339 3,693 3,835 5,306 (0.677) (0.528) C. State ownership and political connections variables State ownership (%) (median) 50.6 52.3 47.4 49.8 49.4 62.8 (0.353) (0.045)** Proportion of directors affiliated with Central government (median) 0.0% 0.0% 0.0% 8.3% 0.0% 27.1% (0.000)*** (0.000)*** Local government (median) 9.1% 10.5% 13.3% 6.9% 27.3% 0.0% (0.128) (0.000)*** Communist Party (median) 41.9% 41.2% 69.2% 45.5% 47.1% 39.8% (0.803) (0.726) D. Corporate governance proxies External directors (%) (mean) 2.6 2.9 0.0 1.6 1.7 0.0 (0.361) (0.505) Number (proportion) of observations where Firm issues B-shares 28 (14.6%) 26 (16.8%) 0 (0.0%) 2 (7.1%) 7 (14.9%) 0 (0.0%) (0.193) (0.193) Firm issues H-shares 4 (2.1%) 3 (1.9%) 0 (0.0%) 1 (3.6%) 2 (4.3%) 0 (0.0%) (0.586) (0.507) Firm issues ADRs 8 (4.2%) 8 (5.2%) 0 (0.0%) 0 (0.0%) 4 (8.5%) 0 (0.0%) (0.219) (0.339) Firm has Big-4 auditor 23 (12.0%) 20 (12.9%) 2 (22.2%) 1 (3.6%) 6 (12.8%) 0 (0.0%) (0.154) (0.232) E. Performance characteristics ROE (%) (median) 7.3 6.9 8.0 8.1 8.1 9.0 (0.643) (0.320) Industry-adjusted ROE (%) (median) 0.3 0.0 1.5 1.1 1.4 1.6 (0.639) (0.425) Market-to-book (median) 5.1 4.8 8.7 5.8 5.4 4.2 (0.154) (0.183) Industry-adjusted market-to-book (median) 0.0 -0.2 3.5 0.6 0.2 -0.7 (0.141) (0.320) Debt-to-equity (%) (median) 7.5 8.4 2.0 5.9 8.2 5.4 (0.207) (0.141) Industry-adjusted debt-to-equity (%) (median) 0.3 0.9 -4.0 -0.1 0.3 -0.3 (0.308) (0.234) Short-term liabilities in total liabilities (%) (median) 93.0 91.4 98.6 95.3 91.6 91.0 (0.560) (0.604) Industry-adjusted short-term liabilities in total liabilities (%) (median)
-0.6 -2.1 20.1 2.9 -2.1 -3.5 (0.502) (0.944)
F. Announcement period valuation effects Total value change (RMB mil) (median) -12
(0.041)** -12
(0.077)* -115
(0.076)* 3
(0.991) -35
(0.096)* 32
(0.610)
(0.509)
(0.034)** Ratio of total value change over deal amount (median) -24%
(0.007)*** -27%
(0.014)** -327%
(0.044)** -1%
(0.973) -109%
(0.014)** 44%
(0.308)
(0.296)
(0.016)** Total amount (RMB mil) 43,200 38,700 326 4,210 6,950 1,180 Observations 192 155 9 28 47 10
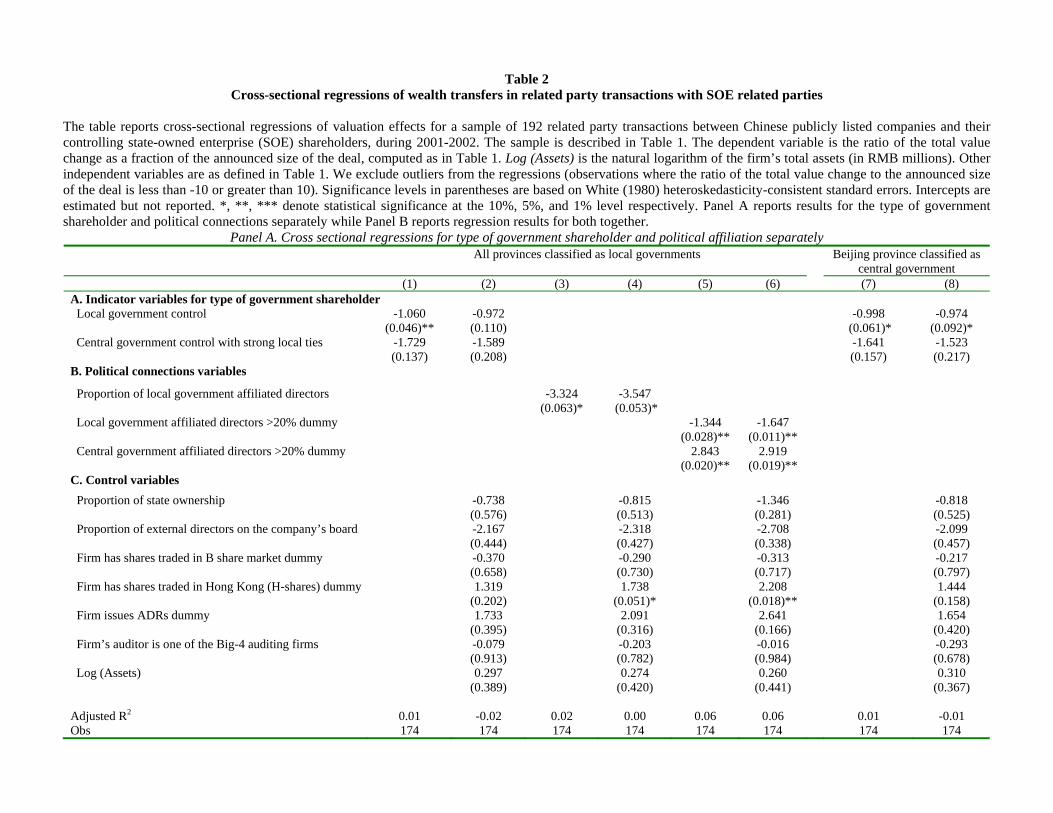
Table 2 Cross-sectional regressions of wealth transfers in related party transactions with SOE related parties
The table reports cross-sectional regressions of valuation effects for a sample of 192 related party transactions between Chinese publicly listed companies and their controlling state-owned enterprise (SOE) shareholders, during 2001-2002. The sample is described in Table 1. The dependent variable is the ratio of the total value change as a fraction of the announced size of the deal, computed as in Table 1. Log (Assets) is the natural logarithm of the firm’s total assets (in RMB millions). Other independent variables are as defined in Table 1. We exclude outliers from the regressions (observations where the ratio of the total value change to the announced size of the deal is less than -10 or greater than 10). Significance levels in parentheses are based on White (1980) heteroskedasticity-consistent standard errors. Intercepts are estimated but not reported. *, **, *** denote statistical significance at the 10%, 5%, and 1% level respectively. Panel A reports results for the type of government shareholder and political connections separately while Panel B reports regression results for both together.
Panel A. Cross sectional regressions for type of government shareholder and political affiliation separately All provinces classified as local governments Beijing province classified as
central government (1) (2) (3) (4) (5) (6) (7) (8) A. Indicator variables for type of government shareholder Local government control -1.060
(0.046)** -0.972 (0.110)
-0.998 (0.061)*
-0.974 (0.092)*
Central government control with strong local ties -1.729 (0.137)
-1.589 (0.208)
-1.641 (0.157)
-1.523 (0.217)
B. Political connections variables
Proportion of local government affiliated directors -3.324 (0.063)*
-3.547 (0.053)*
Local government affiliated directors >20% dummy -1.344 (0.028)**
-1.647 (0.011)**
Central government affiliated directors >20% dummy 2.843 (0.020)**
2.919 (0.019)**
C. Control variables Proportion of state ownership
-0.738 (0.576)
-0.815 (0.513)
-1.346 (0.281)
-0.818 (0.525)
Proportion of external directors on the company’s board
-2.167 (0.444)
-2.318 (0.427)
-2.708 (0.338)
-2.099 (0.457)
Firm has shares traded in B share market dummy
-0.370 (0.658)
-0.290 (0.730)
-0.313 (0.717)
-0.217 (0.797)
Firm has shares traded in Hong Kong (H-shares) dummy
1.319 (0.202)
1.738 (0.051)*
2.208 (0.018)**
1.444 (0.158)
Firm issues ADRs dummy
1.733 (0.395)
2.091 (0.316)
2.641 (0.166)
1.654 (0.420)
Firm’s auditor is one of the Big-4 auditing firms
-0.079 (0.913)
-0.203 (0.782)
-0.016 (0.984)
-0.293 (0.678)
Log (Assets)
0.297 (0.389)
0.274 (0.420)
0.260 (0.441)
0.310 (0.367)
Adjusted R2 0.01 -0.02 0.02 0.00 0.06 0.06 0.01 -0.01 Obs 174 174 174 174 174 174 174 174
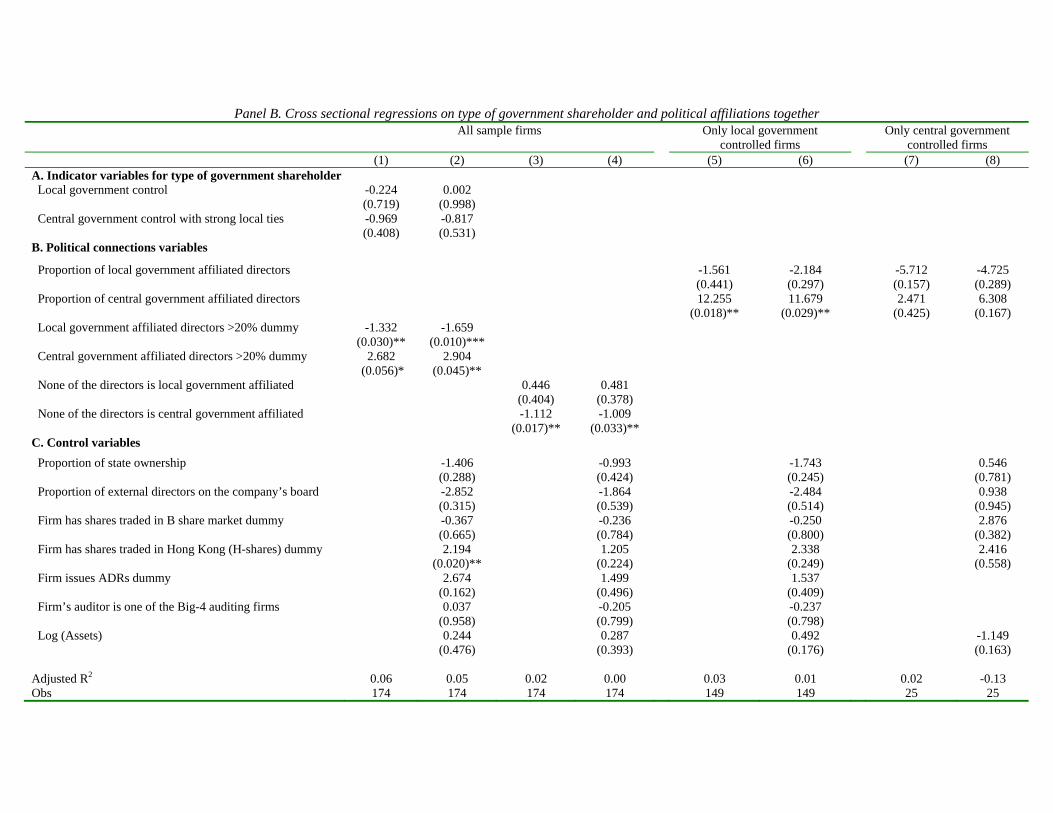
Panel B. Cross sectional regressions on type of government shareholder and political affiliations together All sample firms Only local government
controlled firms Only central government
controlled firms (1) (2) (3) (4) (5) (6) (7) (8) A. Indicator variables for type of government shareholder Local government control -0.224
(0.719) 0.002
(0.998)
Central government control with strong local ties -0.969 (0.408)
-0.817 (0.531)
B. Political connections variables
Proportion of local government affiliated directors -1.561 (0.441)
-2.184 (0.297)
-5.712 (0.157)
-4.725 (0.289)
Proportion of central government affiliated directors 12.255 (0.018)**
11.679 (0.029)**
2.471 (0.425)
6.308 (0.167)
Local government affiliated directors >20% dummy -1.332 (0.030)**
-1.659 (0.010)***
Central government affiliated directors >20% dummy 2.682 (0.056)*
2.904 (0.045)**
None of the directors is local government affiliated 0.446 (0.404)
0.481 (0.378)
None of the directors is central government affiliated -1.112 (0.017)**
-1.009 (0.033)**
C. Control variables Proportion of state ownership
-1.406 (0.288)
-0.993 (0.424)
-1.743 (0.245)
0.546 (0.781)
Proportion of external directors on the company’s board
-2.852 (0.315)
-1.864 (0.539)
-2.484 (0.514)
0.938 (0.945)
Firm has shares traded in B share market dummy
-0.367 (0.665)
-0.236 (0.784)
-0.250 (0.800)
2.876 (0.382)
Firm has shares traded in Hong Kong (H-shares) dummy 2.194 (0.020)**
1.205 (0.224)
2.338 (0.249)
2.416 (0.558)
Firm issues ADRs dummy 2.674 (0.162)
1.499 (0.496)
1.537 (0.409)
Firm’s auditor is one of the Big-4 auditing firms 0.037 (0.958)
-0.205 (0.799)
-0.237 (0.798)
Log (Assets)
0.244 (0.476)
0.287 (0.393)
0.492 (0.176)
-1.149 (0.163)
Adjusted R2 0.06 0.05 0.02 0.00 0.03 0.01 0.02 -0.13 Obs 174 174 174 174 149 149 25 25
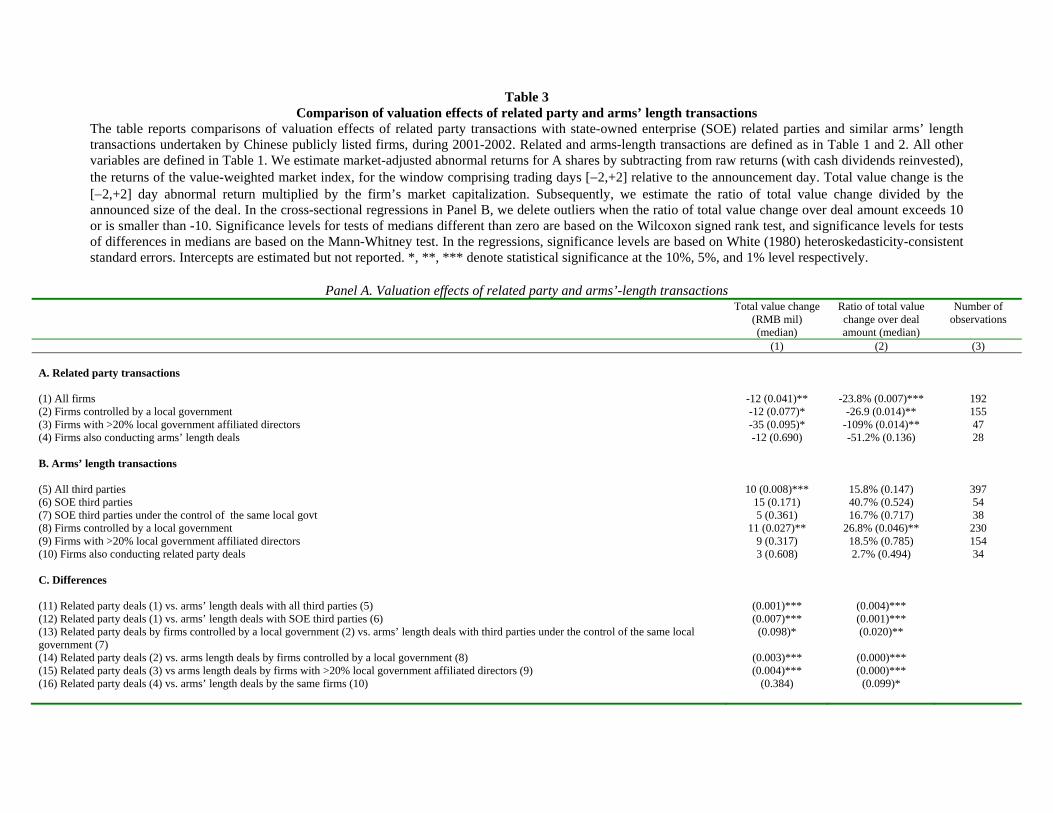
Table 3 Comparison of valuation effects of related party and arms’ length transactions
The table reports comparisons of valuation effects of related party transactions with state-owned enterprise (SOE) related parties and similar arms’ length transactions undertaken by Chinese publicly listed firms, during 2001-2002. Related and arms-length transactions are defined as in Table 1 and 2. All other variables are defined in Table 1. We estimate market-adjusted abnormal returns for A shares by subtracting from raw returns (with cash dividends reinvested), the returns of the value-weighted market index, for the window comprising trading days [−2,+2] relative to the announcement day. Total value change is the [−2,+2] day abnormal return multiplied by the firm’s market capitalization. Subsequently, we estimate the ratio of total value change divided by the announced size of the deal. In the cross-sectional regressions in Panel B, we delete outliers when the ratio of total value change over deal amount exceeds 10 or is smaller than -10. Significance levels for tests of medians different than zero are based on the Wilcoxon signed rank test, and significance levels for tests of differences in medians are based on the Mann-Whitney test. In the regressions, significance levels are based on White (1980) heteroskedasticity-consistent standard errors. Intercepts are estimated but not reported. *, **, *** denote statistical significance at the 10%, 5%, and 1% level respectively.
Panel A. Valuation effects of related party and arms’-length transactions Total value change
(RMB mil) (median)
Ratio of total value change over deal amount (median)
Number of observations
(1) (2) (3) A. Related party transactions (1) All firms -12 (0.041)** -23.8% (0.007)*** 192 (2) Firms controlled by a local government -12 (0.077)* -26.9 (0.014)** 155 (3) Firms with >20% local government affiliated directors -35 (0.095)* -109% (0.014)** 47 (4) Firms also conducting arms’ length deals -12 (0.690) -51.2% (0.136) 28 B. Arms’ length transactions (5) All third parties 10 (0.008)*** 15.8% (0.147) 397 (6) SOE third parties 15 (0.171) 40.7% (0.524) 54 (7) SOE third parties under the control of the same local govt 5 (0.361) 16.7% (0.717) 38 (8) Firms controlled by a local government 11 (0.027)** 26.8% (0.046)** 230 (9) Firms with >20% local government affiliated directors 9 (0.317) 18.5% (0.785) 154 (10) Firms also conducting related party deals 3 (0.608) 2.7% (0.494) 34 C. Differences (11) Related party deals (1) vs. arms’ length deals with all third parties (5) (0.001)*** (0.004)*** (12) Related party deals (1) vs. arms’ length deals with SOE third parties (6) (0.007)*** (0.001)*** (13) Related party deals by firms controlled by a local government (2) vs. arms’ length deals with third parties under the control of the same local government (7)
(0.098)* (0.020)**
(14) Related party deals (2) vs. arms length deals by firms controlled by a local government (8) (0.003)*** (0.000)*** (15) Related party deals (3) vs arms length deals by firms with >20% local government affiliated directors (9) (0.004)*** (0.000)*** (16) Related party deals (4) vs. arms’ length deals by the same firms (10) (0.384) (0.099)*
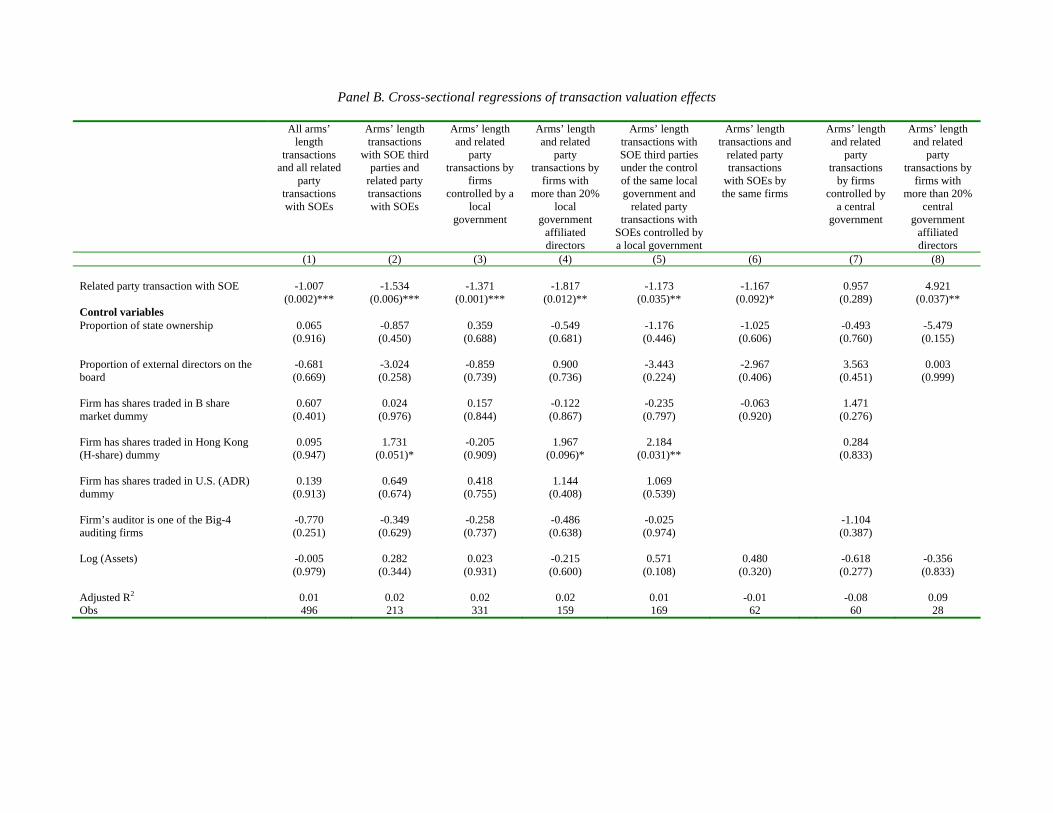
Panel B. Cross-sectional regressions of transaction valuation effects
All arms’ length
transactions and all related
party transactions with SOEs
Arms’ length transactions
with SOE third parties and
related party transactions with SOEs
Arms’ length and related
party transactions by
firms controlled by a
local government
Arms’ length and related
party transactions by
firms with more than 20%
local government
affiliated directors
Arms’ length transactions with SOE third parties under the control of the same local government and
related party transactions with
SOEs controlled by a local government
Arms’ length transactions and
related party transactions
with SOEs by the same firms
Arms’ length and related
party transactions
by firms controlled by
a central government
Arms’ length and related
party transactions by
firms with more than 20%
central government
affiliated directors
(1) (2) (3) (4) (5) (6) (7) (8) Related party transaction with SOE -1.007
(0.002)*** -1.534
(0.006)*** -1.371
(0.001)*** -1.817
(0.012)** -1.173
(0.035)** -1.167
(0.092)* 0.957
(0.289) 4.921
(0.037)** Control variables Proportion of state ownership
0.065 (0.916)
-0.857 (0.450)
0.359 (0.688)
-0.549 (0.681)
-1.176 (0.446)
-1.025 (0.606)
-0.493 (0.760)
-5.479 (0.155)
Proportion of external directors on the board
-0.681 (0.669)
-3.024 (0.258)
-0.859 (0.739)
0.900 (0.736)
-3.443 (0.224)
-2.967 (0.406)
3.563 (0.451)
0.003 (0.999)
Firm has shares traded in B share market dummy
0.607 (0.401)
0.024 (0.976)
0.157 (0.844)
-0.122 (0.867)
-0.235 (0.797)
-0.063 (0.920)
1.471 (0.276)
Firm has shares traded in Hong Kong (H-share) dummy
0.095 (0.947)
1.731 (0.051)*
-0.205 (0.909)
1.967 (0.096)*
2.184 (0.031)**
0.284 (0.833)
Firm has shares traded in U.S. (ADR) dummy
0.139 (0.913)
0.649 (0.674)
0.418 (0.755)
1.144 (0.408)
1.069 (0.539)
Firm’s auditor is one of the Big-4 auditing firms
-0.770 (0.251)
-0.349 (0.629)
-0.258 (0.737)
-0.486 (0.638)
-0.025 (0.974)
-1.104 (0.387)
Log (Assets) -0.005 (0.979)
0.282 (0.344)
0.023 (0.931)
-0.215 (0.600)
0.571 (0.108)
0.480 (0.320)
-0.618 (0.277)
-0.356 (0.833)
Adjusted R2 0.01 0.02 0.02 0.02 0.01 -0.01 -0.08 0.09Obs 496 213 331 159 169 62 60 28
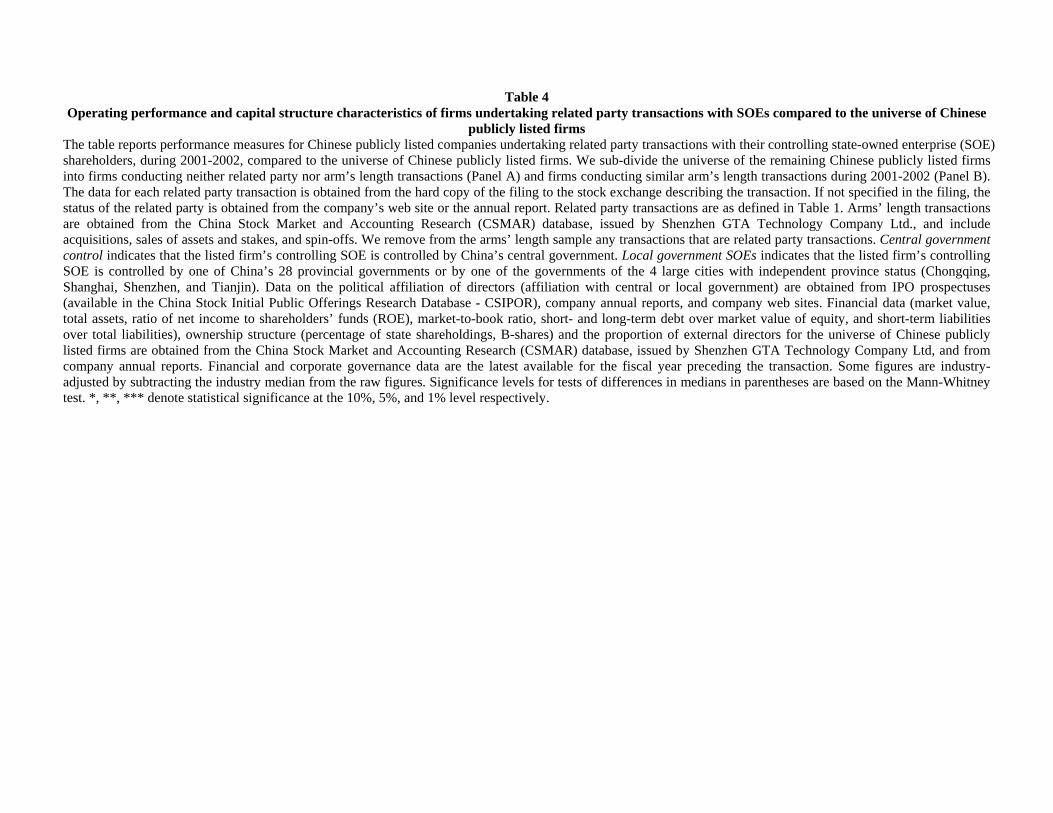
Table 4 Operating performance and capital structure characteristics of firms undertaking related party transactions with SOEs compared to the universe of Chinese
publicly listed firms The table reports performance measures for Chinese publicly listed companies undertaking related party transactions with their controlling state-owned enterprise (SOE) shareholders, during 2001-2002, compared to the universe of Chinese publicly listed firms. We sub-divide the universe of the remaining Chinese publicly listed firms into firms conducting neither related party nor arm’s length transactions (Panel A) and firms conducting similar arm’s length transactions during 2001-2002 (Panel B). The data for each related party transaction is obtained from the hard copy of the filing to the stock exchange describing the transaction. If not specified in the filing, the status of the related party is obtained from the company’s web site or the annual report. Related party transactions are as defined in Table 1. Arms’ length transactions are obtained from the China Stock Market and Accounting Research (CSMAR) database, issued by Shenzhen GTA Technology Company Ltd., and include acquisitions, sales of assets and stakes, and spin-offs. We remove from the arms’ length sample any transactions that are related party transactions. Central government control indicates that the listed firm’s controlling SOE is controlled by China’s central government. Local government SOEs indicates that the listed firm’s controlling SOE is controlled by one of China’s 28 provincial governments or by one of the governments of the 4 large cities with independent province status (Chongqing, Shanghai, Shenzhen, and Tianjin). Data on the political affiliation of directors (affiliation with central or local government) are obtained from IPO prospectuses (available in the China Stock Initial Public Offerings Research Database - CSIPOR), company annual reports, and company web sites. Financial data (market value, total assets, ratio of net income to shareholders’ funds (ROE), market-to-book ratio, short- and long-term debt over market value of equity, and short-term liabilities over total liabilities), ownership structure (percentage of state shareholdings, B-shares) and the proportion of external directors for the universe of Chinese publicly listed firms are obtained from the China Stock Market and Accounting Research (CSMAR) database, issued by Shenzhen GTA Technology Company Ltd, and from company annual reports. Financial and corporate governance data are the latest available for the fiscal year preceding the transaction. Some figures are industry-adjusted by subtracting the industry median from the raw figures. Significance levels for tests of differences in medians in parentheses are based on the Mann-Whitney test. *, **, *** denote statistical significance at the 10%, 5%, and 1% level respectively.
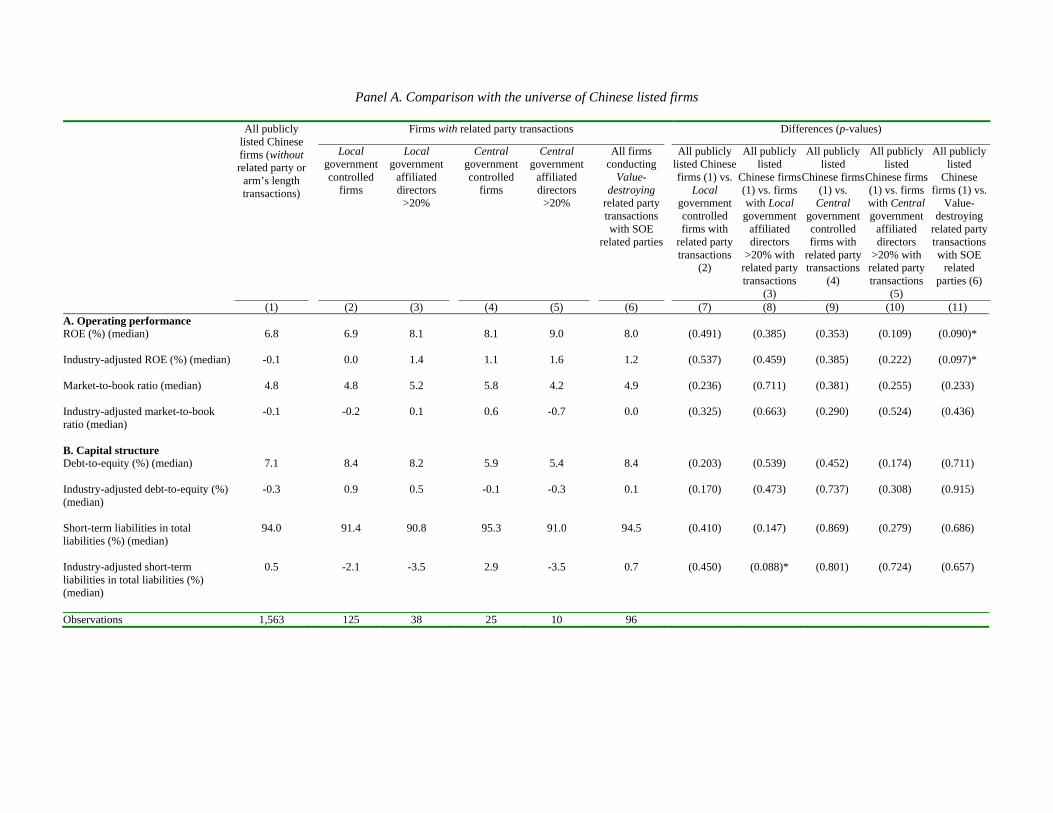
Panel A. Comparison with the universe of Chinese listed firms
All publicly listed Chinese firms (without related party or
arm’s length transactions)
Firms with related party transactions Differences (p-values)
Local government controlled
firms
Local government
affiliated directors
>20%
Central government controlled
firms
Central government
affiliated directors
>20%
All firms conducting
Value-destroying
related party transactions with SOE
related parties
All publicly listed Chinese firms (1) vs.
Local government controlled firms with
related party transactions
(2)
All publicly listed
Chinese firms (1) vs. firms with Local government
affiliated directors
>20% with related party transactions
(3)
All publicly listed
Chinese firms (1) vs.
Central government controlled firms with
related party transactions
(4)
All publicly listed
Chinese firms (1) vs. firms with Central government
affiliated directors
>20% with related party transactions
(5)
All publicly listed
Chinese firms (1) vs.
Value-destroying
related party transactions with SOE
related parties (6)
(1) (2) (3) (4) (5) (6) (7) (8) (9) (10) (11) A. Operating performance ROE (%) (median)
6.8 6.9 8.1 8.1 9.0 8.0 (0.491) (0.385) (0.353) (0.109) (0.090)*
Industry-adjusted ROE (%) (median)
-0.1 0.0 1.4 1.1 1.6 1.2 (0.537) (0.459) (0.385) (0.222) (0.097)*
Market-to-book ratio (median)
4.8 4.8 5.2 5.8 4.2 4.9 (0.236) (0.711) (0.381) (0.255) (0.233)
Industry-adjusted market-to-book ratio (median)
-0.1 -0.2 0.1 0.6 -0.7 0.0 (0.325) (0.663) (0.290) (0.524) (0.436)
B. Capital structure Debt-to-equity (%) (median)
7.1 8.4 8.2 5.9 5.4 8.4 (0.203) (0.539) (0.452) (0.174) (0.711)
Industry-adjusted debt-to-equity (%) (median)
-0.3 0.9 0.5 -0.1 -0.3 0.1 (0.170) (0.473) (0.737) (0.308) (0.915)
Short-term liabilities in total liabilities (%) (median)
94.0 91.4 90.8 95.3 91.0 94.5 (0.410) (0.147) (0.869) (0.279) (0.686)
Industry-adjusted short-term liabilities in total liabilities (%) (median)
0.5 -2.1 -3.5 2.9 -3.5 0.7 (0.450) (0.088)* (0.801) (0.724) (0.657)
Observations 1,563 125 38 25 10 96
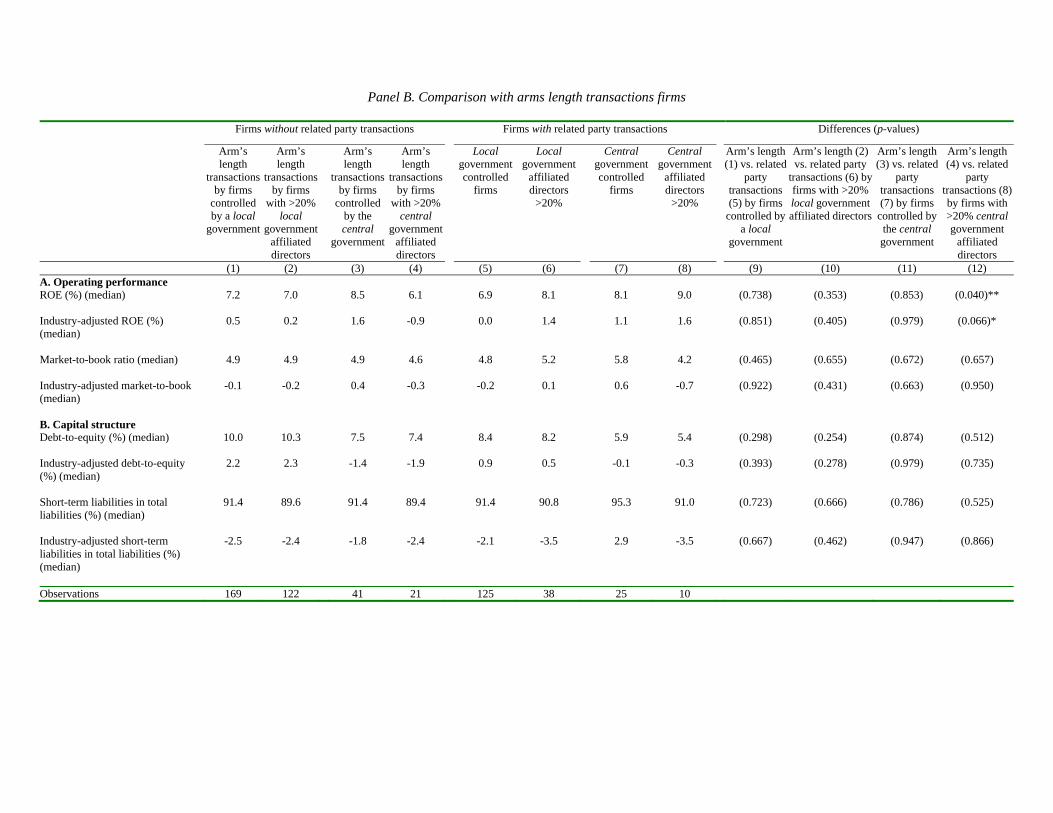
Panel B. Comparison with arms length transactions firms
Firms without related party transactions Firms with related party transactions Differences (p-values)
Arm’s length
transactions by firms
controlled by a local
government
Arm’s length
transactions by firms
with >20% local
government affiliated directors
Arm’s length
transactionsby firms
controlled by the central
government
Arm’s length
transactionsby firms
with >20% central
government affiliated directors
Local government controlled
firms
Local government
affiliated directors
>20%
Central government controlled
firms
Central government
affiliated directors
>20%
Arm’s length(1) vs. related
party transactions (5) by firms
controlled by a local
government
Arm’s length (2) vs. related party
transactions (6) by firms with >20% local government affiliated directors
Arm’s length (3) vs. related
party transactions (7) by firms
controlled by the central government
Arm’s length (4) vs. related
party transactions (8) by firms with >20% central government
affiliated directors
(1) (2) (3) (4) (5) (6) (7) (8) (9) (10) (11) (12) A. Operating performance ROE (%) (median)
7.2 7.0 8.5 6.1 6.9 8.1 8.1 9.0 (0.738) (0.353) (0.853) (0.040)**
Industry-adjusted ROE (%) (median)
0.5 0.2 1.6 -0.9 0.0 1.4 1.1 1.6 (0.851) (0.405) (0.979) (0.066)*
Market-to-book ratio (median)
4.9 4.9 4.9 4.6 4.8 5.2 5.8 4.2 (0.465) (0.655) (0.672) (0.657)
Industry-adjusted market-to-book (median)
-0.1 -0.2 0.4 -0.3 -0.2 0.1 0.6 -0.7 (0.922) (0.431) (0.663) (0.950)
B. Capital structure Debt-to-equity (%) (median)
10.0 10.3 7.5 7.4 8.4 8.2 5.9 5.4 (0.298) (0.254) (0.874) (0.512)
Industry-adjusted debt-to-equity (%) (median)
2.2 2.3 -1.4 -1.9 0.9 0.5 -0.1 -0.3 (0.393) (0.278) (0.979) (0.735)
Short-term liabilities in total liabilities (%) (median)
91.4 89.6 91.4 89.4 91.4 90.8 95.3 91.0 (0.723) (0.666) (0.786) (0.525)
Industry-adjusted short-term liabilities in total liabilities (%) (median)
-2.5 -2.4 -1.8 -2.4 -2.1 -3.5 2.9 -3.5 (0.667) (0.462) (0.947) (0.866)
Observations 169 122 41 21 125 38 25 10
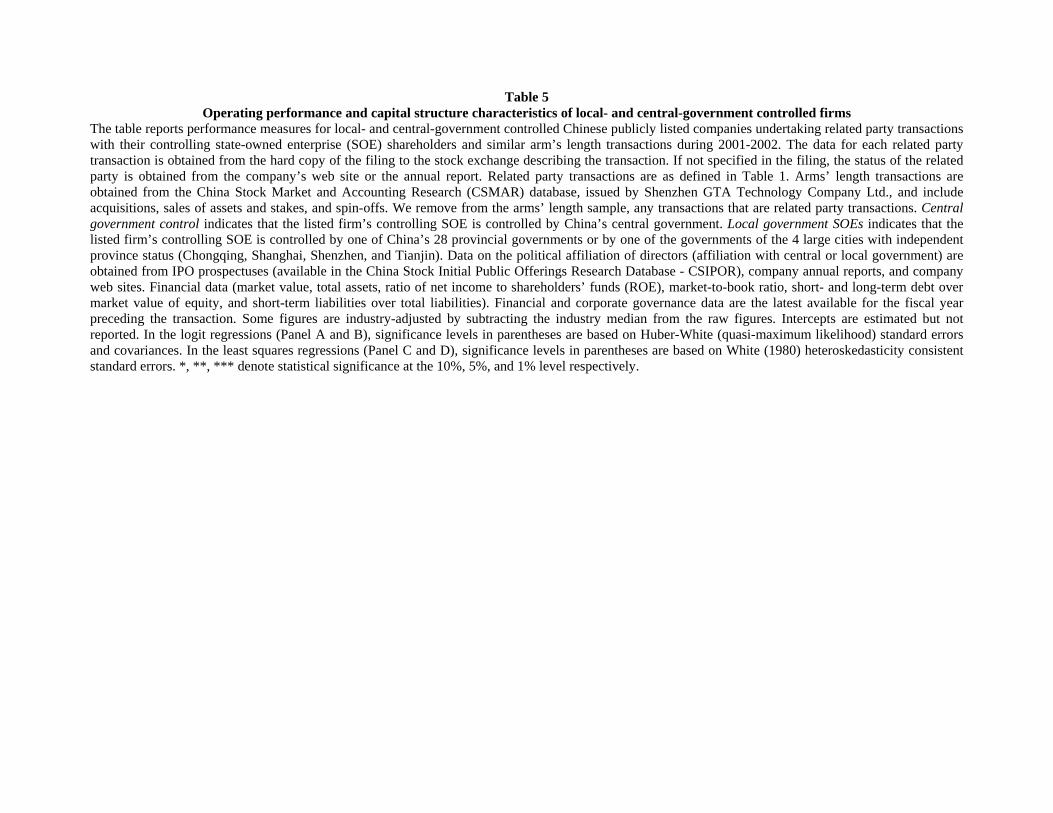
Table 5 Operating performance and capital structure characteristics of local- and central-government controlled firms
The table reports performance measures for local- and central-government controlled Chinese publicly listed companies undertaking related party transactions with their controlling state-owned enterprise (SOE) shareholders and similar arm’s length transactions during 2001-2002. The data for each related party transaction is obtained from the hard copy of the filing to the stock exchange describing the transaction. If not specified in the filing, the status of the related party is obtained from the company’s web site or the annual report. Related party transactions are as defined in Table 1. Arms’ length transactions are obtained from the China Stock Market and Accounting Research (CSMAR) database, issued by Shenzhen GTA Technology Company Ltd., and include acquisitions, sales of assets and stakes, and spin-offs. We remove from the arms’ length sample, any transactions that are related party transactions. Central government control indicates that the listed firm’s controlling SOE is controlled by China’s central government. Local government SOEs indicates that the listed firm’s controlling SOE is controlled by one of China’s 28 provincial governments or by one of the governments of the 4 large cities with independent province status (Chongqing, Shanghai, Shenzhen, and Tianjin). Data on the political affiliation of directors (affiliation with central or local government) are obtained from IPO prospectuses (available in the China Stock Initial Public Offerings Research Database - CSIPOR), company annual reports, and company web sites. Financial data (market value, total assets, ratio of net income to shareholders’ funds (ROE), market-to-book ratio, short- and long-term debt over market value of equity, and short-term liabilities over total liabilities). Financial and corporate governance data are the latest available for the fiscal year preceding the transaction. Some figures are industry-adjusted by subtracting the industry median from the raw figures. Intercepts are estimated but not reported. In the logit regressions (Panel A and B), significance levels in parentheses are based on Huber-White (quasi-maximum likelihood) standard errors and covariances. In the least squares regressions (Panel C and D), significance levels in parentheses are based on White (1980) heteroskedasticity consistent standard errors. *, **, *** denote statistical significance at the 10%, 5%, and 1% level respectively.
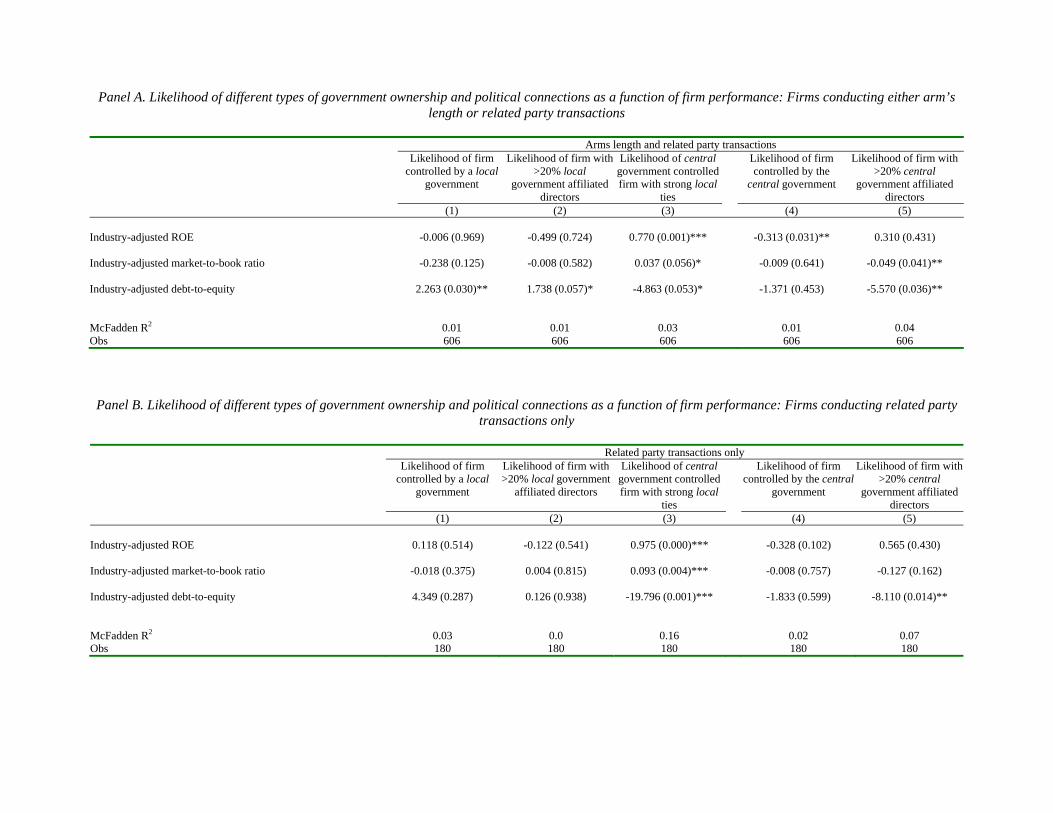
Panel A. Likelihood of different types of government ownership and political connections as a function of firm performance: Firms conducting either arm’s length or related party transactions
Arms length and related party transactions Likelihood of firm
controlled by a local government
Likelihood of firm with >20% local
government affiliated directors
Likelihood of central government controlled firm with strong local
ties
Likelihood of firm controlled by the
central government
Likelihood of firm with >20% central
government affiliated directors
(1) (2) (3) (4) (5) Industry-adjusted ROE
-0.006 (0.969) -0.499 (0.724) 0.770 (0.001)*** -0.313 (0.031)** 0.310 (0.431)
Industry-adjusted market-to-book ratio
-0.238 (0.125) -0.008 (0.582) 0.037 (0.056)* -0.009 (0.641) -0.049 (0.041)**
Industry-adjusted debt-to-equity
2.263 (0.030)** 1.738 (0.057)* -4.863 (0.053)* -1.371 (0.453) -5.570 (0.036)**
McFadden R2 0.01 0.01 0.03 0.01 0.04 Obs 606 606 606 606 606
Panel B. Likelihood of different types of government ownership and political connections as a function of firm performance: Firms conducting related party
transactions only
Related party transactions only Likelihood of firm
controlled by a local government
Likelihood of firm with >20% local government
affiliated directors
Likelihood of central government controlled firm with strong local
ties
Likelihood of firm controlled by the central
government
Likelihood of firm with >20% central
government affiliated directors
(1) (2) (3) (4) (5) Industry-adjusted ROE
0.118 (0.514) -0.122 (0.541) 0.975 (0.000)*** -0.328 (0.102) 0.565 (0.430)
Industry-adjusted market-to-book ratio
-0.018 (0.375) 0.004 (0.815) 0.093 (0.004)*** -0.008 (0.757) -0.127 (0.162)
Industry-adjusted debt-to-equity
4.349 (0.287) 0.126 (0.938) -19.796 (0.001)*** -1.833 (0.599) -8.110 (0.014)**
McFadden R2 0.03 0.0 0.16 0.02 0.07Obs 180 180 180 180 180
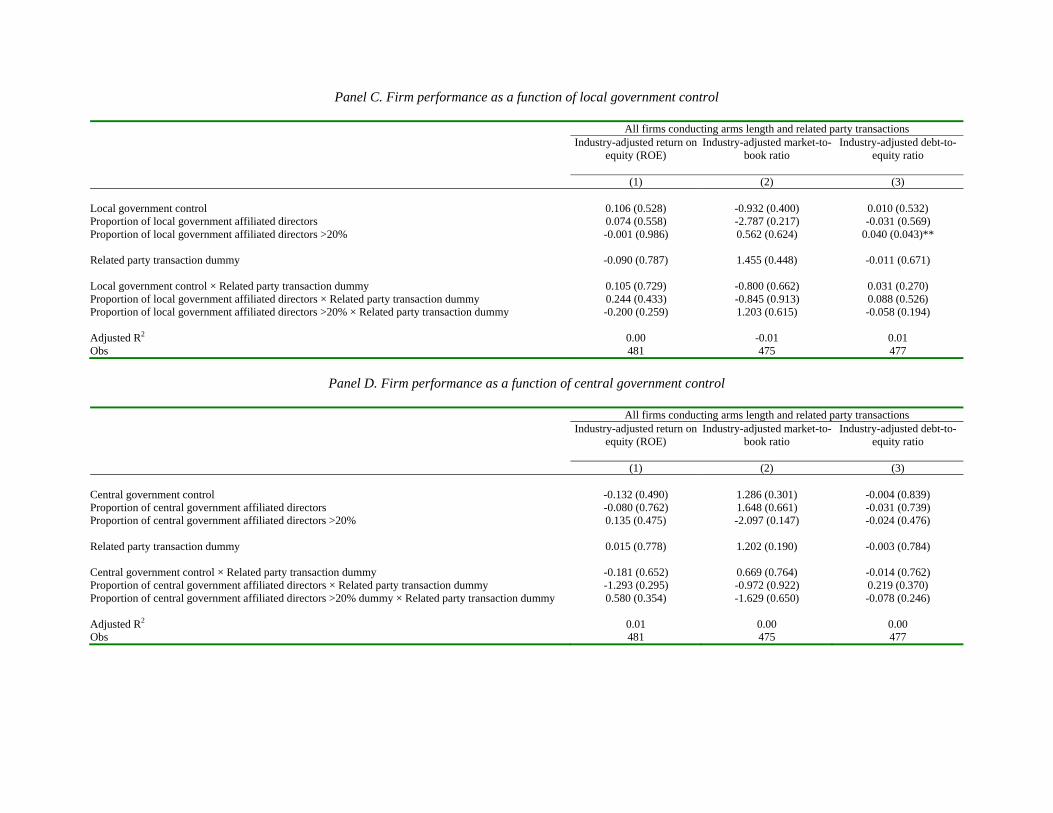
Panel C. Firm performance as a function of local government control
All firms conducting arms length and related party transactions Industry-adjusted return on
equity (ROE)
Industry-adjusted market-to-book ratio
Industry-adjusted debt-to-equity ratio
(1) (2) (3) Local government control 0.106 (0.528) -0.932 (0.400) 0.010 (0.532) Proportion of local government affiliated directors 0.074 (0.558) -2.787 (0.217) -0.031 (0.569) Proportion of local government affiliated directors >20% -0.001 (0.986) 0.562 (0.624) 0.040 (0.043)** Related party transaction dummy -0.090 (0.787) 1.455 (0.448) -0.011 (0.671) Local government control × Related party transaction dummy 0.105 (0.729) -0.800 (0.662) 0.031 (0.270) Proportion of local government affiliated directors × Related party transaction dummy 0.244 (0.433) -0.845 (0.913) 0.088 (0.526) Proportion of local government affiliated directors >20% × Related party transaction dummy -0.200 (0.259) 1.203 (0.615) -0.058 (0.194) Adjusted R2 0.00 -0.01 0.01 Obs 481 475 477
Panel D. Firm performance as a function of central government control
All firms conducting arms length and related party transactions Industry-adjusted return on
equity (ROE)
Industry-adjusted market-to-book ratio
Industry-adjusted debt-to-equity ratio
(1) (2) (3) Central government control -0.132 (0.490) 1.286 (0.301) -0.004 (0.839) Proportion of central government affiliated directors -0.080 (0.762) 1.648 (0.661) -0.031 (0.739) Proportion of central government affiliated directors >20% 0.135 (0.475) -2.097 (0.147) -0.024 (0.476) Related party transaction dummy 0.015 (0.778) 1.202 (0.190) -0.003 (0.784) Central government control × Related party transaction dummy -0.181 (0.652) 0.669 (0.764) -0.014 (0.762) Proportion of central government affiliated directors × Related party transaction dummy -1.293 (0.295) -0.972 (0.922) 0.219 (0.370) Proportion of central government affiliated directors >20% dummy × Related party transaction dummy 0.580 (0.354) -1.629 (0.650) -0.078 (0.246) Adjusted R2 0.01 0.00 0.00Obs 481 475 477
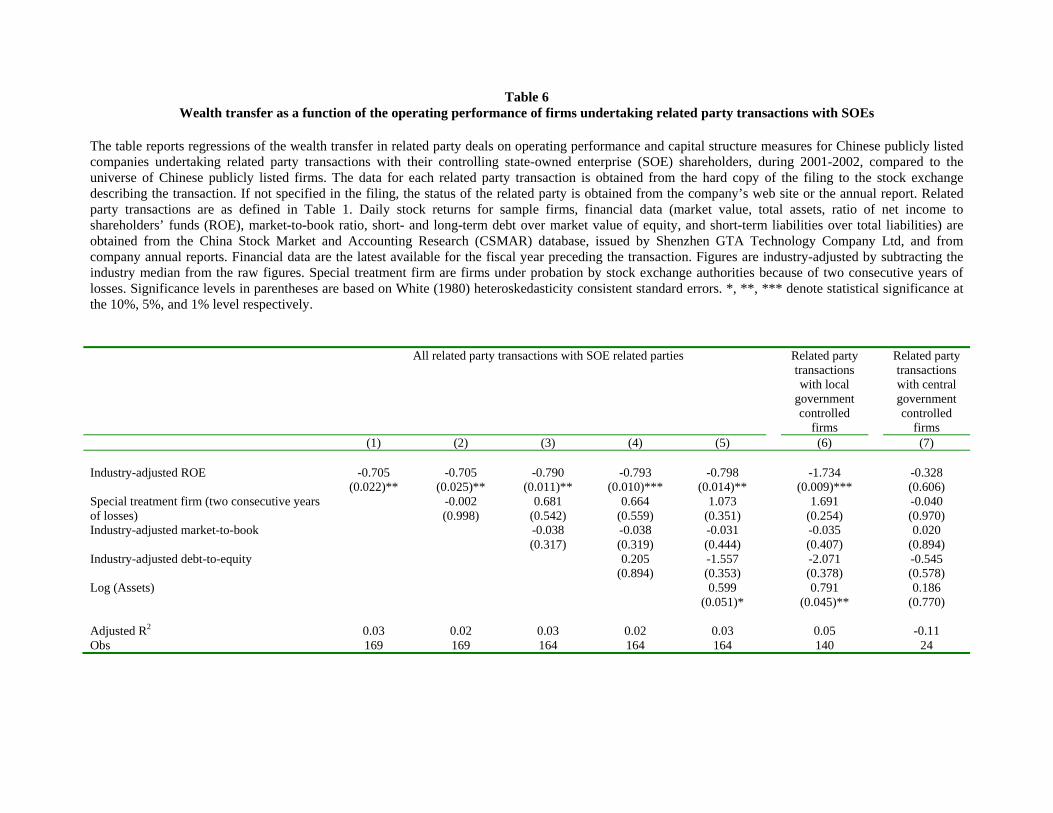
Table 6 Wealth transfer as a function of the operating performance of firms undertaking related party transactions with SOEs
The table reports regressions of the wealth transfer in related party deals on operating performance and capital structure measures for Chinese publicly listed companies undertaking related party transactions with their controlling state-owned enterprise (SOE) shareholders, during 2001-2002, compared to the universe of Chinese publicly listed firms. The data for each related party transaction is obtained from the hard copy of the filing to the stock exchange describing the transaction. If not specified in the filing, the status of the related party is obtained from the company’s web site or the annual report. Related party transactions are as defined in Table 1. Daily stock returns for sample firms, financial data (market value, total assets, ratio of net income to shareholders’ funds (ROE), market-to-book ratio, short- and long-term debt over market value of equity, and short-term liabilities over total liabilities) are obtained from the China Stock Market and Accounting Research (CSMAR) database, issued by Shenzhen GTA Technology Company Ltd, and from company annual reports. Financial data are the latest available for the fiscal year preceding the transaction. Figures are industry-adjusted by subtracting the industry median from the raw figures. Special treatment firm are firms under probation by stock exchange authorities because of two consecutive years of losses. Significance levels in parentheses are based on White (1980) heteroskedasticity consistent standard errors. *, **, *** denote statistical significance at the 10%, 5%, and 1% level respectively. All related party transactions with SOE related parties Related party
transactions with local
government controlled
firms
Related party transactions with central government controlled
firms (1) (2) (3) (4) (5) (6) (7) Industry-adjusted ROE
-0.705 (0.022)**
-0.705 (0.025)**
-0.790 (0.011)**
-0.793 (0.010)***
-0.798 (0.014)**
-1.734 (0.009)***
-0.328 (0.606)
Special treatment firm (two consecutive years of losses)
-0.002 (0.998)
0.681 (0.542)
0.664 (0.559)
1.073 (0.351)
1.691 (0.254)
-0.040 (0.970)
Industry-adjusted market-to-book -0.038 (0.317)
-0.038 (0.319)
-0.031 (0.444)
-0.035 (0.407)
0.020 (0.894)
Industry-adjusted debt-to-equity 0.205 (0.894)
-1.557 (0.353)
-2.071 (0.378)
-0.545 (0.578)
Log (Assets)
0.599 (0.051)*
0.791 (0.045)**
0.186 (0.770)
Adjusted R2 0.03 0.02 0.03 0.02 0.03 0.05 -0.11 Obs 169 169 164 164 164 140 24
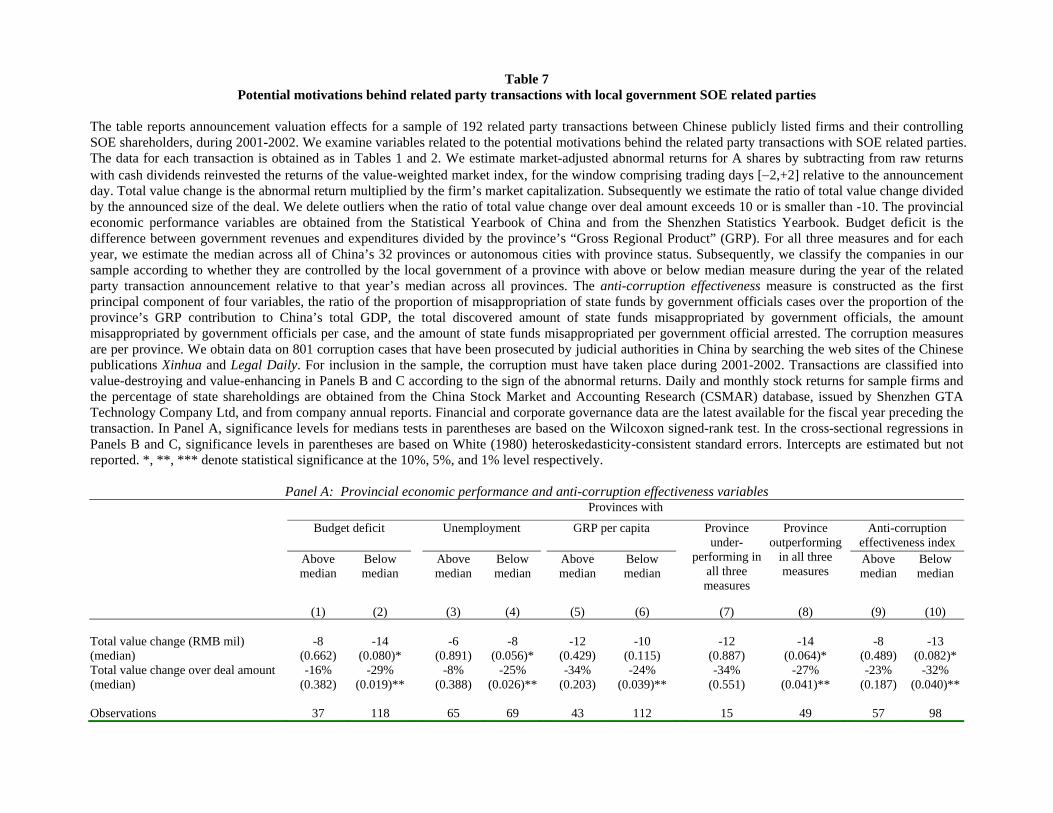
Table 7 Potential motivations behind related party transactions with local government SOE related parties
The table reports announcement valuation effects for a sample of 192 related party transactions between Chinese publicly listed firms and their controlling SOE shareholders, during 2001-2002. We examine variables related to the potential motivations behind the related party transactions with SOE related parties. The data for each transaction is obtained as in Tables 1 and 2. We estimate market-adjusted abnormal returns for A shares by subtracting from raw returns with cash dividends reinvested the returns of the value-weighted market index, for the window comprising trading days [−2,+2] relative to the announcement day. Total value change is the abnormal return multiplied by the firm’s market capitalization. Subsequently we estimate the ratio of total value change divided by the announced size of the deal. We delete outliers when the ratio of total value change over deal amount exceeds 10 or is smaller than -10. The provincial economic performance variables are obtained from the Statistical Yearbook of China and from the Shenzhen Statistics Yearbook. Budget deficit is the difference between government revenues and expenditures divided by the province’s “Gross Regional Product” (GRP). For all three measures and for each year, we estimate the median across all of China’s 32 provinces or autonomous cities with province status. Subsequently, we classify the companies in our sample according to whether they are controlled by the local government of a province with above or below median measure during the year of the related party transaction announcement relative to that year’s median across all provinces. The anti-corruption effectiveness measure is constructed as the first principal component of four variables, the ratio of the proportion of misappropriation of state funds by government officials cases over the proportion of the province’s GRP contribution to China’s total GDP, the total discovered amount of state funds misappropriated by government officials, the amount misappropriated by government officials per case, and the amount of state funds misappropriated per government official arrested. The corruption measures are per province. We obtain data on 801 corruption cases that have been prosecuted by judicial authorities in China by searching the web sites of the Chinese publications Xinhua and Legal Daily. For inclusion in the sample, the corruption must have taken place during 2001-2002. Transactions are classified into value-destroying and value-enhancing in Panels B and C according to the sign of the abnormal returns. Daily and monthly stock returns for sample firms and the percentage of state shareholdings are obtained from the China Stock Market and Accounting Research (CSMAR) database, issued by Shenzhen GTA Technology Company Ltd, and from company annual reports. Financial and corporate governance data are the latest available for the fiscal year preceding the transaction. In Panel A, significance levels for medians tests in parentheses are based on the Wilcoxon signed-rank test. In the cross-sectional regressions in Panels B and C, significance levels in parentheses are based on White (1980) heteroskedasticity-consistent standard errors. Intercepts are estimated but not reported. *, **, *** denote statistical significance at the 10%, 5%, and 1% level respectively.
Panel A: Provincial economic performance and anti-corruption effectiveness variables Provinces with
Budget deficit Unemployment GRP per capita Province under-
performing in all three measures
Province outperforming
in all three measures
Anti-corruption effectiveness index
Above median
Below median
Above median
Below median
Above median
Below median
Above median
Below median
(1) (2) (3) (4) (5) (6) (7) (8) (9) (10) Total value change (RMB mil) (median)
-8 (0.662)
-14 (0.080)*
-6 (0.891)
-8 (0.056)*
-12 (0.429)
-10 (0.115)
-12 (0.887)
-14 (0.064)*
-8 (0.489)
-13 (0.082)*
Total value change over deal amount (median)
-16% (0.382)
-29% (0.019)**
-8% (0.388)
-25% (0.026)**
-34% (0.203)
-24% (0.039)**
-34% (0.551)
-27% (0.041)**
-23% (0.187)
-32% (0.040)**
Observations 37 118 65 69 43 112 15 49 57 98
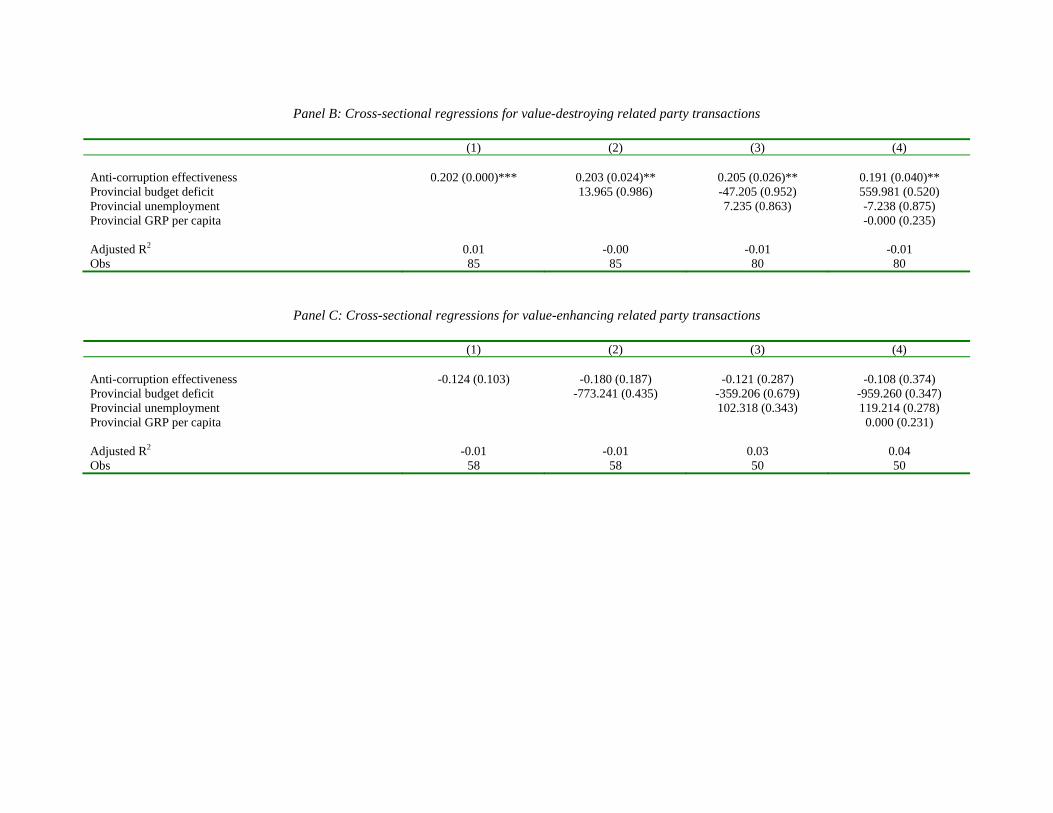
Panel B: Cross-sectional regressions for value-destroying related party transactions (1) (2) (3) (4) Anti-corruption effectiveness 0.202 (0.000)*** 0.203 (0.024)** 0.205 (0.026)** 0.191 (0.040)** Provincial budget deficit 13.965 (0.986) -47.205 (0.952) 559.981 (0.520) Provincial unemployment 7.235 (0.863) -7.238 (0.875) Provincial GRP per capita -0.000 (0.235) Adjusted R2 0.01 -0.00 -0.01 -0.01Obs 85 85 80 80
Panel C: Cross-sectional regressions for value-enhancing related party transactions (1) (2) (3) (4) Anti-corruption effectiveness -0.124 (0.103) -0.180 (0.187) -0.121 (0.287) -0.108 (0.374) Provincial budget deficit -773.241 (0.435) -359.206 (0.679) -959.260 (0.347) Provincial unemployment 102.318 (0.343) 119.214 (0.278) Provincial GRP per capita 0.000 (0.231) Adjusted R2 -0.01 -0.01 0.03 0.04 Obs 58 58 50 50