Embed Size (px)
Citation preview

Profiling the Harris County electorate and change in the nation’s third largest political jurisdiction
WHO VOTES, WHY AND DOES IT REALLY MATTER?
The HECTOR DELEON PERSPECTIVE Placing context to the American Latino Experience, from culture to politics
CONTACT: Email: [email protected]
Twitter: @hdl_perspective Facebook: hector de leon perspective
Website: www.hectordeleon.com

About the Charts and Tables
The charts and tables in this presentation are based on demographic data provided by the US Census Bureau via the decennial census and American Community Surveys, and official and unofficial Harris County voter registration and voting records. All the information used to create the charts and tables are public records. Any inaccuracy in the statistics presented is an error of the author and not of the Census or the Harris County Voter Registrar or the Election Office.
Questions about the report can be addressed to [email protected]
2
WHO IS VOTING AND WHY? GENDER, AGE, INCOME, AND RACE AND ETHNICITY
3

4
52.7%
58.0% 54.5% 54.2%
44.1%
38.9% 41.9% 41.8%
3.2% 3.1% 3.6% 4.1%
White Rep SRDs Black Rep SRDs Hispanic Rep SRDs Asian Rep SRDs
2012 November Election: Ratio of Female to Male Voters in Harris County State Representative Districts
Female Male Gen Undetermined
5
54% 50% 50%
53% 54%
62% 60%
64% 63% 64% 66% 65%
71% 70% 71% 71% 70% 72% 73%
81%
38% 40% 41%
44% 44%
48% 48% 50% 51% 52% 52% 53%
62% 60%
58% 58% 60%
68% 68%
64%
0-2
4K
25-2
9K
30-3
4K
35-3
9K
40-4
4K
45-4
9K
50-5
4K
55-5
9K
60-6
4K
65-6
9K
70-7
4K
75K-7
9K
80-8
4K
85-8
9K
90-9
4K
95-9
9K
100-1
24K
125-1
49K
150-1
59K
250K
Household Income
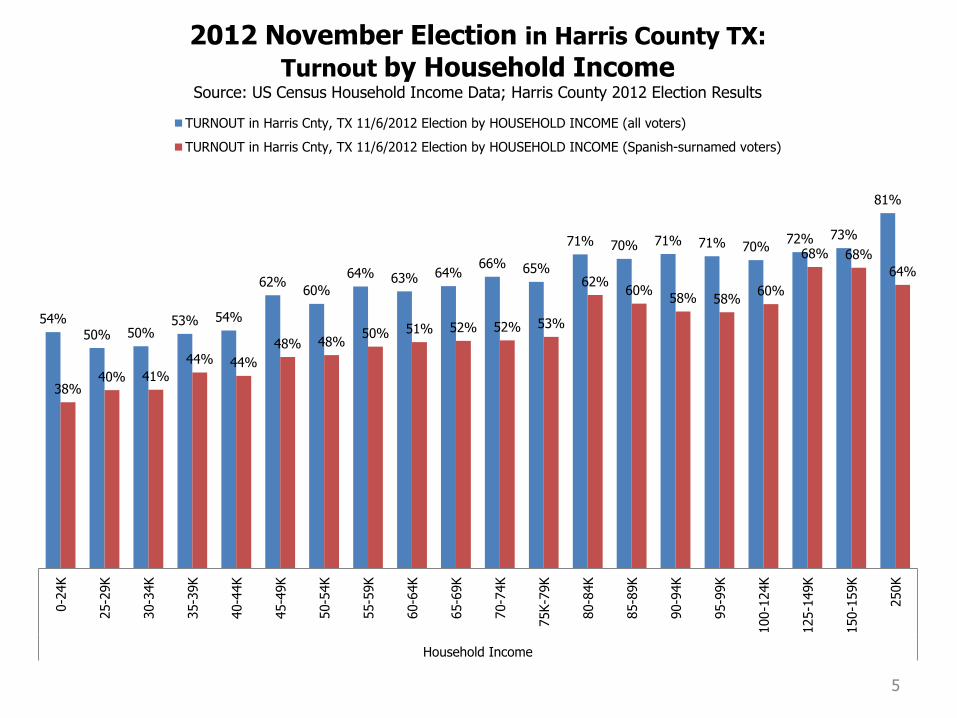
2012 November Election in Harris County TX:
Turnout by Household Income Source: US Census Household Income Data; Harris County 2012 Election Results
TURNOUT in Harris Cnty, TX 11/6/2012 Election by HOUSEHOLD INCOME (all voters)
TURNOUT in Harris Cnty, TX 11/6/2012 Election by HOUSEHOLD INCOME (Spanish-surnamed voters)

6
54%
50%
54%
59%
64% 67%
70%
73% 75%
78% 79% 76%
71%
62%
50%
30% 27%
65%
44%
35%
39%
44%
49% 51%
54% 57%
60% 63% 63%
59%
54%
44%
33%
16% 18%
48%
18-24 25-29 30-34 35-39 40-44 45-49 50-54 55-59 60-64 65-69 70-74 75-79 80-84 85-89 90-94 95+ DOB
n/a
Overall
2012 November Election in Harris County, TX - Turnout by Age Group
Turnout for non-Spanish-surnamed Voters Spanish-Surnamed Voter Turnout
1.5%
5.8% 5.2%
11.8%
9.7%
6.7%
7.9%
3.4%
8.8% 8.6%
4.3%
1.5%
2.3%
8.1%
0.6%
7.8%
3.6%
1.7% 0.9%
1.3%
4.7% 4.3%
10.2% 8.5%
6.8% 7.7%
3.5%
9.0% 8.9%
4.6%
1.6% 2.7%
9.3%
0.7%
9.0%
4.2%
2.0% 1.1%
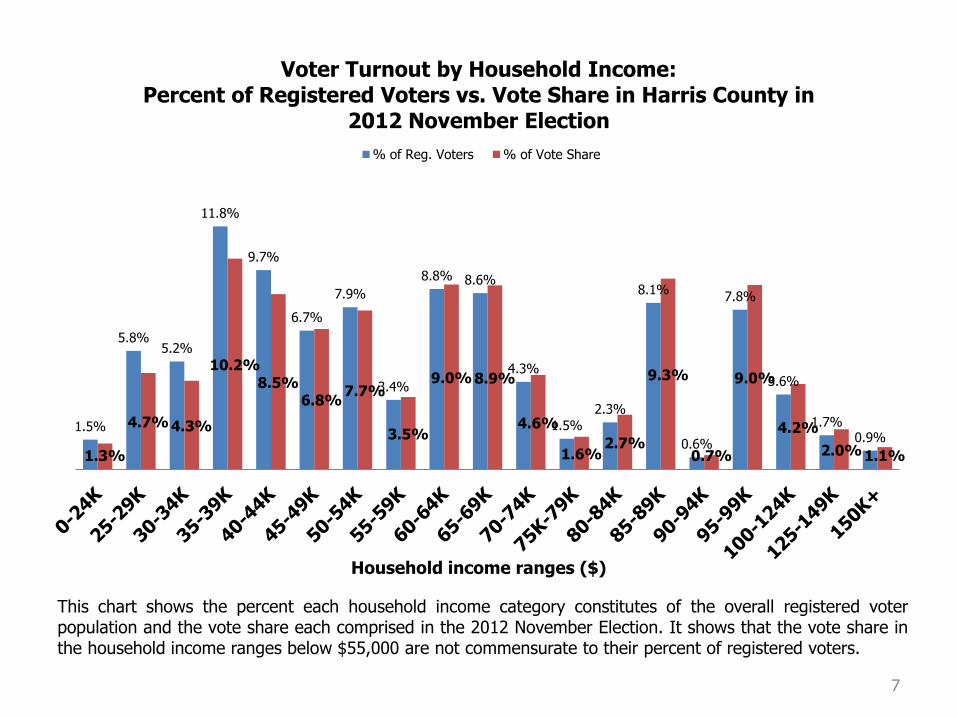
Voter Turnout by Household Income: Percent of Registered Voters vs. Vote Share in Harris County in
2012 November Election
% of Reg. Voters % of Vote Share
This chart shows the percent each household income category constitutes of the overall registered voter population and the vote share each comprised in the 2012 November Election. It shows that the vote share in the household income ranges below $55,000 are not commensurate to their percent of registered voters.
7
Household income ranges ($)

53.9% 52.5%
55.0%
59.7% 61.6%
65.3%
68.5%
71.2% 73.4% 74.4%
64.8%
60.1% 59.6%
57.0% 56.9%
57.7%
61.0% 60.8% 58.6%
60.6%
71.6%
68.5%
63.6% 60.1%
56.9%
54.0%
52.1%
45.1% 43.5% 43.2%
VAP 0-9% VAP 10-19%
VAP 20-29%
VAP 30-39%
VAP 40-49%
VAP 50-59%
VAP 60-69%
VAP 70-79%
VAP 80-89%
VAP 90%+
Voter Turnout by Race and Ethnicity: 2012 November Election
White VAP Prcts Turnout Black VAP Prcts Turnout Hispanic VAP Prcts Turnout
8
This chart shows turnout by Voting Age Population (VAP) of voting precincts in the 2012 November Election. It shows the relationship between demographics of a precinct and the turnout of each voting group.
9
12%
18% 16% 16%
26% 27%
25% 24%
22%
19% 18%
20% 21%
19% 20%
21%
19% 18%
20%
18%
0% 1% 0% 0%
White Rep SRDs Black Rep SRDs Hispanic Rep SRDs Asian Rep SRDs
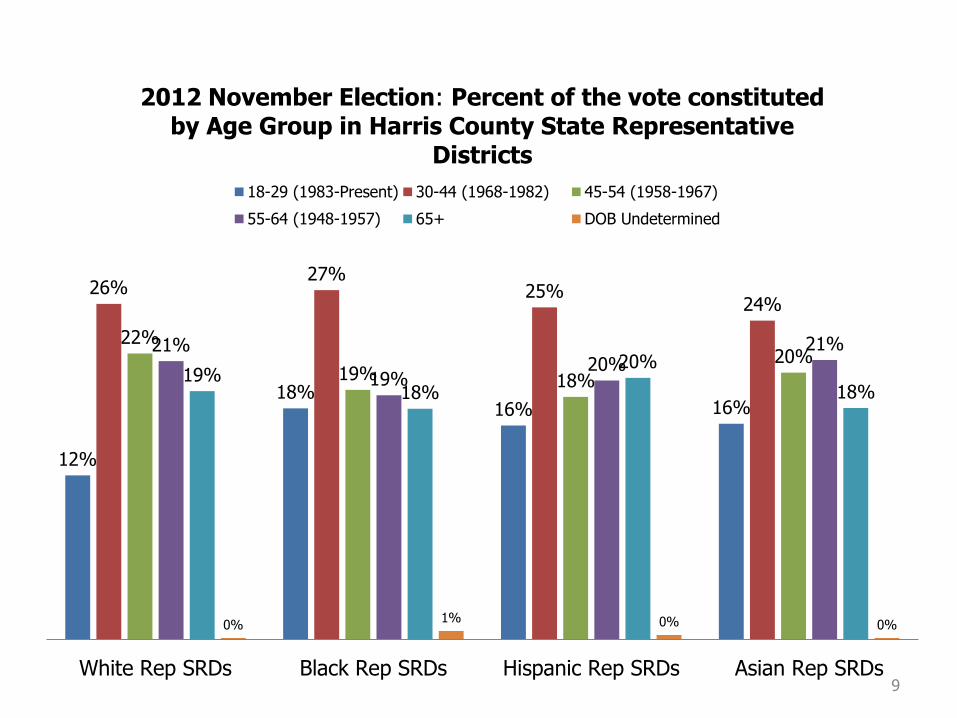
2012 November Election: Percent of the vote constituted by Age Group in Harris County State Representative
Districts
18-29 (1983-Present) 30-44 (1968-1982) 45-54 (1958-1967)
55-64 (1948-1957) 65+ DOB Undetermined
10
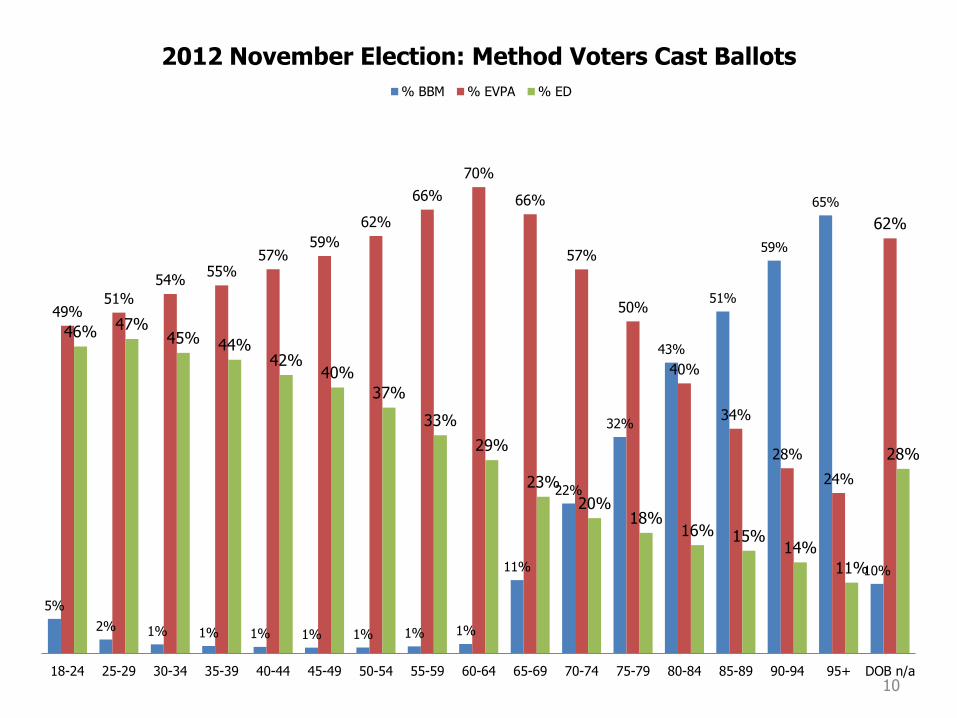
5%
2% 1% 1% 1% 1% 1% 1% 1%
11%
22%
32%
43%
51%
59%
65%
10%
49% 51%
54% 55%
57% 59%
62%
66%
70%
66%
57%
50%
40%
34%
28%
24%
62%
46% 47% 45% 44%
42% 40%
37%
33%
29%
23%
20% 18%
16% 15% 14%
11%
28%
18-24 25-29 30-34 35-39 40-44 45-49 50-54 55-59 60-64 65-69 70-74 75-79 80-84 85-89 90-94 95+ DOB n/a
2012 November Election: Method Voters Cast Ballots
% BBM % EVPA % ED
11
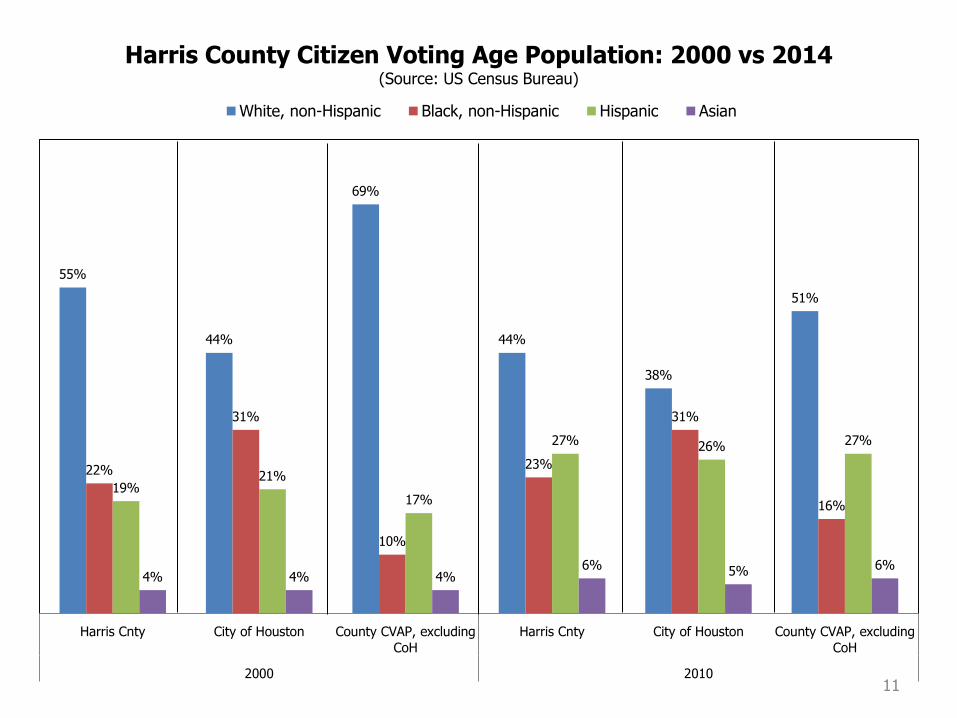
55%
44%
69%
44%
38%
51%
22%
31%
10%
23%
31%
16%
19% 21%
17%
27% 26% 27%
4% 4% 4% 6% 5% 6%
Harris Cnty City of Houston County CVAP, excluding
CoH
Harris Cnty City of Houston County CVAP, excluding
CoH
2000 2010
Harris County Citizen Voting Age Population: 2000 vs 2014 (Source: US Census Bureau)
White, non-Hispanic Black, non-Hispanic Hispanic Asian
12
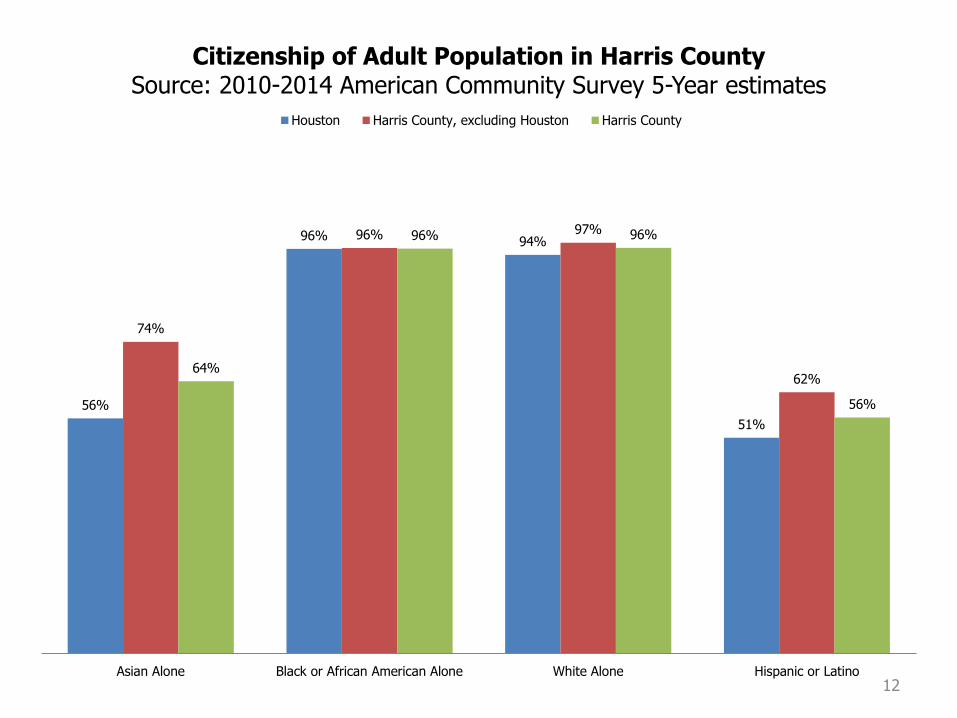
56%
96% 94%
51%
74%
96% 97%
62% 64%
96% 96%
56%
Asian Alone Black or African American Alone White Alone Hispanic or Latino
Citizenship of Adult Population in Harris County Source: 2010-2014 American Community Survey 5-Year estimates
Houston Harris County, excluding Houston Harris County
13
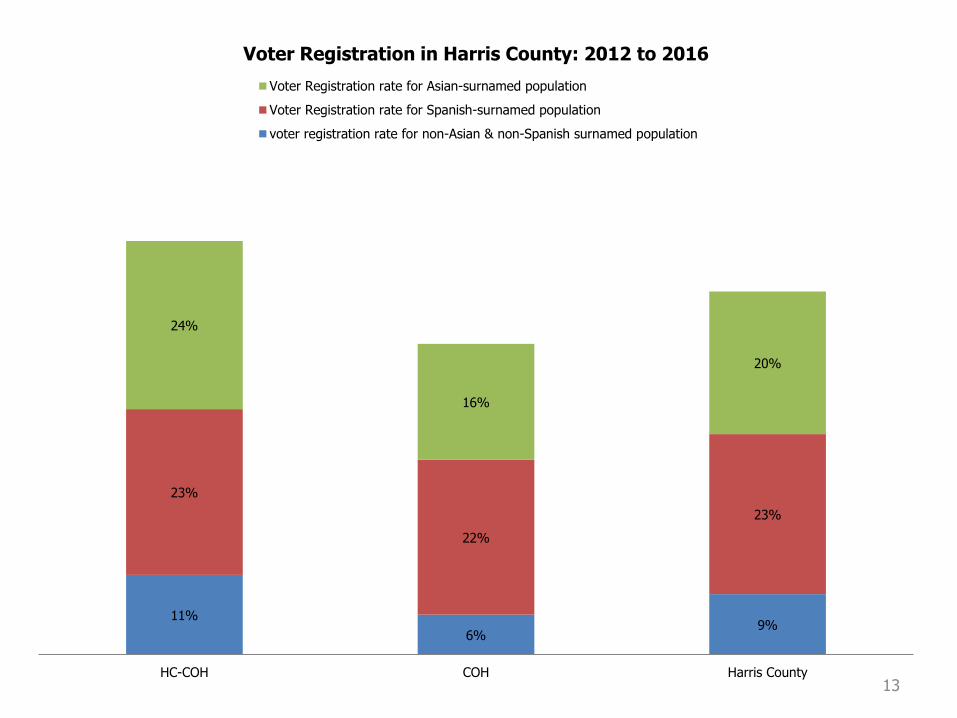
11%
6% 9%
23%
22%
23%
24%
16%
20%
HC-COH COH Harris County
Voter Registration in Harris County: 2012 to 2016
Voter Registration rate for Asian-surnamed population
Voter Registration rate for Spanish-surnamed population
voter registration rate for non-Asian & non-Spanish surnamed population
14
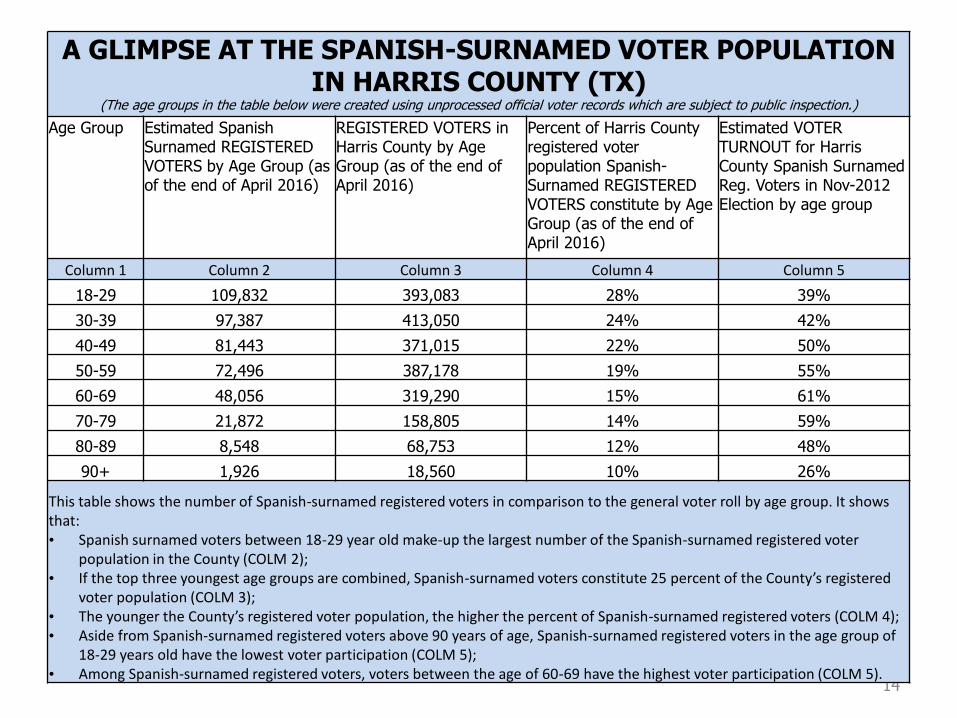
A GLIMPSE AT THE SPANISH-SURNAMED VOTER POPULATION IN HARRIS COUNTY (TX)
(The age groups in the table below were created using unprocessed official voter records which are subject to public inspection.)
Age Group Estimated Spanish Surnamed REGISTERED VOTERS by Age Group (as of the end of April 2016)
REGISTERED VOTERS in Harris County by Age Group (as of the end of April 2016)
Percent of Harris County registered voter population Spanish-Surnamed REGISTERED VOTERS constitute by Age Group (as of the end of April 2016)
Estimated VOTER TURNOUT for Harris County Spanish Surnamed Reg. Voters in Nov-2012 Election by age group
Column 1 Column 2 Column 3 Column 4 Column 5
18-29 109,832 393,083 28% 39%
30-39 97,387 413,050 24% 42%
40-49 81,443 371,015 22% 50%
50-59 72,496 387,178 19% 55%
60-69 48,056 319,290 15% 61%
70-79 21,872 158,805 14% 59%
80-89 8,548 68,753 12% 48%
90+ 1,926 18,560 10% 26%
This table shows the number of Spanish-surnamed registered voters in comparison to the general voter roll by age group. It shows that: • Spanish surnamed voters between 18-29 year old make-up the largest number of the Spanish-surnamed registered voter
population in the County (COLM 2); • If the top three youngest age groups are combined, Spanish-surnamed voters constitute 25 percent of the County’s registered
voter population (COLM 3); • The younger the County’s registered voter population, the higher the percent of Spanish-surnamed registered voters (COLM 4); • Aside from Spanish-surnamed registered voters above 90 years of age, Spanish-surnamed registered voters in the age group of
18-29 years old have the lowest voter participation (COLM 5); • Among Spanish-surnamed registered voters, voters between the age of 60-69 have the highest voter participation (COLM 5).
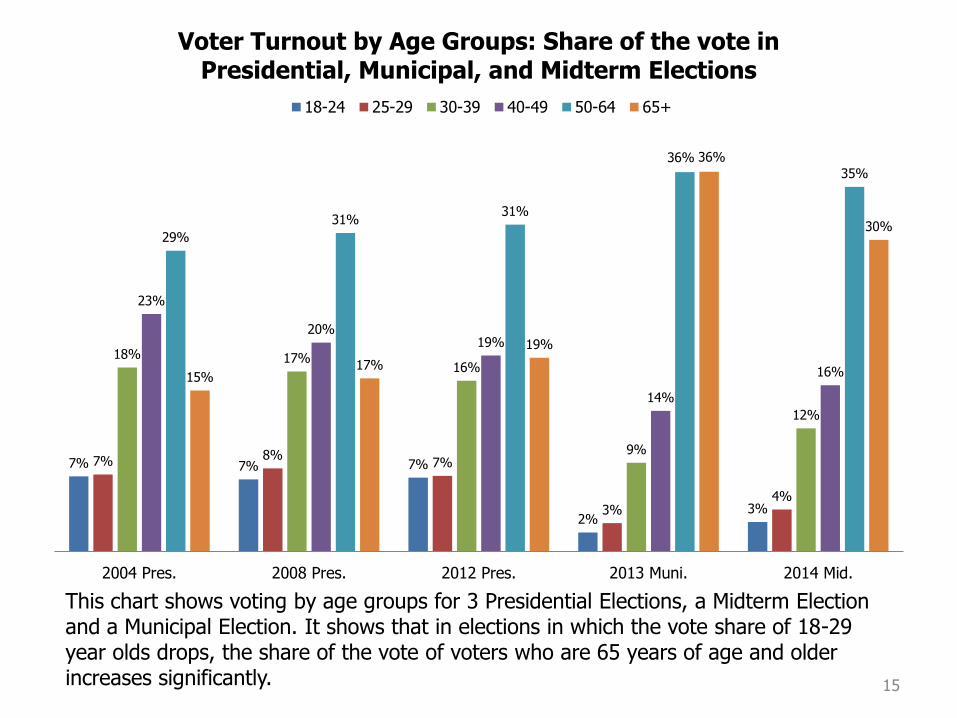
This chart shows voting by age groups for 3 Presidential Elections, a Midterm Election and a Municipal Election. It shows that in elections in which the vote share of 18-29 year olds drops, the share of the vote of voters who are 65 years of age and older increases significantly. 15
7% 7% 7%
2% 3%
7% 8% 7%
3% 4%
18% 17% 16%
9%
12%
23%
20% 19%
14%
16%
29%
31% 31%
36% 35%
15% 17%
19%
36%
30%
2004 Pres. 2008 Pres. 2012 Pres. 2013 Muni. 2014 Mid.
Voter Turnout by Age Groups: Share of the vote in Presidential, Municipal, and Midterm Elections
18-24 25-29 30-39 40-49 50-64 65+

16
7.2% 7.5% 8.4% 9.3% 10.6% 12.2% 11.6%
10.0% 7.2% 4.9%
3.9% 3.2% 2.1%
0.9% 0.3% 0.1%
0.4%
7.1% 7.3% 8.2% 8.2% 9.2% 9.6% 11.0%
11.0% 9.4% 7.1%
4.7% 3.1% 2.1%
1.2% 0.4% 0.1%
0.3%
2004 vs 2012 November Election in Harris County TX: Percent of the vote constituted by Age Group
2004 2012

17
Turnout in Harris County, TX Elections by Percent of Voting Age Population in Voting Precincts
(Source: Harris County Election Results and US Census precinct-by-precinct demographics)
2004 2012 Percent of Voting Age Population in Voting Precincts
White Black Hispanic White Black Hispanic
90%+ 72% 50% 39% 74% 61% 43%
80 to 89% 70% 50% 42% 73% 59% 44%
70 to 79% 65% 52% 40% 71% 61% 45%
60 to 69% 60% 53% 41% 69% 61% 52%
50 to 59% 58% 51% 45% 65% 58% 54%
40 to 49% 54% 50% 49% 62% 57% 57%
30 to 39% 51% 50% 51% 60% 57% 60%
20 to 9% 47% 52% 56% 55% 60% 64%
10 to 19% 46% 54% 61% 52% 60% 68%
0 to 9% 48% 62% 67% 54% 65% 72%
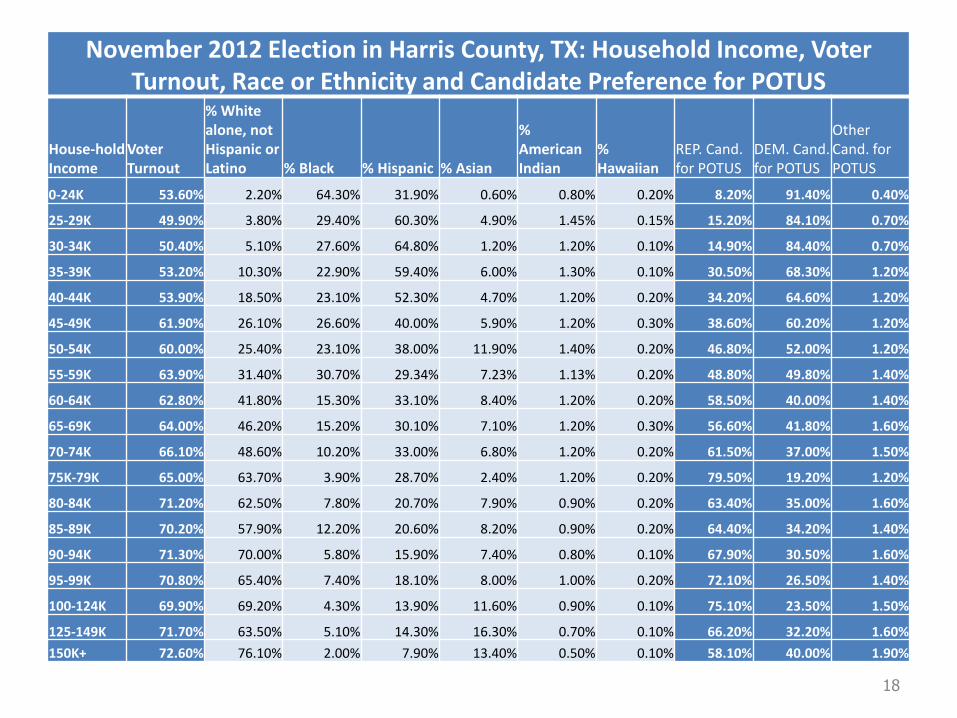
November 2012 Election in Harris County, TX: Household Income, Voter Turnout, Race or Ethnicity and Candidate Preference for POTUS
House-hold Income
Voter Turnout
% White alone, not Hispanic or Latino % Black % Hispanic % Asian
% American Indian
% Hawaiian
REP. Cand. for POTUS
DEM. Cand. for POTUS
Other Cand. for POTUS
0-24K 53.60% 2.20% 64.30% 31.90% 0.60% 0.80% 0.20% 8.20% 91.40% 0.40%
25-29K 49.90% 3.80% 29.40% 60.30% 4.90% 1.45% 0.15% 15.20% 84.10% 0.70%
30-34K 50.40% 5.10% 27.60% 64.80% 1.20% 1.20% 0.10% 14.90% 84.40% 0.70%
35-39K 53.20% 10.30% 22.90% 59.40% 6.00% 1.30% 0.10% 30.50% 68.30% 1.20%
40-44K 53.90% 18.50% 23.10% 52.30% 4.70% 1.20% 0.20% 34.20% 64.60% 1.20%
45-49K 61.90% 26.10% 26.60% 40.00% 5.90% 1.20% 0.30% 38.60% 60.20% 1.20%
50-54K 60.00% 25.40% 23.10% 38.00% 11.90% 1.40% 0.20% 46.80% 52.00% 1.20%
55-59K 63.90% 31.40% 30.70% 29.34% 7.23% 1.13% 0.20% 48.80% 49.80% 1.40%
60-64K 62.80% 41.80% 15.30% 33.10% 8.40% 1.20% 0.20% 58.50% 40.00% 1.40%
65-69K 64.00% 46.20% 15.20% 30.10% 7.10% 1.20% 0.30% 56.60% 41.80% 1.60%
70-74K 66.10% 48.60% 10.20% 33.00% 6.80% 1.20% 0.20% 61.50% 37.00% 1.50%
75K-79K 65.00% 63.70% 3.90% 28.70% 2.40% 1.20% 0.20% 79.50% 19.20% 1.20%
80-84K 71.20% 62.50% 7.80% 20.70% 7.90% 0.90% 0.20% 63.40% 35.00% 1.60%
85-89K 70.20% 57.90% 12.20% 20.60% 8.20% 0.90% 0.20% 64.40% 34.20% 1.40%
90-94K 71.30% 70.00% 5.80% 15.90% 7.40% 0.80% 0.10% 67.90% 30.50% 1.60%
95-99K 70.80% 65.40% 7.40% 18.10% 8.00% 1.00% 0.20% 72.10% 26.50% 1.40%
100-124K 69.90% 69.20% 4.30% 13.90% 11.60% 0.90% 0.10% 75.10% 23.50% 1.50%
125-149K 71.70% 63.50% 5.10% 14.30% 16.30% 0.70% 0.10% 66.20% 32.20% 1.60%
150K+ 72.60% 76.10% 2.00% 7.90% 13.40% 0.50% 0.10% 58.10% 40.00% 1.90%
18

19
93.0%
87.2% 87.8%
71.1%
67.3%
61.7%
53.4% 49.6%
38.6% 39.4%
34.2%
16.9%
29.4% 31.2% 26.1%
22.2% 19.2%
26.6% 32.0%
6.6%
12.3% 11.7%
28.2% 31.9%
37.6% 45.9%
49.6%
60.5% 59.7%
64.9%
82.4%
69.7% 67.9%
73.1% 76.9%
79.9%
72.4% 67.1%
2012 Harris County November Election: Voter Turnout by Household Income and Straight Party Voting
% of Straight Party voters choosing DEM option
% of Straight Party voters choosing REP option

20
16.4%
38.4%
31.1%
14.0%
11.5%
34.8%
31.0%
22.7%
9.8%
32.4%
37.9%
19.8%
1987-now, 18-29 1967-1986, 30-49 1952-1966, 50-64 1901-1951, 65+
Glimpse of Early Voting by Personal Appearance in the 2016 Harris County November Election by Age Group
(as of Oct 31.)
Spanish Asian non-Spanish or Asian

21
42% 39% 40% 40% 41%
43% 43% 43% 44% 46% 47% 48% 47% 46%
43%
37%
42% 43%
55% 57% 57% 58%
56% 55% 55% 55% 54%
52% 51% 51% 52% 53%
56%
62%
58%
55%
3% 4% 3% 2% 3% 2% 2% 2% 2% 2% 2% 1% 1% 1% 2% 1% 0% 2%
Profile of in-person voters in Harris County 2016 Election halfway through Early Voting Period
Male Female Undetermined

DOES IT REALLY MATTER?
22
23
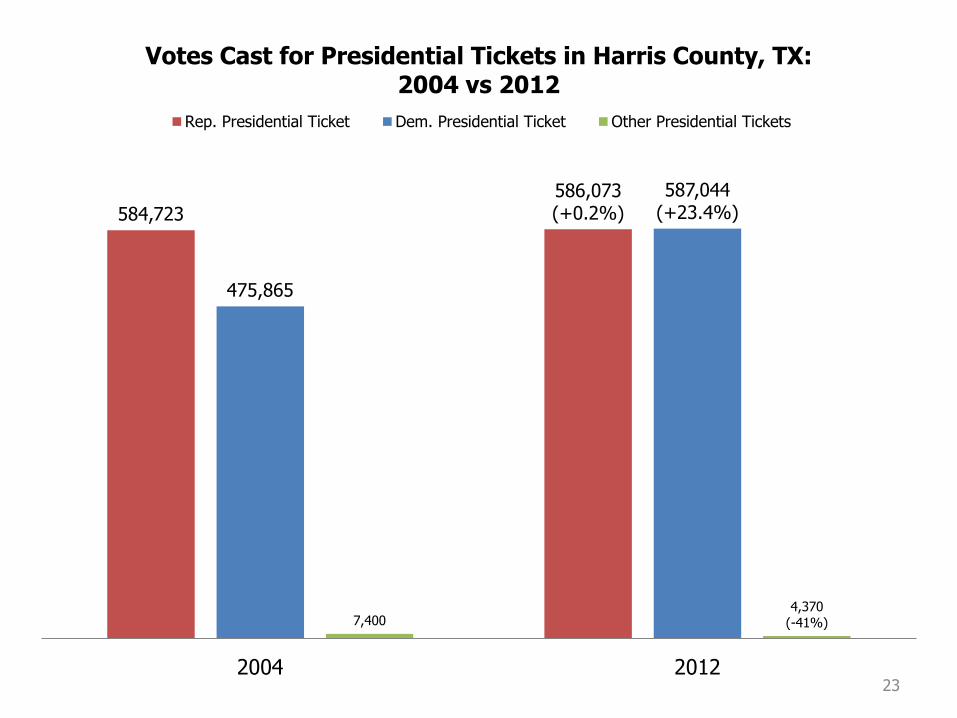
584,723
586,073 (+0.2%)
475,865
587,044 (+23.4%)
7,400 4,370
(-41%)
2004 2012
Votes Cast for Presidential Tickets in Harris County, TX: 2004 vs 2012
Rep. Presidential Ticket Dem. Presidential Ticket Other Presidential Tickets

ABOUT AUTHOR: Héctor de Leon has spent his professional life carrying out educational initiatives with the objective of enhancing voter participation and an understanding of the electoral
process via private and public organizations.
Since May 2004, Hector has worked for Harris County. He was appointed Director of Communications and Voter Outreach of the office of the Harris County Clerk in 2007. In
this capacity, he helps provide the citizenry of the third largest county in the nation the information needed to access the voting process, with a special focus on limited
English proficient voters covered by the language provision of the 1975 Voting Rights Act and voters of African American ancestry.
Prior to joining the Harris County Clerk’s Office, Hector worked for the NALEO Educational Fund from March 1993 to April 2004. He began as the volunteer recruitment
coordinator and ascended to Regional Director in 1994 after Leonel Castillo, former City of Houston Controller and Commissioner of the Immigration and Naturalization
Service under President Jimmy Carter, vacated the position. While with the NALEO Ed. Fund, Hector partnered with community-based groups creating an ad hoc network
that worked to conduct citizenship classes, administer the U.S citizenship exam and provide assistance with the completion of naturalization application process to
thousands of legal residents via the NALEO U.S. Citizenship Workshop model. The groups included The Metropolitan Organization (TMO), The Ft. Bend-Interfaith Council,
Houston Community College Southeast, Centro Hispano Educativo, The Harris County Department of Education and several parishes within the Archdiocese of Galveston-
Houston, as well as local elected and non-elected leaders. In 1994, understanding that citizenship and voting go hand-in-hand, Héctor incorporated an annual voter
education and voter mobilization campaign to NALEO’s programmatic activities during election cycles, with the help of the local affiliates of the two major Spanish-language
television networks. The campaign consisted of educational Public Service Announcements which focused on increasing awareness among Latinos about the voter
registration deadline, Voting by Mail, Early Voting and Election Day. The PSAs were supplemented with voter registration activities and an effort to teach Latinos how to use
the voting equipment. The effort concluded with an Election Day voter information hotline and election analysis for Spanish language television news. By 2004, the NALEO
Educational Fund’s national civic education activities mirrored the Houston NALEO office voter education and mobilization efforts. At the time Hector joined NALEO, the
organization was known as “the nation’s foremost advocate of increased access to U.S. citizenship information and assistance.” By the time he left, his contributions had
helped the NALEO Ed. Fund evolve into “the nation’s leading nonprofit organization that facilitates the full participation of Latinos in the American political process, from
citizenship to public service.”
Hector began his civic engagement journey as a participant in the political action committee (PAC) Latinos Unidos from 1990 to 1994. Latinos Unidos was created by a group
of Houston Latino leaders, including former Houston City Councilmember Ben T. Reyes, with the goal of increasing the participation of Latinos in the American political
process. The PAC was chaired by Leonel J. Castillo. As one of the main volunteers of Latinos Unidos, Héctor was responsible for helping organize a weekly Saturday morning
meeting, finding a guest speaker and coordinating a voter registration block walk. He also organized monthly voter registration efforts at U.S. Naturalization ceremonies
distributing voter registration applications to thousands of new citizens every third Friday of the month; an activity he continued until 2004. In addition, he helped
coordinate voter mobilization activities and voter advocacy efforts. Hector became director of the Latinos Unidos PAC laboring in the corner of Houston Councilmember
Reyes’ district office in the heart of the Magnolia Park neighborhood which is near the Houston Ship Channel. Under Hector’s guidance, the group established an
independent office and began offering U.S citizenship classes in an underserved Latino community in North Houston. Hector served as the Government and History
instructor for legal residents seeking to naturalize. The Latinos Unidos meetings continued throughout the 1990s, but the PAC’s regular grass-roots activities ceased after
Hector went to work for the National Association of Latino Elected and Appointed Officials (NALEO) Educational Fund Texas office based in Houston.
Hector’s work ethic and leadership helped established the NALEO Educational Fund as the preeminent non-profit civic education organization in Southeast Texas. Hector was
born in Monterrey and raised [in the ejido of Albercones] in the municipality of Doctor Arroyo, in the state of Nuevo Leon, where his mother was a rural teacher for over 20
years. He is a naturalized American citizen of Mexican origin whose paternal ancestors are native to the Americas 24