Embed Size (px)
Citation preview

EVALUATION OF THE HEAVY TOW QUICK CLEARANCE PROGRAM
I-70 MOUNTAIN CORRIDOR Page 1
1.0 EXECUTIVE SUMMARY
The Quick Clearance “Heavy Tow” Program for Interstate 70. The Colorado Department of Transportation (CDOT) launched a Heavy Vehicle Relocation Pilot Program in January of 2008. The Pilot Program called “Heavy Tow” by program participants was implemented by CDOT to quickly re-open lanes blocked by commercial vehicles on I-70 in Region One during heavy traffic periods in the winter when the Ski Resorts are open. The program was so successful that it has continued each year since following the same concepts and procedures established in the pilot program. The program has the following characteristics:
• Operations Concept: Respond immediately to lane blockages during heavy traffic periods with pre-positioned heavy wrecker crews on standby from “response platforms” strategically located on recurring problem areas of I-70. The heavy wreckers respond and relocate lane-blocking vehicles to nearby safe havens off the roadway.
• Geographic Coverage: The critical 90 mile stretch of I-70 in the mountain corridor from milepost 263 near the interchange with C-470 to milepost 173 west of Vail. The west boundary was extended to milepost 130 the Dotsero exit, in the 2010 – 2011 season. This highway segment includes the Eisenhower and Johnson Memorial Tunnels (EJMT) at milepost 213.5. Figure 3.0 provides a map of the corridor.
• Heavy Tow Service Units (HTSU): The HTSU is a heavy wrecker with a 35 ton or greater boom operated by a relocation technician with specialized training and experience in Mountainous terrain and winter conditions. The HTSUs were provided by a contractor to CDOT on an as-needed basis.
• Real-time Communications and Monitoring: The program participants were coordinated by an on-site Incident Commander. HTSU vehicle operations were jointly monitored by CDOT at the EJMT and a contractor. HTSU’s were tracked using Global Positioning Satellites (GPS). A contractor, the American Towing Alliance, provided real-time data collection and supervision of the HTSUs. All operations were conducted consistently with CDOT Incident Management Plans (IMPs) already in place.
• Standard Operating Procedures: The Heavy Tow Program was designed and procedures developed with input from the Colorado State Patrol,

EVALUATION OF THE HEAVY TOW QUICK CLEARANCE PROGRAM
I-70 MOUNTAIN CORRIDOR Page 2
representatives of the Colorado Motor Carrier Association and a representative of the Towing and Recovery Industry in Colorado. There was also extensive internal coordination between the various groups of CDOT (Roadway Maintenance, Region 1 Traffic, ,)
Heavy Tow: Quick clearance of immobilized commercial vehicles during the winter months started in January of 2008 and has been in operation each winter season up to the present. Heavy Tow Service Unit (HTSU) Relocation Teams with specialized response vehicles are pre-positioned at “emergency response platforms” in the most critical 90 miles of the I-70 Mountain Corridor during select weekend periods of heavy traffic and adverse weather conditions.
Results: available from data collected indicate:
• Lane closures involving heavy commercial vehicles traditionally required an average of 52 minutes to clear in 2006/2007 without HTSUs.
• HTSU quick clearance time in 2008 averaged 27 minutes, almost half of the time previously required. HTSU quick clearance average time improved to 23 minutes in 2009 and 2010 and in 2011 the average time was down to 22 minutes.
• Based on data from past studies, the economic and societal cost of closing I-70 while the ski resorts are open is as high as $800,000 per hour, or over $13,000 per minute. Using this data, the reduction in clearance time from the past traditional average of 52 minutes, down to the present time of 22 minutes equates to a revenue savings annually of approximately $20 million.
• Based on these estimates, the benefit to cost ratio of the Heavy Tow Program has been approximately a ratio of $20 to $1.
The Approach: A CDOT Incident Commander positions the HTSUs in real time based on traffic and weather conditions, to minimize the potential response times in areas with high probability of lane blockages. When a lane blockage occurs, the CDOT Incident Commander immediately dispatches the closest HTSU to the site. Traffic Management Technicians use state of the art equipment located at the Eisenhower Tunnel Operations Room to track the HTSU’s using real-time Global Positioning Satellite (GPS) units embedded in the response team vehicles. This allows CDOT to monitor the exact location and time required to re-open blocked lanes and return traffic to normal. Rather than tow a vehicle down the highway and cause additional delay, the HTSU’s quickly relocate the lane blockers to the closest “safe haven”, where they are dropped for removal after the heavy traffic subsides. The HTSU then moves quickly back into position for the next response.

EVALUATION OF THE HEAVY TOW QUICK CLEARANCE PROGRAM
I-70 MOUNTAIN CORRIDOR Page 3
The Response Teams: Each HTSU response team consists of specially trained quick-clearance professionals equipped for extreme conditions and adverse weather operations. Each team has a heavy duty relocation rig. The rigs average over 45 tons and sport a relocation “boom” that can apply a 25 to 35 ton lifting force when required. In the hands of experienced Mountain Corridor teams, these rigs are agile enough to safely traverse the most treacherous approach conditions, yet powerful enough to quickly relocate every type of lane-blocking heavy vehicle from Tractor-Trailers to smaller three axle trucks.
The Benefits: The HTSU teams and equipment are not without cost to provide. The HTSU only re-locates the commercial vehicles to re-open the road, and trucking companies still must pay to be towed from the safe haven out of the corridor. Since the truckers have no choice about being relocated, they cannot be charged for the service. The entire cost of the program must be justified by the savings to the traveling public, the Colorado tourist industry and economy. The previously referenced study concluded that for every hour I-70 is closed; the Colorado economy loses $800,000 dollars. Therefore the entire cost of the program is justified if the cumulative closure reductions add up to one hour. Using the 27 to 22 minute averages with HTSUs, against the 52 minute average without HTSUs, the benefit equates to revenue savings each year from $10 million for the initial year to averaging over $20 million in revenue savings for the following years. This benefit to cost ratio of twenty dollars saved for every dollar spent is exceptional, and not typical of this type of program. These results can only be attributed to the unusually important role this single stretch of congested road plays in the Colorado economy.
The Colorado State Patrol and Department of Transportation are also keenly aware that every minute a lane is blocked causes 15 minutes of delay, and vastly increases the potential for secondary accidents where drivers encountering stopped vehicles upstream of the closure may not be able to stop in time. Although it is not yet quantified, the potential for reductions in secondary collisions is an important benefit of the program.
What is the Key to Success? What can these exceptional results be attributed to? There are several items that contribute to the potential success of the HTSU program:

EVALUATION OF THE HEAVY TOW QUICK CLEARANCE PROGRAM
I-70 MOUNTAIN CORRIDOR Page 4
• Dramatically reduced travel time to the site. In addition to being pre-positioned and ready to respond at a moments notice, CDOT and CSP can work together to provide the HTSU “contraflow” approach when the road is closed. The HTSU can often approach the lane blockages unimpeded, traveling opposite the normal flow of traffic.
• Only “High Country” specialists need apply. Response team members must have years of Mountain Corridor experience to lead an HTSU. Due to the extreme and unusual conditions, only an experienced team is familiar with the unique situations they may encounter (e.g., a jack-knifed tractor-trailer “wedged” across two lanes between snow banks, rock walls and guide rails).
• Performance Based Payment. HTSU response teams are compensated for time on the job and the results they achieve. They receive a fixed payment for each hour on the emergency response platform, and variable payment for the lanes properly reopened within the time performance goals. “Cleared lane payments” are withheld if the lanes are not safely reopened within the agreed upon performance times. With GPS tracking and HTSU inspections, CDOT is able to insure that HTSU’s are meeting the strict requirements for performance and safety.
• The Spirit of Teamwork. With the knowledge that every minute counts and responders are putting their lives and reputations on the line, a high degree of teamwork between the program participants has contributed to greater than expected results.
What will the Future Hold? With increasing traffic congestion on I-70 and the negative impact on the economy, CDOT is doing what it can to keep the road open, and re-open it quickly after closures occur. The Heavy Tow program is an operational tool to help CDOT with these safety and mobility issues.
For more information regarding the program described in this report, or to learn how to support quick clearance initiatives, please contact:
Bernie E. Guevara, P.E.
Region One Traffic Engineer
18500 East Colfax Avenue
Aurora, Colorado 80011
(303) 365-7300

EVALUATION OF THE HEAVY TOW QUICK CLEARANCE PROGRAM
I-70 MOUNTAIN CORRIDOR Page 5
2.0 INTRODUCTION
In April of 2007, the Denver Post ran the headline “Study: Gridlock toll in mountains $839 million.” The article stated that “a study released Wednesday [April 25] puts a price tag on the chronic congestion along the mountain corridor that carves into business, tourism and quality of life: $839 million annually.”1 After this study and article was released, the Colorado Department of Transportation (CDOT) began an aggressive effort to better manage heavy truck operations in the I-70 Mountain Corridor during the snow season. An important
part of this effort was to address the quick clearance of commercial vehicle incidents from the Idaho Springs area west to Vail. Heavy truck incidents during peak travel periods along this corridor cause delays that seriously impact Colorado travel, tourism, and trade, which motivated CDOT to pursue the “Heavy Tow Service Program”.
The corridor serves as a life-line for the State as the only major highway facility traversing through Colorado, providing connectivity between the eastern plains, Front Range, and mountain communities. I-70 is the main link to the majority of the State's ski resorts. It serves as the primary route for the transport of goods both intrastate as well as interstate. Existing traffic volumes have reached extremes and congestion has become an economic threat to the growing communities, expanding industries and public safety. Additionally, twenty year forecasts show significant increases in regional population growth and, consequently, traffic volumes. Since there is no scheduled construction for alternative routing or capacity improvements viable within the near future, it is imperative to seek out, analyze and implement alternative means of congestion management for the existing corridor. Specifically, incident management methodologies, such as the I-70 Heavy Tow Program, may be the interim solution until a superior solution can be implemented.
A “Heavy Tow Program” was planned by CDOT for the winter of 2007/2008 and was implemented as a two part program to reduce the probability of heavy truck incidents in the corridor and provide “quick clearance”. No action taken by CDOT can prevent accidents, as driver, weather, and vehicle elements are unpredictable. Nothing in this report is intended to imply that CDOT can control
1 Lipsher, Steve. "Study: Gridlock toll in mountains $830 million." Denver Post. 25 April 2007. Available at: http://www.denverpost.com/ci_5751037>. Study was conducted by Development Research Partners.
A vehicle is considered commercial if it transports passengers or property in commerce. If the gross combination weight rating is 26,001 lbs. or more, (inclusive of a towed unit with a gross vehicle rating of more than 10,000 lbs.), or is designed to transport 16 or more passengers, including the driver.
(CDOT Fact Book 2007-08)

EVALUATION OF THE HEAVY TOW QUICK CLEARANCE PROGRAM
I-70 MOUNTAIN CORRIDOR Page 6
the number of accidents that may occur. Improving the conditions during an incident is predicted to decrease the effects and probability of heavy truck incidents. Heavy truck incidents include accidents, mechanical failure, and disabled vehicles dues to weather. Quick clearance is a strategy that uses communications, people and resources to detect respond and clear roadway incidents quickly. This results in better recovery of normal highway operations during and after an incident. To achieve quick clearance, heavy wreckers were strategically located along the I-70 Mountain Corridor during peak travel periods to respond to heavy truck incidents when they occur.
3.0 CONDITIONS BEFORE HEAVY TOW PROGRAM
The I-70 mountain corridor demographics collected and distributed by various local stake holders maintain the consensus that local populations are sustaining a consistent rate of growth that is expected to increase significantly over the next decade. These communities contribute their growth to a fairly balanced combination of migration and natural growth. However, the economic ramifications to the State's industries, government agencies, local businesses, residents, and environment related to the cost of congestion are becoming more evident throughout the communities the corridor supports.
Growth and development inherently follow strategic highway corridors as industry, commercial and service related markets are generated in support of the traveling public. However, the I-70 corridor has far surpassed its intended capacity and the level-of-service has reached critical levels of delay and congestion inducing a down-turn in its economic remuneration. Congestion along I-70 is widely publicized and is creating high levels of frustration with the associated delays.
The I-70 corridor is an unprecedented highway in the State of Colorado with differentiating features as diverse as the factors contributing to the congestion itself. The corridor hosts scenic interests such as the Continental Divide, watersheds, geologic summits and
Figure 3.0 I-70 through Colorado

EVALUATION OF THE HEAVY TOW QUICK CLEARANCE PROGRAM
I-70 MOUNTAIN CORRIDOR Page 7
wildlife integrated amongst tourist attractions, communities and the I-70 roadway system.
The critical 90 mile stretch of I-70 from Denver to Vail, traverses some of the most challenging terrain on an interstate highway system in the world. Driving over the highest elevations that can be found anywhere on an interstate system the Eisenhower Johnson Memorial Tunnel is not only the highest point on any part of the interstate highway system, at 11,013 feet, it is the highest tunnel and is almost 2 miles. Vail Pass is the second highest point on the Interstate system at 10,600 feet but can be the most notorious stretch during the winter months due to the steep grades, winding narrow sections on the west side of the pass and the massive amounts of snow that can accumulate during winter storms. (Refer to figure 1 below)
I-70 serves as the State's primary east/west route for both passenger cars and intra and interstate freight transport and links the eastern and western slopes of the mountainous regions together. Therefore, the economic impacts of congestion along the I-70 corridor reach far beyond the communities it services and radiates statewide to the doorsteps of every tax-paying citizen.
The 2007 study, completed by Development Research Partners (DRP), on The Impact of I-70 Congestion on Colorado breaks the I-70 corridor into three
Figure 3.1 I-70 Elevation change

EVALUATION OF THE HEAVY TOW QUICK CLEARANCE PROGRAM
I-70 MOUNTAIN CORRIDOR Page 8
geographic zones and analyzes the effects of I-70 congestion on key economic sectors: Tourism, Residential Markets, the Business Community, and Government. The study also investigates these impacts in relation to financing I-70 improvements and alternative-build projects as delays and inflation corrode available funding resources. The geographic areas defined in the study grouped the communities along the I-70 corridor as follows:
• Metro Denver - Adams, Arapahoe, Boulder, Broomfield, Denver, Douglas and Jefferson Counties
• Mountain Resort Region: Clear Creek, Gilpin, Grand Summit, Eagle and Pitkin counties
• Western Slope: Garfield and Mesa counties
Figure 3.1 Colorado Counties along I-70 Corridor
3.1 Traffic Congestion
The DRP study takes into account basic traffic data along I-70 at peak periods and applies projected growth and development through year 2025 under a no build scenario. Assumptions for roadway improvements were limited to basic maintenance with no additions to lane configurations or implementation of alternative transportation projects for the purpose of the study.
Garfield
MesaPitkin
Eagle
SummitBoulder
Douglas
ArapahoeAdams
WeldJe
ffers
on

EVALUATION OF THE HEAVY TOW QUICK CLEARANCE PROGRAM
I-70 MOUNTAIN CORRIDOR Page 9
I-70 corridor congestion persists year round, but is subject to peak periods of traffic flow based on season, weather, day of the week, as well as time of day. The most severe congestion can be attributed to the winter season as tourists migrate to the world-renown slopes and ski resorts and the severe winter weather sets into the Mountain Region. Site-seers flood the peaks and escape the heat during the summer months between June and August. Travel between the Metro Denver Region and the Mountain Resort Region peak daily but are especially heavy in the westbound direction Friday evenings and Saturday mornings with the westbound returning traffic being heaviest on Sundays. Traffic patterns are similar, but reversed, for the Western Slope Region as travelers head east to the Mountain Resorts for the weekend and return westbound on Sundays.
Figure 3.2 Average Daily Traffic Count for I-70 (Impact of I-70 Congestion on Colorado study, 2007)
The Impact of I-70 Congestion on Colorado study estimates an annual growth rate between 2 and 3 percent for most of the communities along the I-70 corridor during the 2006 to 2025 study period. Some communities are faced with increases in traffic volumes between 40 and 70 percent over the twenty year study period depending on their proximity to the metropolitan and resort regions. Congestion of this magnitude creates adverse economic effects as travelers begin to avoid the widely publicized warnings about delays and hazards associated with the I-70 corridor.
The Colorado Department of Transportation estimates that 27 percent of the winter season motorists normally destined for the Mountain Resort Region will choose alternative locations and travel routes by year 2025 due to the delays.

EVALUATION OF THE HEAVY TOW QUICK CLEARANCE PROGRAM
I-70 MOUNTAIN CORRIDOR Page 10
Likewise, they also predict a decline of 10 percent in the 2025 summer peak travel volumes.
Traffic data collected by CDOT from 2004-2008 and the Pilot Program from 2007-2008 substantiate the growth estimates yielding an annual increase in traffic volumes at various check points along the corridor to be between 2 and 3 percent with a spike of 6 percent in the annual growth in traffic volumes accounted for in the 2007-2008 data.
3.2 Related Studies
Interstate 70 throughout the nation has been studied over many years to identify solutions to alleviate the recognized issue(s). Colorado has conducted many studies on its part of I-70, especially the mountain corridor, in most recent years. The following report combined many studies conducted between 2000 and 2006.
3.2.1 The Impact of I-70 Congestion on Colorado – Denver to Grand Junction (April 2007)
In December 2004, CDOT released a first draft of the Programmatic Environmental Impact Statement (PEIS) for the I-70 Mountain Corridor. This report compared 18 distinct alternatives to lessen the current and future traffic congestion. One of the alternative options was the “no-action” alternative that was further studied by Development Research Partners, on behalf of the Denver metro Chamber of Commerce and the Metro Denver Economic Development Corp. The purpose of this secondary study was to provide qualitative and quantitative impacts from Metro Denver to the Western Slope and on tourism, residential market, business community, government, and construction. Data was collected from CDOT, Colorado Department of Revenue, Colorado and US Departments of Labor and Employment, Colorado State Patrol, US Census Bureau, State parks, local town governments, local businesses, and other published studies. The results concluded that congestion on I-70 impacted the study area by $839 million (2005). This negative cost of congestion was calculated from:
• Tourism decreasing 1% in the Mountain Resort Region ($25 million)
• Residents lost time while traveling through congestion created by non-local drivers ($85 million)
• Businesses lost 0.5% in productivity and efficiency throughout the different regions ($728 million)

EVALUATION OF THE HEAVY TOW QUICK CLEARANCE PROGRAM
I-70 MOUNTAIN CORRIDOR Page 11
• Governments lost sales taxes with the decrease in tourism ($1 million)
For further discussion of the conditions before the Pilot Program was implemented, refer to Chapter 6.0.
SIMILAR INCIDENT MANAGEMENT PROGRAMS
Many other cities, states, and regions have implemented an incident management program for their transportation system. Some programs focus on either passenger vehicles or commercial vehicles, while others include both vehicle types. This chapter presents summaries of incident response programs that helped mold the I-70 Pilot Program.
3.3 Maryland Transportation Authority
The Maryland Transportation Authority (MdTA) is responsible for the operations and maintenance of all toll facilities in Maryland. It manages and operates seven toll facilities including four bridges, two tunnels, and a 50-mile stretch of I-95 north of Baltimore. The operational goal for the agency is to keep traffic moving by quickly clearing incidents. A tow company call-out list and Freeway Service Patrol (FSP) programs were developed for this transportation system. The towing program is managed by two staff members and the call out list is no rotational. The MdTA divided the coverage area into regions with each having two approved towing companies on its call-out list. When an incident occurs the dispatcher determines which tow company to alert in the particular region and informs them of the type of vehicles involved. Tow companies are responsible for
providing the correct wrecker(s) for each incident based on number and type of vehicles. The program has established staging areas for tow trucks on each site to achieve the 30-minute response rule set by MdTA. When a vehicle is towed the motorist is responsible to pay the tow rate which is based on vehicle classification. The program’s primary purpose is to call a reliable tow company to assist in quick clearance of an incident.
The Freeway Service Patrol (FSP) rovers the bridges, tunnels, and highway to locate incidents and assist motorists. The driver informs the dispatcher with details of an incident. During an incident the FSP assist with traffic control and communication to other motorists. In the tunnels FSP uses motorcycles for easier

EVALUATION OF THE HEAVY TOW QUICK CLEARANCE PROGRAM
I-70 MOUNTAIN CORRIDOR Page 12
access during congested periods. The average response time of this courtesy patrol is five minutes.
3.4 Hudson Valley Transportation Management Center
The Hudson Valley Transportation Management Center (HVTMC) in Hawthorne, NY provides traveler information in seven New York counties. New York State Department of Transportation (NYSDOT) and the New York State Police (NYSP) jointly operate the center. The TMC provides the courtesy patrol program Highway Emergency Local Patrol (HELP), and a zone-based towing program. The HELP Program is one of the nation’s largest and most successful roadway service patrol programs. It provides several free services to stranded motorists, including jump start, flat tire change, a gallon of gas, other necessary fluids, and minor repairs for disabled vehicles during weekday morning and evening peak hour. The operators also provide incident management and traffic control during incidents. HELP gives NYDOT the ability to quickly detect, verify, respond and clear minor incidents on the highway, which can significantly reduce the traffic delays and likelihood of secondary incidents. Quick clearance of vehicles either disabled or blocking travel lanes on highways increases the operating capacity and minimizes the traffic queues. The HELP Program addresses congestion management on the busy transportation network of New York. By combining the Parkway Towing Program and the NY Thurway Program, the Interstate 684 (I-684) Towing Program was developed. It uses a rotational list system of pre-approved towing companies within each of the pre-determined zones. There are two rotational lists: one for light duty towing and one for heavy duty towing. A motorist can call the dispatchers who will send the appropriate tow truck to the incident site. The tow fee is the responsibility of the motorist. Currently, the response time is the only performance measure recorded.
3.5 Florida Department of Transportation
Fall 2002 the Florida Highway Patrol (FHP) and the Florida Department of Transportation (FDOT) endorsed the “open roads” philosophy to expedite the removal of vehicles, cargo, and debris from roadways due to a vehicular incident. The purpose of the policy was to quickly and safely restore the roadways traffic flow and reduce the impacts associated with an incident. The FHP is responsible to respond to the scene and set up appropriate safety measures for those involved and passing travelers. FDOT is responsible to deploy the correct resources 24 hours per day, 7 days per week and assists the FHP in traffic

EVATHE
I-70
contrdurinthe “operservidebrresposerviemeroil aRangfamiltime provimotomanastran
adeqopengoalshiredminuminu Floridadvameas
•
•
•
ALUATION E HEAVY TO
MOUNTAIN
rol. The gong maintena“Road Ranates 24 hoice for strais and daond and asices are: prgency rep
and even agers have aly to requesis 18 minuided when orist is theagement pnded motori
quate equipned within s, the Florid tow servicutes an inceute is applie
da carefullantages ansures are tr
RISC Ac
Arrival Ti
RISC Ac
OF TOW QUICK
IN CORRID
oal is to haance work ger Courte
ours per danded moto
amaged vessist motorisproviding aairs (i.e. ada cool botta free cellust help fromutes. Most Rthe disablen responsi
program haists; howev
pment to th90 minutesida Turnpikce when thentive is no
ed when an
y documennd areas racked by t
ctivations –
ime after R
ctivation Imp
K CLEARA
DOR
ave the inithours and 6
esy Patrol.” ay, 7 days
orists. Theyehicles invosts who hauto-fuel, asdding watetle of wateular telepho
m a motor cRanger vehed vehicle nible to getas positivever, it is limi
In 2004Scene Cclearancsupportsnation toRISC isfacilitiescompancrash scper wee
he scene ws after theke Enterpriey clear anot paid to tincident is
nted the pto be imphe Florida T
Number of
RISC Activat
plemented
ANCE PROG
tial traffic c60 minutesSince Sepper week
assist in qolved in mve mechanssisting witr to over-he
er to exhauone availabclub or tow chicles are toneeds to bet a tow froely affectedted to pass
4, Florida iClearance (ce of larges the openo focus ons to safel
s to safe pnies providecene equipek. FDOT
within 60 me incident nse pays a n incident wthe tow comnot cleared
erformanceproved upTMC or Dis
times RISC
tion
(notice to p
GRAM
control on s after hoursptember 20. The Roadquick clearaminor non-nical issuesth tire chaeated vehicusted stranble for motocompany. ow trucks a relocated t
om there. d the traffsenger carsimplemente(RISC) Proge truck incn road poln heavy vehy and qu
public use. e special supment 24 hT set the
minutes andnotification.
flat rate swithin the smpany. A dd within 180
e of the pon. The fstrict:
C is activate
proceed giv
site within s. This dev
006 the patd Rangersance of tra-injury crass. Some of nges and cles), provinded motoorists to caThe averag
and the couto a safer loThis highwic flow an
s. ed the Ragram to foccidents. Thlicy and is hicles. Theickly restoThe progra
uper-duty whours per d
goals of d have the In order t
service payspecified timdisincentive0 minutes.
rogram to following p
ed within e
ven)
Page 13
30 minuteveloped fromtrol program offer direc
avel lanes oshes. Thethe includeother minoiding engin
orists. Roaall friends oge responsurtesy tow iocation. Th
way incidennd safety o
pid Incidencus on quichis program
first in the purpose oore highwaam’s towin
wreckers anday, 7 dayhaving thtravel laneto meet th
yment to thme. After 9e of $10 pe
identify thperformanc
ach District
es m m ct of ey ed or ne ad or se is
he nt of
nt ck m he of ay ng nd ys he es he he 90 er
he ce
t.

EVATHE
I-70
•
•
Accototal decrehighw2005bene
3.6
HighblockDepa1963areavehicGamprogcontrcompservihourrovinRespstateWSDtow latesimpro
Wasstuckcruciand one AssisTeamcomm 2 “Incihttp://w
ALUATION E HEAVY TO
MOUNTAIN
Travel La
Incident
ording to theduration ofeased fromways were 5 with the efits on the
Washi
ways in theked lane cartment of T3 to clear b: Mercer Icles and w
mes. Ten yeram with racts with panies. In Jice area ans, for a t
ng). The staponse progewide. PaDOT, state companies
st programoves traffic
hington fouk in traffic ial role in kquickly clepriority of tstance is avm who amunications
ident Responsewww.wsdot.w
OF TOW QUICK
IN CORRID
ane Clearan
Clearance
e data, the f an incidenm 177 min
affected bRISC pro
Florida tran
ngton Sta
e State of can result Transportalockages osland and
was highlighears later tsix additithe state
July 2002, nd added 1total of 38ate legislatugram in 2artnerships
patrol, ems, and mot
m helps cleflow.
und that thso it's eas
keeping Waar incidentthe Incidenvailable 24 re respons, and ass
e Program.” Wa.gov/Operatio
K CLEARA
DOR
nce Time
Time
goals werent (notificationutes to 1by heavy truogram in pnsportation
ate Depa
Washingtoin long qution (WSDOn their twoEvergreen
hted as a the programonal rovinpatrol andthe progra
19 roving v8 vehicles ure reautho2003 and
were mergency torist assistear incide
he average sy to see washington os and resto
nt Responshours a da
nsible for istance in c
Washington Statons/IncidentRe
ANCE PROG
e met 93% on to cleara
149 minuteuck incidenplace. The
system.
rtment of
n are operueues andOT) began floating br
n Point. ThPilot Progrm molded
ng vehiclesd private tam expandevehicles for
(stationaryrized the Inexpanded
made beservices, ptance vansnts quickly
motorist swhy an Inc
on the moveore the flow
se Team foay, seven da
traffic coclearance a
te Department esponse/
GRAM
of the timeance) from es. Overallnts was red
results ill
f Transpo
rating at or delays. Tan inciden
ridges in thehe programram in 199into a sma
s and towing ed the r peak y and
ncident it to
etween private s. The y and
spends twocident Rese2. The maw of traffic.
or the motoays a weekontrol, trafand clean
of Transportat
e. When co2004 to 20
l the amoduced by 2ustrate the
ortation
r above capThe Washint responsee Central Pm began w90 during tall pilot Se
o weeks ofponse Tea
ain purpose. Safety is
orists on thk. Motoristsffic reroutiup. The ro
tion. Available
Page 14
omparing th005, the timunt of tim
200 hours ie program’
pacity and ngton Stat
e program iPuget Sounwith “rovinghe Goodw
ervice Patro
f every yeaam serves e is to safel
the numbee highways
s can call thing, mobil
oving vehicl
at:
he me me
in ’s
a te in
nd g” ill ol
ar a ly er s.
he le le

EVATHE
I-70
operof ga
One incluof lifetraveaccid
eastb
3.7
GeorJanuteamDepasteerprogrhighwprojevehicencoincenclear
The four IncidTranthe OperDispcomp 3 Smit
ALUATION E HEAVY TO
MOUNTAIN
ators are reas, re-locati
of the mosded in the e and the eeler may edents, roug
bound stee
Georg
rgia implemuary 2008 tm consists artment of ring commram is to pways withinect limits. Tcle inciden
ourages thentives to hring wrecks
project areregions to
dents are sportation GDOT Hi
rators (HEatchers npany who
th, Arland T. “W
OF TOW QUICK
IN CORRID
esponsible ng blocking
st critical roIncident Reeconomy thexperience gh paveme
potetraffthe specduriIRXtlargto impart
p grade jus
ia Towing
mented theto provide qof GeorgiaTransporta
mittee and rovide safe
n the metro TRIP was pnts, such ae quick, safhighly-skilledwithin 90 m
ea highwayo decrease
reportedManagemeghway Em
ERO) and/notify a c
can rapid
What is TRIP?
K CLEARA
DOR
for help mg vehicles,
oadways in esponse prohat the traf
congestioent conditioential wildliffic over Sno
Washingtcially-designg toughtreme, thise trucks, is
mprove tracticular dayst below Sn
g and Inc
e Towing aquick clearaa Regional ation (GDOstakeholdeand quick Atlanta are
put into actas delays,fe clearancd, TRIP-ce
minutes.
ys were di the respo
d to theent Center mergency /or local certified Tdly respon
?” October 19-2
ANCE PROG
motorists witand most o
Washingtoogram. It isffic on this on, delays ons due to fe collisionsoqualmie Pton Truckigned truck t, winter
s truck hass loaded witction in the , IRXtreme
noqualmie S
centive R
and Incentivance of coTransporta
OT), and Ders within clearance o
ea, boundetion to dec air pollute of these
ertified towi
vided into onse time. e GDOT (TMC) by Response agencies.
TRIP tow nd to the
21, 2008.
GRAM
th a flat tireother needs
on is Interss essential thighway bedue to aweather,
s. Due to thass, WSDOing Assocto help pus
road cos a speciath heavy wworst of ro
e pushed Summit.
Recovery
ve Recovemmercial vation AuthoDelcan. Ththe regionof commerc
ed by Intersrease the ition, and incidents b
ing and re
e, jump stas.
tate 90 (I-9to Washinge continuou
avalanche rock slide e large volu
OT has teaciation to h trucks up
onditions. al bumper eights, andoad conditio
26 big r
Program
ery Programvehicles3. Tority (GRTis team w
n. The purcial vehicle tate 285, aimpacts of safety hazby paying ecovery co
Page 15
arts, a gallo
90), which igton’s qualitus. The I-9closures oactivity an
ume of trucmed up wit
provide p the summ
Nicknamefor pushin
d chained uons. On onrigs up th
m (TRIP) iThe programTA), Georgiworks with
pose of thcrashes. A
re within thcommercia
zards. TRIperformancmpanies fo
on
is ty
90 or nd ck th a
mit ed ng up ne he
in m ia a
he All he al P
ce or

EVALUATION OF THE HEAVY TOW QUICK CLEARANCE PROGRAM
I-70 MOUNTAIN CORRIDOR Page 16
incident. Throughout the program the following performance measures were documented to validate any improvements: response times, clearance times, travel-lane blockage, occurrence of secondary incidents, and congestion. From January to June 2008 the average response time was 24 minutes15 seconds compared to 45 minutes 42 seconds in 2007. The average roadway clearance time in 2007 was 4 hours 18 minutes 17 seconds, which decreased to 32 minutes 5 seconds. Data showed that the program saved 112 hours of blockage time for the first 6 months of program compared to 2007 in the same time period. GDOT is proud that the total incident duration decreased from 269 minutes in 2007 to 106 minutes in 20084.
4.0 PROGRAM DEVELOPMENT
To make best use of available resources, the tow service coverage was planned in a strategic manner to increase the likelihood and efficiency for quick clearance of commercial vehicle incidents in the corridor. The factors considered in determining the most effective plan were: roving verses stationary system, geographic extents, vehicle location, type of heavy wrecker, personnel and responsibilities, service days and schedule, and communication methods that include use of Nextel phones, GPS locaters, CDOT cameras and radios. After many discussions with CDOT and other stakeholders, the best coverage plan was determined over time and then refined with operational experience.
4.1 Program Objectives
The essence of the quick clearance program is to enhance existing incident management capabilities in the I-70 Mountain Corridor with heavy wrecker services for commercial vehicles during inclement weather and high volume travel periods. To meet the purpose of this program, the following objectives were pursued:
• Provide greater mobility for passenger and lighter vehicles;
• Improve the safety for all drivers along the corridor and improve response time for emergency responders;
4 www.timetaskforce.com/trip

EVALUATION OF THE HEAVY TOW QUICK CLEARANCE PROGRAM
I-70 MOUNTAIN CORRIDOR Page 17
• Reduce the probability5 of heavy truck incidents in the corridor;
• Reduce the chance of secondary accidents
• Decrease the response time to provide assistance to disabled commercial vehicles;
• Provide “quick clearance” to decrease the amount of time disabled commercial vehicles are stranded at the incident location and remove the commercial vehicle from the roadway to a safe location.
Program Objectives Include:
• Working closely with CDOT, General Contractor, Towing Company, CSP, the trucking industry, commercial truck drivers, emergency responders and local law enforcement.
• Discussing issues and ideas with the stakeholders: towing companies, commercial truck drivers, Trucking Industry representatives, local residents and businesses.
• Taking “lessons learned” from other states as to what works and what does not;
• Identifying and testing quick clearance theories on the I-70 Mountain Corridor that have been proven on similar interstate corridors in other states (further discussed in Section 1.3).
• Providing guidance to the decision-makers towards implementing quick clearance theories;
• Using existing Intelligent Transportation Systems (ITS) technology, including fiber optic data communications, operations centers, variable message signs, some vehicle detection devices and some video traffic monitoring capability;
• Monitoring and evaluating the efficiency and effectiveness regularly throughout the program to make necessary adjustments;
5 No action taken by CDOT can prevent accidents, as driver, weather, and vehicle elements are unpredictable. Nothing in this report is intended to imply that CDOT can control the number of accidents that may occur.

EVALUATION OF THE HEAVY TOW QUICK CLEARANCE PROGRAM
I-70 MOUNTAIN CORRIDOR Page 18
• Examining and comparing past and present commercial vehicle incident data;
• Creating a reader-friendly, useful and workable plan, with recommendations clearly spelled out, with illustrations and summary tables whenever possible.
4.2 Geographic Coverage
Interstate 70 is a significant east-west route that connects both sides of Colorado and extends into neighboring states. The interstate travels through mountainous terrain from the Denver Front Range to the Utah border. The Mountain Resort Region begins at the Jefferson-Clear Creek County line and ends at the Eagle-Garfield County line. The initial project boundary limits for the Heavy Tow Program where from milepost 263, near the interchange with C-470, to milepost 173, just west of Vail. This area includes the Eisenhower and Johnson Memorial Tunnels, Vail pass, many towns/cities, numerous local, state and national parks, and provides access to nine ski resorts. This portion of I-70 is essential to the community it travels through and to all Colorado citizens. For the 2010 – 2011 season the Heavy Tow Program expanded the boundary limits to the west, to milepost 130, the Dotsero exit, to milepost 263, Denver West Boulevard this extended the coverage area to a total of 133 miles.
4.3 Operations Concept
The first decision regarding strategic coverage involved comparison of two coverage strategies: roving vehicles and stationary vehicles. Roving vehicles are considered to be on patrol searching for commercial vehicle incidents. Stationary vehicles are positioned at a chosen location(s), also known as response platform(s), waiting to be dispatched when an incident occurs. Both roving and stationary methods have been successfully used in other parts of the United States; however, the response platform approach was selected for the Heavy Tow program for the following reasons:
• The stationary method removes the towing vehicle from traffic until it is needed decreasing the use of the vehicle, need for gasoline, and potential for being affected by the adverse conditions (weather, grades, and traffic). Roving heavy wreckers have the same characteristics as heavy trucks and can be equally affected by the same adverse conditions, which could lead to an incident involving the roving vehicle.

EVALUATION OF THE HEAVY TOW QUICK CLEARANCE PROGRAM
I-70 MOUNTAIN CORRIDOR Page 19
• The response platform method allows the Incident Commander to dispatch the heavy wrecker with the best path of approach because the travel distance to the incident location is known on the outset. There may be an occasion when a stationary wrecker is closest to a commercial vehicle incident, but may not have the easiest or quickest route to the disabled unit.
• A roving vehicle may not be within close proximity to an incident’s location, which would delay the response time. This may also cause the roving heavy wrecker to get stuck in the traffic jam caused by the commercial vehicle incident further delaying the quick clearance.
Once the stationary method was chosen the next decision made was the location of the response platforms. Several locations and service areas were considered for this program. Four sites were chosen based on the following criteria:
• Frequency and severity of past commercial vehicle incidents,
• Areas most affected by adverse weather,
• Steep grades,
• Accessibility to both directions of travel and
• Mobility throughout the entire corridor.
The initial planned and mandatory response platforms were:
(1) Vail Pass at the CDOT Maintenance Facility,
(2) Eisenhower and Johnson Tunnel, and
(3) Georgetown Visitor Center.
The program has been modified since the initial pilot year to allow more flexibility of platform locations. The Eisenhower Johnson Memorial Tunnel and the Vail Pass locations remain the priorities. Other factors that affect platform locations and require some flexibility during the operational periods are issues such as weather, traffic flow, accidents or special events. The experience of the Heavy Tow team members also requires some flexibility which allows them to anticipate where and when incidents may occur.
The basic heavy tow service plan was envisioned to include strategic roadway coverage based on the primary direction of travel. When prevailing traffic flow

EVALUATION OF THE HEAVY TOW QUICK CLEARANCE PROGRAM
I-70 MOUNTAIN CORRIDOR Page 20
was primarily westbound, the coverage included a vehicle stationed with easy access to the westbound lanes at the designated response platforms. When heavy traffic was in the eastbound direction, then the coverage focused on the eastbound lanes. Quick clearance is the main purpose of this program and the response platforms ensure quick access to the interstate and close proximity to the area’s most likely to have heavy vehicle incidents.
It was decided that the heavy tow services should be provided during peak traffic periods to alleviate the greatest impacts to the corridor, especially during ski season. Although commercial vehicle incidents could happen any day, the best use of available resources was to provide the heavy tow service on weekends during peak skier/tourist periods. The service times selected for the Program include the following characteristics:
• The Heavy Tow Program has typically been operational from the Thanksgiving Day weekend in November through the end of April.
• The typical coverage interval are eight (8) hours in duration, extendable to Fourteen 14 ) hours if needed (ordered by CDOT or needed to complete any vehicle relocation already underway).
• The weekly coverage days are Saturdays from 6:00 a.m. to 2:00 p.m. (westbound) and Sunday afternoons from 2:00 p.m. to 10:00 p.m. (eastbound). The Incident Commander has the flexibility to assign and staff as necessary.
Additional days deemed necessary by CDOT were allowed, with adequate notice. Necessary additional days could be due to emergencies or special events such as: adverse weather, severe weather forecasts, elevated security threat levels, emergency construction, rockfall mitigation, bicycle races, other sporting events, etc.
4.4 The Team
4.4.1 Colorado Department of Transportation – Region 1 The Colorado Department of Transportation (CDOT) is responsible for a vast amount of highway miles and bridges throughout Colorado. The State of Colorado is divided into six regions and the I-70 mountain corridor is located within Region 1.

EVALUATION OF THE HEAVY TOW QUICK CLEARANCE PROGRAM
I-70 MOUNTAIN CORRIDOR Page 21
CDOT is responsible for managing the general contractor and program, providing staging areas for heavy wreckers, monitoring the corridor to identify incidents, positioning heavy wreckers to suit the real-time conditions, recording incident details, identifying “safe havens” to relocate disabled commercial vehicles, and paying the contractor.
4.4.2 General Contractor The Contractors mission is to “connect the North American trucking industry with high quality, fast response, relocation service. The Contractor is to provide dispatching and standardized billing services and insures that highly trained heavy tow operators are utilized for the quick clearance program. The Contractor is also responsible for managing the subcontracted tow company, providing GPS units in each wrecker, dispatching the wreckers from the platform to the incident location, record keeping of incident details, GPS logs, storing digital pictures and invoicing.
American Towing Alliance (ATA) was the general contractor of the Heavy Tow Service Program for the initial 2007 – 2008 season and was the contractor used for winter seasons fall of 2008 through spring of 2010. Drive America is now the General Contractor working under the current contract.
4.4.3 Sub-Contracting Services Responsibilities of the Sub-Contractor are, to provided Heavy Tow Service Units (HTSU), quick clearance teams, towing of disabled commercial vehicles and insuring that its highly trained operators provide quick clearance of the CMV to a safe location. The Heavy Tow Operators are also responsible for documenting the required details for each incident, taking digital pictures and delivering all detailed information and pictures to the contractor. Operators are not responsible for assisting CMV drivers with installing chains or towing the commercial vehicle from the safe haven.
Dillon Towing was the towing company used for the initial season and was the towing company for the winter seasons from fall 2008 through spring of 2010. Western Towing is the towing company that was selected for the 2010 – 2011 winter season.
4.4.4 Stantec Consulting Ltd. Project manager duties involve evaluating results, inspecting the HTSU to insure each unit is in compliance with the requirements set forth in the contract, conduct meetings with stakeholders and team members on program status. Conduct season start up and end of season meetings to communicate program

EVALUATION OF THE HEAVY TOW QUICK CLEARANCE PROGRAM
I-70 MOUNTAIN CORRIDOR Page 22
effectiveness with team and stakeholders. Project manager also assists in the operational management of the program to include incident command decisions, decisions on platform locations for each operational day and dispatching of HTSUs.
4.5 Heavy Tow Service Units
The Heavy Tow Service Units (HTSU) are heavy wreckers with a 35-ton or greater boom operated by a relocation technician with specialized training and experience in mountainous terrain and winter conditions. The HTSUs are provided by the contractor. Each HTSU response team consists of specially trained quick-clearance professionals equipped for extreme conditions and adverse weather operations. The rigs average over 45-tons and are equipped with a relocation “boom” that can apply a 25- to 35-ton lifting force when required. In the hands of experienced Mountain Corridor teams, these rigs are agile enough to safely traverse the most treacherous approach conditions, yet powerful enough to quickly relocate every type of lane-blocking heavy vehicle from tractor-trailers to smaller three-axle trucks.
The towing vehicles are equipped, at a minimum, with the following equipment:
1. Tools, supplies and materials:
• Alloy (grade #8) chain: Two. 5/8” x 10 ft; and four ½” x 10 ft
• One long handle (4 ft) flat blade shovel
• One long handle (4 ft) round blade
• One street brooms (20 inch minimum head)
• Two wheel chocks
• One complete brake release kit: (hand tools, hoses, glad hands, numerous fittings and brake caging bolts)
• Heavy duty, industrial flashlight
• Load binder, transport chain and a cheater pipe
• Wheel lift towing equipment, including safety straps with a minimum lift rating of 3,000 pounds.

EVALUATION OF THE HEAVY TOW QUICK CLEARANCE PROGRAM
I-70 MOUNTAIN CORRIDOR Page 23
2. Yellow/amber warning lights with front to rear (360 degree) directional flashing, with on/off switch in cab;
3. Two-way radio communications with base office and Cellular telephone;
4. All equipment necessary to accomplish the services during inclement weather. It is expected that the professional recovery wrecker operator will supplement this list with additional items needed to operate in a safe and efficient manner.
4.6 Real-Time Communication and Monitoring
Real-time communication is the key element to making this program operate successfully and efficiently. The Contractor is responsible for continuous communications between all personnel providing Heavy Tow Services including the managers, administrators, crews, supervisors, dispatchers, subcontractors, CDOT, law enforcement, 911, and any Colorado number in the mobile or public switched telephone services. Personnel are equipped with cell phones and radios. The I-70 Mountain Corridor ITS technology (fiber optic data communications, operations centers, variable message signs, some vehicle detection devices and some video traffic monitoring capability) is used to closely monitor the corridor in real-time.
Communication begins when an incident is reported by either the truck driver or trucking company, CSP, other roving CDOT personnel, witness, or as seen on a video monitor in the operations center. The known information is given to the General Contractor who then dispatch the heavy tow operator to the incident location, rather than waiting for a first responder (police officer) to arrive. Once the heavy tow operator arrives on scene, they confirm with the General Contractor and CDOT that a heavy wrecker was needed. The heavy tow operator relays the procedures of the Program with the truck driver and verifies that emergency services are not needed before moving the disabled commercial vehicle. Constant communication throughout the event is critical to document procedures and timeline, allocate the correct resources, and meet performance goals (see Section 5.8.1 Key Performance Indicators).

EVALUATION OF THE HEAVY TOW QUICK CLEARANCE PROGRAM
I-70 MOUNTAIN CORRIDOR Page 24
4.7 Standard Operating Procedures
At the beginning of a coverage day, a CDOT Incident Commander positions the HTSUs based on traffic and weather conditions. As circumstances change, the HTSUs could be relocated to a more appropriate location to minimize the potential response times in areas with high probability of lane blockages. If initial mobile phone or other sources indicate that a truck was involved, the tow response vehicle is dispatched to the incident location. When an incident occurs, the CDOT Incident Commander immediately dispatches the closest HTSU to the site. Traffic Management Technicians use state of the art equipment
Commercial Vehicle Incident Occurs
If able , CVO driver Notifies his Commercial Dispatcher via mobile
phone or radio
Dispatcher Contacts
Authorities
“Witness” motoristdials 911 on
mobile phone
If able, CVO driver dials 911 and notifies police
dispatch via mobile phone
911 Call Center :Gathers important data
on accident
911 Call Center Dispatches First
Responder
911 Call Center Provides Primary
Notifications including CDOT
First Responder
(police officer ) travels to site
First Responder Assesses and Secures Site , Radios for additional resources if necessary
Emergency Medical Travels to site if requested
Tow Provider travels to Safe Haven and transports disabled vehicles
CDOT Service Patrol Discovers
Incident
Hazmat
Spilled Load
Enhanced I-70 Commercial Vehicle Incident Heavy Tow Response
CDOT Heavy Tow contractor determines closest Heavy Tow Unit & dispatches to scene
CDOT Heavy Tow leaves response platform & travels to
Transports CV to Safe Haven
Tow Provider contacted from rotating list

EVALUATION OF THE HEAVY TOW QUICK CLEARANCE PROGRAM
I-70 MOUNTAIN CORRIDOR Page 25
located at the Eisenhower Tunnel Operations Room to monitor the corridor and track the HTSU’s. Each response team vehicle has a Global Positioning Satellite (GPS) unit embedded in it, which send location data back to GPS North America (see Section 7.1). This allows CDOT to monitor the exact location and time required to re-open blocked lanes and return traffic to normal operating flows. Rather than towing a vehicle down the highway and cause additional delays, the HTSU’s quickly relocate the lane blockers to the closest “safe haven”, where they are dropped for removal after the heavy traffic subsides. The HTSU then moves quickly back into position for the next response. Once the commercial vehicle is in the safe haven, the truck operator or owner is also able to arrange for final relocation of the vehicle. The Heavy Tow Operators are not responsible for chain assistance or towing the commercial vehicle from the safe haven. If the truck was involved in an accident, then the police officer uses the established rotating list to alert the next tow company on the list to the presence of the vehicle at the safe haven.
4.8 Program Goals
Below are some goals and objectives for the Heavy Wrecker Tow Service:
• To create a safer environment for the traveling public along the I-70 mountain corridor through quick clearance of disabled vehicles. safety to the traveling public, to emergency
• Improve overall mobility and reduce congestion along the I-70 mountain corridor.
• Improve response times of emergency responders.
• Decrease the probability of secondary accidents.
• The Contractor will deploy sufficient equipment from the response platform within 5 minutes of notification of the incident.
• The standard goal time (SGT) for relocation compliance was 45 minutes or less. In 2010 the SGT was reduced to 35 minutes for an upright immobilized CV and 90 minutes for an overturned CV. This time was calculated as the time of disengagement at the approved safe haven, minus the notification time and the travel time from the closest platform to the incident location.
• The Contractor will

EVALUATION OF THE HEAVY TOW QUICK CLEARANCE PROGRAM
I-70 MOUNTAIN CORRIDOR Page 26
• The Contractor shall confirm any changes to the routing plan with CDOT before deploying resources to site by an alternate route.
• At least one tow vehicle be ready at each of the priority response platforms and each tow vehicle must have at least three axels with a GVR of at least 40,000 pounds. The boom capability needed is 25 Ton. The new contract recommends 35 ton or greater.
• CDOT provided space for The Contractor to store heavy towing resources at response platforms.
• The Contractor manned each of the response platforms with one licensed commercial vehicle operator for each required shift, except for the platform at the Eisenhower Tunnel where two operators were required.
• Vehicles compile with all safety and operational guidelines and pass all inspections by CDOT.
• The Heavy Tow operator safely relocates the disabled trucks to a safe haven, either an approved “drop site” near the I-70 exit ramps or a location on the roadside that will keep the shoulder clear. The relocation destination is based on the situation and the action that caused the least delay.
• Spills and debris are cleaned up by the Contractor as quick as possible. If the Contractor did not have the needed equipment to clean up the site, then they contacted the appropriate resource.
4.8.1 Key Performance Indicators It was very important that the Heavy Tow Program have achievable and measurable goals; therefore, Key Performance Indicators (KPIs) were established and enforced to maintain a quality service. Money incentives are provided by CDOT for the Contractor to meet the KPIs. The following KPI’s were developed from the original RFP:
• Heavy Tow Service KPI 1: The ability to meet the goal departure time of 5 minutes of less from the time of notification and order to dispatch
• Heavy Tow Service KPI 2: The ability to reopen the affects lanes in the goal time of 90 minutes for upright immobilized CVs and 150 minutes for overturned CVs. This time goal may be increased by CDOT based on the circumstance.

EVALUATION OF THE HEAVY TOW QUICK CLEARANCE PROGRAM
I-70 MOUNTAIN CORRIDOR Page 27
• Heavy Tow Service KPI 3: The ability to meet the goal clearance time of 45 minutes for upright immobilized CVs and 90 minutes for overturned CVs.
The Key Performance Indicators have been modified since the original RFP. The main KPI has become Lane Clearance Goal (KPI 3). This has become the most useable and measurable goal. The Lane Clearance times have also been reduced on the present contract to 35 minutes for upright immobilized CVs.
Below are the KPI formulas
t0 = Time of Incident
ta = Time of Dispatch
tb = Time wrecker left platform
tc = Time Arrived on Scene
td = Time Lane Cleared
te = Time Unit dropped at Safe haven or exiting ramp
tf = Time Back to Platform
T1= (tb )-(ta )
T1A= (tc )-(tb )
T2= (td )-(ta )
T3= (te )-(ta )-(T1A)
T4= (tf )-(te)

EVALUATION OF THE HEAVY TOW QUICK CLEARANCE PROGRAM
I-70 MOUNTAIN CORRIDOR Page 28
5.0 PURPOSE OF EVALUATION
The Heavy Tow Program endeavors to address pre-incident issues through rapid clearance and reduction of secondary crashes, the program is more accurately designed to address post-incident degradation to traffic flow and relieve congestion through means of early detection and resource deployment. Congestion along the I-70 corridor has reached critical levels. Its impacts are multi-faceted affecting the economic well-being of the communities it services, creating environmental hazards for one of the nation's most scenic and inspiring topographies, debilitating commerce mobility, and endangering the public safety. The efforts and design of the Heavy Tow Program mitigate traffic disruption due to the heavy truck incidents through early identification and response. It is this rapid response that promotes effective restoration of traffic flow thereby maintaining or improving capacity along the I-70 corridor.
This evaluation examines the performance of the I-70 Heavy Tow Program over the past four winter seasons and its effectiveness responding to and clearing disabled commercial vehicles through the Mountain Corridor. The purposes of the evaluation are to:
• Validate the design concepts of the initial program
• Assess the quantitative and qualitative performance measures
• Compare results of the program over the life of the program
• Determine achievement of objectives related to improved traffic flow
• Estimate effectiveness of the program
• Identify areas of improvement to modify future programs
The outcome of the report can assist CDOT in further understanding and mitigating the congestion impacts. Positive results from the evaluation can increase the support of stakeholders, businesses, residents, and visitors throughout the mountain corridor. An important benefit of the Program evaluation is a more advanced program can be developed for future years that can accommodate more needs of heavy vehicles and, eventually, passenger vehicles.

EVALUATION OF THE HEAVY TOW QUICK CLEARANCE PROGRAM
I-70 MOUNTAIN CORRIDOR Page 29
6.0 ECONOMIC IMPACTS
Visitors to the State of Colorado generate approximately $9 billion in revenue annually supporting hundreds of businesses and over 200,000 jobs. Visitors are always welcomed but also add to the problems with mobility and congestion along the corridor. The effects of I-70 congestion is a State-wide impact that begins in the small mountain communities gridlocked by peak hour commuters and reverberates through the businesses, workforce, health care, back yards and bank accounts of every taxpaying citizen in the State of Colorado. Improvements and alternative facilities will certainly improve the level of service and relieve congestion to some degree, but it is unlikely that congestion will ever completely be mitigated along the I-70 corridor. Based on 2005 dollars, The Impact of I-70 Congestion on Colorado analysis summarized the impacts and costs associated with congestion by estimating the total expense in terms of losses for the following categories: Tourism, Residents, Business and Government. The results were estimated to be roughly $839 billion per year -- far outweighing the actual cost of the proposed alternative projects and improvements in their totality.
Industry Impacts: The June 17, 2008, issue of the Denver Business Journal - City Guide referenced a report by Longwoods tallying a Colorado tourism record in 2007 of 28 million visitors generating over $9.8 billion in revenue and representing a 10 percent jump between 2006 and 2007. A predominant generator of tourism in the mountain region includes the seventeen major ski resorts that utilize the I-70 corridor. As congestion continues to plague the I-70 corridor and traffic forecasts come to fruition, the risk that tourists will find alternative destinations is a realistic concern to both business owners as well as residents. The cost of congestion along the corridor given the growing revenues between 2005 and 2007 could be substantial with the brunt of the impact affecting communities and businesses that support the traveling public.
Resident Impacts: Local residents that live along the I-70 Mountain Corridor are also burdened with the impacts and potential risks the I-70 corridor congestion poses to their local economies, quality of life and personal health. Short local commutes can quickly become long delays with already congested roads becoming clogged due to winter storms and weather related accidents.
Environmental Impacts: Where there is sustained congestion, there will also be the associated environmental impacts and resulting health risks for residents. The current and forecasted usage of the I-70 corridor, residents are left with the residual impacts to their environment and to their air quality.

EVALUATION OF THE HEAVY TOW QUICK CLEARANCE PROGRAM
I-70 MOUNTAIN CORRIDOR Page 30
Business Impacts: Colorado's diverse cultural, scenic and resort attractions have historically been an economic draw for businesses and personnel recruitment. Congestion along the corridor affects the business climate in at least three fundamental ways: increases operating costs associated with the distribution of goods, increases commuter costs reducing work force availability as well as productivity, and increases operating costs driving prices higher and profits lower.
Government Impacts: Colorado retail sales in 2005 totaled more than $4.6 billion with over 50 percent of the sales generated in the Mountain Resort Region. If the I-70 corridor congestion becomes a deterrent for tourism it would negatively impact state government and local mountain governments due to the loss in tax revenue.
Construction Impacts: The increase in traffic accelerates the deterioration of roadway and corridor infrastructure adding to both the list of congestion impacts and the expense of facility maintenance. CDOT estimates that the annual cost to maintain the I-70 corridor is approximately $17 million without improvements. This only includes the operational and maintenance costs associated with weather related activities, re-paving and basic upgrades.
7.0 DATA COLLECTION
Data is recorded by the Contractor , the Tow Truck drivers, and CDOT personnel. To track and evaluate the Program, information pertaining to each incident was needed including: location of incident, response time, tow truck travel time, clearing time, weather condition, etc. The data for each incident is collected both by hand and by the GPS systems in each tow truck that is provided by contractor.
7.1 GPS North America
The GPS systems are linked to a tracking system available online through GPS North America (www.gpsnorthamerica.com). Figure 3.1 illustrates the capabilities of the tracking system. It can be seen where the wrecker is currently located and what time they arrived at that location. The GPS unit records every time the wrecker moves, including departure time, time of travel, distance to destination, and arrival time of destination. It also recorded the destination location’s street address (including city and zip code) and the maximum speed during the traveling between points. This system allows both the contractor and CDOT to

EVATHE
I-70
moniinclu
7.2
Alonhanddocuan exeachtimesdispaclearlogs off loDOTweatinformor nthey chainimpohighw
ALUATION E HEAVY TO
MOUNTAIN
itor the Prding all the
Figur
Driver
g with the d record ument morexample of a
h incident s associaatch, deparrance, andalso includ
ocation, trucT number)ther. Somation thatot the chainwere the t
ns were onortant to theway closur
OF TOW QUICK
IN CORRID
rogram ande important
re 8.1 Examp
Logs
GPS trackithe times
e detail of ea completethe driver
ated with rture, arrivad return tode incidentck details (), lane(s) ome otht is recordn laws weretow truck d or not. Th
e program tres and wh
K CLEARA
DOR
d actions tatimes need
ple of GPS No
ng systemand detai
each incided driver logr recorded
the incil, lanes cle
o platform. t location, d(vehicle and
blocked,her impoded is whe in effect a
driver recordhe data andto further unhat the rea
ANCE PROG
aken by theded to calcu
orth America
, the tow trls of each
ent than theg. For d the dent: ared,
The drop-d US
and ortant ether and if ds if
d commentsnderstand waction of t
GRAM
e tow truckulate the KP
a Online Trac
ruck driversh incident. e GPS unit
s received what type othe comme
ks during eaPIs.
cking System
s and CDODrivers a
ts. Figure 3
by the drivof incidentsercial truck
Page 31
ach inciden
m
OT personnere able t3.2 provide
ver’s is vers created thks was. Th
nt
el to es
ry he he

EVATHE
I-70
wreccoinc
7.3
CDOcameeachview recor
ALUATION E HEAVY TO
MOUNTAIN
cker driverscide with th
CDOT
OT also receras and ca
h incident, in the traf
rd the detai
OF TOW QUICK
IN CORRID
also take e driver log
F
Data
cords the alls. The CDsimilar to tffic control ils of each
K CLEARA
DOR
photograpgs.
Figure 8.2 Ex
details of DOT persothe driver lcenter. Figincident an
ANCE PROG
hs of the in
ample of a D
each incidnnel recordogs, with tgure 3.3 shd the towin
GRAM
ncidents an
Driver Log
dent that thds many ofthe video dhows the fong units.
d commerc
hey receivef the importdata they worm used b
Page 32
cial trucks t
ed from thtant times owere able tby CDOT t
to
he of to to

EVATHE
I-70
ALUATION E HEAVY TO
MOUNTAIN
OF TOW QUICK
IN CORRID
Fig
K CLEARA
DOR
gure 8.3 CDO
ANCE PROG
OT Incident L
GRAM
Log (HTSU)
Page 33
EVALUATION OF THE HEAVY TOW QUICK CLEARANCE PROGRAM
I-70 MOUNTAIN CORRIDOR Page 34
8.0 RESULTS: HEAVY TOW PROGRAM SERVICES
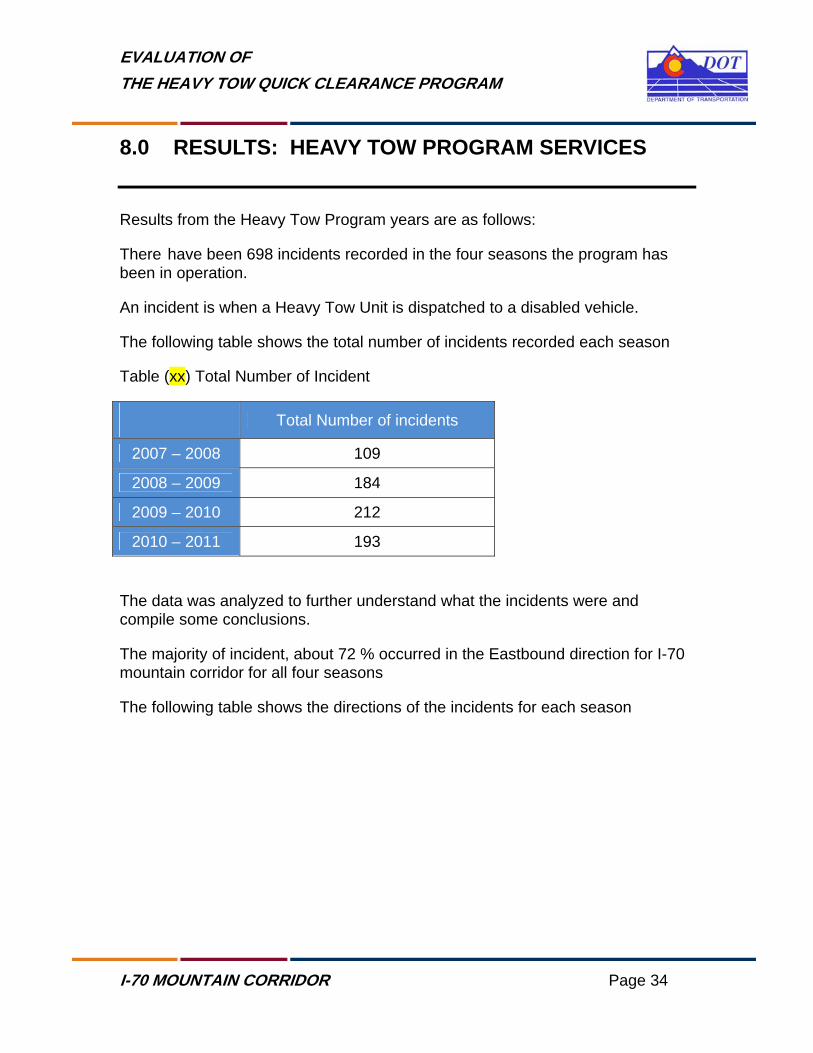
Results from the Heavy Tow Program years are as follows:
There have been 698 incidents recorded in the four seasons the program has been in operation.
An incident is when a Heavy Tow Unit is dispatched to a disabled vehicle.
The following table shows the total number of incidents recorded each season
Table (xx) Total Number of Incident
Total Number of incidents
2007 – 2008 109
2008 – 2009 184
2009 – 2010 212
2010 – 2011 193
The data was analyzed to further understand what the incidents were and compile some conclusions.
The majority of incident, about 72 % occurred in the Eastbound direction for I-70 mountain corridor for all four seasons
The following table shows the directions of the incidents for each season
EVALUATION OF THE HEAVY TOW QUICK CLEARANCE PROGRAM
I-70 MOUNTAIN CORRIDOR Page 35
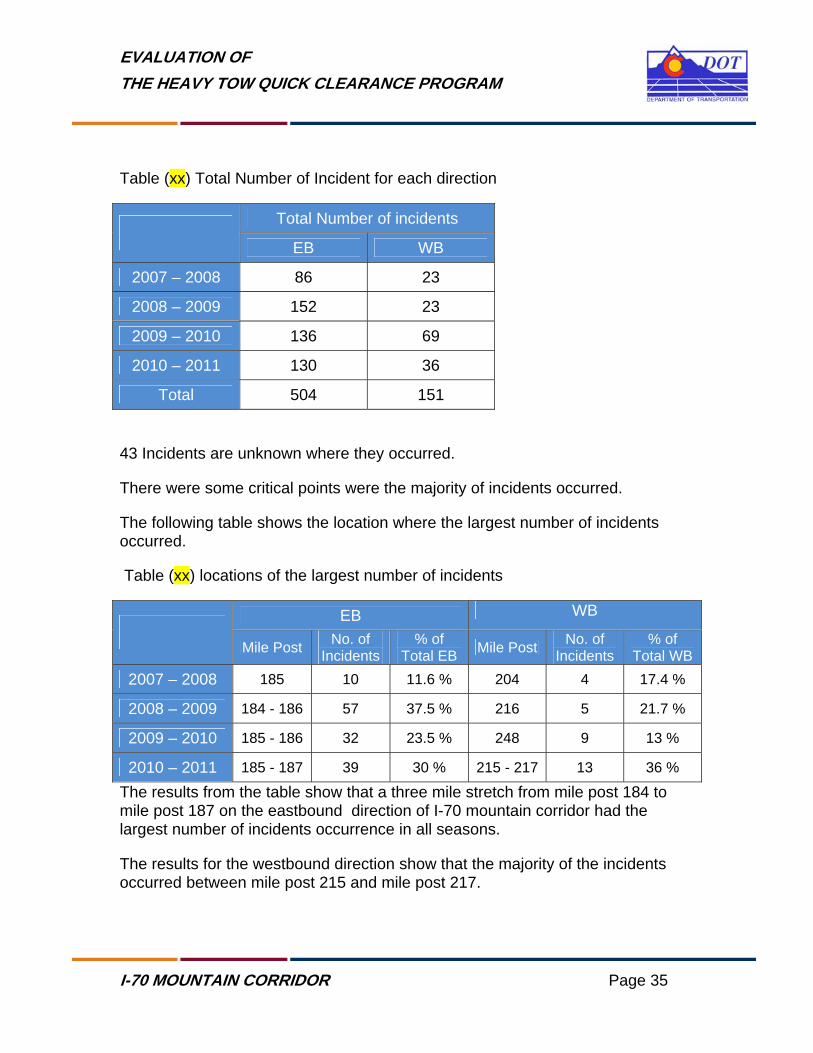
Table (xx) Total Number of Incident for each direction
Total Number of incidents
EB WB
2007 – 2008 86 23
2008 – 2009 152 23
2009 – 2010 136 69
2010 – 2011 130 36
Total 504 151
43 Incidents are unknown where they occurred.
There were some critical points were the majority of incidents occurred.
The following table shows the location where the largest number of incidents occurred.
Table (xx) locations of the largest number of incidents
EB WB
Mile Post No. of Incidents
% of Total EB Mile Post No. of
Incidents % of
Total WB 2007 – 2008 185 10 11.6 % 204 4 17.4 %
2008 – 2009 184 - 186 57 37.5 % 216 5 21.7 %
2009 – 2010 185 - 186 32 23.5 % 248 9 13 %
2010 – 2011 185 - 187 39 30 % 215 - 217 13 36 %
The results from the table show that a three mile stretch from mile post 184 to mile post 187 on the eastbound direction of I-70 mountain corridor had the largest number of incidents occurrence in all seasons.
The results for the westbound direction show that the majority of the incidents occurred between mile post 215 and mile post 217.

EVALUATION OF THE HEAVY TOW QUICK CLEARANCE PROGRAM
I-70 MOUNTAIN CORRIDOR Page 36
The following table shows the number of incidents that occurred in each county for the four seasons.
Table (xx) Incidents occurred in each county
Number of incidents
Eagle Summit Clear Creek Jefferson
2007 – 2008 33 70 6 0
2008 – 2009 93 71 11 0
2009 – 2010 57 72 76 0
2010 – 2011 61 71 27 6
Total 244 284 120 6
The table shows that the majority of the incidents, approximately forty-three percent (43%) occurred within the Summit County and thirty-seven percent (37%) of all the incidents occurred within the Eagle County.
Operational Periods
The following table shows the total days for the operational period and the total days operational during Operational Period for all four seasons.
Table (xx) Days for the Operational Period and the Days Operational during Operational Period
Days for the Operational
Period
Days Operational During
Operational Period
Percent of Days Operational
During Operational
period 2007 – 2008 114 26 22.8 %
2008 – 2009 152 53 34.9 %
2009 – 2010 161 63 39.1 %

EVALUATION OF THE HEAVY TOW QUICK CLEARANCE PROGRAM
I-70 MOUNTAIN CORRIDOR Page 37
2010 – 2011 152 55 36.1 %
Total 579 197 34 %
The following table shows the total hours for the operational period and the total hours operational during the operational period and the percent of total time utilized.
The utilization time is based on the total operational period versus the actual time the Heavy Tow Units are operational.
Table (xx) Hours for the operational period, hours operational during the operational period and the percent of total time utilized for each of the four seasons.
Hours for the Operational
Period
Hours Operational During
Operational Period
Percent of Total Time Utilized
2007 – 2008 2,736 208 7.6 %
2008 – 2009 3,648 424 11.6 %
2009 – 2010 3,864 504 13 %
2010 – 2011 3,648 440 12 %
Total 13,896 1,576 11.3 % The results from the table show that program utilization throughout the four seasons has been relatively low compare to the total operation period.

EVALUATION OF THE HEAVY TOW QUICK CLEARANCE PROGRAM
I-70 MOUNTAIN CORRIDOR Page 38
The following table shows the number of lanes cleared for each of the four seasons.
Table (xx) Number of Lane Clearances
Number of Lane Clearances
2007 – 2008 127
2008 – 2009 217
2009 – 2010 245
2010 – 2011 214
Total 803
The following table shows the number of Commercial Vehicles Relocated for each of the four seasons.
Table (xx) Number of Commercial Vehicles Relocated
Number of Commercial Vehicles Relocated
2007 – 2008 109
2008 – 2009 166
2009 – 2010 205
2010 – 2011 185
Total 665

EVALUATION OF THE HEAVY TOW QUICK CLEARANCE PROGRAM
I-70 MOUNTAIN CORRIDOR Page 39
Performance
The following table shows the average clearance time for each of the four seasons.
Table (xx) Average Clearance Time
Average Clearance Time ( min)
2007 – 2008 27
2008 – 2009 23
2009 – 2010 23
2010 – 2011 22 The results from the table show that the average clearance time improved from the initial year of the program (2007-2008) by twenty-two percent (22%) in the most recent season (2010-2011).
The following table shows a comparison in cost of the blockage without the Heavy Tow Program versus with the Heavy Tow program and the reduction in loss of revenue with use of Heavy Tow.
Table (xx) Reduction in Loss of Revenue with use of Heavy Tow for each of the four seasons.
The Cost Without the use of HT ($)
The Cost with the use of HT ($)
Reduction in Loss of Revenue ($)
2007 - 2008 22,013,327.83 11,853,330.37 10,159,997.45
2008 - 2009 37,613,323.93 16,636,662.51 20,976,661.42
2009 - 2010 42,466,656.05 18,783,328.64 23,683,327.41
2010 - 2011 37,093,324.06 15,693,329.41 21,399,994.65

EVALUATION OF THE HEAVY TOW QUICK CLEARANCE PROGRAM
I-70 MOUNTAIN CORRIDOR Page 40
Key Performance Indicators
Data collection using the program KPI's are both quantitative and qualitative making the effectiveness of the program relatively determinate.
Key Performance Indicators (KPIs) were established and enforced to maintain a quality service
From the data collected by the drivers and compiled by General Contractor, the various times included in the KPI timeline were analyzed.
Dispatch Response Time
The dispatch response time (KPI 1) was the time the wrecker received the dispatch call till the time it left the platform.
The following figures graphically present the dispatch times for each of the four seasons.
(2007 – 2008) Season
From the following figure, it can be seen that approximately sixty percent (60%) of all incidents had an instantaneous dispatch response time which is equal to zero minutes.
All wreckers were able to leave the platform within five (5) minutes or less of the dispatch call, which indicates that all incidents were able to reach the goal of KPI1, which was a dispatch time of less than five (5) minutes.

EVALUATION OF THE HEAVY TOW QUICK CLEARANCE PROGRAM
I-70 MOUNTAIN CORRIDOR Page 41
Figure (x.x) Dispatch Response Time for (2007–2008) season
2008 – 2009 Season
From the following figure, it can be seen that approximately ninety- two percent (92%) of all incidents had an instantaneous dispatch response time which is equal to zero minutes.
All wreckers were able to leave the platform within five (5) minutes of the dispatch call, which indicates that all incidents were able to reach the goal of KPI1, which was a dispatch time of less than five (5) minutes.
65
19
11 84 2
0
10
20
30
40
50
60
70
0:00 0:01 0:02 0:03 0:04 0:05
Num
ber o
f Inciden
ts
Minutes
Dispatch Response Time

EVALUATION OF THE HEAVY TOW QUICK CLEARANCE PROGRAM
I-70 MOUNTAIN CORRIDOR Page 42
Figure (x.x) Dispatch Response Time for (2008–2009) season
2009 – 2010 Season
From the following figure, it can be seen that approximately ninety percent (90%) of all incidents had an instantaneous dispatch response time which is equal to zero minutes.
All wreckers were able to leave the platform within five (5) minutes of the dispatch call, which indicates that all incidents were able to reach the goal of KPI1, which was a dispatch time of less than five (5) minutes.
137
18
2 0 00
20
40
60
80
100
120
140
160
0:00 0:01 0:02 0:03 0:04 0:05
Num
ber o
f Inciden
ts
Minutes
Dispatch Response Time

EVALUATION OF THE HEAVY TOW QUICK CLEARANCE PROGRAM
I-70 MOUNTAIN CORRIDOR Page 43
Figure (x.x) Dispatch Response Time for (2009–2010) season
2010 – 2011 Season
From the following figure, it can be seen that approximately eighty- nine percent (89%) of all incidents had an instantaneous dispatch response time which is equal to zero minutes.
All wreckers were able to leave the platform within five (5) minutes of the dispatch call, which indicates that all incidents were able to reach the goal of KPI1, which was a dispatch time of less than five (5) minutes.
121
5 7 0 1 00
20
40
60
80
100
120
140
0:00 0:01 0:02 0:03 0:04 0:05
Num
ber o
f Inciden
ts
Minutes
Dispatch Response Time

EVALUATION OF THE HEAVY TOW QUICK CLEARANCE PROGRAM
I-70 MOUNTAIN CORRIDOR Page 44
Figure (x.x) Dispatch Response Time for (2010–2011) season
Travel Time
The travel time for each event was measured as the time from the platform to the location of the incident.
The following figures graphically present the travel times of all the events for each season.
2007 – 2008 Season
The following graph shows that forty percent (40%) of the time the wreckers were able to get to the scene of the immobilized commercial vehicle under five (5) minutes.
118
9 6 0 0 00
20
40
60
80
100
120
140
0:00 0:01 0:02 0:03 0:04 0:05
Num
ber o
f Inciden
ts
Minutes
Dispatch Response Time

EVALUATION OF THE HEAVY TOW QUICK CLEARANCE PROGRAM
I-70 MOUNTAIN CORRIDOR Page 45
Eighty-four percent (84%) of all incidents had a travel time less than twenty (20) minutes.
Figure (x.x) Travel Time for (2007–2008) season
2008 – 2009 Season
The following graph shows that seventy- three percent (73%) of the time the wreckers were able to get to the scene of the immobilized commercial vehicle under five (5) minutes.
Ninety-two percent (92%) of all incidents had a travel time less than twenty (20) minutes.
46
16 15 14
36
3 2 04
05101520253035404550
0 to 5 6 to 10 11 to15
16 to20
21 to25
26 to30
31 to35
36 to40
41 to45
Over45
Num
ber o
f Inciden
ts
Minutes
Travel Time

EVALUATION OF THE HEAVY TOW QUICK CLEARANCE PROGRAM
I-70 MOUNTAIN CORRIDOR Page 46
Figure (x.x) Travel Time for (2008–2009) season
2009 – 2010 Season
The following graph shows that eighty-three percent (83%) of the time the wreckers were able to get to the scene of the immobilized commercial vehicle under five (5) minutes.
Ninety-nine percent (99%) of all incidents had a travel time less than twenty (20) minutes.
108
10 12 7 4 3 3 0 0 10
20
40
60
80
100
120
0 to 5 6 to 10 11 to15
16 to20
21 to25
26 to30
31 to35
36 to40
41 to45
Over45
Num
ber o
f Inciden
ts
Minutes
Travel Time

EVALUATION OF THE HEAVY TOW QUICK CLEARANCE PROGRAM
I-70 MOUNTAIN CORRIDOR Page 47
Figure (x.x) Travel Time for (2009–2010) season
2010 – 2011 Season
The following graph shows that fifty-eight percent (58%) of the time the wreckers were able to get to the scene of the immobilized commercial vehicle under five (5) minutes.
Ninety-two percent (92%) of all incidents had a travel time less than twenty (20) minutes.
112
153 3 1 0 0 0 0 0
0
20
40
60
80
100
120
0 to 5 6 to 10 11 to15
16 to20
21 to25
26 to30
31 to35
36 to40
41 to45
Over45
Num
ber o
f Inciden
ts
Minutes
Travel time

EVALUATION OF THE HEAVY TOW QUICK CLEARANCE PROGRAM
I-70 MOUNTAIN CORRIDOR Page 48
Figure (x.x) Travel Time for (2010–2011) season
Lane Clearance Time One of the most important measurements is the lane clearance time, which is the time it took from when the tow truck received the dispatch call to the time the lane was cleared. This is KPI 2 with the goal of clearing the lane in 90 minutes for an upright immobilized commercial vehicle (UICV) or 150 minutes for an overturned commercial vehicle (OCV).
The following figures graphically presents the lane clearance time for each season.
2007 – 2008 Season
From the following figure, it can be seen that nearly half of all events cleared the blocked lanes in less than 20 minutes.
The average for the lane clearance time of the all incidents analyzed was 28 minutes.
77
2614
5 2 4 1 0 0 30102030405060708090
0 to 5 6 to 10 11 to15
16 to20
21 to25
26 to30
31 to35
36 to40
41 to45
Over45
Num
ber o
f Inciden
ts
Minutes
Travel Time

EVALUATION OF THE HEAVY TOW QUICK CLEARANCE PROGRAM
I-70 MOUNTAIN CORRIDOR Page 49
Figure (x.x) Lane Clearance Time for (2007–2008) season
2008 – 2009 Season
From the following figure, it can be seen that approximately seventy-two percent (72%) of all events cleared the blocked lanes in less than 20 minutes.
The average for the lane clearance time of the all incidents analyzed was 23 minutes.
3
17
12
21
11 12
1
8
4
20
0
5
10
15
20
25
0 to 5 6 to 10 11 to15
16 to20
21 to25
26 to30
31 to35
36 to40
41 to45
Over45
Num
ber o
f Inciden
ts
Minutes
Lane Clearance Time

EVALUATION OF THE HEAVY TOW QUICK CLEARANCE PROGRAM
I-70 MOUNTAIN CORRIDOR Page 50
Figure (x.x) Lane Clearance Time for (2008–2009) season
2009 – 2010 Season
From the following figure, it can be seen that approximately eighty-five percent (85%) of all events cleared the blocked lanes in less than 20 minutes.
The average for the lane clearance time of the all incidents analyzed was 23 minutes.
6
45 46
12 148 7
2 5 6
05101520253035404550
0 to 5 6 to 10 11 to15
16 to20
21 to25
26 to30
31 to35
36 to40
41 to45
Over45
Num
ber o
f Inciden
ts
Minutes
Lane Clearance time

EVALUATION OF THE HEAVY TOW QUICK CLEARANCE PROGRAM
I-70 MOUNTAIN CORRIDOR Page 51
Figure (x.x) Lane Clearance Time for (2009–2010) season
2010 – 2011 Season
From the following figure, it can be seen that approximately seventy-seven percent (77%) of all events cleared the blocked lanes in less than 20 minutes.
The average for the lane clearance time of the all incidents analyzed was 22 minutes.
47
36
22
97
8
1 1 03
05101520253035404550
0 to 5 6 to 10 11 to15
16 to20
21 to25
26 to30
31 to35
36 to40
41 to45
Over45
Num
ber o
f Inciden
ts
Minutes
Lane Clearance Time

EVALUATION OF THE HEAVY TOW QUICK CLEARANCE PROGRAM
I-70 MOUNTAIN CORRIDOR Page 52
Figure (x.x) Lane Clearance Time for (2010–2011) season
Performance Time
Another of the KPIs was the performance time, which is time from when the wrecker arrived on scene to the time it cleared the scene or disengaged the commercial vehicle at a safe haven. The third KPI goal was that the performance time was to be under 45 minutes for an upright immobilized commercial vehicle (UICV).
In 2010-2011 season the performance KPI was reduced to 35 minutes for an upright immobilized commercial vehicle (UICV).
The following figures graphically presents the performance time for each season.
2007 – 2008 Season
The following graph shows that Over sixty percent (60%) of all incidents had a performance time under fifteen (15) minutes.
Only seven (7) incidents were not able to meet the KPI goal of 45 minutes or less.
30
4637
24
158
4 5 4 5
05101520253035404550
0 to 5 6 to 10 11 to15
16 to20
21 to25
26 to30
31 to35
36 to40
41 to45
Over45
Num
ber o
f Inciden
ts
Minutes
Lane Clearance Time

EVALUATION OF THE HEAVY TOW QUICK CLEARANCE PROGRAM
I-70 MOUNTAIN CORRIDOR Page 53
Figure (x.x) Performance Time for (2007–2008) season
2008 – 2009 Season
The following graph shows that eighty percent (80%) of all incidents had a performance time under fifteen (15) minutes.
Only four (4) incidents were not able to meet the KPI goal of 45 minutes or less.
10
2830
13
7 83
12
7
0
5
10
15
20
25
30
35
0 to 5 6 to10
11 to15
16 to20
21 to25
26 to30
31 to35
36 to40
41 to45
Over45
Num
ber o
f Inciden
ts
Minutes
Performance Time

EVALUATION OF THE HEAVY TOW QUICK CLEARANCE PROGRAM
I-70 MOUNTAIN CORRIDOR Page 54
Figure (x.x) Performance Time for (2008–2009) season
2009 – 2010 Season
The following graph shows that Over seventy-eight percent (78%) of all incidents had a performance time under fifteen (15) minutes.
Only three (3) incidents were not able to meet the KPI goal of 45 minutes or less.
15
5647
136
51 1 0
40
10
20
30
40
50
60
0 to 5 6 to10
11 to15
16 to20
21 to25
26 to30
31 to35
36 to40
41 to45
Over45
Num
ber o
f Inciden
ts
Minutes
Performance Time
20
51
34
12
4 3 2 4 1 30
10
20
30
40
50
60
0 to 5 6 to10
11 to15
16 to20
21 to25
26 to30
31 to35
36 to40
41 to45
Over45
Num
ber o
f Inciden
ts
Minutes
Performance Time

EVALUATION OF THE HEAVY TOW QUICK CLEARANCE PROGRAM
I-70 MOUNTAIN CORRIDOR Page 55
Figure (x.x) Performance Time for (2009–2010) season
2010 – 2011 Season
The following graph shows that over forty-three percent (43%) of all incidents had a performance time under fifteen (15) minutes.
In (2010-2011) season the performance time dropped from 45 minutes to 35 minutes.
Thirteen (13) incidents were not able to meet the KPI goal of 35 minutes or less.
Figure (x.x) Performance Time for (2010–2011) season
Travel Return Time
The travel return time was measured from the time the wrecker cleared the scene or disengaged from the troubled CV to the time it returns to the platform.
The following figures graphically presents the travel return time for each season.
6
2326
29
1311
5 5 4 4
0
5
10
15
20
25
30
35
0 to 5 6 to10
11 to15
16 to20
21 to25
26 to30
31 to35
36 to40
41 to45
Over45
Num
ber o
f Inciden
ts
Minutes
Performance Time

EVALUATION OF THE HEAVY TOW QUICK CLEARANCE PROGRAM
I-70 MOUNTAIN CORRIDOR Page 56
2007 – 2008 Season
The following graph shows that approximately fifty percent (50%) of all incidents were able to return to their platform from the scene or safe haven within five (5) minutes.
Figure (x.x) Travel Return Time for (2007–2008) season
2008 – 2009 Season
The following graph shows that approximately fifty-seven percent (57%) of all incidents were able to return to their platform from the scene or safe haven within five (5) minutes.
54
2015
5 3 5 3 0 1 30
10
20
30
40
50
60
0 to 5 6 to 10 11 to15
16 to20
21 to25
26 to30
31 to35
36 to40
41 to45
Over45
Nun
ber o
f Inciden
ts
Minutes
Travel Return Time

EVALUATION OF THE HEAVY TOW QUICK CLEARANCE PROGRAM
I-70 MOUNTAIN CORRIDOR Page 57
Figure (x.x) Travel Return Time for (2008–2009) season
2009 – 2010 Season
From the available data, the following graph shows that approximately eighty-two percent (82%) of all incidents were able to return to their platform from the scene or safe haven within five (5) minutes.
73
17 1710 5
2 1 1 1 001020304050607080
0 to 5 6 to 10 11 to15
16 to20
21 to25
26 to30
31 to35
36 to40
41 to45
Over45
Num
ber o
f Inciden
ts
Minutes
Travel Return Time
62
75 1 0 0 0 0 0 0
0
10
20
30
40
50
60
70
0 to 5 6 to 10 11 to15
16 to20
21 to25
26 to30
31 to35
36 to40
41 to45
Over45
Num
ber o
f Inciden
ts
Minutes
Travel Return Time

EVALUATION OF THE HEAVY TOW QUICK CLEARANCE PROGRAM
I-70 MOUNTAIN CORRIDOR Page 58
Figure (x.x) Travel Return Time for (2009–2010) season
2010 – 2011 Season
The following graph shows that approximately fifty-nine percent (59%) of all incidents were able to return to their platform from the scene or safe haven within five (5) minutes.
Figure (x.x) Travel Return Time for (2010–2011) season
Colorado chain laws
Colorado chain laws apply to every state highway, federal highway and interstate throughout the state. In addition, Colorado law requires that commercial vehicle carry chains in/on the vehicle while traveling on I-70 between mileposts 163 and 259 (Edwards to Morrison) from September 1st through May 31st and they must be used when required. There are two levels of the chain law. The first level applies to all single-axle combination commercial vehicles and requires them to
35
96
2 0 2 1 2 2 00510152025303540
0 to 5 6 to 10 11 to15
16 to20
21 to25
26 to30
31 to35
36 to40
41 to45
Over45
Num
ber o
f Inciden
ts
Minutes
Travel Return Time

EVALUATION OF THE HEAVY TOW QUICK CLEARANCE PROGRAM
I-70 MOUNTAIN CORRIDOR Page 59
be chained-up. Level 2 requires chains for all commercial vehicles. There are ten chain up areas on the eastbound side and eight on the westbound side. Truck drivers are urged to chain up/down in the designated chain stations for their safety.
The following table shows the number of incidents that occurred while the chain law was in effect and while the chain law was not in effect.
Table (xx) Incidents occurred while the chain law was in effect versus while the chain law was not in effect.
Number of incidents Chain law was in
effect Chain law was
not in effect 2007 - 2008 79 25
2008 - 2009 152 14
2009 - 2010 190 15
2010 - 2011 134 59
Total 555 113
The following table shows the number of trucks that had chains installed versus the number of trucks that did not have chains installed while the chain law was in effect.
Number of Trucks involved with
incident Chained Not Chained
2007 - 2008 43 53
2008 - 2009 99 59
2009 - 2010 63 67
2010 - 2011 103 74
Total 308 253

EVALUATION OF THE HEAVY TOW QUICK CLEARANCE PROGRAM
I-70 MOUNTAIN CORRIDOR Page 60
The fiscal impacts correlated with reduced delay in terms of dollars per unit of time, improved air quality, the reduction of secondary crashes and the improved safety of responders, incident victims and other motorists are likely to be substantial.
The heavy Tow Program data collection and analysis focused on the primary effects of congestion mitigation through the reduction of heavy truck incidents and related roadway closures. Through reduced detection and verification time, expedient and appropriate response deployment and rapid clearance, managed recovery of traffic flow resumes. The correlation between the rapid clearance and recovery time and the decrease in traffic disruption is another indicator with potentially significant impact. For every minute of roadway closure, there is a residual effect that ripples through the queue of blocked vehicles and represents an exponential component in the time required to restore normal traffic flow and relieve congestion.
Data collected from CDOT, as displayed here in Tables (X1 - X3), provides a record of comparison between the number of heavy truck related accidents and the total time attributed to roadway closures along the I-70 corridor during the snow seasons between 2007 and 2011.
Table (xx) Number of Closure due to Non-Accidents involving Semi-Trucks
Number of Closures Total Time Closed
Both EB WB Total Hr Min
2007 - 2008 Road 2 2 4 8 14 9
Lane 0 242 66 308 27 19
Year Total 2 244 70 316 290 28
2008 - 2009 Road 0 0 0 0 0 0
Lane 0 111 23 134 121 26

EVALUATION OF THE HEAVY TOW QUICK CLEARANCE PROGRAM
I-70 MOUNTAIN CORRIDOR Page 61
Year Total 0 111 23 134 121 26
2009 - 2010 Road 0 5 3 8 10 4
Lane 0 65 31 96 72 17
Year Total 0 70 34 104 82 21
2010 - 2011 Road 0 0 0 0 0 0
Lane 0 113 41 154 132 52
Year Total 0 113 41 154 132 52
Table (xx) Number of Closure due to Accidents Involving Semi-Trucks
Number of Closures Total Time Closed
Both EB WB Total Hr Min
2007 - 2008 Road 3 29 29 61 159 57
Lane 1 30 64 95 100 38
Year Total 4 59 93 156 260 35
2008 - 2009 Road 0 11 12 23 44 57
Lane 0 18 6 24 23 11
Year Total 0 29 18 47 68 8
2009 - 2010 Road 4 9 11 24 68 4
Lane 0 17 7 24 82 29

EVALUATION OF THE HEAVY TOW QUICK CLEARANCE PROGRAM
I-70 MOUNTAIN CORRIDOR Page 62
Year Total 4 26 18 48 150 33
2010 - 2011 Road 3 6 14 23 77 33
Lane 0 8 8 16 31 49
Year Total 3 14 22 39 109 22
Table (xx) Number of Closure due to the Weather
Number of Closures Total Time Closed
Both EB WB Total Hr Min
2007 - 2008 Road 6 7 7 20 93 32
Lane 0 0 0 0 0 0

EVALUATION OF THE HEAVY TOW QUICK CLEARANCE PROGRAM
I-70 MOUNTAIN CORRIDOR Page 63
Year Total 6 7 7 20 93 32
2008 - 2009 Road 11 9 5 25 69 17
Lane 0 0 0 0 0 0
Year Total 11 9 5 25 69 17
2009 - 2010 Road 6 2 4 12 34 47
Lane 0 0 0 0 0 0
Year Total 6 2 4 12 34 47
2010 - 2011 Road 15 5 11 31 84 4
Lane 0 0 0 0 0 0
Year Total 15 5 11 31 84 4
9.0 CONCLUSIONS AND RECOMMENDATIONS
This chapter will be a brief summary to conclude the evaluation of the
Next year, put a phone number/e-mail on the card
Adjustments will continue to be made to the terms and conditions of contracted services that could be incorporated in a subsequent version of the program.
However, expanding the data collection to include available information from weather stations, feedback from response personnel and user surveys as well as incident data reports would further refine the cost-benefit analysis of the program by factoring in the secondary cost-benefits that are as of yet not included in the equation.

EVALUATION OF THE HEAVY TOW QUICK CLEARANCE PROGRAM
I-70 MOUNTAIN CORRIDOR Page 64
Given that growth projections and traffic forecasts also indicate that roadway widening and similar improvements will not completely eradicate congestion along the I-70 corridor, there is an added emphasis on the importance of periodic analysis and re-evaluation of the program.
Cassie says “Our program doesn’t necessarily stop the accidents from occurring, it just improves the response”.- We need to state what we are evaluating, and why the truck events may not decrease because of the program.
Year to year conditions are worsening- this is a remedial program.
9.1 Were the goals and objectives met?
9.2 What was improved with the implementation of the Pilot Program?
9.3 What do the performance measures indicate?
9.4 What is the cost/benefit?
9.5 What is the overall effectiveness of the Pilot Program?
9.6 What could be improved?

EVALUATION OF THE HEAVY TOW QUICK CLEARANCE PROGRAM
I-70 MOUNTAIN CORRIDOR Page 65
10.0 GLOSSARY
Heavy Tow. A pilot program implemented by CDOT to quickly re-open lanes blocked by commercial vehicles on I-70 in Region One during heavy traffic periods in the Winter when Ski Resorts are open.
CDOT. The Colorado Department of Transportation.
EJMT. Eisenhower and Johnson Memorial Tunnels.
5.1.1 Heavy Tow Service Unit (Service Unit): A heavy tow vehicle (25 ton or greater) and a qualified crew.
5.1.2 Qualified Crew: One operator/driver who meets training and experience requirements, and when
required, an additional qualified operator or an assistant operator in training.
5.1.3 Shift: A period normally eight hours in duration while a service unit is in place at an emergency
response platform.
5.1.4 Emergency Response Platform (Platform): The stationary location of a Service Unit during a shift prior
to dispatch to clear a lane.
5.1.5 Chain Station: A location within I-70 right-of-way provided by CDOT to facilitate application or removal
of chains in accordance with Colorado chain law.
5.1.6 Chain Assistance: The sale and application of appropriate chains to a Commercial Vehicle operator, or
assistance for a fee with application of chains owned by the operator, or assistance for a fee with
removal and re-storage of chains at a CDOT chain station, with all fees for sales and services being
market based, predetermined, fixed and approved in writing by CDOT.

EVALUATION OF THE HEAVY TOW QUICK CLEARANCE PROGRAM
I-70 MOUNTAIN CORRIDOR Page 66
5.1.7 Chain Assistance Service Unit (Chain Unit): A vehicle and properly trained operator dedicated to
providing chain assistance under the terms of this contract.
5.1.8 Chain Assistance Interval (Interval): A time interval during which CDOT implements a restriction with
any Code of the Colorado Chain Law, and the Code is in effect on any portion and direction of I-70
between milepost 177 and 263. The interval starts upon activation of a Variable Message Sign placing
the code in effect, and ends two hours after the restriction is lifted, to cover chain removal activity after
the restriction is lifted.
5.1.9 Commercial Vehicle: Any vehicle with three or more axles.
5.1.10 Drop Site: Any business location to which the Contractor can legally relocate and disengage from the
immobilized Commercial Vehicle.
5.1.11 Safe Haven: The closest available space to which an immobilized Commercial Vehicle can be relocated
and legally disengaged where it no longer creates or worsens congested traffic flow conditions or
creates a hazard to road users. All drop sites are also safe havens, but all safe havens are not
necessarily business locations. The Contractor may propose Safe Haven sites on CDOT property
and/or in protected CDOT right of way 30 feet from the closest traveled lane. Safe Havens must be
approved by CDOT. I-70 Turnarounds shall not be approved as Safe Havens if they become unusable
as a result.

EVALUATION OF THE HEAVY TOW QUICK CLEARANCE PROGRAM
I-70 MOUNTAIN CORRIDOR Page 67
5.1.12 Standard Time Goal: Calculated as the time of disengagement at approved safe haven, or arrival at an
I-70 exit ramp, minus the notification time, minus the time required to travel from the closest Platform to
the blockage = 45 minutes or less for an upright immobilized Commercial Vehicle and 90 minutes or
less for an overturned Commercial Vehicle. CDOT reserves the right, but is under no obligation, to
extend the Standard time goal up to fifteen (15) additional minutes for any complex event during heavy
traffic solely at CDOT’s discretion.
5.1.13 Cleared Lane Payment: Additional compensation for each blocked and re-opened (cleared) lane where
the Contractor performs as required within the Standard Time Goals. Payment is only available for lane
blocking immobilized heavy vehicles that require physical relocation with Heavy Tow equipment.
Contractor compensation shall be equal to the 75% of the Contractor’s proposed hourly rate multiplied
by the number of lanes cleared per incident ( $rate/hour * .75 * # of lanes = CLP).
5.1.14 Program Manager: The CDOT manager in charge of the contract or his designated representative. The
CDOT Program Manager may designate one or more representative(s) to direct day-to-day operations
and/or monitor performance.
18
5.1.15 Project Manager: The Contractor’s manager in charge of the contract.