Embed Size (px)
Citation preview
lable at ScienceDirect
Atmospheric Environment 92 (2014) 546e556
Contents lists avai
Atmospheric Environment
journal homepage: www.elsevier .com/locate/atmosenv
The heaviest particulate air-pollution episodes occurred in northernChina in January, 2013: Insights gained from observation
Dongsheng Ji a, Liang Li b, Yuesi Wang a,*, Junke Zhang a, Mengtian Cheng a, Yang Sun a,Zirui Liu c,**, Lili Wang a, Guiqian Tang a, Bo Hu a, Na Chao a, Tianxue Wen a,Hongyan Miao a
a State Key Laboratory of Atmospheric Boundary Layer Physics and Atmospheric Chemistry, Institute of Atmospheric Physics, Chinese Academy of Sciences,Beijing, ChinabChina National Environmental Monitoring Center, Chinac Sub-Center of Atmospheric Sciences, Chinese Ecosystem Rsesarch Network, Institute of Atmospheric Physics, Chinese Academy of Sciences, Beijing, China
h i g h l i g h t s
� The obvious decline in air quality was found in Beijing in January.� The highest hourly PM2.5 concentrations reached approximately 1000 mg/m3.� More secondary particles were observed during severe air pollution episodes.
a r t i c l e i n f o
Article history:Received 11 February 2014Received in revised form21 April 2014Accepted 23 April 2014Available online 26 April 2014
Keywords:Air pollution episodesPM1
PM2.5
Northern ChinaSulfateNitrateOCEC
* Corresponding author.** Corresponding author.
E-mail addresses: [email protected] (Y. Wang), lz
http://dx.doi.org/10.1016/j.atmosenv.2014.04.0481352-2310/� 2014 Elsevier Ltd. All rights reserved.
a b s t r a c t
A comprehensive measurement was conducted to analyze the heaviest air pollution episodes, whichoccurred in January 2013 with the focus on particulate characterization and haze. Based on observation,five heavy pollution episodes were recorded, whose frequencies are far greater than in other years.Among the heavy pollution episodes, two distinct severe regional PM2.5 (particulate matter (PM) with anaerodynamic diameter �2.5 mm) pollution episodes were selected for investigation. One episode ischaracterized by an explosive growth in PM2.5 concentrations within several hours, which is mainlycaused by the high local emission under stagnant conditions; the other episode is characterized by four-day consecutive increases in PM2.5 concentrations, which is largely attributed to a combination of slowregional transport and local accumulation. The PM compositions and concentrations including PM2.5,PM1 (PM with an aerodynamic diameter �1 mm), nitrate, sulfate, ammonium, organic carbon (OC) andelemental carbon (EC) as well as main gaseous precursor concentrations are analyzed in Beijing duringthe two episodes. Rapid gas-to-particle conversion, coagulation and collision of particles are discussedunder high emission and stagnant weather conditions. High sulfur and nitrogen oxidation ratios werefound, suggesting that additional production of sulfate and nitrate occurred during the pollution epi-sodes. In addition, high levels of secondary particles were transported from surrounding regions viavertical mixing and horizontal transport during the polluted days. Notably, the stationary source is still amajor contributor to the pollution episodes. Clear evidence is presented indicating that the secondaryformation of particulate was one important mechanism in the formation of the heavy pollution episodes.To control the air pollution effectively, more stringent restriction measures on the SO2 and NOx emissionsshould be strictly executed at the regional scale.
� 2014 Elsevier Ltd. All rights reserved.
[email protected] (Z. Liu).
1. Introduction
Northern China has experienced rapid economic growth overthe past two decades accompanied by the development of large-scale industries and urbanization. This economic boom has led toa general decline in air quality in urban agglomerations (Shao et al.,
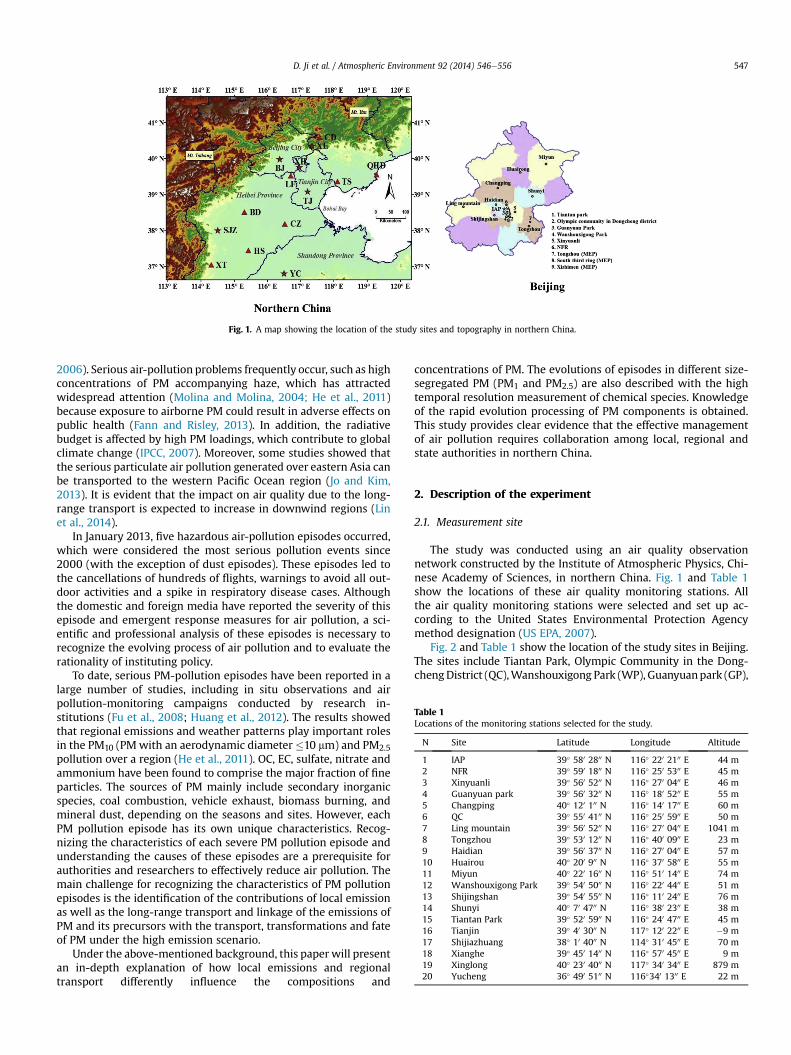
Fig. 1. A map showing the location of the study sites and topography in northern China.
Table 1Locations of the monitoring stations selected for the study.
N Site Latitude Longitude Altitude
1 IAP 39� 580 2800 N 116� 220 2100 E 44 m2 NFR 39� 590 1800 N 116� 250 5300 E 45 m3 Xinyuanli 39� 560 5200 N 116� 270 0400 E 46 m4 Guanyuan park 39� 560 3200 N 116� 180 5200 E 55 m5 Changping 40� 120 100 N 116� 140 1700 E 60 m6 QC 39� 550 4100 N 116� 250 5900 E 50 m7 Ling mountain 39� 560 5200 N 116� 270 0400 E 1041 m8 Tongzhou 39� 530 1200 N 116� 400 0900 E 23 m9 Haidian 39� 560 3700 N 116� 270 0400 E 57 m10 Huairou 40� 200 900 N 116� 370 5800 E 55 m11 Miyun 40� 220 1600 N 116� 510 1400 E 74 m12 Wanshouxigong Park 39� 540 5000 N 116� 220 4400 E 51 m13 Shijingshan 39� 540 5500 N 116� 110 2400 E 76 m14 Shunyi 40� 70 4700 N 116� 380 2300 E 38 m15 Tiantan Park 39� 520 5900 N 116� 240 4700 E 45 m16 Tianjin 39� 40 3000 N 117� 120 2200 E �9 m17 Shijiazhuang 38� 10 4000 N 114� 310 4500 E 70 m18 Xianghe 39� 450 1400 N 116� 570 4500 E 9 m19 Xinglong 40� 230 4000 N 117� 340 3400 E 879 m20 Yucheng 36� 490 5100 N 116�340 1300 E 22 m
D. Ji et al. / Atmospheric Environment 92 (2014) 546e556 547
2006). Serious air-pollution problems frequently occur, such as highconcentrations of PM accompanying haze, which has attractedwidespread attention (Molina and Molina, 2004; He et al., 2011)because exposure to airborne PM could result in adverse effects onpublic health (Fann and Risley, 2013). In addition, the radiativebudget is affected by high PM loadings, which contribute to globalclimate change (IPCC, 2007). Moreover, some studies showed thatthe serious particulate air pollution generated over eastern Asia canbe transported to the western Pacific Ocean region (Jo and Kim,2013). It is evident that the impact on air quality due to the long-range transport is expected to increase in downwind regions (Linet al., 2014).
In January 2013, five hazardous air-pollution episodes occurred,which were considered the most serious pollution events since2000 (with the exception of dust episodes). These episodes led tothe cancellations of hundreds of flights, warnings to avoid all out-door activities and a spike in respiratory disease cases. Althoughthe domestic and foreign media have reported the severity of thisepisode and emergent response measures for air pollution, a sci-entific and professional analysis of these episodes is necessary torecognize the evolving process of air pollution and to evaluate therationality of instituting policy.
To date, serious PM-pollution episodes have been reported in alarge number of studies, including in situ observations and airpollution-monitoring campaigns conducted by research in-stitutions (Fu et al., 2008; Huang et al., 2012). The results showedthat regional emissions and weather patterns play important rolesin the PM10 (PMwith an aerodynamic diameter �10 mm) and PM2.5pollution over a region (He et al., 2011). OC, EC, sulfate, nitrate andammonium have been found to comprise the major fraction of fineparticles. The sources of PM mainly include secondary inorganicspecies, coal combustion, vehicle exhaust, biomass burning, andmineral dust, depending on the seasons and sites. However, eachPM pollution episode has its own unique characteristics. Recog-nizing the characteristics of each severe PM pollution episode andunderstanding the causes of these episodes are a prerequisite forauthorities and researchers to effectively reduce air pollution. Themain challenge for recognizing the characteristics of PM pollutionepisodes is the identification of the contributions of local emissionas well as the long-range transport and linkage of the emissions ofPM and its precursors with the transport, transformations and fateof PM under the high emission scenario.
Under the above-mentioned background, this paper will presentan in-depth explanation of how local emissions and regionaltransport differently influence the compositions and
concentrations of PM. The evolutions of episodes in different size-segregated PM (PM1 and PM2.5) are also described with the hightemporal resolution measurement of chemical species. Knowledgeof the rapid evolution processing of PM components is obtained.This study provides clear evidence that the effective managementof air pollution requires collaboration among local, regional andstate authorities in northern China.
2. Description of the experiment
2.1. Measurement site
The study was conducted using an air quality observationnetwork constructed by the Institute of Atmospheric Physics, Chi-nese Academy of Sciences, in northern China. Fig. 1 and Table 1show the locations of these air quality monitoring stations. Allthe air quality monitoring stations were selected and set up ac-cording to the United States Environmental Protection Agencymethod designation (US EPA, 2007).
Fig. 2 and Table 1 show the location of the study sites in Beijing.The sites include Tiantan Park, Olympic Community in the Dong-chengDistrict (QC),Wanshouxigong Park (WP), Guanyuanpark (GP),
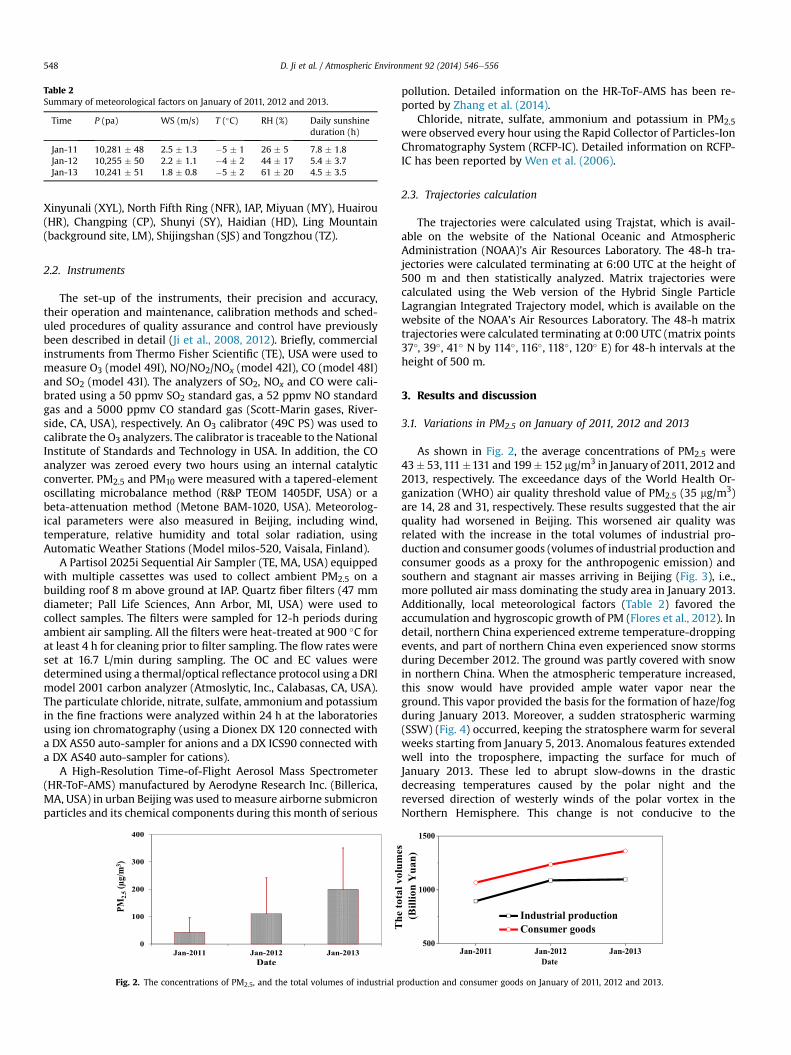
Table 2Summary of meteorological factors on January of 2011, 2012 and 2013.
Time P (pa) WS (m/s) T (�C) RH (%) Daily sunshineduration (h)
Jan-11 10,281 � 48 2.5 � 1.3 �5 � 1 26 � 5 7.8 � 1.8Jan-12 10,255 � 50 2.2 � 1.1 �4 � 2 44 � 17 5.4 � 3.7Jan-13 10,241 � 51 1.8 � 0.8 �5 � 2 61 � 20 4.5 � 3.5
D. Ji et al. / Atmospheric Environment 92 (2014) 546e556548
Xinyunali (XYL), North Fifth Ring (NFR), IAP, Miyuan (MY), Huairou(HR), Changping (CP), Shunyi (SY), Haidian (HD), Ling Mountain(background site, LM), Shijingshan (SJS) and Tongzhou (TZ).
2.2. Instruments
The set-up of the instruments, their precision and accuracy,their operation and maintenance, calibration methods and sched-uled procedures of quality assurance and control have previouslybeen described in detail (Ji et al., 2008, 2012). Briefly, commercialinstruments from Thermo Fisher Scientific (TE), USA were used tomeasure O3 (model 49I), NO/NO2/NOx (model 42I), CO (model 48I)and SO2 (model 43I). The analyzers of SO2, NOx and CO were cali-brated using a 50 ppmv SO2 standard gas, a 52 ppmv NO standardgas and a 5000 ppmv CO standard gas (Scott-Marin gases, River-side, CA, USA), respectively. An O3 calibrator (49C PS) was used tocalibrate the O3 analyzers. The calibrator is traceable to the NationalInstitute of Standards and Technology in USA. In addition, the COanalyzer was zeroed every two hours using an internal catalyticconverter. PM2.5 and PM10 were measured with a tapered-elementoscillating microbalance method (R&P TEOM 1405DF, USA) or abeta-attenuation method (Metone BAM-1020, USA). Meteorolog-ical parameters were also measured in Beijing, including wind,temperature, relative humidity and total solar radiation, usingAutomatic Weather Stations (Model milos-520, Vaisala, Finland).
A Partisol 2025i Sequential Air Sampler (TE, MA, USA) equippedwith multiple cassettes was used to collect ambient PM2.5 on abuilding roof 8 m above ground at IAP. Quartz fiber filters (47 mmdiameter; Pall Life Sciences, Ann Arbor, MI, USA) were used tocollect samples. The filters were sampled for 12-h periods duringambient air sampling. All the filters were heat-treated at 900 �C forat least 4 h for cleaning prior to filter sampling. The flow rates wereset at 16.7 L/min during sampling. The OC and EC values weredetermined using a thermal/optical reflectance protocol using a DRImodel 2001 carbon analyzer (Atmoslytic, Inc., Calabasas, CA, USA).The particulate chloride, nitrate, sulfate, ammonium and potassiumin the fine fractions were analyzed within 24 h at the laboratoriesusing ion chromatography (using a Dionex DX 120 connected witha DX AS50 auto-sampler for anions and a DX ICS90 connected witha DX AS40 auto-sampler for cations).
A High-Resolution Time-of-Flight Aerosol Mass Spectrometer(HR-ToF-AMS) manufactured by Aerodyne Research Inc. (Billerica,MA, USA) in urban Beijing was used tomeasure airborne submicronparticles and its chemical components during this month of serious
Fig. 2. The concentrations of PM2.5, and the total volumes of industrial p
pollution. Detailed information on the HR-ToF-AMS has been re-ported by Zhang et al. (2014).
Chloride, nitrate, sulfate, ammonium and potassium in PM2.5were observed every hour using the Rapid Collector of Particles-IonChromatography System (RCFP-IC). Detailed information on RCFP-IC has been reported by Wen et al. (2006).
2.3. Trajectories calculation
The trajectories were calculated using Trajstat, which is avail-able on the website of the National Oceanic and AtmosphericAdministration (NOAA)’s Air Resources Laboratory. The 48-h tra-jectories were calculated terminating at 6:00 UTC at the height of500 m and then statistically analyzed. Matrix trajectories werecalculated using the Web version of the Hybrid Single ParticleLagrangian Integrated Trajectory model, which is available on thewebsite of the NOAA’s Air Resources Laboratory. The 48-h matrixtrajectories were calculated terminating at 0:00 UTC (matrix points37�, 39�, 41� N by 114�, 116�, 118�, 120� E) for 48-h intervals at theheight of 500 m.
3. Results and discussion
3.1. Variations in PM2.5 on January of 2011, 2012 and 2013
As shown in Fig. 2, the average concentrations of PM2.5 were43� 53,111�131 and 199� 152 mg/m3 in January of 2011, 2012 and2013, respectively. The exceedance days of the World Health Or-ganization (WHO) air quality threshold value of PM2.5 (35 mg/m3)are 14, 28 and 31, respectively. These results suggested that the airquality had worsened in Beijing. This worsened air quality wasrelated with the increase in the total volumes of industrial pro-duction and consumer goods (volumes of industrial production andconsumer goods as a proxy for the anthropogenic emission) andsouthern and stagnant air masses arriving in Beijing (Fig. 3), i.e.,more polluted air mass dominating the study area in January 2013.Additionally, local meteorological factors (Table 2) favored theaccumulation and hygroscopic growth of PM (Flores et al., 2012). Indetail, northern China experienced extreme temperature-droppingevents, and part of northern China even experienced snow stormsduring December 2012. The ground was partly covered with snowin northern China. When the atmospheric temperature increased,this snow would have provided ample water vapor near theground. This vapor provided the basis for the formation of haze/fogduring January 2013. Moreover, a sudden stratospheric warming(SSW) (Fig. 4) occurred, keeping the stratosphere warm for severalweeks starting from January 5, 2013. Anomalous features extendedwell into the troposphere, impacting the surface for much ofJanuary 2013. These led to abrupt slow-downs in the drasticdecreasing temperatures caused by the polar night and thereversed direction of westerly winds of the polar vortex in theNorthern Hemisphere. This change is not conducive to the
roduction and consumer goods on January of 2011, 2012 and 2013.
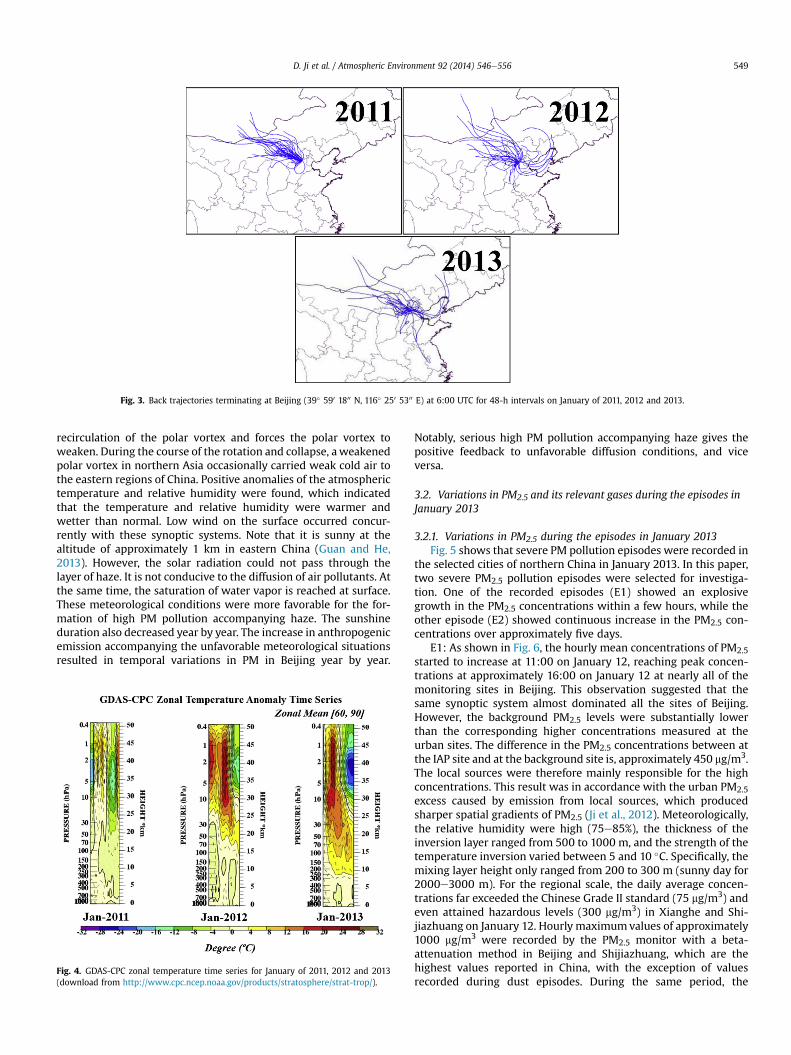
Fig. 3. Back trajectories terminating at Beijing (39� 590 1800 N, 116� 250 5300 E) at 6:00 UTC for 48-h intervals on January of 2011, 2012 and 2013.
D. Ji et al. / Atmospheric Environment 92 (2014) 546e556 549
recirculation of the polar vortex and forces the polar vortex toweaken. During the course of the rotation and collapse, aweakenedpolar vortex in northern Asia occasionally carried weak cold air tothe eastern regions of China. Positive anomalies of the atmospherictemperature and relative humidity were found, which indicatedthat the temperature and relative humidity were warmer andwetter than normal. Low wind on the surface occurred concur-rently with these synoptic systems. Note that it is sunny at thealtitude of approximately 1 km in eastern China (Guan and He,2013). However, the solar radiation could not pass through thelayer of haze. It is not conducive to the diffusion of air pollutants. Atthe same time, the saturation of water vapor is reached at surface.These meteorological conditions were more favorable for the for-mation of high PM pollution accompanying haze. The sunshineduration also decreased year by year. The increase in anthropogenicemission accompanying the unfavorable meteorological situationsresulted in temporal variations in PM in Beijing year by year.
Fig. 4. GDAS-CPC zonal temperature time series for January of 2011, 2012 and 2013(download from http://www.cpc.ncep.noaa.gov/products/stratosphere/strat-trop/).
Notably, serious high PM pollution accompanying haze gives thepositive feedback to unfavorable diffusion conditions, and viceversa.
3.2. Variations in PM2.5 and its relevant gases during the episodes inJanuary 2013
3.2.1. Variations in PM2.5 during the episodes in January 2013Fig. 5 shows that severe PM pollution episodes were recorded in
the selected cities of northern China in January 2013. In this paper,two severe PM2.5 pollution episodes were selected for investiga-tion. One of the recorded episodes (E1) showed an explosivegrowth in the PM2.5 concentrations within a few hours, while theother episode (E2) showed continuous increase in the PM2.5 con-centrations over approximately five days.
E1: As shown in Fig. 6, the hourly mean concentrations of PM2.5started to increase at 11:00 on January 12, reaching peak concen-trations at approximately 16:00 on January 12 at nearly all of themonitoring sites in Beijing. This observation suggested that thesame synoptic system almost dominated all the sites of Beijing.However, the background PM2.5 levels were substantially lowerthan the corresponding higher concentrations measured at theurban sites. The difference in the PM2.5 concentrations between atthe IAP site and at the background site is, approximately 450 mg/m3.The local sources were therefore mainly responsible for the highconcentrations. This result was in accordance with the urban PM2.5excess caused by emission from local sources, which producedsharper spatial gradients of PM2.5 (Ji et al., 2012). Meteorologically,the relative humidity were high (75e85%), the thickness of theinversion layer ranged from 500 to 1000 m, and the strength of thetemperature inversion varied between 5 and 10 �C. Specifically, themixing layer height only ranged from 200 to 300 m (sunny day for2000e3000 m). For the regional scale, the daily average concen-trations far exceeded the Chinese Grade II standard (75 mg/m3) andeven attained hazardous levels (300 mg/m3) in Xianghe and Shi-jiazhuang on January 12. Hourly maximumvalues of approximately1000 mg/m3 were recorded by the PM2.5 monitor with a beta-attenuation method in Beijing and Shijiazhuang, which are thehighest values reported in China, with the exception of valuesrecorded during dust episodes. During the same period, the
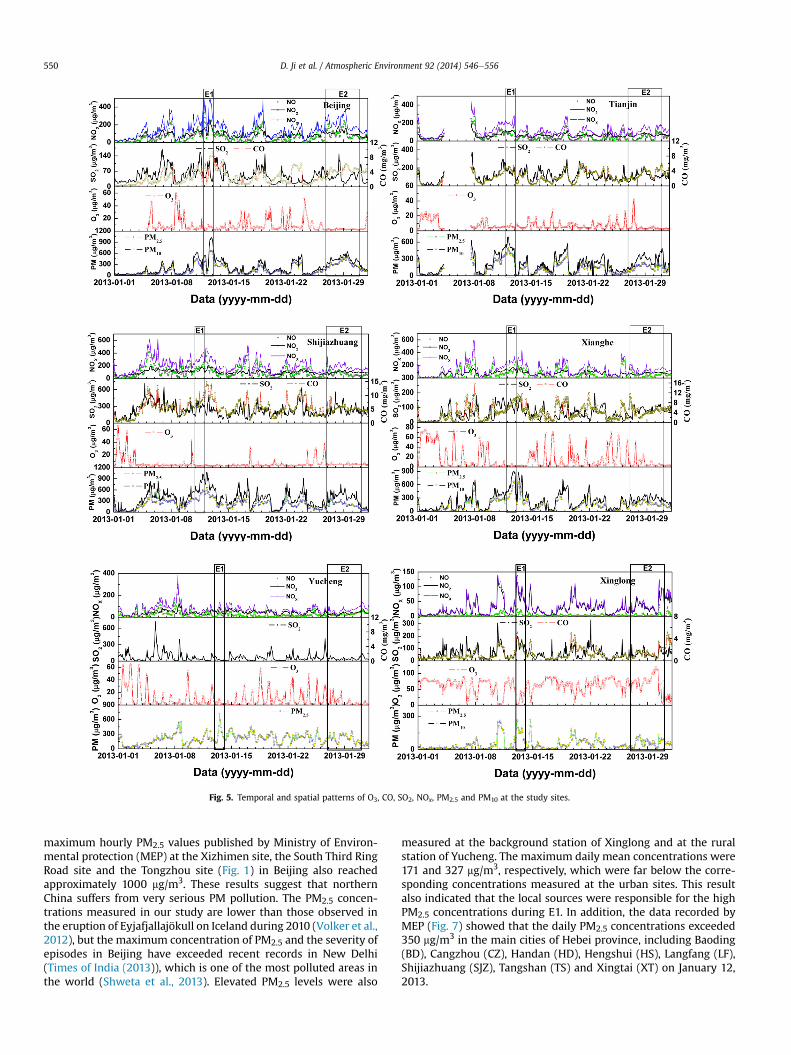
Fig. 5. Temporal and spatial patterns of O3, CO, SO2, NOx, PM2.5 and PM10 at the study sites.
D. Ji et al. / Atmospheric Environment 92 (2014) 546e556550
maximum hourly PM2.5 values published by Ministry of Environ-mental protection (MEP) at the Xizhimen site, the South Third RingRoad site and the Tongzhou site (Fig. 1) in Beijing also reachedapproximately 1000 mg/m3. These results suggest that northernChina suffers from very serious PM pollution. The PM2.5 concen-trations measured in our study are lower than those observed inthe eruption of Eyjafjallajökull on Iceland during 2010 (Volker et al.,2012), but the maximum concentration of PM2.5 and the severity ofepisodes in Beijing have exceeded recent records in New Delhi(Times of India (2013)), which is one of the most polluted areas inthe world (Shweta et al., 2013). Elevated PM2.5 levels were also
measured at the background station of Xinglong and at the ruralstation of Yucheng. The maximum daily mean concentrations were171 and 327 mg/m3, respectively, which were far below the corre-sponding concentrations measured at the urban sites. This resultalso indicated that the local sources were responsible for the highPM2.5 concentrations during E1. In addition, the data recorded byMEP (Fig. 7) showed that the daily PM2.5 concentrations exceeded350 mg/m3 in the main cities of Hebei province, including Baoding(BD), Cangzhou (CZ), Handan (HD), Hengshui (HS), Langfang (LF),Shijiazhuang (SJZ), Tangshan (TS) and Xingtai (XT) on January 12,2013.
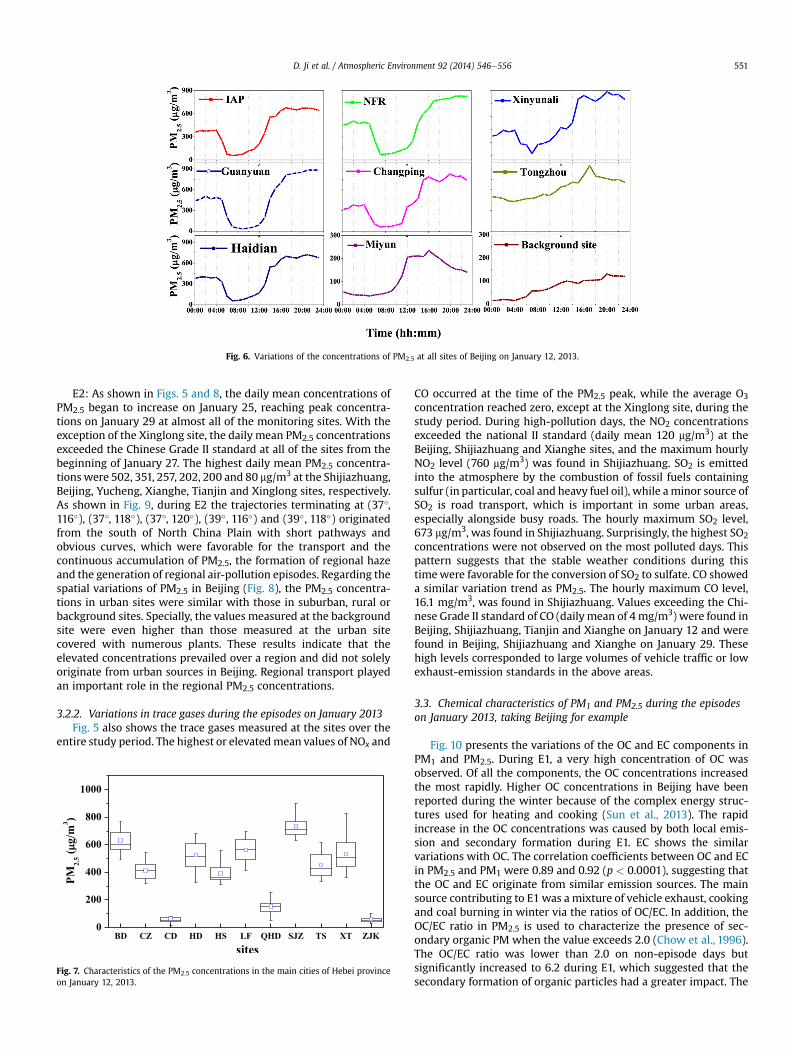
Fig. 6. Variations of the concentrations of PM2.5 at all sites of Beijing on January 12, 2013.
D. Ji et al. / Atmospheric Environment 92 (2014) 546e556 551
E2: As shown in Figs. 5 and 8, the daily mean concentrations ofPM2.5 began to increase on January 25, reaching peak concentra-tions on January 29 at almost all of the monitoring sites. With theexception of the Xinglong site, the daily mean PM2.5 concentrationsexceeded the Chinese Grade II standard at all of the sites from thebeginning of January 27. The highest daily mean PM2.5 concentra-tions were 502, 351, 257, 202, 200 and 80 mg/m3 at the Shijiazhuang,Beijing, Yucheng, Xianghe, Tianjin and Xinglong sites, respectively.As shown in Fig. 9, during E2 the trajectories terminating at (37�,116�), (37�, 118�), (37�, 120�), (39�, 116�) and (39�, 118�) originatedfrom the south of North China Plain with short pathways andobvious curves, which were favorable for the transport and thecontinuous accumulation of PM2.5, the formation of regional hazeand the generation of regional air-pollution episodes. Regarding thespatial variations of PM2.5 in Beijing (Fig. 8), the PM2.5 concentra-tions in urban sites were similar with those in suburban, rural orbackground sites. Specially, the values measured at the backgroundsite were even higher than those measured at the urban sitecovered with numerous plants. These results indicate that theelevated concentrations prevailed over a region and did not solelyoriginate from urban sources in Beijing. Regional transport playedan important role in the regional PM2.5 concentrations.
3.2.2. Variations in trace gases during the episodes on January 2013Fig. 5 also shows the trace gases measured at the sites over the
entire study period. The highest or elevatedmean values of NOx and
Fig. 7. Characteristics of the PM2.5 concentrations in the main cities of Hebei provinceon January 12, 2013.
CO occurred at the time of the PM2.5 peak, while the average O3concentration reached zero, except at the Xinglong site, during thestudy period. During high-pollution days, the NO2 concentrationsexceeded the national II standard (daily mean 120 mg/m3) at theBeijing, Shijiazhuang and Xianghe sites, and the maximum hourlyNO2 level (760 mg/m3) was found in Shijiazhuang. SO2 is emittedinto the atmosphere by the combustion of fossil fuels containingsulfur (in particular, coal and heavy fuel oil), while aminor source ofSO2 is road transport, which is important in some urban areas,especially alongside busy roads. The hourly maximum SO2 level,673 mg/m3, was found in Shijiazhuang. Surprisingly, the highest SO2concentrations were not observed on the most polluted days. Thispattern suggests that the stable weather conditions during thistimewere favorable for the conversion of SO2 to sulfate. CO showeda similar variation trend as PM2.5. The hourly maximum CO level,16.1 mg/m3, was found in Shijiazhuang. Values exceeding the Chi-nese Grade II standard of CO (daily mean of 4 mg/m3) were found inBeijing, Shijiazhuang, Tianjin and Xianghe on January 12 and werefound in Beijing, Shijiazhuang and Xianghe on January 29. Thesehigh levels corresponded to large volumes of vehicle traffic or lowexhaust-emission standards in the above areas.
3.3. Chemical characteristics of PM1 and PM2.5 during the episodeson January 2013, taking Beijing for example
Fig. 10 presents the variations of the OC and EC components inPM1 and PM2.5. During E1, a very high concentration of OC wasobserved. Of all the components, the OC concentrations increasedthe most rapidly. Higher OC concentrations in Beijing have beenreported during the winter because of the complex energy struc-tures used for heating and cooking (Sun et al., 2013). The rapidincrease in the OC concentrations was caused by both local emis-sion and secondary formation during E1. EC shows the similarvariations with OC. The correlation coefficients between OC and ECin PM2.5 and PM1 were 0.89 and 0.92 (p < 0.0001), suggesting thatthe OC and EC originate from similar emission sources. The mainsource contributing to E1 was a mixture of vehicle exhaust, cookingand coal burning in winter via the ratios of OC/EC. In addition, theOC/EC ratio in PM2.5 is used to characterize the presence of sec-ondary organic PM when the value exceeds 2.0 (Chow et al., 1996).The OC/EC ratio was lower than 2.0 on non-episode days butsignificantly increased to 6.2 during E1, which suggested that thesecondary formation of organic particles had a greater impact. The
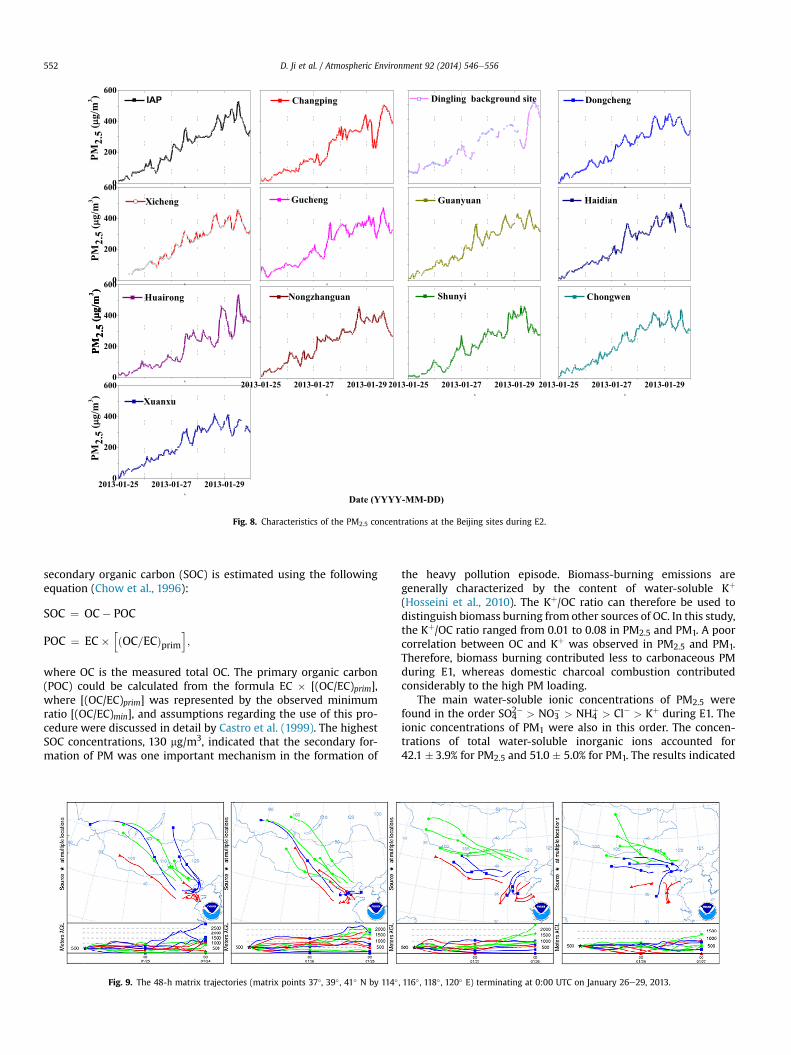
Fig. 8. Characteristics of the PM2.5 concentrations at the Beijing sites during E2.
D. Ji et al. / Atmospheric Environment 92 (2014) 546e556552
secondary organic carbon (SOC) is estimated using the followingequation (Chow et al., 1996):
SOC ¼ OC� POC
POC ¼ EC�hðOC=ECÞprim
i;
where OC is the measured total OC. The primary organic carbon(POC) could be calculated from the formula EC � [(OC/EC)prim],where [(OC/EC)prim] was represented by the observed minimumratio [(OC/EC)min], and assumptions regarding the use of this pro-cedure were discussed in detail by Castro et al. (1999). The highestSOC concentrations, 130 mg/m3, indicated that the secondary for-mation of PM was one important mechanism in the formation of
Fig. 9. The 48-h matrix trajectories (matrix points 37�, 39� , 41� N by 114�
the heavy pollution episode. Biomass-burning emissions aregenerally characterized by the content of water-soluble Kþ
(Hosseini et al., 2010). The Kþ/OC ratio can therefore be used todistinguish biomass burning from other sources of OC. In this study,the Kþ/OC ratio ranged from 0.01 to 0.08 in PM2.5 and PM1. A poorcorrelation between OC and Kþ was observed in PM2.5 and PM1.Therefore, biomass burning contributed less to carbonaceous PMduring E1, whereas domestic charcoal combustion contributedconsiderably to the high PM loading.
The main water-soluble ionic concentrations of PM2.5 werefound in the order SO4
2� > NO3� > NH4
þ > Cl� > Kþ during E1. Theionic concentrations of PM1 were also in this order. The concen-trations of total water-soluble inorganic ions accounted for42.1 � 3.9% for PM2.5 and 51.0 � 5.0% for PM1. The results indicated
, 116� , 118� , 120� E) terminating at 0:00 UTC on January 26e29, 2013.
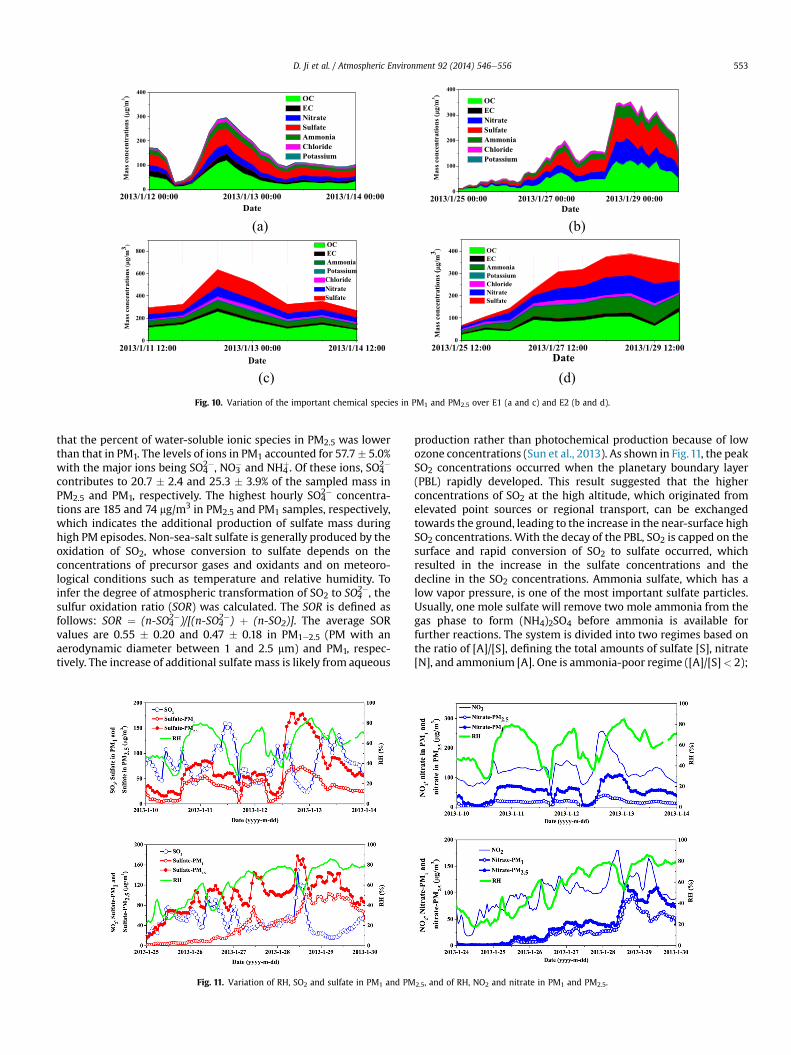
Fig. 10. Variation of the important chemical species in PM1 and PM2.5 over E1 (a and c) and E2 (b and d).
D. Ji et al. / Atmospheric Environment 92 (2014) 546e556 553
that the percent of water-soluble ionic species in PM2.5 was lowerthan that in PM1. The levels of ions in PM1 accounted for 57.7� 5.0%with the major ions being SO4
2�, NO3� and NH4
þ. Of these ions, SO42�
contributes to 20.7 � 2.4 and 25.3 � 3.9% of the sampled mass inPM2.5 and PM1, respectively. The highest hourly SO4
2� concentra-tions are 185 and 74 mg/m3 in PM2.5 and PM1 samples, respectively,which indicates the additional production of sulfate mass duringhigh PM episodes. Non-sea-salt sulfate is generally produced by theoxidation of SO2, whose conversion to sulfate depends on theconcentrations of precursor gases and oxidants and on meteoro-logical conditions such as temperature and relative humidity. Toinfer the degree of atmospheric transformation of SO2 to SO4
2�, thesulfur oxidation ratio (SOR) was calculated. The SOR is defined asfollows: SOR ¼ (n-SO4
2�)/[(n-SO42�) þ (n-SO2)]. The average SOR
values are 0.55 � 0.20 and 0.47 � 0.18 in PM1e2.5 (PM with anaerodynamic diameter between 1 and 2.5 mm) and PM1, respec-tively. The increase of additional sulfate mass is likely from aqueous
Fig. 11. Variation of RH, SO2 and sulfate in PM1 and PM
production rather than photochemical production because of lowozone concentrations (Sun et al., 2013). As shown in Fig.11, the peakSO2 concentrations occurred when the planetary boundary layer(PBL) rapidly developed. This result suggested that the higherconcentrations of SO2 at the high altitude, which originated fromelevated point sources or regional transport, can be exchangedtowards the ground, leading to the increase in the near-surface highSO2 concentrations. With the decay of the PBL, SO2 is capped on thesurface and rapid conversion of SO2 to sulfate occurred, whichresulted in the increase in the sulfate concentrations and thedecline in the SO2 concentrations. Ammonia sulfate, which has alow vapor pressure, is one of the most important sulfate particles.Usually, one mole sulfate will remove two mole ammonia from thegas phase to form (NH4)2SO4 before ammonia is available forfurther reactions. The system is divided into two regimes based onthe ratio of [A]/[S], defining the total amounts of sulfate [S], nitrate[N], and ammonium [A]. One is ammonia-poor regime ([A]/[S]< 2);
2.5, and of RH, NO2 and nitrate in PM1 and PM2.5.
D. Ji et al. / Atmospheric Environment 92 (2014) 546e556554
the other is ammonia-rich regime ([A]/[S] > 2). The ratios of [A]/[S]in both PM1 and PM2.5 are lower than 2 during E1. This resultsuggested that there is not a sufficient amount of NH3 to neutralizethe available sulfate, which will tend to drive nitrate to the gasphase due to the thermo-dynamical instability of ammonium ni-trate. In addition, a new mechanism is found in which high con-centrations of NOx promote the conversion of SO2 to SO4
2� (He et al.,2014). Considering aforementioned results, the competing systemof NH4
þeNO3�eSO4
2� is one important contributor to high PMpollution episode.
NO3� contributes to 11.9 � 0.4 and 13.1 � 1.4% of the sampled
mass in PM2.5 and PM1, respectively. The mean NO3� concentrations
are 89 � 15 and 32 � 5 mg/m3 in PM2.5 and PM1 samples on January12, 2013, respectively. NO3
� is generally produced by the oxidationof NO2, whose conversion to NO3
� also depends on the concentra-tions of precursor gases and oxidants and on the meteorologicalconditions. To infer the degree of atmospheric transformation ofNO2 to NO3
�, the nitrogen oxidation ratio (NOR) was calculated. TheNOR is defined as follows: NOR ¼ (n-NO3
�)/[(n-NO3�) þ (n-NO2)]. The
NOR values are 0.16 � 0.05 and 0.10 � 0.01 in PM1e2.5 and PM1,respectively. The concentration of NO2 was very high but the O3
concentration was less than 5.9 mg/m3 during E1. These resultssuggested that the photochemical activity was very weak during E1.It has been reported that nitrate is formed via the heterogeneoushydrolysis of N2O5 on the surface of moist PM, especially duringhumid and hazy weather (Pathak et al., 2009). No matter howcomplicated the conversion process, NO3
� is closely related withhigh emission of NOx from traffic. Notably, the mean NO3
� concen-tration in PM2.5 is higher than that in PM1. Similar results have beenfound in European cities (Perrone et al., 2011) and are due to theassociation of NO3
�with cations such as Ca2þ and not with NH4þ. The
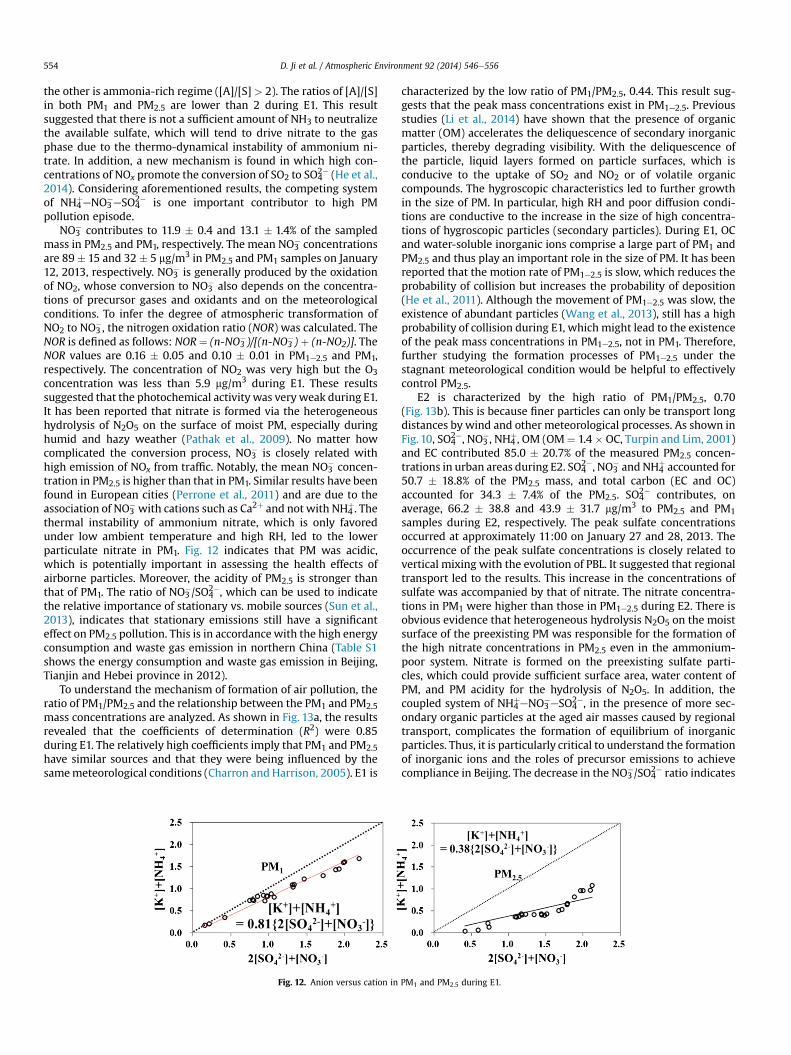
thermal instability of ammonium nitrate, which is only favoredunder low ambient temperature and high RH, led to the lowerparticulate nitrate in PM1. Fig. 12 indicates that PM was acidic,which is potentially important in assessing the health effects ofairborne particles. Moreover, the acidity of PM2.5 is stronger thanthat of PM1. The ratio of NO3
�/SO42�, which can be used to indicate
the relative importance of stationary vs. mobile sources (Sun et al.,2013), indicates that stationary emissions still have a significanteffect on PM2.5 pollution. This is in accordancewith the high energyconsumption and waste gas emission in northern China (Table S1shows the energy consumption and waste gas emission in Beijing,Tianjin and Hebei province in 2012).
To understand the mechanism of formation of air pollution, theratio of PM1/PM2.5 and the relationship between the PM1 and PM2.5mass concentrations are analyzed. As shown in Fig. 13a, the resultsrevealed that the coefficients of determination (R2) were 0.85during E1. The relatively high coefficients imply that PM1 and PM2.5have similar sources and that they were being influenced by thesamemeteorological conditions (Charron and Harrison, 2005). E1 is
Fig. 12. Anion versus cation in
characterized by the low ratio of PM1/PM2.5, 0.44. This result sug-gests that the peak mass concentrations exist in PM1e2.5. Previousstudies (Li et al., 2014) have shown that the presence of organicmatter (OM) accelerates the deliquescence of secondary inorganicparticles, thereby degrading visibility. With the deliquescence ofthe particle, liquid layers formed on particle surfaces, which isconducive to the uptake of SO2 and NO2 or of volatile organiccompounds. The hygroscopic characteristics led to further growthin the size of PM. In particular, high RH and poor diffusion condi-tions are conductive to the increase in the size of high concentra-tions of hygroscopic particles (secondary particles). During E1, OCand water-soluble inorganic ions comprise a large part of PM1 andPM2.5 and thus play an important role in the size of PM. It has beenreported that the motion rate of PM1e2.5 is slow, which reduces theprobability of collision but increases the probability of deposition(He et al., 2011). Although the movement of PM1e2.5 was slow, theexistence of abundant particles (Wang et al., 2013), still has a highprobability of collision during E1, which might lead to the existenceof the peak mass concentrations in PM1e2.5, not in PM1. Therefore,further studying the formation processes of PM1e2.5 under thestagnant meteorological condition would be helpful to effectivelycontrol PM2.5.
E2 is characterized by the high ratio of PM1/PM2.5, 0.70(Fig. 13b). This is because finer particles can only be transport longdistances by wind and other meteorological processes. As shown inFig. 10, SO4
2�, NO3�, NH4
þ, OM (OM¼ 1.4 � OC, Turpin and Lim, 2001)and EC contributed 85.0 � 20.7% of the measured PM2.5 concen-trations in urban areas during E2. SO4
2�, NO3� and NH4
þ accounted for50.7 � 18.8% of the PM2.5 mass, and total carbon (EC and OC)accounted for 34.3 � 7.4% of the PM2.5. SO4
2� contributes, onaverage, 66.2 � 38.8 and 43.9 � 31.7 mg/m3 to PM2.5 and PM1samples during E2, respectively. The peak sulfate concentrationsoccurred at approximately 11:00 on January 27 and 28, 2013. Theoccurrence of the peak sulfate concentrations is closely related tovertical mixing with the evolution of PBL. It suggested that regionaltransport led to the results. This increase in the concentrations ofsulfate was accompanied by that of nitrate. The nitrate concentra-tions in PM1 were higher than those in PM1e2.5 during E2. There isobvious evidence that heterogeneous hydrolysis N2O5 on the moistsurface of the preexisting PM was responsible for the formation ofthe high nitrate concentrations in PM2.5 even in the ammonium-poor system. Nitrate is formed on the preexisting sulfate parti-cles, which could provide sufficient surface area, water content ofPM, and PM acidity for the hydrolysis of N2O5. In addition, thecoupled system of NH4
þeNO3�eSO4
2�, in the presence of more sec-ondary organic particles at the aged air masses caused by regionaltransport, complicates the formation of equilibrium of inorganicparticles. Thus, it is particularly critical to understand the formationof inorganic ions and the roles of precursor emissions to achievecompliance in Beijing. The decrease in the NO3
�/SO42� ratio indicates
PM1 and PM2.5 during E1.
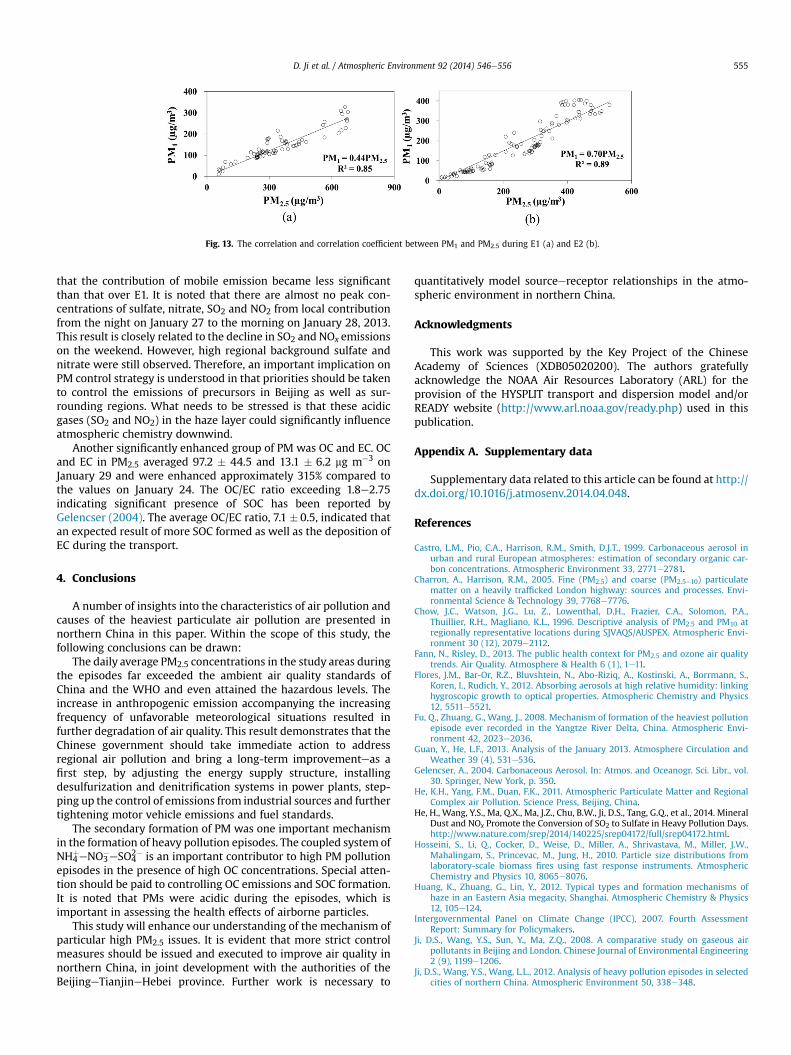
Fig. 13. The correlation and correlation coefficient between PM1 and PM2.5 during E1 (a) and E2 (b).
D. Ji et al. / Atmospheric Environment 92 (2014) 546e556 555
that the contribution of mobile emission became less significantthan that over E1. It is noted that there are almost no peak con-centrations of sulfate, nitrate, SO2 and NO2 from local contributionfrom the night on January 27 to the morning on January 28, 2013.This result is closely related to the decline in SO2 and NOx emissionson the weekend. However, high regional background sulfate andnitrate were still observed. Therefore, an important implication onPM control strategy is understood in that priorities should be takento control the emissions of precursors in Beijing as well as sur-rounding regions. What needs to be stressed is that these acidicgases (SO2 and NO2) in the haze layer could significantly influenceatmospheric chemistry downwind.
Another significantly enhanced group of PM was OC and EC. OCand EC in PM2.5 averaged 97.2 � 44.5 and 13.1 � 6.2 mg m�3 onJanuary 29 and were enhanced approximately 315% compared tothe values on January 24. The OC/EC ratio exceeding 1.8e2.75indicating significant presence of SOC has been reported byGelencser (2004). The average OC/EC ratio, 7.1 � 0.5, indicated thatan expected result of more SOC formed as well as the deposition ofEC during the transport.
4. Conclusions
A number of insights into the characteristics of air pollution andcauses of the heaviest particulate air pollution are presented innorthern China in this paper. Within the scope of this study, thefollowing conclusions can be drawn:
The daily average PM2.5 concentrations in the study areas duringthe episodes far exceeded the ambient air quality standards ofChina and the WHO and even attained the hazardous levels. Theincrease in anthropogenic emission accompanying the increasingfrequency of unfavorable meteorological situations resulted infurther degradation of air quality. This result demonstrates that theChinese government should take immediate action to addressregional air pollution and bring a long-term improvementeas afirst step, by adjusting the energy supply structure, installingdesulfurization and denitrification systems in power plants, step-ping up the control of emissions from industrial sources and furthertightening motor vehicle emissions and fuel standards.
The secondary formation of PM was one important mechanismin the formation of heavy pollution episodes. The coupled system ofNH4
þeNO3�eSO4
2� is an important contributor to high PM pollutionepisodes in the presence of high OC concentrations. Special atten-tion should be paid to controlling OC emissions and SOC formation.It is noted that PMs were acidic during the episodes, which isimportant in assessing the health effects of airborne particles.
This study will enhance our understanding of the mechanism ofparticular high PM2.5 issues. It is evident that more strict controlmeasures should be issued and executed to improve air quality innorthern China, in joint development with the authorities of theBeijingeTianjineHebei province. Further work is necessary to
quantitatively model sourceereceptor relationships in the atmo-spheric environment in northern China.
Acknowledgments
This work was supported by the Key Project of the ChineseAcademy of Sciences (XDB05020200). The authors gratefullyacknowledge the NOAA Air Resources Laboratory (ARL) for theprovision of the HYSPLIT transport and dispersion model and/orREADY website (http://www.arl.noaa.gov/ready.php) used in thispublication.
Appendix A. Supplementary data
Supplementary data related to this article can be found at http://dx.doi.org/10.1016/j.atmosenv.2014.04.048.
References
Castro, L.M., Pio, C.A., Harrison, R.M., Smith, D.J.T., 1999. Carbonaceous aerosol inurban and rural European atmospheres: estimation of secondary organic car-bon concentrations. Atmospheric Environment 33, 2771e2781.
Charron, A., Harrison, R.M., 2005. Fine (PM2.5) and coarse (PM2.5e10) particulatematter on a heavily trafficked London highway: sources and processes. Envi-ronmental Science & Technology 39, 7768e7776.
Chow, J.C., Watson, J.G., Lu, Z., Lowenthal, D.H., Frazier, C.A., Solomon, P.A.,Thuillier, R.H., Magliano, K.L., 1996. Descriptive analysis of PM2.5 and PM10 atregionally representative locations during SJVAQS/AUSPEX. Atmospheric Envi-ronment 30 (12), 2079e2112.
Fann, N., Risley, D., 2013. The public health context for PM2.5 and ozone air qualitytrends. Air Quality. Atmosphere & Health 6 (1), 1e11.
Flores, J.M., Bar-Or, R.Z., Bluvshtein, N., Abo-Riziq, A., Kostinski, A., Borrmann, S.,Koren, I., Rudich, Y., 2012. Absorbing aerosols at high relative humidity: linkinghygroscopic growth to optical properties. Atmospheric Chemistry and Physics12, 5511e5521.
Fu, Q., Zhuang, G., Wang, J., 2008. Mechanism of formation of the heaviest pollutionepisode ever recorded in the Yangtze River Delta, China. Atmospheric Envi-ronment 42, 2023e2036.
Guan, Y., He, L.F., 2013. Analysis of the January 2013. Atmosphere Circulation andWeather 39 (4), 531e536.
Gelencser, A., 2004. Carbonaceous Aerosol. In: Atmos. and Oceanogr. Sci. Libr., vol.30. Springer, New York, p. 350.
He, K.H., Yang, F.M., Duan, F.K., 2011. Atmospheric Particulate Matter and RegionalComplex air Pollution. Science Press, Beijing, China.
He, H., Wang, Y.S., Ma, Q.X., Ma, J.Z., Chu, B.W., Ji, D.S., Tang, G.Q., et al., 2014. MineralDust and NOx Promote the Conversion of SO2 to Sulfate in Heavy Pollution Days.http://www.nature.com/srep/2014/140225/srep04172/full/srep04172.html.
Hosseini, S., Li, Q., Cocker, D., Weise, D., Miller, A., Shrivastava, M., Miller, J.W.,Mahalingam, S., Princevac, M., Jung, H., 2010. Particle size distributions fromlaboratory-scale biomass fires using fast response instruments. AtmosphericChemistry and Physics 10, 8065e8076.
Huang, K., Zhuang, G., Lin, Y., 2012. Typical types and formation mechanisms ofhaze in an Eastern Asia megacity, Shanghai. Atmospheric Chemistry & Physics12, 105e124.
Intergovernmental Panel on Climate Change (IPCC), 2007. Fourth AssessmentReport: Summary for Policymakers.
Ji, D.S., Wang, Y.S., Sun, Y., Ma, Z.Q., 2008. A comparative study on gaseous airpollutants in Beijing and London. Chinese Journal of Environmental Engineering2 (9), 1199e1206.
Ji, D.S., Wang, Y.S., Wang, L.L., 2012. Analysis of heavy pollution episodes in selectedcities of northern China. Atmospheric Environment 50, 338e348.
D. Ji et al. / Atmospheric Environment 92 (2014) 546e556556
Jo, H.Y., Kim, C.H., 2013. Identification of long-range transported haze phenomenaand their meteorological features over Northeast Asia. Journal of AppliedMeteorology and Climatology 52, 1318e1328.
Li, W.J., Shao, L., Shi, Z., Chen, J., Yang, L., et al., 2014. Mixing state and hygroscopicityof dust and haze particles before leaving Asian continent. Journal of Geophys-ical Research: Atmospheres 119 (2), 2013JD021003.
Lin, J.T., Pan, D., Davis, S.J., Zhang, Q., He, K.B., Wang, C., Streets, D.G., Wuebbles, D.J.,Guan, D.B., 2014. China’s International Trade and Air Pollution in the UnitedStates. www.pnas.org/cgi/doi/10.1073/pnas.1312860111.
Molina, M.J., Molina, L.T., 2004. Megacities and atmospheric pollution. Journal of theAir & Waste Management Association 54, 644e680.
Pathak, R.K., Wu, W.S., Wang, T., 2009. Summertime PM2.5 ionic species in fourmajor cities of China: nitrate formation in an ammonia-deficient atmosphere.Atmospheric Chemistry & Physics 9, 1711e1722.
Perrone, M.R., Piazzalunga, A., Prato, M., Carofaloa, I., 2011. Composition of fine andcoarse particles in a coastal site of the central Mediterranean: carbonaceousspecies contributions. Atmospheric Environment 45 (39), 7470e7477.
Shao, M., Tang, X., Zhang, Y., Li, W., 2006. City clusters in China: air andsurface water pollution. Frontiers in Ecology and the Environment 4 (7),353e361.
Shweta, Y., Ankit, T., Arun, K.A., 2013. Monthly and seasonal variations in aerosolassociated n-alkane profiles in relation to meteorological parameters in NewDelhi. India Aerosol and Air Quality Research 13, 287e300.
Sun, Y.L., Wang, Z.F., Fu, P.Q., Jiang, Q., Yang, T., Li, J., Ge, X.L., 2013. The impact ofrelative humidity on aerosol composition and evolution processes duringwintertime in Beijing, China. Atmospheric Environment 77, 927e934.
Times of India, 2013. http://articles.timesofindia.indiatimes.com/2013-01-15/pollution/36352070 _1_air-pollution-cu-pollution-levels.
Turpin, B.J., Lim, H.J., 2001. Species contributions to PM2.5 mass concentrations:revisiting common assumptions for estimating organic mass. Aerosol Scienceand Technology 35, 602e610.
US EPA, 2007. US EPA Environmental Protection Agency 40 CFR Parts 53 and 58[EPA-HQeOAR-2004-0018; FRL-] RIN 2060-AJ25 (2007). http://www.epa.gov/ttn/amtic/files/ambient/pm25/092706sign.pdf.
Volker, M., Armin, A., Johannes, B., et al., 2012. The ash dispersion over Europeduring the Eyjafjallajökull eruption e comparison of CMAQ simulations toremote sensing and air-borne in-situ observations. Atmospheric Environment48, 184e194.
Wang, Y.S., Yao, L., Liu, Z.R., Ji, D.S., Wang, L.L., Zhang, J.K., 2013. Formation of hazepollution in Beijing-Tianjin-Hebei region and their control strategies. Bulletin ofChinese Academy of Sciences 6 (3), 353e363.
Wen, T.X.,Wang, Y.S., Chang, S.Y., Liu, G.R., 2006. On-linemeasurement ofwater-solubleions in ambient particles. Advances in Atmospheric Sciences 23 (4), 402e408.
Zhang, J.K., Sun, Y., Liu, Z.R., Ji, D.S., Hu, B., Liu, Q., Wang, Y.S., 2014. Characterizationof submicron aerosols during a month of serious pollution in Beijing, 2013.Atmospheric Chemistry and Physics 14, 2887e2903.