Embed Size (px)
Citation preview
The Healthy Incentive for Pre-schools Project Summary Report
The Healthy Incentive for Pre-schools Project
ISBN: 978-1-905767-52-6
Publication date: January 2015

Acknowledgements
safefood wishes to thank all those involved in this research project, including:
The research team led by Dr Charlotte Johnston Molloy and Ms Corina Glennon Slattery, Health
Service Executive, and their colleagues, Dr Clare Corish, Dr John Kearney and Prof Nóirín Hayes,
Dublin Institute of Technology, with support from Ms Cathriona Loonam, Ms Cara Cunningham,
Ms Maria Murtagh and Ms Sarah Mumford, HSE
The members of the National Advisory Group who provided support to the research team
throughout the study. They included Ms Marion Brennan and Ms Rita Melia, Early Childhood
Ireland, Ms Kara Murphy, Ms Ann Spain, Ms Anne Gerety, Ms Sheelagh Reaper-Reynolds, HSE and
Ms Sinead Keenan, Healthy Food for All, as well as their colleagues at Dublin Institute of
Technology
The Pre-school Local Expert Group from the Midlands, including the environmental health officers
and public health nurses who supported the project locally
Those full-day care (FDC) pre-schools and local support staff who took part in the process in
counties Wicklow, Westmeath, Longford, Laois and Offaly

Table of contents
1 Overview ................................................................................................................................................. 1
2 Introduction .......................................................................................................................................... 3
3 Aim and objectives ................................................................................................................................ 4
4 Methods ................................................................................................................................................. 5
5 Results .................................................................................................................................................... 7
6 Discussion............................................................................................................................................ 24
7 Conclusion ........................................................................................................................................... 26
8 Key project recommendations ............................................................................................................27
9 References............................................................................................................................................ 28
10 Appendices .......................................................................................................................................... 30

1
1 Overview
This project was named the Healthy Incentive for Pre-schools Project (subsequently referred to as
the HIP project). It looked at currentpractices around food, nutrition and related health practices in
the pre-school setting and developed an intervention to improve such practices.
First, a tool was developed to assess practice in pre-schools. It looked at four areas – environment,
meals, snacks and food service (Table 1). The tool allowed each pre-school to get an overall score and
be awarded one of the following categories: Participation, Bronze, Silver, Gold or Platinum.
The assessment tool was used in 62 pre-schools in order to look at baseline practice. At the baseline,
pre-schools were found to score highest for the ‘snacks’ section and lowest for the ‘food service’
section with the assessment tool. A total of 74% (n 31) of services were classified as Participation level,
with the remaining 26% (n 11) achieved a Bronze level.
The pre-schools received feedback on their practice and were assigned to one of two interventions –
manager only training (one hour) or manager and staff training (three hours). A guide and serving size
resources were provided. The practice was then assessed six months after training. N=24 pre-schools
(manager only) and n=18 pre-schools (manager and staff) completed training and a six-month follow-
up.
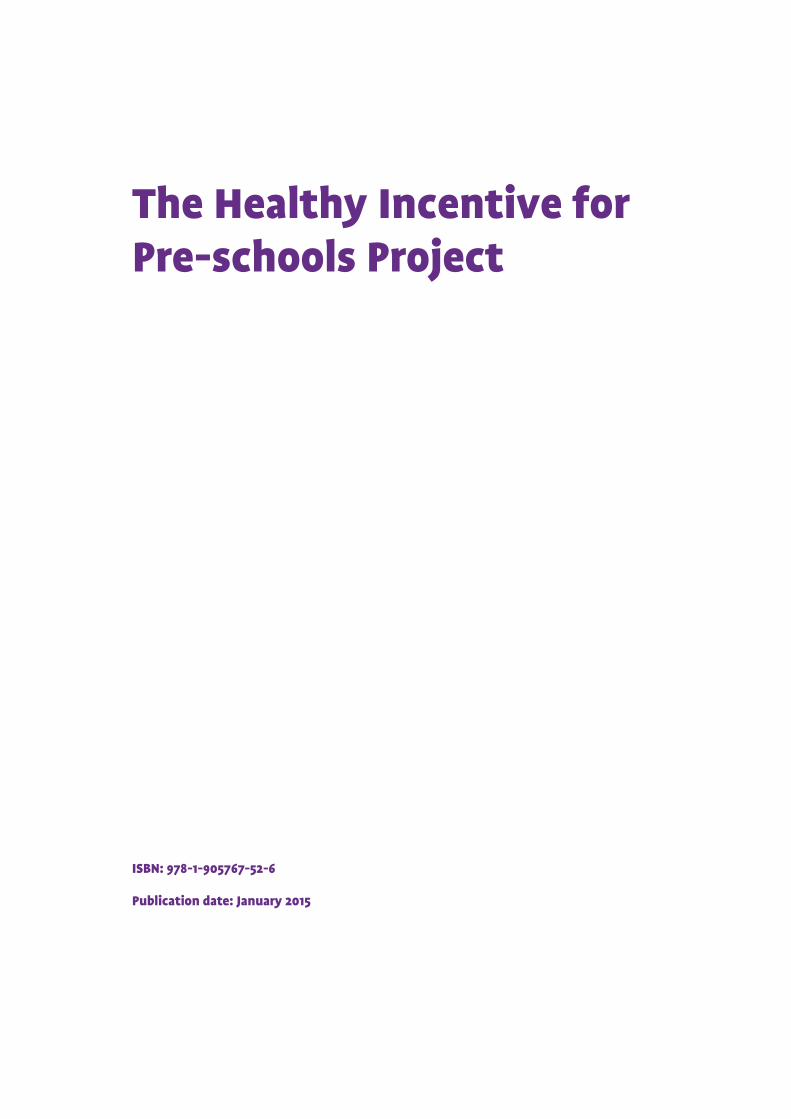
Following training, overall practice improved equally in both intervention/training groups (Table 1). A
greater than 50% improvement in practice was observed in the following areas:
The visibility of a written healthy policy
Provision of outdoor time for all children
Children’s participation in meals and snacks
The majority of pre-schools (87%, n 37) in both groups moved to either Bronze (57%, n 24) or Silver
(30%, n 13) categories. A small minority (10%, n 4) of services did not improve their practices
significantly and remained at Participation level.
Overall, the pre-schools that participated in the study were very willing to do so. A form of recognition
for participation was seen as important. The project demonstrated that with a minimum amount of
training for managers, practice in this sector could be substantially improved.
2
Table 1: Changes in practice from baseline to post-intervention (an arrow denotes an improvement
while a yellow line denotes no improvement in practice)
Criteria
Manager trained (MT) group
Managers & staff trained (MST) group
Environment
Have a health promotion policy
Education materials
Planned physical activity
Outdoor time
Not using food as reward
Adequate no. of meals and snacks
Food Service
Staff sitting at food times
Staff eating with children
Family-style food service
Allowing sufficient time at meals and snacks
All kids encouraged to self feed
Appropriate feeding and drinking utensils
Meals
Portion of protein foods
Portion of starchy foods
Portion of dairy foods
Portion of vegetables
Self-service meals
Iron-rich foods
Snacks
Fruit as a snack
Top-shelf foods
Dairy other than at a main meal
Drinks with snacks
Drinks with meals
Milk/water between meals/snacks

3
2 Introduction
A nourishing diet is essential for the healthy development of children, and health-related habits
learned early in life have been found to continue into adulthood. In 2012, the National Pre-school
Nutrition Survey reported that a significant proportion of pre-school children had low intakes of
nutrients such as iron and vitamin D, as well as high intakes of sugar and salt. Also reported was a low
intake of healthy food, such as vegetables, and high intakes of foods high in sugar and fat (1). With
one in four three-year-old children carrying excess weight, childhood obesity is one of the major
challenges facing our children’s future health (1).
Parents have a powerful influence on their children’s eating habits and the food provided to them.
However, a large number of children spend much of their time in full day childcare (FDC), that is, more
than five hours per session with at least two meals (one hot) and two snacks provided. By the age of
three years, 50% of children in Ireland attend out-of-home care (2). The pre-school environment has
the capability of having a positive effect on children’s nutritional health and wellbeing through the
provision of healthy nutritious food and supporting the establishment of healthy behaviours.
However, little is known of the food provided or the related health practices in place in this setting in
the Republic of Ireland (ROI).
Although the ‘Food and Nutrition Guidelines for Pre-school Services’ are available in ROI, these are not
mandatory, and the practice among pre-school providers varies across the country. The Healthy
Incentive for Pre-schools (HIP) Project described here looks at current practices around food, nutrition
and related health practices in the pre-school setting and has developed an intervention to improve
such practices. It builds on previous work by the Health Service Executive (HSE), which looked at
developing a draft set of criteria for assessing practices and found that pre-schools were in favour of
introducing a nutrition incentive scheme (3).

4
3 Aim and objectives This research set out to develop a tool to assess food, nutrition and related health practices in FDC
pre-schools and to test the impact of this tool, along with training, on improving such practices in
this sector.
The objectives were as follows:
1. Devise and validate a tool to assess food, nutrition and related health practices in pre-schools
2. Carry out a baseline audit with the assessment tool of FDC pre-schools registered with HSE
Dublin Mid-Leinster in the Midlands region
3. Develop a nutrition and related health education resource pack to accompany the assessment
tool
4. Deliver two levels of training ‒ manager-only training and manager and staff training ‒ using
the assessment tool and an accompanying education resource pack to improve practice.
Finally, to measure their impact on food, nutrition and related health practice in comparison
groups

5
4 Methods There were a number of phases of the HIP project, as outlined in Figure 1.
Pilot, audit and intervention
The work was led by a research dietitian, and information was collected from pre-schools providing
FDC. For the main study, the data collection took place at 62 pre-schools in the midland counties of
ROI.
Figure 1: Methodology
Pilot of Tool
September‒ November
2008
A previously developed assessment tool (Appendix A) that evaluated food, nutrition and related health
practice was piloted in a sample of 12 pre-schools outside of the main study counties. The research dietitian
spent a day in each pre-school observing and collecting data using the assessment tool. Additional
information collected included the characteristics of the pre-schools and their populations. After the pilot
study, the draft assessment tool was further adapted for use in the steps below.
Baseline Practice Audit
November 2008–
November 2009
The HSE Dublin Mid-Leinster identified 100 eligible pre-schools and, of these, 62 proceeded to the baseline
data visits stage (see Figure 2). The research dietitian spent one full day in each pre-school observing and
collecting data using the assessment tool (Table 1). Based on this, each pre-school was assigned a score and
grade.
Training
Intervention
July 2010‒
February 2011
Pre-schools were randomly assigned to either:
(A) A manager trained (MT) intervention (n 30 completed) group, with a one-hour meeting providing
feedback on their pre-school assessment score and an overview of the resource pack given. Each
manager was asked to relay the information to each of their staff.
(B) A manager & staff trained (MST) intervention (n 31 completed) group. This involved a one-hour
feedback session with the manager, with an additional 1.5 hour information session provided for all
staff. Full information sessions took place with 113 staff and reduced training sessions took place
with 18 staff (due to adverse weather conditions). Evaluation questionnaires were distributed at each
session, staff gave intervention feedback and managers reported on barriers to changing practice.
Post-
Intervention
Practice Audit
September‒
November 2011
Observation data were collected and analysed in 42 pre-schools that participated in the intervention (24 MT,
18 MST) six to nine months later by the research dietitian using the assessment tool. Other services (n 16) were
lost to post-intervention. Pre-school services were scored and classified by the research dietitian (n 42). 30
pre-school providers completed a self-assessment. The differences between the baseline and the post-
intervention and between each of the intervention groups were explored. Feedback was provided to each pre-
school via telephone and a written report in the post. Each service was given a defined one-year award
certificate – Participation, Bronze, Silver, Gold or Platinum.

6
Development of education resources
The development of education resources for this project took place in two stages between 2008 and
2010.
A Serving Size Guide: This was developed in September and October 2008. It is a picture guide, with a
list of household measures for common foods for pre-school age children provided to help staff to
determine serving sizes accurately. It also provides sound advice on a family-style food service (FSFS),
the introduction of new foods and the environment which nurtures healthy eating habits for life. The
resource was subsequently adapted by safefood and made available online in December 2013 as an
independent resource, ‘What is a serving size? A Guide for Pre-schools’(4). It was based on the serving
sizes recommended in the Food and Nutrition Guidelines for Pre-school Services (5), the 3-Week Menu
Plan – a Resource for Pre-schools (6) and the Caroline Walker Trust (7).
The Pre-school Education Resource Pack: This was developed between January and July 2010. Two
booklets, a ‘Best Practice Guide’ and a ‘Hints and Tips Pack’, both available on the safefood website
(8), were included in this pack. The content was based on nutrition and health-related needs identified
at the baseline.
Both were developed in consultation with community dietitians and the local nutrition working
group, and were piloted with local child minders.
Views of pre-school providers
Between December 2011 and March 2012, the pre-school providers’ views on a suitable incentive
scheme that would help motivate them to take part in initiatives, such as the HIP project, were
analysed using the Delphi Technique.1 Feedback was collected after training using a questionnaire. It
involved open qualitative questions (round one) being sent to all managers of pre-school services in
the project, with a final response rate of 23/45 (51%) being achieved. All ideas were then grouped to
create a list of responses that the managers were asked to rate using a five choice Likert scale (round
two), with a response rate of 17/23 (74%) being achieved. The data were then analysed and the ideas
were ranked. This was repeated until a 70% consensus was reached and a total of 16 incentive ideas
were created.
Ethical approval
This study received ethical approval from the Research Ethics Committees of the HSE Dublin Mid-
Leinster (Midlands Area) and Dublin Institute of Technology.
1 The Delphi Technique method is based on the results of several rounds of questionnaires sent to a panel of
experts. The anonymous responses are aggregated and shared with the group after each round. The experts are allowed to then adjust their answers in subsequent rounds. A final response is then reached by consensus.

7
5 Results
Pilot study
The pilot highlighted that the following changes were required to the original draft assessment tool
(Appendix A and B): providing criteria to cover all ages of the children attending the pre-school,
rephrasing some criteria to avoid misinterpretation, providing criteria to measure all six aspects of an
FSFS2 and, finally, ensuring that all utensils used were quantifiable.
The scoring scheme of the draft assessment tool was also modified to give a three possible answer
scale (0; 1; 3): ‘no score’ (0 points scored), ‘minimum standard’ (1 point scored) and ‘best standard’ (3
points scored). The categorization of the overall score was as follows: Participation (score 0-19), Bronze
(score 20-39) Silver (score 40-54), Gold (score 55-64) and Platinum (score 65-72) award. The main
criteria for the finalized assessment tool (Appendix C) are outlined in Table 2.
Details of the characteristics of the pre-schools that took part in the pilot study are given in Appendix
D.
2 ‘Family style food service’ is defined as: ‘meals in which child-size tables are set with plates and utensils. Food is
passed in small containers for children to serve their own plates. Children may pour their own beverages from small
pitchers’ (National Food Service Management Institute (United States), 2003).
The six aspects of ‘Family style food service’ are: Meal times are relaxed events; providers sit and eat with children, and
discuss food and other stories; children participate, laying cutlery, serving foods, cleaning up, etc.; children do not start
the meal until all are served and wait at the table until all are finished eating; the cleaning of surfaces or clearing of plates
is not commenced during meal time; plates are provided on the table for all meals and snacks.

8
Table 2: Finalised assessment tool and its criteria
Assessment tool NMS, Not Minimum Standard (Score=0)
MS, Minimum Standard (Score = 1) BP, Best Practice (Score = 3) Categories Criteria
Environment
Whole pre-school health promotion policy comprising: physical activity, food, nutrition, dental health and confidence
No policy visible Policy visible. All elements are not included. No annual review plan
Visible policy. All elements are included. All service community involved, including parents. Annual review date set
Food-related education materials None/or not in all service rooms
>1 in each room and/or evidence in hallways/corridors
>3 in each room – (posters, games, crafts) and evidence in hallways/corridors
Do children take part in the recommended amount of physical activity (PA)?
None, at any age Only some age groups. PA schedules not in all rooms/corridor. PA not in health policy
>1 planned PA session for all ages. PA schedule in corridor/each room. Children move freely between rooms. Policy refers to planned PA
Outside in the day None; outdoor clothing absent
Some are taken outside; no outdoor clothing
Everybody is taken outside in all weather; outdoor clothing provided
Evidence of food being used as rewards/treats
Food used as a reward/treat, e.g. on Fridays
Evidence of food/drink used as a treat but not as a reward, or vice versa
No evidence that food is used as a reward/treat; there is a healthy reward scheme in place
Two meals and two snacks given to all FDC children with the correct amount of food groups (FGs)
No breakfast; meals do not have four FGs; only one meal (main, not light) provided
Breakfast, mid-morning snack, main meal, light meal provided. Meals contain all four FGs
All meals and snacks provided in MS, including a mid-afternoon snack. All meals contain the four FGs and snacks contain two of four FGs
Food service
At least one provider sits with children at food times
No staff sitting at children’s table/high chair with the children; no adult seating
>1 provider sits in each room; Staff not at all tables; no adult seating
At least one provider sits at each table and beside a high chair in each room at food times. Suitable adult seating provided
Staff eat the same food as children at food times
No staff eat with children at any meal or snack time
>1 staff eats with children at snack time but not at meal times in each room; vice versa
At least one provider eats with children at snack, main and light meal times in each room. Staff eat the same food as children
Practising the six aspects of ‘family-style food service’ (FSFS)
The six aspects are not practised
>4 of the six aspects are observed All six aspects are observed
Adequate allocation of time for meal/snack times
Rushed feeding times; meals <30mins, snacks <15mins
Snacks are not hurried but meals are; vice versa
Adequate time is allocated for meals and snacks; children are not rushed to finish eating
Adequate encouragement to self-feed
Not at any age; children spoon fed to hurry food times
Some infants/children can self-feed; some are spoon-fed to rush the process
All suitable infants/toddlers and all children are allowed/encouraged to feed selves
Age appropriate feeding and drinking utensils used
Not for any age group Some aspects are followed All aspects are followed

9
Assessment tool NMS, Not Minimum Standard (Score=0);
MS, Minimum Standard (Score = 1); BP, Best Practice (Score = 3) Categories Criteria
Meals
Age appropriate serving of protein at main meal
None or <½ serving given ½-1 serving given ‒ is too small/ too big Adequate serving for all ages is provided
Age appropriate serving of starch at main meal
None or <½ serving given ½-1 serving given ‒ is too small/too big Adequate serving for all ages is provided
Age appropriate serving of dairy food at main meal
None or <½ serving given ½-1 serving given ‒ is too small/too big; a choice is given between milk and juice/squash
Adequate serving for all ages is provided
Age appropriate serving of vegetables at main meal
None or <½ serving given ½-1 serving ‒ is too small; or too big Adequate serving for all ages is provided
Children serve themselves from larger dishes; second helpings at main meal
No self-service food given; no second helpings offered
Some self-service food given; second helpings offered/given to some
All food/fluids can be self-served; second helpings of main meal are available/offered
Iron-rich food provision at main meal Not for any age Offered to some children; serving too small
Offered to all infants and children
Snacks
Fruit given at least once other than with the main meal
No fruit given to any infant/child
Fruit is given to some/all, but serving is not adequate
Appropriate serving size of fruit is provided to all appropriate children at least once other than with the main meal
Foods offered from top shelf of the Food Pyramid
All foods are from the top shelf of the Food Pyramid
Some foods are from the top shelf of the Food Pyramid
No foods are provided from the top shelf of the Food Pyramid
Dairy food offered at least once other than main meal
No dairy food offered outside the main meal
Some are offered, but serving is too small
All are given a serving at least once outside the main meal
Tap water and milk are only given with snacks
None/other drinks offered Some rooms offer other drinks with snacks
Only tap water/milk is offered with snacks in all rooms
Tap water, milk or aptly diluted juice with meals
All rooms offer other drinks Some rooms offer other drinks No other drinks given; pure unsweetened juice diluted (1:4/5) and juice is given only once a day
Tap water/milk offered between meals and snacks
Neither given in any room; milk given in bottles not cups
Some rooms comply; no water stations or stickers provided to encourage fluid intake
All rooms comply. All rooms have poster/stickers, jugs/bottles of water (water stations), dedicated water breaks

10
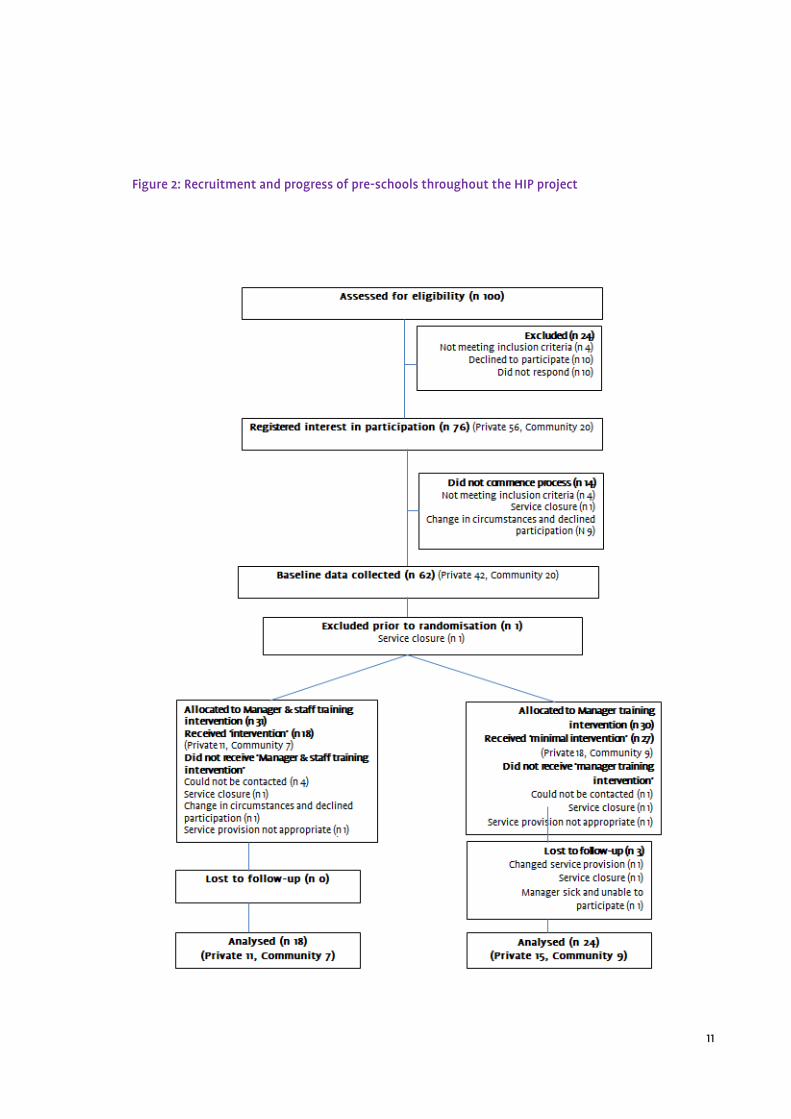
Pre-school participation
Figure 2 shows the recruitment and progress of pre-schools during the project. Table 3 outlines the baseline characteristics of the pre-schools that
proceeded to post-intervention. No difference was found between the services that completed the baseline audit only and those that progressed to
post-intervention, or between the characteristics of the manager trained (MT) and manager & staff trained (MST) groups.
Table 3: Baseline characteristics of manager trained and manager & staff trained intervention groups
Characteristics Manager trained (n 24) Manager & staff trained (n 18)
n Median (IQR) Range n Median (IQR) Range P value
Total no. of carers (n) 24 8 (9) 2-27 18 9 (7) 3-30 0.750 NS
Full-time carers (n) 24 5 (7) 2-16 18 4 (2) 2-10 0.070 NS
Part-time carers (n) 24 3 (4) 0-17 18 3 (6) 0-20 0.300 NS
Children (n) 24 41 (51) 19-147 18 36 (42) 7-150 0.751 NS
Children>5hr/day (FDC) (n) 23 17 (18) 8-53 18 20 (27) 3-51 0.655 NS
Children < 5hr/day (n) 23 19 (29) 3-122 18 21 (31) 1-107 0.733 NS
FDC children (< 12 M) (n) 20 2 (3) 0-8 17 1 (2) 0-6 0.313 NS
FDC children (13‒24 M) (n) 19 4 (3) 1-22 15 2 (7) 0-13 0.272 NS
FDC children (25‒36 M) (n) 18 6 (5) 0 -20 15 6 (7) 0-14 0.478 NS
FDC children (> 36 M) (n) 19 8 (9) 3-19 16 5 (8) 0-19 0.122 NS
Cost FDC (€) /wk < 12 M 24 148 (31) 99-195 14 150 (29) 25-195 0.553 NS
Cost FDC (€) / wk 13‒24 M 24 150 (23) 110-175 18 150 (26) 25-190 0.878 NS
Cost FDC (€) / wk 25‒36 M 24 150 (15) 110-175 18 150 (26) 25-190 0.868 NS
Cost FDC (€) / wk 36 M+ 24 150 (15) 110-175 18 150 (26) 25-190 0.908 NS
Cost food provision(€)/wk 22 188 (170) 40-670 15 200 (180) 30-400 0.577 NS
n, the number of pre-schools; IQR, interquartile range; M, month; P, significance level (P <0.05); NS, not significant
11
Figure 2: Recruitment and progress of pre-schools throughout the HIP project
12
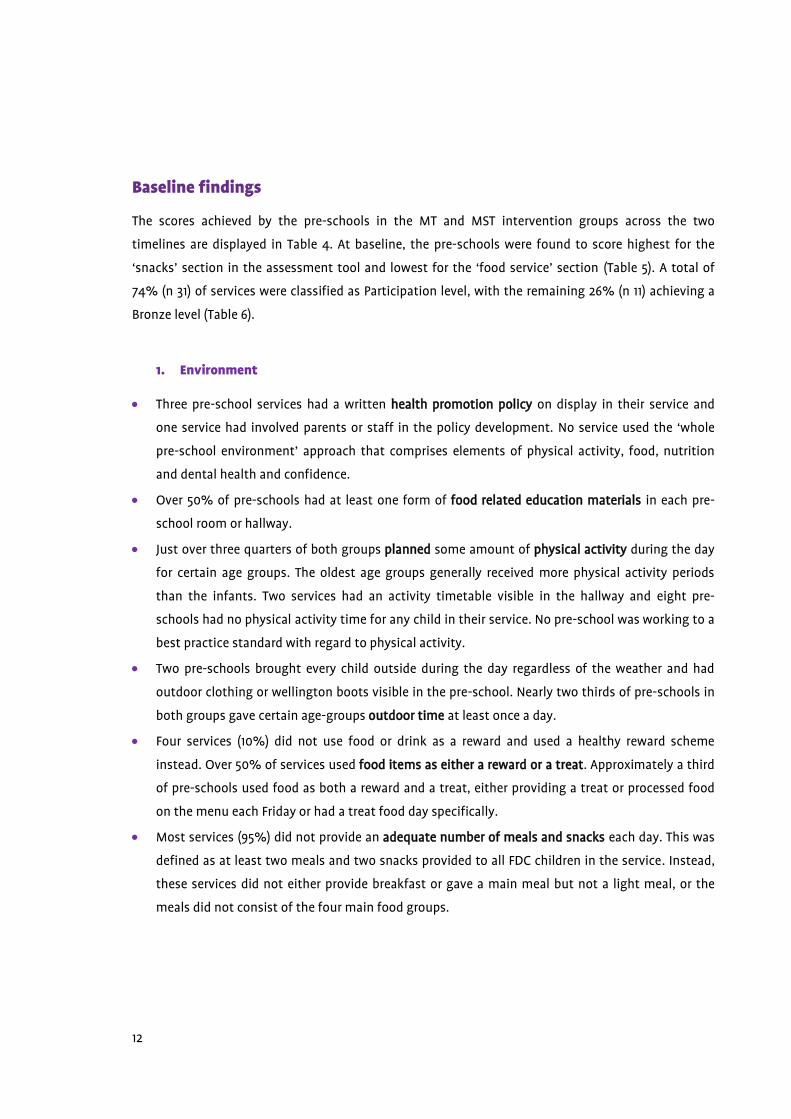
Baseline findings
The scores achieved by the pre-schools in the MT and MST intervention groups across the two
timelines are displayed in Table 4. At baseline, the pre-schools were found to score highest for the
‘snacks’ section in the assessment tool and lowest for the ‘food service’ section (Table 5). A total of
74% (n 31) of services were classified as Participation level, with the remaining 26% (n 11) achieving a
Bronze level (Table 6).
1. Environment
Three pre-school services had a written health promotion policy on display in their service and
one service had involved parents or staff in the policy development. No service used the ‘whole
pre-school environment’ approach that comprises elements of physical activity, food, nutrition
and dental health and confidence.
Over 50% of pre-schools had at least one form of food related education materials in each pre-
school room or hallway.
Just over three quarters of both groups planned some amount of physical activity during the day
for certain age groups. The oldest age groups generally received more physical activity periods
than the infants. Two services had an activity timetable visible in the hallway and eight pre-
schools had no physical activity time for any child in their service. No pre-school was working to a
best practice standard with regard to physical activity.
Two pre-schools brought every child outside during the day regardless of the weather and had
outdoor clothing or wellington boots visible in the pre-school. Nearly two thirds of pre-schools in
both groups gave certain age-groups outdoor time at least once a day.
Four services (10%) did not use food or drink as a reward and used a healthy reward scheme
instead. Over 50% of services used food items as either a reward or a treat. Approximately a third
of pre-schools used food as both a reward and a treat, either providing a treat or processed food
on the menu each Friday or had a treat food day specifically.
Most services (95%) did not provide an adequate number of meals and snacks each day. This was
defined as at least two meals and two snacks provided to all FDC children in the service. Instead,
these services did not either provide breakfast or gave a main meal but not a light meal, or the
meals did not consist of the four main food groups.

13
2. Food service
The majority of pre-schools did not have at least one member of staff sitting (>83%) in each room
or eating (>78%) the same food as the children at mealtimes, irrespective of age.
Seven services provided at least four of six aspects of a family-style food service: adults sitting,
eating and making conversation with children during mealtimes; allowing children to self-serve;
allowing sufficient time for meals and providing correct utensils such as plates for all meals and
snacks. 80% of pre-schools did not practise any of the six aspects, and no pre-school was
observed to follow all six aspects of this practice completely.
Less than 10% of pre-schools gave adequate time for meals and snacks and did not rush children
to finish eating, the recommended time being 30 minutes for meals and 15 minutes for snacks.
Over half of each intervention group provided adequate time during meals but not for snacks or
vice versa, and about 40% did not provide enough time for either meals or snacks.
Two services actively encouraged all suitable infants/toddlers and children in their care to feed
themselves. Almost 90% of pre-schools encouraged some groups of children to self-feed, while
others were spoon-fed. Five services spoon-fed all children and did not encourage children to feed
themselves.
All services in the ‘manager & staff trained intervention’ group and 92% in the ‘manager trained
intervention’ group did not provide age appropriate feeding and drinking utensils 3 for all infants
and children.
3. Meals
Two pre-schools provided an appropriate serving of protein food4 at the main meal for all
children. However, about half of pre-schools provided either no protein food or <½ a serving to
some/all children. The rest (~50%) served between ½ to 1 serving, which was not suitable for all
age groups.
Nine services gave the appropriate serving of starchy food to all children, at the main meal,
although over three quarters of pre-schools (75% [MT], 83% [MST]) gave children a serving that
was too small or too large for their age group.
3 Appropriate feeding and drinking utensils: Lidless cups are used to train infants and children to drink from six
months. Plates are available for all meals and snacks for all infants and children. Age appropriate cutlery is available at all meal and snack times. A spoon and bowl is given to infants to encourage self-feeding.
4 Food weight and measure reference guide used to determine appropriate portion sizes of all food groups.

14
Two pre-schools in both intervention groups were working to best practice, providing an
appropriate serving of dairy food with main meals, and over 70% of services provided no serving
or a serving that was too small for some or all age groups.
A small number of services (21% [MT], 11% [MST]) provided the correct amount of vegetables at
the main meal. Half of the pre-schools provided between ½ and 1 serving and the remainder
(30%) gave none or less than a ½ serving of vegetables with main meals.
Three pre-schools offered an adequate serving size of iron-rich food to all children with the main
meals. Just over 40% of services gave an iron-rich food to some/all children, but the serving size
was too small. The remainder (about 50%) served less than a ½ serving or none at all.
4. Snacks
Nearly a third of pre-schools (29% [MT] 28% [MST],) provided an age-appropriate serving of fruit
as a snack to all children, at least once a day. However, about two thirds gave fruit to some/all
children, but the serving size was too small. Moreover, three services served no fruit to any infant
or child.
About a third of pre-schools (33% [MT], 22% [MST]) did not allow any food from the top shelf of
the Food Pyramid; i.e. foods high in fat, sugar and salt (HFSS). And the rest of the pre-schools
(67% MT, 78% MST), only allowed some foods from this category.
A large proportion of services (33% [MT], 50% [MST]) gave every child an appropriate serving of
dairy outside the main meal at least once a day. Nearly half of the pre-schools provided some or
all children with a serving of dairy food outside the main meal, but the serving size was too small.
Eight services were found not to give children dairy foods outside of the main meal.
Nearly half of pre-schools (38% [MT], 61% [MST]) served the correct drinks with meals; water or
milk or correctly diluted unsweetened fruit juice. However, almost a third of services gave drinks
other than water, milk or diluted juice to children with all meals served in all rooms.
Three pre-schools offered milk and water only with snacks. However, the majority of services
(84% [MT], 72% [MST]) gave either no drink with snacks or drinks other than milk or water with
snacks.
Almost 90% of services did not offer milk or water in between meals and snacks in all rooms, or
did not use posters/stickers to encourage fluid intake or have water stations at dedicated water
breaks during the day. Five pre-schools offered water or milk between meals and snacks but they
had no visible water station or poster/stickers in each room.

15
Practice after intervention
Details of the characteristics of pre-schools post-intervention are given in Appendix E. Positive
changes were observed in the majority of the health-related practices of both groups following the
training intervention (Tables 4 and 5). There was a greater than 50% improvement in practice
observed in both groups in the visibility of a written healthy policy, provision of outdoor time for
children and children’s participation in meals and snacks in all rooms. Appendix F provides a detailed
description of the changes in food, nutrition and related health practices across the two intervention
groups.
The majority of pre-schools 87% (n 37) in both intervention groups moved to either Bronze (57%, n 24)
or Silver (30%, n 13) categories (Table 6), while a small minority 10% (n 4) of services did not improve
their practice significantly and remained at Participation level. One service enhanced its practice to
move to a Gold level.
Effect of training
The training intervention led to significant improvement in overall nutrition and health-related
practice, as seen in the overall scoring (Table 4).
Post-intervention, no significant differences in overall health promotion practices were found
between the MT and MST groups, with no significant benefit resulting from additional staff
training.
However, some differences between training groups were observed (Table 4). For example, the
MST group scored better in the meal provision section, while the MT group scored higher in the
snacks section of the assessment tool.

17
Table 4: Assessment tool criteria scores at baseline and post-intervention in the manager trained and manager & staff trained intervention
groups
Manager trained intervention group
(n 24)
Manager & staff trained intervention group
(n 18)
Scores Baseline
Median (range)
Post-intervention
Median (range)
P value b Baseline
Median (range)
Post-intervention
Median (range)
P value b
Environment 3 (0-9) 7.5 (2-16) *** 3 (1-6) 7.5 (5-12) ***
Food service 2 (0-6) 6.5 (0-14) *** 2 (0-11) 6 (2-10) **
Meals 4 (2-11) 7.5 (2-15) ** 3.5 (1-8) 9 (3-18) **
Snacks 5 (2-14) 12 (3-18) *** 6.5 (3-12) 10.5 (6-16) **
Overall score 13 (7-39) 34 (11-60) *** 15 (8-32) 33.5 (18-48) ***
Wilcoxon Signed-Rank Test, * P< 0.05; ** P<0.01; ***P<0.001
18
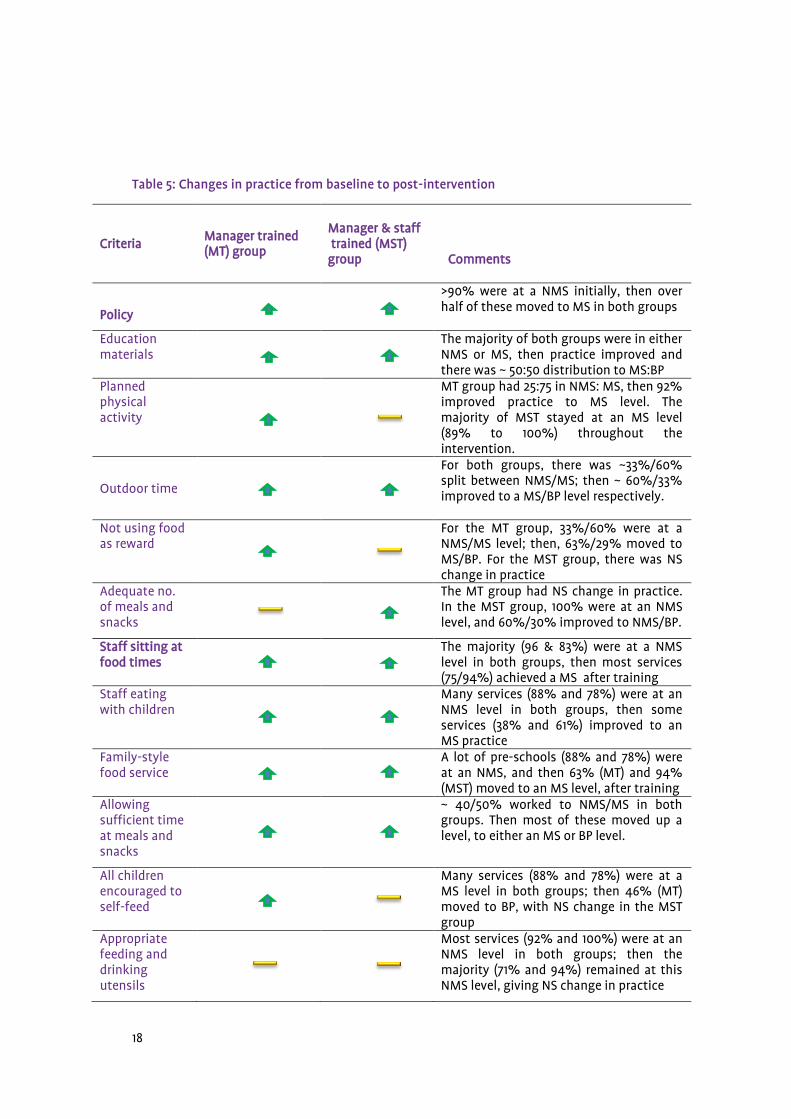
Table 5: Changes in practice from baseline to post-intervention
Criteria
Manager trained (MT) group
Manager & staff trained (MST) group Comments
Policy
>90% were at a NMS initially, then over half of these moved to MS in both groups
Education materials
The majority of both groups were in either NMS or MS, then practice improved and there was ~ 50:50 distribution to MS:BP
Planned physical activity
MT group had 25:75 in NMS: MS, then 92% improved practice to MS level. The majority of MST stayed at an MS level (89% to 100%) throughout the intervention.
Outdoor time
For both groups, there was ~33%/60% split between NMS/MS; then ~ 60%/33% improved to a MS/BP level respectively.
Not using food as reward
For the MT group, 33%/60% were at a NMS/MS level; then, 63%/29% moved to MS/BP. For the MST group, there was NS change in practice
Adequate no. of meals and snacks
The MT group had NS change in practice. In the MST group, 100% were at an NMS level, and 60%/30% improved to NMS/BP.
Staff sitting at food times
The majority (96 & 83%) were at a NMS level in both groups, then most services (75/94%) achieved a MS after training
Staff eating with children
Many services (88% and 78%) were at an NMS level in both groups, then some services (38% and 61%) improved to an MS practice
Family-style food service
A lot of pre-schools (88% and 78%) were at an NMS, and then 63% (MT) and 94% (MST) moved to an MS level, after training
Allowing sufficient time at meals and snacks
~ 40/50% worked to NMS/MS in both groups. Then most of these moved up a level, to either an MS or BP level.
All children encouraged to self-feed
Many services (88% and 78%) were at a MS level in both groups; then 46% (MT) moved to BP, with NS change in the MST group
Appropriate feeding and drinking utensils
Most services (92% and 100%) were at an NMS level in both groups; then the majority (71% and 94%) remained at this NMS level, giving NS change in practice

19
Criteria
Manager trained (MT) group
Manager & staff trained (MST) group
Comments
Portion protein
~50/50% of both groups were at NMS/MS; then 29% (MT) and 39% (MST) moved to a BP level after training
Portion of starch
NS change in practice (MT), with 70%/30% staying in MS/BP, while 60% of the MST group improved practice to a BP level, from 17%.
Portion of dairy
70/30% were at a NMS/MS level in both groups; then ~1/3 (MT) moved to BP and there was an NS change in practice for the MST group
Portion of vegetables
~30/50% were working to an NMS/MS level in both groups. Then 50% (MT) and 70% (MST) improved to a BP level
Self-service meals
The majority (88% and 78%) were working to NMS level; then ~50% of both groups improved practice, reaching an MS level
Iron-rich foods
~50/40% of both groups were at an NMS/MS level; but after training NS change in practice was achieved by either group
Fruit as snack
A lot of services (58% and 72%) were at MS level; then 88% (MT) and 78% (MST) reached a BP level after training
Top shelf foods
Most pre-schools (67 & 78%) worked to a MS level & the rest (33/22%) a BP standard. There was NS change in practice however, in either group post training
Dairy other than main meal
The majority of services achieved MS/BP (50% and 40%) in both groups; then 79% (MT) and 100% (MST) reached a BP level
Drinks with snacks
Most pre-schools (84% and 72%) worked at an NMS level in both groups, then a lot of services (42%/61%) moved to a BP level
Drinks with meals
38% of the MT group worked to a BP level, and then after training, 75% improved to a BP standard. However, there was NS change in practice for the MST group
Milk/water between meals/snacks
Most services (88% and 89%) worked to a NMS level in both groups; then ~ 50/20% improved to an MS/BP level post training
A positive change/improvement in practice from baseline to post-intervention.
A non-significant change/improvement in practice from baseline to post-intervention.
NMS, non-minimum standard; MS; minimum standard; BP, best practice; MT, manager trained; MST, manager &
staff trained; NS, not significant.

20
Table 6: Classification of pre-schools in manager trained and manager & staff trained intervention groups at baseline and at post-intervention
Baseline
(n 42)
Post-intervention
(n 42)
Manager trained intervention
(n 24)
Manager & staff trained intervention
(n 18)
Manager trained intervention
(n 24)
Manager & staff trained intervention
(n 18)
n (%) n (%) n (%) n (%)
Participation 17 (71) 14 (78) 3 (13) 1 (6)
Bronze 7 (29) 4 (22) 13 (54) 11 (61)
Silver 0 0 7 (29) 6 (33)
Gold 0 0 1(4) 0
Platinum 0 0 0 0
n, number of pre-schools; %, percentage.

21
Self-assessment and observation scoring and classification
When pre-schools self-assessed their service using the assessment tool, they generally gave
themselves a higher score than the research dietitian (Table 7). The MT group awarded their service a
higher number of Gold and Platinum classifications compared to the MST group when self-assessing.
Table 7: Classifications achieved depending on intervention group and method of assessment
Manager trained intervention group
(n 24)
Manager & staff trained intervention group
(n 18)
Classifications
Expert observation
(n 24)
n (%)
Self-assessment
(n 16)
n (%)
Expert observation
(n 18)
n (%)
Self-assessment
(n 11)
n (%)
Participation 3 (13) 0 1 (6) 2 (17)
Bronze 13 (54) 0 11 (61) 5 (42)
Silver 7 (29) 3 (18) 6 (33) 4 (33)
Gold 1 (4) 9 (53) 0 0
Platinum 0 4 (24) 0 0
n, number of pre-schools; %, percentage

22
Views of pre-school providers
1. Intervention/training feedback
Staff feedback from the training sessions is shown in Table 8. A full information session took place
with 113 staff and truncated training (due to weather conditions) took place with 18 staff (n 131).
Table 8: Feedback sessions on the Education Resource Pack training (n 131)
Poor
%
OK
%
Good
%
Very Good
%
Excellent
%
Not answered
Session notes 0 0 2 11 82 6
Session content 0 0 2 13 80 6
Presentation materials, i.e. desk top, flipchart
0 0 2 9 83 7
Assistance and attention
Training session
Participation
Group discussion
0 0 1 9 84
95
94
92
7
It was found that 6% (n 1) did not complete the questionnaire due to lack of time to answer. Other key
findings reported by staff at training included knowledge around serving sizes, how to involve
children in meals, healthy eating guidelines, best practice with food and physical activity, dental
friendly drinks, and planning a varied diet.
2. Barriers/information
At baseline and post-intervention, pre-school managers reported that all of the following affected
their ability to change practice:
The cost of food, the potential of food wastage, staff attitudes and training, children’s habits,
parents’ influence and the economic downturn.
Lack of information and children’s food habits were perceived as a barrier at baseline; however,
this was not evident, post-intervention.

23
Post-intervention, there was an overall drop in the number of managers requesting more information
on certain topic areas and a fall in their concerns around food provision in general.
3. Incentive feedback
Using the Delphi Technique, consensus was reached on 16 ideas, including the following:
A form of recognition for participation, i.e. a plaque, certificate or quality mark for engaging in
the project
Healthy eating and physical activity resources for pre-schools and parents
Equipment, funding, grants or vouchers towards providing healthy eating and physical activity
initiatives in pre-schools

24
6 Discussion
The HIP project is the first intervention study of its kind to take place in pre-schools offering a FDC
service in Ireland. It provides insights into nutrition and related health practice in this setting using
expert observation and self-assessment. The project also investigated the impact of providing two
methods of training to the pre-schools studied which, contrary to expectations, showed the provision
of manager-only training to be as effective in promoting changes in practice as a more intensive
model of training that included staff. This important finding may be attributable to the positive
impact of leadership on the developing quality practice in this setting. In light of current economic
constraints and the potential cost to the health service of providing additional staff training, this
finding is very beneficial.
Some instances of good practice were observed at baseline in this project, specifically in the snacks
provision section. However, a wide range of significant improvements were achieved following
training, particularly in providing planned physical activity, outdoor time, education materials, health
promotion policy, FSFS and improvements in food serving sizes and in the majority of snacks and fluid
provided, as well as in getting more staff to sit and eat with children at food times.
There are, however, a number of areas of practice that still appear to be a challenge to both
intervention groups, with little significant improvement in practice observed in providing ‘all suitable
age-appropriate feeding and drinking utensils’, ‘serving sizes of iron-rich foods’ and ‘reducing top
shelf foods’. In addition, it was apparent that a further challenge for the ‘manager & staff trained’
group involved serving the right drinks with meals and correctly sized dairy food portions and
planning more physical activity sessions. However, it is worth noting that these findings are not
unique to this setting in ROI: Poor nutrition and physical activity practices have also been
documented in other countries, such as the UK (9, 10), the US (11-14), Australia (15) and Holland (16).
It must be acknowledged that good practice not only supports food and nutrition intake but the
emotional, intellectual and motor skills development of a child. Indeed, an FSFS provides a conducive
environment for children to support and develop these skills, as well as having positive effects on
picky eaters (17). Ensuring the provision of adequate outdoor time and planned physical activity is also
fundamental to developing children’s motor skills (18) and is linked to increasing the likelihood of
maintaining a healthy weight (19).
25
Implementing this intervention training has significantly improved nutrition- and health-related
practice in the pre-schools involved. Unfortunately, there is no structured formal training programme
around healthy eating and food safety best practice for pre-school staff, either on the job or through
third level education, despite being recommended in the current Food and Nutrition Guidelines for
Pre-school Services (5). Obviously, best practice is the ideal approach, and the HIP project has
demonstrated that with structured manager training, based on needs identified in the setting,
significant improvements in practice are possible and can lead to many positive changes to the pre-
school setting environment, food service and food provision.
The HIP project acknowledges that changing practice can be a long and gradual process. Considering
the barriers mentioned by pre-schools, such as staff attitudes, parental influences, children’s habits
and the current downturn in the economic climate, it is encouraging to see so many pre-schools
willing to participate. Evidently, barriers do exist for pre-school services in the area of health and
nutrition, and it is acknowledged that it can be challenging to change practice in this setting.
However, the results emerging from this research not only showed initial positive changes but also a
commitment to continuing the project in the community. There is a willingness to work towards
overcoming these challenges and implementing best practice nutrition and health-related guidelines
in the child-care setting where possible. This research demonstrates that, with support, many pre-
schools are willing and able to make changes to improve the diets of the children in their care.
With the high usage of non-parental childcare in Ireland (20) and the growing incidence of childhood
obesity (21), there is a need for a co-ordinated national approach to ensure that childcare is based on
best practice and that pre-schools are supported in achieving these best practice standards in a
positive and meaningful way.
26
7 Conclusion
This project has investigated the introduction of an incentive scheme to the FDC pre-school setting in
ROI. Using a three-tiered approach – an assessment tool to look at food, nutrition and health related
practice; distributing education resources, including a serving size atlas to support practice; and
training of managers and staff – this project supported an improvement in practice.
At baseline, instances of good practice were observed in this setting, particularly in the provision of
healthy snacks. However, many providers were found not to provide adequate amounts of protein and
iron-rich foods. Aspects of pre-school practice that required particular improvement were providing a
family-style food service and a general health-promoting environment.
Post-intervention data collection demonstrated that through manager training and without the need
for additional staff training sessions, improvements in food and health-related practice could be
made. Significantly improved practice was implemented by both intervention groups during this
project in all areas evaluated: the environment, food service meals and snacks section. The research
furthermore highlighted a willingness in the sector to improve practice. Feedback from managers also
emphasised that a form of recognition such as an award scheme should be a feature of any future
intervention in the sector. Overall, the initiative was viewed as practical and acceptable to all parties
involved.
Currently, pre-schools are inspected on food and related practices by a local inspection team. The
assessment tools and resources developed as part of this project will be relevant to any future food
and nutrition practices incorporated into pre-school inspections.

27
8 Key project recommendations Based on the project findings and a review of current best practice literature, a number of
recommendations can be made:
The roll-out of this three-tiered intervention should be considered nationally as part of existing
schemes such as Smart Start5. A national co-ordinated approach is required to support the
implementation of the Food and Nutrition Guidelines for Pre-school Services in this sector,
including basic mandatory staff training. The practical roll-out and application of this initiative
nationwide is a key issue that needs to be considered for future project planning.
The validated assessment tool developed in this research should be considered for use by the pre-
school inspectorate as part of its assessments. Implementing a pre-school healthy eating award
system, which parents can easily identify with, should also be considered for future initiatives.
National physical activity guidelines6 in this sector need to be fully implemented. An effort must
be made to ensure that sufficient physical activity and outdoor time is provided each day and
included in all pre-school assessments.
Supports for this sector should be provided, with clearly signposted resources included to enable
effective interaction and communication with parents so that staff can confidently support
healthy parental practices and behaviours. The resources developed as part of this project and
other resources are signposted through the safefood website: visit www.safefood.eu (8).
Nutrition and health-related practices need to be included in ongoing monitoring and evaluation
of pre-school services.
5 The Healthy Ireland Smart Start Training Programme for Pre-school services is a holistic health promotion
programme that aims to promote the development of a co-ordinated, integrated and strategic approach to the
delivery of accessible, affordable, culturally appropriate and quality early childhood and out of school
services: www.bccn.ie/dynamicpages.php?id=56
6 The national physical activity guidelines state that children should get at least 60 minutes of moderate
intensity activity every day of the week: www.getirelandactive.ie/

28
9 References
1. IUNA. National Pre-School Nutrition Survey: Summary Report on: Food and Nutrient Intakes, Physical Measurements and Barriers to Healthy Eating. Dublin: 2012.
2. Layte R., McCrory C. Growing Up in Ireland. National longitudinal study of children: Key findings, Infant cohort (at 3 years). Dublin: Health Service Executive and Department of Health, 2011.
3. Johnston Molloy C., Corish C.A., Kearney J. & Glennon C. An exploration of food provision, and commitment to the introduction of a nutrition incentive scheme in the pre-school setting. Proc Nutr Soc. 2007; 66 (109A).
4. safefood. What is a serving size? A Guide for Pre-schools. Dublin2013; Available from: http://www.safefood.eu/SafeFood/media/SafeFoodLibrary/Documents/Publications_1/G6101-Safefood-App-Port-Control-Guide_single-pages.pdf.
5. Health Promotion Unit. Food and nutrition guidelines for pre-schools. Dublin: Department of Health and Children, 2005.
6. HSE. 3-Week Menu Plan: A Resource for Pre-schools. Dublin: Health Service Executive, 2004.
7. Caroline Walker Trust. Eating well for 1‒4 year olds: Practical Guide. 2010; Available from: http://www.firststepsnutrition.org/pdfs/FSNT_EatingWell1-4years.pdf.
8. safefood. Little Bites Resource: safe and healthy food experiences for ECCE providers. 2014 [cited 2014 21st October]; Available from: http://www.safefood.eu/Education/Additional-Information/Little-Bites.aspx.
9. Parker M., Lloyd-Williams F., Weston G., Macklin J., McFadden K. Nursery nutrition in Liverpool: an exploration of practice and nutritional analysis of food provided. Public Health Nutrition. 2011; 14(10): 1867-75.
10. Moore H. Nelson P., Marshall J., Cooper M., Zambas H., Brewster K. et al. Laying foundations for health: food provision for under 5s in day care. Appetite. 2005; 44(2): 207-13.
11. Ball S.C., Benjamin S.E., Dunne S., Walsh D.S.. Dietary intakes in North Carolina child-care centers: are children meeting current recommendations. Journal of the American Dietetic Association. 2008; 108(8): 718-21.
12. Erinosho T., Dixon L.B., Young C, Brotman L.M., Hayman L.L. Nutrition practices and children's dietary intakes at 40 child-care centers in New York City. Journal of the American Dietetic Association. 2011; 111(9): 1391-7.
13. Sigman-Grant M., Christiansen E., Branen L., Fletcher J., Johnson S.L. About feeding children: mealtimes in child-care centers in four western states. Journal of the American Dietetic Association. 2008; 108(2): 340-6.
14. Sisson S.B., Campbell J.E., May K.B., Brittain, D.R., Monroe L.A., Guss S.H. et al. Assessment of food, nutrition, and physical activity practices in Oklahoma child-care centers. Journal of the Academy of Nutrition and Dietetics. 2012; 112(8): 1230-40.
15. Zask A., Addams J.K., Brooks L., Hughes D. Tooty Fruity Vegie: an obesity prevention intervention evaluation in Australian pre-schools. Health Promotion Journal of Australia. 2012; 23(1): 10-5.
29
16. Gubbels J.S. Kremers S.P., Stafleu A., Dagnelie P.C., de Vries N.K, Thijs C. Child-care environment and dietary intake of 2- and 3-year-old children. Journal of Human Nutrition and Dietetics. 2010; 23(1): 97-101.
17. States NFSMIU. Mealtime Memo for child care: serving meals family-style. The University of Mississippi. 2003 Contract No.: Accessed 7th August 2012.
18. Riethmuller A.M., Jones R., Okely A.D. Efficacy of interventions to improve motor development in young children: a systematic review. Pediatrics 2009; 124: 782-92.
19. Executive DoHIHS. Fact sheet for childcare providers. Dublin: Department of Health and Children and Health Service Executive, 2011.
20. ESRI. Growing up in Ireland, National Longitudinal Study of Children , Mothers' return to work and childcare choices for infants in Ireland: infant cohort. The Stationery Office, Dublin 2013.
21. Irish Universities Nutrition Alliance (IUNA). National Pre-School Nutrition Survey Full Report. 2012.

30
10 Appendices Appendix A: An outline of the pilot draft assessment form sub-categories and criteria7
Assessment tool categories Assessment tool criteria
Environment (all ages) 1. Whole pre-school health policy
2. Healthy reward scheme
3. Education Activities
4. Planned physical activity
5. Outside in the day
6. Praised for eating
Children 6‒12 months (weaning) 7. Consistency of weaning foods
8. Weaning food appropriately
9. Feeding selves encouraged
10. Iron-rich foods
11. Drinks for infants
12. Unlidded cups
Children over 12 months (weaned children) 13. Providers sitting with children
14. Help when eating
15. Protein portion @ main meal
16. Starch portion @ main meal
17. Dairy portion @ main meal
18. Vegetable portion @ main meal
Snacks over 12 months (weaned children) 19. Fruit as snack
20. Water with meals and snacks
21. Water between meals and snacks
22. Only milk or water offered
23. Milk offered other times during day
24. Snacks low in fat and sugar only
7 Following a literature review, the original scoring system used in the preliminary studies was revisited for
each criterion from a yes/no system to a ‘three way’ value system (0; 1; 3). Services could attain one of three
possible score: ‘does not meet standard’ (zero points scored); ‘partially meets standard’ (one point scored);
or ‘completely meets standard’ (three points scored). HIP project criterion standards were created to clarify
and explain the scoring system, and a classification range for the scoring system was determined as follows:
Participation (score 0‒24); Bronze (score 25‒49); Silver (score 50‒74), Gold (score 75‒99); Platinum (score
100‒120).

31
Appendix B: Draft Assessment tool (pilot)
Draft 4 Assessment tool - Version 6 Code___________
Environment (All Ages)
Not minimum Std
(0)
Minimum Std (1)
Best practice (3)
1. Is there evidence of a ‘whole school’ healthy food policy in this pre-
school?
2. Is there evidence of a healthy reward scheme in place in the pre-
school?
3. Is there evidence of food related education activities in each pre-school
room?
4. Do all children take part in at least one planned physical activity during
the day?
5. Are all infants and children taken outside during the day?
6. Are infants and children praised for eating meals and snacks in each
pre-school room?
Total /6 /24
/30
weaning foods (6–12 months only) Does not meet
minimum std (0)
Minimum Std (1)
Best practice (3)
1. Is consistency of food relevant to all infants’ age and development
stage?
2. Are weaning foods appropriate to age of development?
3. Are infants encouraged to feed themselves at the appropriate age?
4. Are iron-rich weaning foods being given to all infants?
5. Are formula / breast milk and cooled boiled water the only drinks
offered?
6. Are infants given fluid from a two-handled unlidded beaker or cup?
32
Total /6 /24
/30
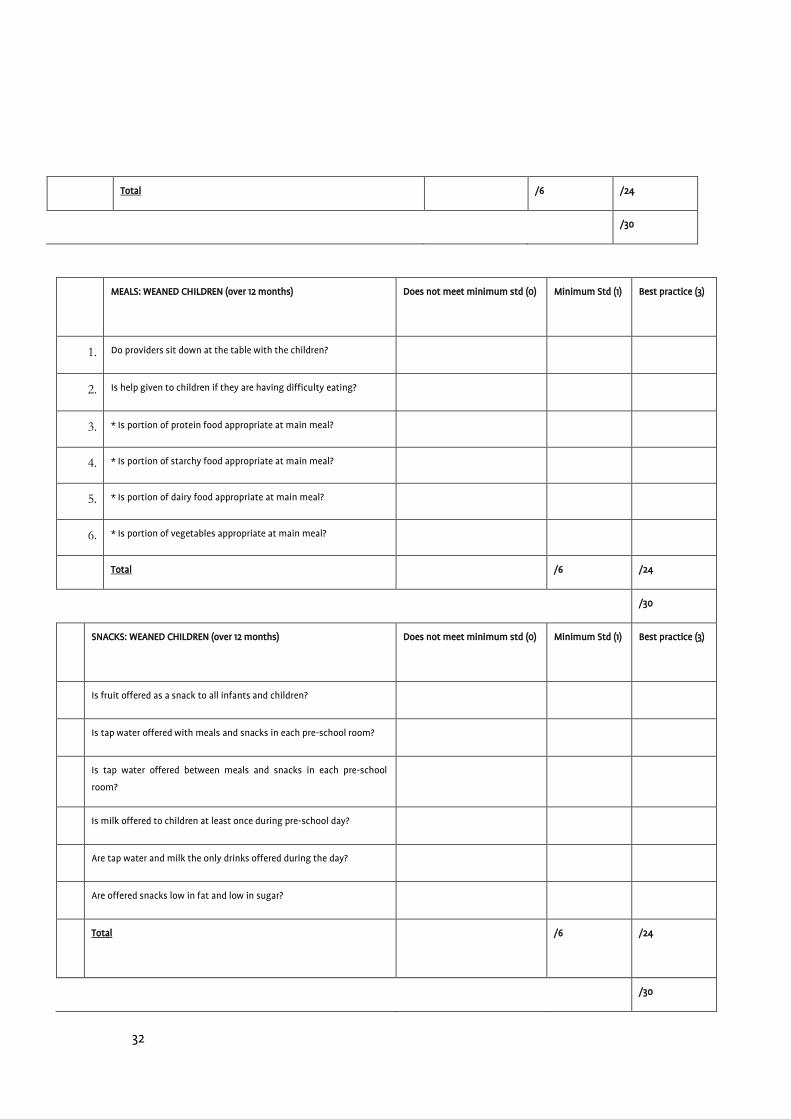
MEALS: WEANED CHILDREN (over 12 months) Does not meet minimum std (0) Minimum Std (1)
Best practice (3)
1. Do providers sit down at the table with the children?
2. Is help given to children if they are having difficulty eating?
3. * * Is portion of protein food appropriate at main meal?
4. * * Is portion of starchy food appropriate at main meal?
5. * * Is portion of dairy food appropriate at main meal?
6. * * Is portion of vegetables appropriate at main meal?
Total /6 /24
/30
SNACKS: WEANED CHILDREN (over 12 months) Does not meet minimum std (0) Minimum Std (1)
Best practice (3)
1. Is fruit offered as a snack to all infants and children?
2. Is tap water offered with meals and snacks in each pre-school room?
3. Is tap water offered between meals and snacks in each pre-school
room?
4. Is milk offered to children at least once during pre-school day?
5. Are tap water and milk the only drinks offered during the day?
6. Are offered snacks low in fat and low in sugar?
Total
/6 /24
/30
33
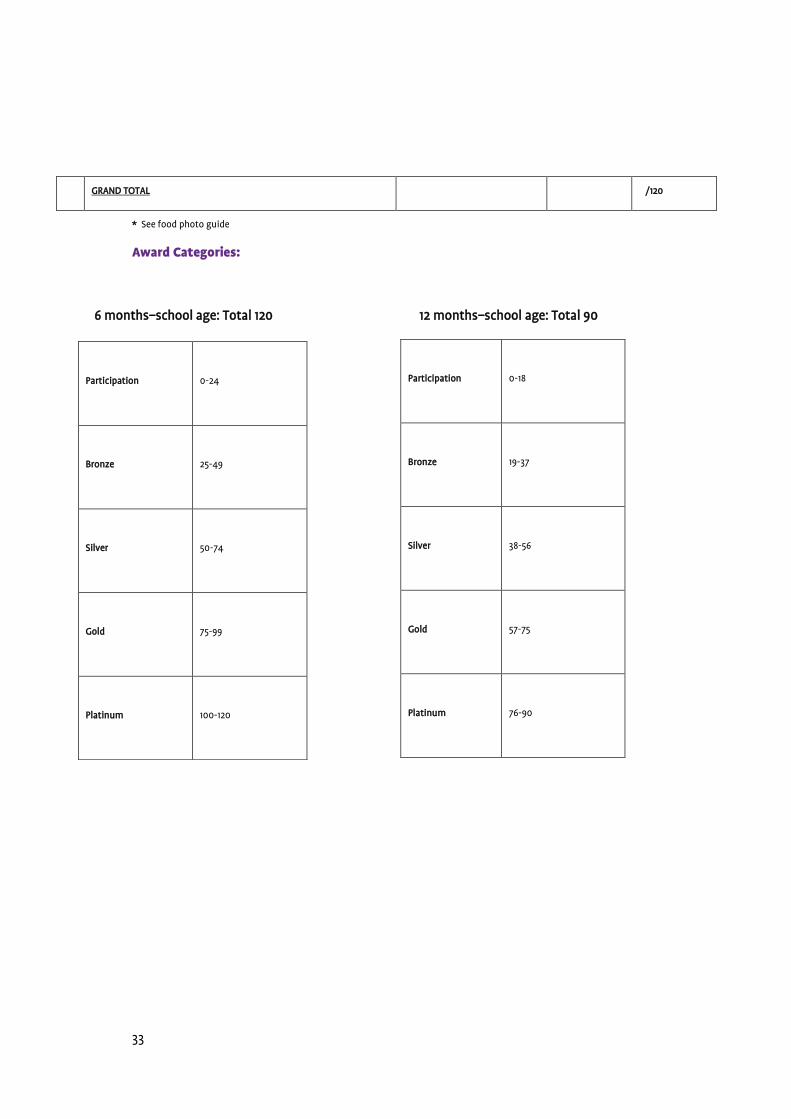
GRAND TOTAL /120
* See food photo guide
Award Categories:
6 months–school age: Total 120 12 months–school age: Total 90
Participation
0-18
Bronze
19-37
Silver
38-56
Gold
57-75
Platinum
76-90
Participation
0-24
Bronze
25-49
Silver
50-74
Gold
75-99
Platinum
100-120

34
Appendix C: Assessment tool (baseline and post-intervention phases)
The assessment tool: (baseline and post-intervention phases of HIP project)
Service code: __________________ Date of assessment tool completion: ___________
Environment
Not
minimum
std (0)
Minimu
m Std (1)
Best
practice
(3)
1. Is there visible evidence of a written ‘whole pre-school service’ healthy policy
in this service?
2. Is there evidence of food related education materials in each service room?
3. ***Do children of all ages take part in the recommended amount of age-
appropriate physical activity during the day?
4. Is there evidence that all infants and children are taken outside during the
day regardless of weather?
5. Is there evidence that food is used as a reward or treat?
6. Are at least two meals and two snacks provided to all full-day care children in
the service?
Total /6 /18
/18
Food service
Not
minimum
std (0)
Minimu
m Std (1)
Best
practice
(3)
1. Does at least one provider sit at each table with the children when the
children are eating, or sit beside infants in highchairs when they are eating?
2. Does at least one provider eat the same food as the children, with the
children and each time that children, irrespective of age, are eating?
3. ***Is ‘family-style food service’ practised in the service?

35
4. Is adequate time allocated to feeding times?
5. ***Are all children, irrespective of age, actively encouraged to feed
themselves?
6. ***Are age-appropriate feeding and drinking utensils available for all ages of
children and infants?
Total /6 /18
*** The developmental
milestones in this
assessment tool would not
apply to children with
special needs
/18
Meals Does not
meet
minimum
std (0)
Minimu
m Std (1)
Best
practice
(3)
1. * * Is appropriate serving of protein food available at the main meal?
2. * * Is appropriate serving of starchy food available at the main meal?
3. * * Is appropriate serving of dairy food available at the main meal?
4. * * Is appropriate serving of vegetables available at the main meal?
5. ***Are meals offered in a self-service style to all children?
6. Is an iron rich food given to all children as part of the main meal?
Total /6 /18
/18
Snacks
Not
minimum
std (0)
Minimu
m Std (1)
Best
practice
(3)
1. Is an appropriate serving of fruit offered to children of all ages on at least one
occasion other than the main meal?
2. Are foods being offered from top shelf of the Food Pyramid?
3. Is an appropriate serving of dairy food offered to each child on at least one

36
occasion other than main meal?
4. Are tap water and milk the only drinks offered with snacks during the pre-
school day?
5. Are tap water, milk or appropriately diluted juice the only drinks offered with
meals during the pre-school day?
6. Is tap water or milk offered to all children between meals and snacks in each
pre-school room?
Total /6 /18
/18
Grand Total /72
* See food weight and measure reference guide
Award Categories:
Total: 72
Participation
0-19
Bronze
20-39
Silver
40-54
Gold
55-64
Platinum
65-72

37
Appendix D: Pilot pre-school characteristics (n 12)
n % Median (IQR) Range
No. of carers 12 100 7 (4) 3-12
No. of children 12 100 29 (20) 15-65
No. of boys 4 33 15 (11) 7-20
No. of girls 4 33 8 (8) 7-17
No. of children <12 m 11 92 0 (1) 0-5
No. of children 12-24 m 11 92 5 (6) 0-30
No. of children 25-36 m 10 83 10 (6) 3-30
No. of children >36 m 10 83 16 (21) 6-49
No. of rooms in facility 12 100 3 (2) 1-4
Daily care charge to parents (€) when services provide food 6 50 44 (22) 20 (55)
Weekly expenditure on food (€) when services provide food 5 42 85 (120) 50-200
n, number of pre-schools; %, percentage, IQR, interquartile range; m, month; €, euro; No., number.

38
Appendix E: Post-intervention characteristics of manager trained intervention and manager &
staff trained intervention pre-schools (n 42)
Characteristics Manager trained intervention
(n 24)
Manager & staff trained intervention
(n 18)
n % Median (IQR) Range n % Median (IQR) Range P value
Total no. of carers 24 100 8 (8) 2-27 18 100 10 (11) 3-30 0.889 NS
Full time staff 24 100 6 (4) 2-16 18 100 4 (6) 2-20 0.337 NS
Part time staff 24 100 3 (6) 0-15 18 100 4 (7) 0-20 0.481 NS
Total no. of children 24 100 51 (32) 18-140 18 100 45 (44) 14-175 0.334 NS
No. of children >5 hr / day (FDC)
24 100 21 (21) 4-117 18 100 15 (12) 2-84 0.077 NS
No. of children <5 hr / day
24 100 31 (35) 5-106 18 100 25 (24) 4-72 0.477 NS
FDC children
(<12 m)
18 75 1 (2) 0-6 16 88.9 1 (3) 0-4 0.957 NS
FDC children (13-24 m) 19 79.2 5 (3) 0-17 17 94.4 4 (7) 0-12 0.431 NS
FDC children (25-36 m) 18 75 5 (4) 1-15 18 100 4 (4) 0-13 0.363 NS
FDC children (>36 m) 19 79.2 9 (6) 0-26 17 94.4 6 (14) 0-27 0.533 NS
Cost FDC (€) / wk <12 mo.
24 100 153 (28) 100-195 15 83.3 150 (25) 127-195 0.633 NS
Cost FDC (€) / wk 13-24 mo.
23 95.8 150 (25) 100-175 17 94.4 150 (18) 127-190 0.575 NS
Cost FDC (€) / wk 25-36 m
24 100 150 (25) 100-175 17 94.4 150 (18) 127-190 0.631 NS
Cost FDC (€) / wk >36 m 24 100 150 (25) 100-175 17 94.4 150 (18) 127-190 0.689 NS
Cost food (€) / wk 22 91.7 200 (125) 70-645 18 100 169 (153) 100-475 0.989 NS
n, number of pre-schools; %, percentage; IQR, interquartile range; M, month; €, euro; FDC, full day care; P, significance level (P <0.05); NS, not significant.

39
Appendix F: Assessment Tool criteria scores at baseline and post-intervention in the manager trained and manager & staff trained
intervention groups. Manager trained Group (n24) Manager & staff trained Group (n18)
Baseline % Post-intervention % Pvalue Baseline % Post-intervention % Pvalue
NMS MS BP NMS MS BP NMS MS BP NMS MS BP
Environment
Policy
96
4
0
42
46
13
**
89
11
0
33
61
6
**
Education materials 46 50 4 4 50 46 ** 22 78 0 0 50 50 **
Planned physical activity 25 75 0 14 92 4 * 11 89 0 0 100 0 NS
Outdoor time 33 58 8 8 54 38 ** 33 67 0 6 67 28 **
Food as reward 33 58 8 8 63 29 ** 39 50 11 6 83 11 NS
Adequate no. meals/snacks
92 14 4 75 17 8 NS 100 0 0 61 11 28 *
Food Service
Staff sitting at food times
96
14
0
17
75
8
***
83
11
6
6
94
0
**
Staff eating with children 88 13 0 42 38 21 ** 78 22 0 39 61 0 *
Family-style food service 88 13 0 29 63 8 *** 78 22 0 6 94 0 *
Time at meals and snacks 42 50 8 13 46 42 ** 39 50 11 0 67 33 *
All kids encouraged to self-feed
13 88 0 4 50 46 ** 11 78 11 0 61 39 NS
Feeding and drinking utensils
92 8 0 71 29 0 NS 100 0 0 94 6 0 NS
75
100
94 71
75 8
63 8
61
94
94

40
Baseline % Post-intervention % Pvalue Baseline % Post-intervention % Pvalue
NMS MS BP NMS MS BP NMS MS BP NMS MS BP
Meals
Portion protein
46
46
8
21
50
29
*
56
44
0
17
44
39
**
Portion starch 0 75 25 0 71 29 NS 0 83 17 0 39 61 *
Portion dairy 67 29 4 54 17 29 * 72 22 6 61 17 22 NS
Portion vegetables 29 50 21 8 42 50 * 39 50 11 6 22 72 **
Self-service meals 88 13 0 46 54 0 ** 78 22 0 28 44 28 **
Iron rich foods 50 42 8 38 38 25 NS 44 50 6 33 39 28 NS
Snacks
Fruit as snack
13
58
29
0
13
88
***
0
72
28
6
17
78
**
Top shelf foods
0 67 33 0 54 46 NS 0 78 22 0 78 22 NS
Dairy other than main meal
17 50 33 8 13 79 ** 6 44 50 0 0 100 **
Drinks with snacks 84 8 8 38 42 20 * 72 22 6 22 61 17 **
Drinks with meals 42 21 38 8 17 75 ** 28 11 61 17 39 44 NS
Milk and water between meals and snacks
88 13 0 33 46 21 *** 89 11 0 28 56 17 **
P, significance level; NMS, non-minimum standard (score=0); MS, minimum standard (score = 1); BP, best practice (score = 3); a scores range from 0-18 in each section; 0-72 as overall score, b Wilcoxon Signed-Rank Test, * P<0.05; ** P<0.01; ***P<0.001; NS, not significant
(Values circled in green demonstrate some of the largest changes in practice from baseline, and those circled in red highlight the lowest.)
100
88
46 21
61 54
38 33
78
79
56 17
46 22

The Healthy Incentive for Pre-schools Project
ISBN: 978-1-905767-52-6
Publication date: January 2015