Embed Size (px)
Citation preview

1
The Health Implications of Reduced Food Stamp Eligibility A RAPID-CYCLE BACKGROUND REPORT Center on Human Needs Virginia Commonwealth University Richmond, Virginia
Steven H. Woolf, M.D., M.P.H. Paula Braveman, M.D., M.P.H. Benjamin F. Evans, M.H.S.A. May 2013
© Virginia Commonwealth University Center on Human Needs, 2013
2
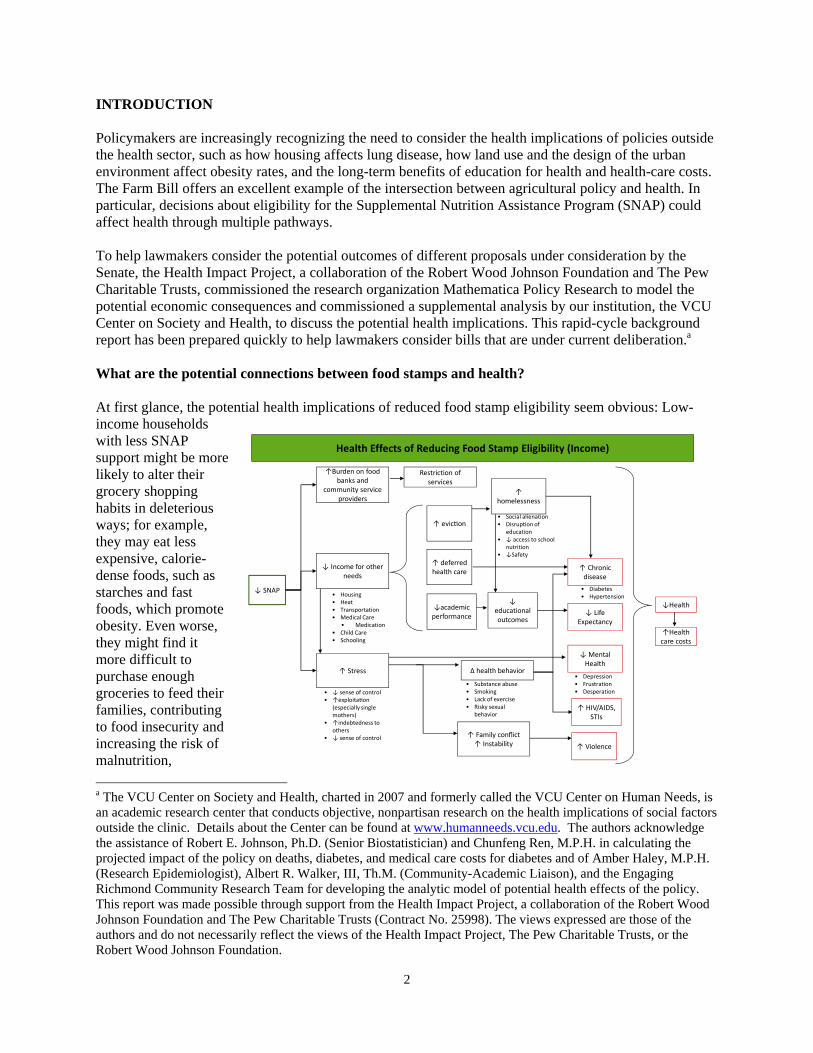
INTRODUCTION Policymakers are increasingly recognizing the need to consider the health implications of policies outside the health sector, such as how housing affects lung disease, how land use and the design of the urban environment affect obesity rates, and the long-term benefits of education for health and health-care costs. The Farm Bill offers an excellent example of the intersection between agricultural policy and health. In particular, decisions about eligibility for the Supplemental Nutrition Assistance Program (SNAP) could affect health through multiple pathways. To help lawmakers consider the potential outcomes of different proposals under consideration by the Senate, the Health Impact Project, a collaboration of the Robert Wood Johnson Foundation and The Pew Charitable Trusts, commissioned the research organization Mathematica Policy Research to model the potential economic consequences and commissioned a supplemental analysis by our institution, the VCU Center on Society and Health, to discuss the potential health implications. This rapid-cycle background report has been prepared quickly to help lawmakers consider bills that are under current deliberation.a What are the potential connections between food stamps and health? At first glance, the potential health implications of reduced food stamp eligibility seem obvious: Low-income households with less SNAP support might be more likely to alter their grocery shopping habits in deleterious ways; for example, they may eat less expensive, calorie-dense foods, such as starches and fast foods, which promote obesity. Even worse, they might find it more difficult to purchase enough groceries to feed their families, contributing to food insecurity and increasing the risk of malnutrition,
a The VCU Center on Society and Health, charted in 2007 and formerly called the VCU Center on Human Needs, is an academic research center that conducts objective, nonpartisan research on the health implications of social factors outside the clinic. Details about the Center can be found at www.humanneeds.vcu.edu. The authors acknowledge the assistance of Robert E. Johnson, Ph.D. (Senior Biostatistician) and Chunfeng Ren, M.P.H. in calculating the projected impact of the policy on deaths, diabetes, and medical care costs for diabetes and of Amber Haley, M.P.H. (Research Epidemiologist), Albert R. Walker, III, Th.M. (Community-Academic Liaison), and the Engaging Richmond Community Research Team for developing the analytic model of potential health effects of the policy. This report was made possible through support from the Health Impact Project, a collaboration of the Robert Wood Johnson Foundation and The Pew Charitable Trusts (Contract No. 25998). The views expressed are those of the authors and do not necessarily reflect the views of the Health Impact Project, The Pew Charitable Trusts, or the Robert Wood Johnson Foundation.
Health Effects of Reducing Food Stamp Eligibility (Income)
↓ SNAP
↑ Stress
↑ Chronic disease
↓ Income for other needs
• Housing• Heat• Transportation• Medical Care
• Medication• Child Care• Schooling
↑ Family conflict↑ Instability
∆ health behavior
• Substance abuse• Smoking• Lack of exercise• Risky sexual
behavior
• Diabetes• Hypertension
• ↓ sense of control• ↑exploita on
(especially single mothers)
• ↑indebtedness to others
• ↓ sense of control
↑ evic on
↑ deferred health care
↓academic performance
↓ Mental Health
• Depression• Frustration• Desperation
↑ homelessness
• Social alienation• Disruption of
education• ↓ access to school
nutrition• ↓Safety
↑Burden on food banks and
community service providers
↑ HIV/AIDS, STIs
↑ Violence
↓educational outcomes
↓ Life Expectancy
Restriction of services
↓Health
↑Health care costs

3
Clearly, income itself does not directly cause good or bad health. It is what money can—or cannot—buy that has potential health consequences.
especially for vulnerable household members such as infants and children, the elderly, or people with chronic illnesses.1,2 The literature about these health effects does not provide a clear picture, however.3,4,5,6,7,8 But the potential connections between food stamps and health go far beyond the obvious links to nutrition and food security. Regardless of how SNAP policy affects food purchasing behavior or eating habits, having to spend more on food means that low-income families have less money available for other important expenses necessary for good health.9,10 The effect on family budgets is not trivial: the Mathematica analysis predicts that SNAP income could be reduced substantially under S.3240 and H.R.6083, bills proposed by the 112th Congress. A large reduction in SNAP income could force beneficiaries who receive lower amounts and those who lose SNAP eligibility to choose between groceries and the costs of stable housing to avoid homelessness; heating, electricity, and other utilities; and transportation to work, school, or doctors’ appointments. People facing financial stresses are more likely to postpone or forgo medical care because they cannot afford health insurance premiums, deductibles, copayments, and medical supplies.11 Patients with chronic diseases are less likely to refill prescriptions. The predictable net result is that patients with less disposable income will give less priority to their health and are more likely to develop preventable complications that demand more intensive (and more costly) acute medical care, emergency department visits, diagnostic testing, and hospitalizations. The stress and psychological pressures when parents and children struggle with economic hardship may have their own health consequences, such as depression, unhealthy behaviors (e.g., smoking, physical inactivity, substance abuse), and family discord and violence—each of which affects health outcomes and costs.12,13 Set against a backdrop of spiraling health care costs that are already posing a crisis for entitlement spending, budget deficits, and the bottom line for major corporations, an unfavorable effect of SNAP policy on health care costs is a disturbing concern. It is easy to imagine the immediate health and economic consequences of not taking medications or visiting the doctor as a result of SNAP policy, but it is also important to consider other effects, both short- and long-term, on children in particular. Infants and children in families affected by such policies can suffer consequences that manifest not only in childhood but also years later as adults. Inadequate nutrition for healthy growth and development and household economic instability that interferes with health care can set the stage for unhealthy behaviors and the chronic diseases of older adulthood. Economic hardship can influence health through many different pathways, which are discussed below.14 HOW DOES INCOME AFFECT HEALTH? Appreciating the link between SNAP legislation and health outcomes rests on the large body of scientific evidence that has documented the many ways in which income can affect physical health, not only in the short-term but also across a person’s entire lifespan. Although evidence has been accumulating for more than a century, the past two decades have brought an explosion of relevant scientific knowledge that now sheds new light on previously unrecognized relationships between income and health. The health impact of losing economic resources, from money to food stamps, depends on a person’s circumstances: For example, the health effects of a given income level are likely to vary with the local cost of living and with other resources available through public programs like SNAP or through family, friends, or neighbors. The health impact of income also varies with how much accumulated wealth or savings a person can fall

4
back on in times of need. At the same level of income, African Americans and Latinos have far less wealth than whites. For example, data available from the U.S. Census Bureau indicate that the wealthof households in the lowest income quintile was on average 400 times greater if the head of household was white rather than black. Racial/ethnic differences in wealth are seen at all income levels; even among high-income households, whites were three to nine times wealthier than blacks.15,16
The next few pages discuss multiple ways in which a loss of income might “get under the skin” to produce physical effects on the body, including some of the physiologic mechanisms that are thought to be involved.b The evidence tells us that the pervasive relationships between income and health are based not just on how economic resources can affect access to medical care, but also on how these resources permit some of us to live in safer homes and neighborhoods, buy healthier food, have more leisure time for physical activity, and experience less stress on a chronic basis from having inadequate resources to make ends meet.17 Early childhood seems to be a period of life in which exposure to chronic economic hardship exacts a particularly heavy toll. In many cases, these health effects may not show up for decades, but the damage is occurring relentlessly over time, whether or not we can see immediate effects. A large body of knowledge in biology has accumulated that explains how poverty can affect health, and how chronic poverty in childhood can take its long-term toll on health in adulthood.18,19,20,21
b A later section discusses controversies about the relationship between income and health. Not all experts agree on all aspects of the relationship between income and health, but the links and interpretations stated here are supported by a large collection of solid scientific literature from respected sources.
Figure 1. As family income rises, children’s health improves. Even middle-class children (in families with incomes 3 to 4 times the poverty level) have worse health than children in higher-income families
Figure 2. Higher income, healthier adults. Even adults with middle- class incomes are less healthy than those with higher incomes.
30.9
21.2
14.0
10.1
6.6
0
5
10
15
20
25
30
35
1PERCEN
T OF ADULTS, AGES ≥ 25 YEARS, W
ITH POOR/FAIR
HEA
LTH*
class incomes are leass healthy than those with higher incomes.
<100% FPL 100‐199% FPL 200‐299% FPL 300‐399% FPL ≥400% FPL
Family Income (Percent of Federal Poverty Level)
*A dj t d
Source: National Health Interview Survey, 2001‐2005 *Age‐adjusted

5
RESEARCH HAS REPEATEDLY SHOWN THAT IN MOST CASES, FROM BIRTH ON, HIGHER INCOME IS
ACCOMPANIED BY BETTER HEALTH AND LONGER LIFE
A large body of research has documented the links between income and a wide array of health indicators across the life span, beginning even before birth.22 Figures 1-4, taken from work by Braveman et al., provide graphic examples of a pattern seen repeatedly for many health outcomes throughout life: a stepwise gradient in which health incrementally improves as income rises.22,23,24 While those at the bottom of the economic ladder typically experience the worst health, even middle-class individuals are less healthy than those who are more affluent.c Adults without a high school education or equivalent are three times as likely to die before age 65 as those with a college education. Although health insurance and education play some role in explaining these links, research has shown that the gaps in health according to income persist even after accounting for insurance and/or education, and even, in some studies, for health-related behaviors like smoking, drinking, and dietary habits.22,23,24,23 The links between income and health are seen very early in life: Rates of low birth weight, which is strongly associated not only with infant mortality but also with child development and chronic disease in adulthood, are highest among infants born to low-income mothers.24,25 Figure 1 shows that children in poor families are about seven times as likely to be in poor or fair health as children in families with incomes at or above 400% of the federal poverty level (FPL).Error! Bookmark not defined. Lower-income children experience higher rates of asthma, heart conditions, hearing problems, digestive disorders, and elevated blood lead levels, which can lead to neurological damage.26,27
Lower income is also associated with shorter and sicker lives among adults. As Figures 2 and 3 show, poor adults are almost five times as likely to report being in poor or fair health as adults with family incomes at or above 400% of the FPL,28 and they are more than three times as likely to have activity limitations due to chronic illness.d
c The stepwise patterns linking income and wealth with health do not necessarily follow a straight line; for example, increases in income are linked with greater health improvements at the lower end of the income scale, and increases in income may not necessarily correspond to better health among those at the very highest end of the income scale (Backlund, Sorlie et al. 1996, Subramanian and Kawachi 2006, Braveman, Cubbin et al. 2010, Dowd, Albright et al. 2011). d Self-reported health is widely used and has been considered a roughly reliable indicator of major differences in health as determined by medical examination.
Figure 3. Higher income, less activity limitation due to chronic illness among adults
Figure 4. Higher income, longer life
32.2
22.4
16.0
12.9
9.4
0
5
10
15
20
25
30
35
1
PERCEN
T OF ADULTS, AGES ≥25 YEA
RS, W
ITH ANY
ACTIVITY LIMITATION*
<100% FPL 100‐199% FPL 200‐299% FPL 300‐399% FPL ≥400% FPL
Family Income (Percent of Federal Poverty Level)
*A dj t d
Source: National Health Interview Survey, 2001‐2005 *Age‐adjusted
49.2
51.4
53.855.7
30
35
40
45
50
55
60
1
YEARS AN ADULT CAN EXPECT TO
LIVE AFTER
AGE 25
≤100% FPL 101‐200% FPL 201‐400% FPL >400% FPL*A dj t d
Source: National Longitudinal Mortality Study, 1988‐1998
Family Income (Percent of Federal Poverty Level)

6
TABLE A. SOME HEALTH OUTCOMES AND RISK FACTORS LINKED WITH INCOME
CHILDREN Health outcomes
Infant mortality, low birth weight, and premature birth Overall health status reported by parents Asthma Lead poisoning Heart conditions Hearing problems Digestive problems
Health risk factors Obesity Nutritional quality of diet Sedentary behavior of adolescents
ADULTS Health outcomes
Life expectancy (mortality) Heart disease Diabetes Stroke Chronic disease that limits normal activities Functional status of the elderly Severe psychological distress Overall self-reported health
Health risk factors Smoking Obesity
Sources: (Pamuk, Makuc et al. 1998, Braveman, Cubbin et al. 2010, Braveman, P., S. Egerter and R. Mockenhaupt (In press). Health is More than Health Care: Social Factors Such as Education Powerfully Shape Health and Health Disparities. Health and Education in Early Childhood: Predictors, Interventions, and Policies. A. J. Reynolds, J. A. Temple, A. Rolnick and H. C. R. Collaborative. Cambridge, Cambridge University Press.
Figure 4 shows that among adults at age 25, those in the highest-income group can expect to live more than six years longer than their poor counterparts; similar disparities by income are seen for both men and women and across racial/ethnic groups (not shown).24,26,28,Error! Bookmark not
defined.e Examination of scores of additional indicators of health, health risks, and health-related behaviors reveals similar stepwise gradient patterns, with health incrementally improving as income rises.23,24,26f Table A lists examples of child and adult health indicators that have been associated with income. It has been observed that the shape of the income-health relationship itself tends to support the conclusion that income actually is a cause of good or bad health.Error! Bookmark not defined. The pattern suggests the “dose-response relationship” observed in drug research, in which incrementally higher doses are linked with stronger effects, which is viewed as supportive evidence that an observed effect is causally related to the drug being tested. Another criterion for making a causal inference is whether it is plausible based on current knowledge of biology; the next section summarizes the pathways through which income could affect health. Not everyone agrees that income influences health. Some economists believe that the strong, repeated links observed between income and health are explained by health influencing income (income loss associated with poor health), rather than income influencing health. While health can shape a person’s prospects for schooling29 and/or employment, multiple experts have concluded, based on evidence, that this does not explain the strength of the observed relationships between income and health. Many experts have concluded that, despite controversies, the weight of evidence overall supports a causal role for income in a wide range of health outcomes, particularly for low-income individuals.30,31,32,33, 34,35,36,37,38
Although there is solid evidence that income affects many health outcomes and groups of people, it may not affect all outcomes, all groups, or all settings;30 for example, the health effects of income are stronger
e Not surprisingly, the income-health gradient generally has appeared less striking among the elderly (Deaton and Paxson 1998), probably because retirement usually brings a loss of income. Despite this, Minkler and colleagues found striking gradients in functional status among the elderly aged 65 to 85 years old, all of whom presumably had Medicare, even after taking into account education and race (which would have partly controlled for wealth). f A clear-cut gradient pattern is not seen for every health indicator; for example, it is not observed consistently among people who are overweight or have diabetes, and it is less clear among some groups, particularly Latinos (Braveman, Cubbin et al. (2010). But these are the exceptions that prove the rule.
7
among low-income persons37when low income is chronic rather than temporary36 and among children. Controversies about the income-health relationship are discussed further in Appendix B.
HOW DOES INCOME INFLUENCE HEALTH?g
As noted above, a reduction in SNAP benefits might affect health significantly by leaving families with less income to devote to other household needs. This loss can reduce access to goods and services that protect and promote health, and the resulting financial pressures can induce stress, which is itself harmful to health when experienced on a chronic basis. Reduced income limits access to health-promoting goods and services. Economic resources can
influence health through so-called “material” pathways, that is, by providing access to health-promoting goods and services. As noted earlier, higher income and greater wealth make it easier to pay for medical insurance premiums, deductibles, copayments, and medicines, which can be particularly important once a person becomes ill. Greater economic resources can also enhance access to the kinds of health-promoting conditions—such as renting or buying housing that is free of lead, cockroaches, dust mites, and mold; properly heating one’s home; staying physically active; and obtaining stable housing in health-promoting neighborhoods—that help prevent illness in the first place.22,34
Among low-income persons, reduced income is stressful. Households already struggling to make ends meet, when faced with the need to spend more money on food, will have less available for other family needs such as housing, heating, child and elder care, and transportation to work. These households may experience increased anxiety and distress about food insecurity, unstable housing, or outright homelessness. Low-income pregnant women are more likely to suffer divorce or separation (presumably because such stresses can produce family conflict and instability), having to move because of difficulty paying the rent or mortgage, or domestic violence. They are also more likely to experience food insecurity and to have trouble paying their bills.39 Low-income people have fewer options for housing and thus are more likely to experience neighborhood violence or disorder, noise, residential crowding, and environmental pollution.40,41,42 The effects of chronic stress are thought to be particularly toxic,18,43 along with the effects of facing multiple stressors.44,45 Chronic stress during early childhood appears to have enduring adverse health effects.19,20,21,24 Chronic financial hardship can take its toll on family and social relationships, parenting, self-esteem, and other factors that have been shown to exert direct and indirect influences on health.46
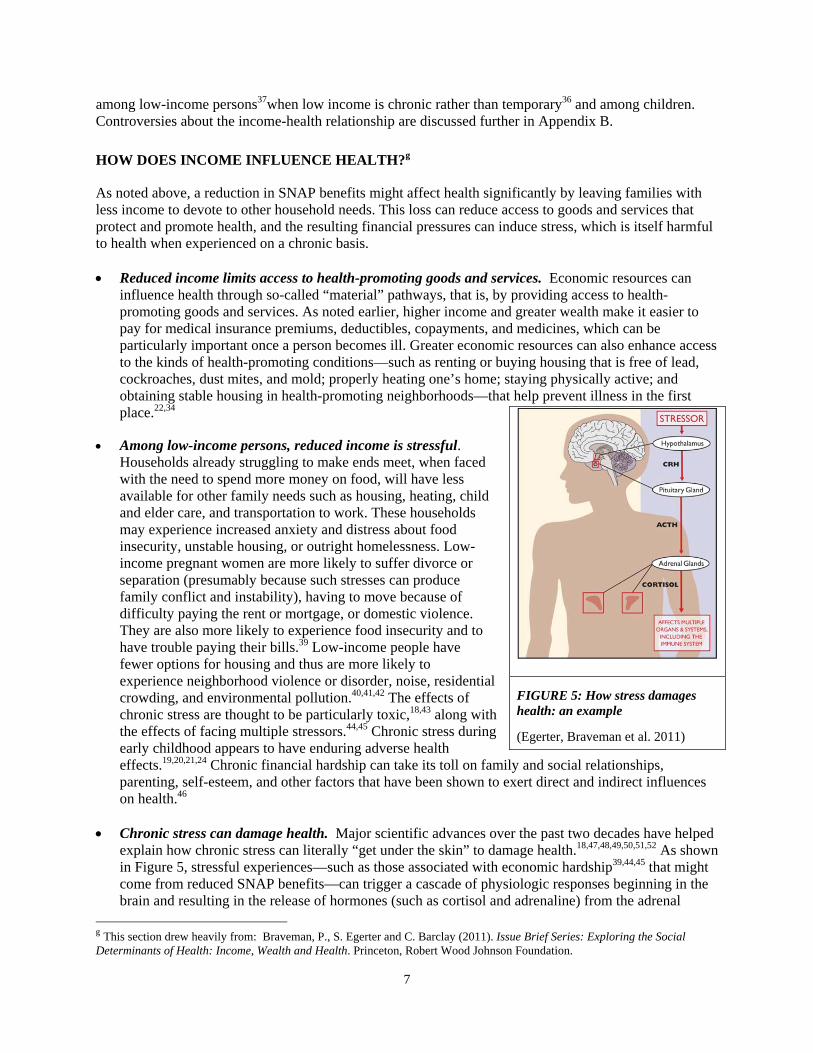
Chronic stress can damage health. Major scientific advances over the past two decades have helped
explain how chronic stress can literally “get under the skin” to damage health.18,47,48,49,50,51,52 As shown in Figure 5, stressful experiences—such as those associated with economic hardship39,44,45 that might come from reduced SNAP benefits—can trigger a cascade of physiologic responses beginning in the brain and resulting in the release of hormones (such as cortisol and adrenaline) from the adrenal
g This section drew heavily from: Braveman, P., S. Egerter and C. Barclay (2011). Issue Brief Series: Exploring the Social Determinants of Health: Income, Wealth and Health. Princeton, Robert Wood Johnson Foundation.
FIGURE 5: How stress damages health: an example
(Egerter, Braveman et al. 2011)

8
glands along with other substances that cause inflammation. Prolonged exposure to these substances, particularly with repeated or prolonged stresses over time, can damage immune defenses and vital organs including the heart.43 This chain of events can result in more rapid onset and progression of chronic illnesses, including heart disease.48 The bodily wear and tear associated with chronic stress may accelerate aging.53,54,55 Stress has been shown to be related to the physiologic changes that accompany aging, including shortening of telomeres, the ends of chromosomes.56 Increasing evidence indicates that the accumulated strain from trying to cope with daily challenges (e.g., having inadequate financial resources for decent housing, heating, food, child care, transportation or medical care) may over time lead to far more physiological damage than a single stressful event, even if that event is dramatic.55 Evidence shows that prolonged and/or severe stress in early childhood can disrupt vital body systems, resulting in continued damage to organs even when an individual’s circumstances are no longer so stressful in adulthood.
HOW SNAP LEGISLATION MIGHT AFFECT CHILDREN—AND THEIR HEALTH AS ADULTS Considerable evidence indicates that young children can be profoundly affected by the conditions they experience in households contending with economic disadvantage. As noted earlier, babies born to low-income women are more likely to be born too small (low birth weight) or too early (premature birth), which in turn are powerful risk factors not only for infant mortality, but also for serious cognitive, behavioral, and physical problems in childhood. Low birth weight is associated with serious chronic diseases in adulthood—including heart disease, hypertension, and diabetes.24,57,58,59 Because of limited housing options for low-income families, low-income children are more likely to be exposed to hazardous conditions in their homes and neighborhoods. For example, lead poisoning due to unsafe lead levels in inadequate housing can result in irreversible neurologic damage.60 Children in low-income families are less likely to have nutritious diets,61 with potential serious long-term health effects.62,63,64,65 Low-income children are more likely to be obese,66 increasing their risks of obesity and related chronic illness as adults.67
Economic hardship during childhood can shape health later in life in other ways as well (Table B). Parents with limited economic resources face greater obstacles to creating healthy home environments and modeling healthy behaviors for their children.22,68 In addition to its direct effects on health, economic disadvantage—especially in the first five years of life—affects health indirectly by having strong effects on education.18,19,20,21 Economic disadvantage is strongly linked with poor cognitive development and lack of school readiness.69,70,71 Parents struggling to make ends meet are less able to provide their children with cognitive stimulation, enriching experiences and materials, or help with homework;44,47,65,69 this in turn has implications for academic achievement, educational attainment, and future employment opportunities and earnings. Poverty condemns children to limited life chances,72 which in turn shape health. One study found that, compared with children in families earning near the median family income (between $35,000 and $49,999 at that time), children growing up in families earning less than $15,000 per year were more than 12 times less likely to graduate
TABLE B. THE HEALTH AND ECONOMIC CONSEQUENCES OF ECONOMIC HARDSHIP IN CHILDHOOD: Consequences seen in childhood:
Poorer cognitive, emotional, social, and physical development
Lower readiness for school and poorer performance in school
Inferior diet Obesity Poorer child health
Consequences not seen until adulthood:
Lower educational attainment and thus greater adult poverty, unemployment, economic insecurity, and lower productivity,
Inability to create healthy circumstances for children
Chronic disease, including heart disease and diabetes
High costs for medical care
9
Early childhood is a critical period of development, during which exposure to stress –e.g., due to economic hardship-- can have particularly powerful and lasting effects (Braveman and Barclay 2009).
from high school.70 Fewer than one in six children born to parents in the lowest income quintile attains the U.S. median household income by middle age.73 Thus, exposing children to the economic disadvantages related to reduced SNAP benefits could not only affect their health in childhood, but may also have consequences that first manifest when they are adults. Children’s experiences of economic hardship also can diminish their chances for economic security and being productive members of the workforce as adults, which in turn can adversely affect their health in later adulthood. Apart from the effects on families and society that result from poor school performance—from problem behaviors to unemployment and poverty—the resulting impact on their health as adults will introduce a public health and economic burden for the next generation because of greater needs for medical care and lost workforce productivity. Compelling research indicates that this effect on adult health is enduring; it persists even when economic circumstances in adulthood are taken into account.24,52,70,74,75,76,77
In addition, both health and economic disadvantage compound over a person’s lifetime and amplify the obstacles to good health. These obstacles in turn are transmitted across generations, as disadvantaged children become adults with limited economic resources and poorer health who are less able to provide health-promoting environments for their own children. Evidence from randomized controlled trials and natural experiments indicate that income assistance programs have a positive effective on physical health, mobility limitations, birth weight, and depression.78,79,80,81,82 Cutting SNAP benefits is likely to deepen the poverty of many families in the United States, and push many more into poverty, with serious health and economic consequences that will be felt by the nation for generations to come. Because blacks and Latinos have the highest rates of poverty and low-income as well as the least wealth at a given income level, the potential health impact of SNAP cutbacks can be expected to fall most heavily on them.
THE ECONOMIC IMPLICATIONS OF INCREASING THE COSTS OF HEALTH CARE Although the proposed SNAP legislation is intended to reduce discretionary spending, the above concerns raise the question of whether the adverse health consequences produced by the legislation might increase the costs of health care and offset some or all of the savings. According to the April 26, 2012 Congressional Budget Office (CBO) report to Senator Stabenow and the July 26, 2012 CBO report on H.R.6083, the projected savings in 2013-2022 from S.3240 and H.R.6083 were $4.49 billion and $16.1 billion, respectively.83,84 What if the increased medical spending resulting from these bills offsets these savings? The proposed legislation has the potential to cause a large proportion of SNAP recipients to enter poverty, falling below the FPL. Given the strength of the connection between poverty and health, even a seemingly small increase in the poverty rate in the United States could increase disease burden and—due to the high costs of health care—offset the projected savings sought by the budget cuts. We developed a scaled logistic regression model that tracks the relationship between household income and three health measures—(a) death rates, (b) the prevalence of diabetes, and (c) the costs of diabetes care—based on publicly available statistics from national, state, and county data sources.h Diabetes was
h The regression model was developed for the County Health Calculator (countyhealthcalculator.org), a project funded by the Robert Wood Johnson Foundation to help the public and policymakers gain a greater appreciation of the important health implications of education and income. The tool allows the user to choose a county, state, or the

10
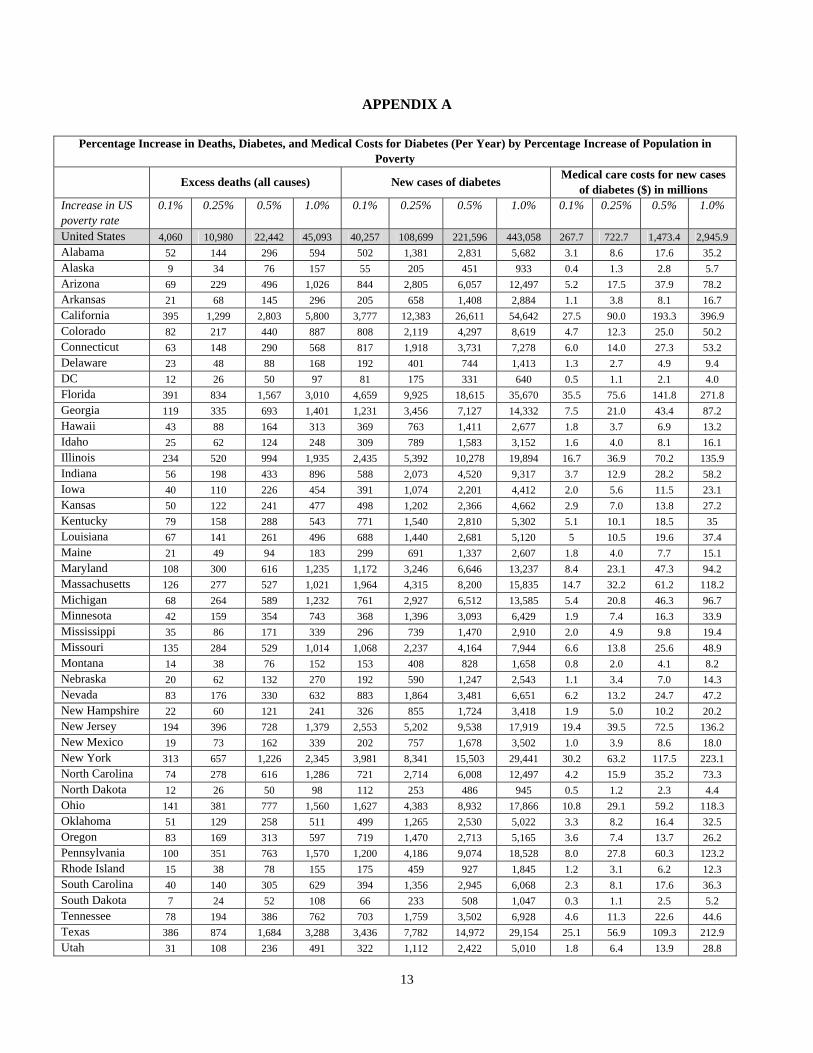
chosen as an example of the many chronic diseases that affect health and medical spending in the United States and that occur with much higher prevalence among low-income vulnerable populations, such as SNAP recipients. We emphasize that diabetes is just one example and the total impact on health and spending must be pooled across the totality of health conditions to obtain a full estimation of the economic consequences of increasing socioeconomic disadvantage. The Appendix lists the changes in these outcomes that would be expected nationally, and in each of the 50 states, if the poverty rate was increased by small proportions: 0.10%, 0.25%, 0.50%, and 1.00%. The financial implications for the United States (Table C) show that, apart from increasing death rates and the prevalence of diabetes by substantial proportions, the incremental increase in medical spending for one disease alone—diabetes—could range from $268 million to $2.95 billion per year, the latter exceeding the projected savings from even the more aggressive House bill ($1.47 billion per year in 2013-2017, $1.73 billion per year in 2018-2022). The more modest savings sought by the Senate bill would be offset by an even smaller increase in the U.S. poverty rate (0.25%). The total impact on medical spending would be considerably higher than the values shown here for diabetes.
TABLE C. SAVINGS FROM PROPOSED LEGISLATION AND PROJECTED SPENDING INCREASES FOR DIABETES
Annual Increases in Medical Care Costs for Diabetes, Given an Increase in Poverty
Annual savings per CBO projections
0.10% increase in poverty
0.25% increase in poverty
0.50% increase in poverty
1.00% increase in poverty
S.3240 $0.35 billion (2013-17) $0.55 billion (2018-22)
$0.27 billion $0.72 billion $1.47 billion $2.95 billion
H.R.6083 $1.47 billion (2013-17) $1.73 billion (2018-2022)
These are estimated effects at the broad population level in the United States; the impact will vary at the local level. To illustrate this variation, in Table D we show the variation in projected impact for 11 legislative districts and counties.
nation and to examine the effect on avertable deaths, new cases of diabetes, and the costs of medical care for diabetes that would be expected with higher levels of education or income.

11
TABLE D. PROJECTED IMPACT OF INCREASED POVERTY RATES IN 11 DISTRICTS AND COUNTIES
Excess deaths (all causes, per year) New cases of diabetes (per year) Medical care costs for new cases of
diabetes (per year, millions of dollars)
Increase in Poverty Rate
0.10% 0.25% 0.50% 1.0% 0.10% 0.25% 0.50% 1.0% 0.10% 0.25% 0.50% 1.0%
Iowa, 5th District
13 27 50 94 144 295 542 1022 0.7 1.6 2.9 5.5
Minnesota, 7th District
6 21 47 97 75 278 613 1270 0.4 1.5 3.2 6.5
North Carolina, 7th District
9 30 65 135 99 348 760 1572 0.6 2.2 4.8 9.9
Ohio, 8th District
11 36 79 162 144 491 1064 2188 0.9 3.3 7.2 14.8
Oklahoma, 3rd District
10 29 60 120 116 322 661 1326 0.7 2.0 4.2 8.4
Virginia, 6th District
9 24 50 98 120 320 646 1274 0.6 1.6 3.3 6.5
California, 12th District
13 32 65 131 135 350 708 1418 1.0 2.5 5.0 10.0
Kentucky, Jefferson County
12 27 52 101 113 262 508 994 0.7 1.7 3.3 6.4
Michigan, Clare County
1 1 2 4 4 11 21 41 0.0† 0.1 0.2 0.3
Mississippi, Hinds County
2 6 12 24 23 58 117 233 0.2 0.4 0.7 1.4
Nevada, Clark County
25 93 205 426 307 1150 2540 5263 2.4 9.3 20.5 42.5
Notes: Calculations for House districts were derived by aggregating results for constituent counties. Some House districts include specific cities but not the surrounding counties. For example, Tulsa (but not Tulsa County) is included in the 3rd District of Oklahoma. For ease of calculation our projections include surrounding counties. † = less than $50,000 in costs. These districts and counties were selected as areas relevant to the leadership and ranking members of the U.S. House of Representatives, the House Agriculture Committee, the House Subcommittee on Nutrition and Horticulture, and the leadership and ranking members of the U.S. Senate and the Senate Agriculture Committee.
Caveats The limitations of these projections should be noted. The underlying regression model relies on known statistical relationships between income and health, compiled from more than 3,000 counties in the United States and state-based data on diabetes rates. The pervasiveness of these associations in the analyses presented here, and found throughout the literature are compelling, but associations do not definitively prove causality. Knowing the rates of mortality and disease that are expected in places with higher poverty rates does not necessarily prove that increasing poverty rates will produce those outcomes. Mortality data are from 2007-2009 and diabetes data are from 2009. Assumptions about medical care costs in our model are based on county-level estimates of per capita expenditures for Medicare enrollees and the American Diabetes Association estimate of $6,649 as the national per capita cost of diabetes care.
12
More details about the methods and limitations entailed in the analysis can be found at http://countyhealthcalculator.org/wp-content/uploads/2012/01/CHC_Tool_V2_TechDoc.pdf. Appendix B also discusses common questions about the quality of evidence that links income and health. CONCLUSIONS The limitations just stated make it inappropriate to state conclusively that the proposed SNAP legislation would cost more than it saves by increasing medical spending, but the body of evidence reviewed earlier suggests that this is a serious possibility that policymakers should consider. The evidence detailed in this report is, however, adequate to conclude that the economic stresses on low-income households who lose SNAP benefits will produce adverse health consequences that claim lives, increase disease rates, and increase health care costs—even though the exact magnitude of this effect cannot be stated with scientific precision. The above “ballpark estimates” suggest the real possibility that the budgetary savings intended by policymakers could be partially or fully offset by increases in medical care costs and will certainly claim a toll on the health of Americans, especially children. An effect on workforce productivity is also likely when children in low-income families who lose SNAP benefits today become tomorrow’s adults. The reduction in benefits could ultimately serve no purpose if, in the end, it produces little savings or ultimately induces higher costs. The adverse impact on the health and economic wellbeing of SNAP households, the future health and productivity of children in those households, and the economic future of tomorrow’s workforce—all in a failed effort to save money—would be an undesirable legacy of the legislation.
13
APPENDIX A
Percentage Increase in Deaths, Diabetes, and Medical Costs for Diabetes (Per Year) by Percentage Increase of Population in Poverty
Excess deaths (all causes) New cases of diabetes Medical care costs for new cases
of diabetes ($) in millions Increase in US poverty rate
0.1% 0.25% 0.5% 1.0% 0.1% 0.25% 0.5% 1.0% 0.1% 0.25% 0.5% 1.0%
United States 4,060 10,980 22,442 45,093 40,257 108,699 221,596 443,058 267.7 722.7 1,473.4 2,945.9
Alabama 52 144 296 594 502 1,381 2,831 5,682 3.1 8.6 17.6 35.2
Alaska 9 34 76 157 55 205 451 933 0.4 1.3 2.8 5.7
Arizona 69 229 496 1,026 844 2,805 6,057 12,497 5.2 17.5 37.9 78.2
Arkansas 21 68 145 296 205 658 1,408 2,884 1.1 3.8 8.1 16.7
California 395 1,299 2,803 5,800 3,777 12,383 26,611 54,642 27.5 90.0 193.3 396.9
Colorado 82 217 440 887 808 2,119 4,297 8,619 4.7 12.3 25.0 50.2
Connecticut 63 148 290 568 817 1,918 3,731 7,278 6.0 14.0 27.3 53.2
Delaware 23 48 88 168 192 401 744 1,413 1.3 2.7 4.9 9.4
DC 12 26 50 97 81 175 331 640 0.5 1.1 2.1 4.0
Florida 391 834 1,567 3,010 4,659 9,925 18,615 35,670 35.5 75.6 141.8 271.8
Georgia 119 335 693 1,401 1,231 3,456 7,127 14,332 7.5 21.0 43.4 87.2
Hawaii 43 88 164 313 369 763 1,411 2,677 1.8 3.7 6.9 13.2
Idaho 25 62 124 248 309 789 1,583 3,152 1.6 4.0 8.1 16.1
Illinois 234 520 994 1,935 2,435 5,392 10,278 19,894 16.7 36.9 70.2 135.9
Indiana 56 198 433 896 588 2,073 4,520 9,317 3.7 12.9 28.2 58.2
Iowa 40 110 226 454 391 1,074 2,201 4,412 2.0 5.6 11.5 23.1
Kansas 50 122 241 477 498 1,202 2,366 4,662 2.9 7.0 13.8 27.2
Kentucky 79 158 288 543 771 1,540 2,810 5,302 5.1 10.1 18.5 35
Louisiana 67 141 261 496 688 1,440 2,681 5,120 5 10.5 19.6 37.4
Maine 21 49 94 183 299 691 1,337 2,607 1.8 4.0 7.7 15.1
Maryland 108 300 616 1,235 1,172 3,246 6,646 13,237 8.4 23.1 47.3 94.2
Massachusetts 126 277 527 1,021 1,964 4,315 8,200 15,835 14.7 32.2 61.2 118.2
Michigan 68 264 589 1,232 761 2,927 6,512 13,585 5.4 20.8 46.3 96.7
Minnesota 42 159 354 743 368 1,396 3,093 6,429 1.9 7.4 16.3 33.9
Mississippi 35 86 171 339 296 739 1,470 2,910 2.0 4.9 9.8 19.4
Missouri 135 284 529 1,014 1,068 2,237 4,164 7,944 6.6 13.8 25.6 48.9
Montana 14 38 76 152 153 408 828 1,658 0.8 2.0 4.1 8.2
Nebraska 20 62 132 270 192 590 1,247 2,543 1.1 3.4 7.0 14.3
Nevada 83 176 330 632 883 1,864 3,481 6,651 6.2 13.2 24.7 47.2
New Hampshire 22 60 121 241 326 855 1,724 3,418 1.9 5.0 10.2 20.2
New Jersey 194 396 728 1,379 2,553 5,202 9,538 17,919 19.4 39.5 72.5 136.2
New Mexico 19 73 162 339 202 757 1,678 3,502 1.0 3.9 8.6 18.0
New York 313 657 1,226 2,345 3,981 8,341 15,503 29,441 30.2 63.2 117.5 223.1
North Carolina 74 278 616 1,286 721 2,714 6,008 12,497 4.2 15.9 35.2 73.3
North Dakota 12 26 50 98 112 253 486 945 0.5 1.2 2.3 4.4
Ohio 141 381 777 1,560 1,627 4,383 8,932 17,866 10.8 29.1 59.2 118.3
Oklahoma 51 129 258 511 499 1,265 2,530 5,022 3.3 8.2 16.4 32.5
Oregon 83 169 313 597 719 1,470 2,713 5,165 3.6 7.4 13.7 26.2
Pennsylvania 100 351 763 1,570 1,200 4,186 9,074 18,528 8.0 27.8 60.3 123.2
Rhode Island 15 38 78 155 175 459 927 1,845 1.2 3.1 6.2 12.3
South Carolina 40 140 305 629 394 1,356 2,945 6,068 2.3 8.1 17.6 36.3
South Dakota 7 24 52 108 66 233 508 1,047 0.3 1.1 2.5 5.2
Tennessee 78 194 386 762 703 1,759 3,502 6,928 4.6 11.3 22.6 44.6
Texas 386 874 1,684 3,288 3,436 7,782 14,972 29,154 25.1 56.9 109.3 212.9
Utah 31 108 236 491 322 1,112 2,422 5,010 1.8 6.4 13.9 28.8

14
Vermont 10 22 43 84 122 279 539 1,050 0.7 1.6 3.0 5.9
Virginia 160 382 749 1,473 1,700 4,043 7,895 15,407 9.4 22.3 43.6 85.0
Washington 139 302 575 1,116 1,222 2,662 5,045 9,746 7.0 15.1 28.6 55.3
West Virginia 33 71 135 259 389 845 1,594 3,058 2.4 5.2 9.8 18.9
Wisconsin 78 197 393 780 967 2,430 4,839 9,547 5.4 13.6 27.1 53.5
Wyoming 19 39 71 135 202 409 750 1,420 1.1 2.1 3.9 7.3
15
APPENDIX B HOW STRONG IS THE EVIDENCE THAT INCOME AFFECTS HEALTH?
Not everyone is convinced that lower levels of income actually lead to poorer health; several economists have noted that poorer health can be the cause of low income rather than the other way around. Most economists accept that severe material deprivation due to extreme poverty can play a causal role in poor health outcomes (Subramanian and Kawachi 2006), but some question the notion that income has a major influence on health. In addition, many people assume that the connections between economic resources and health are explained by access to health insurance and medical care. The literature on this subject is extensive. Although most of the evidence underscores the strong influence of income on disease, there are ongoing debates and some studies have concluded that income does not influence health (Kawachi et al., 2010). The largest body of evidence consists of what are known as cross-sectional studies, which show a consistent correlation between income and poor health, but correlation does not prove causality. As discussed below, some critics ask whether the correlation represents reverse causality, in which poor health leads to lower income. However, prospective or longitudinal studies, which track health outcomes years after individuals or populations were exposed to losses of income, have generally produced consistent findings indicating that income does indeed influence health, and the same is true of modeling studies (Lindahl, 2002; Case, 2004; Buckley et al., 2004; Kaplan et al., 2007; Paxson and Schady, 2010; Hajat et al., 2011). Results of longitudinal studies should carry more weight because they can answer the question of whether the arrow goes from income to health or vice versa. Longitudinal studies have generally affirmed that although health can indeed affect income, “reverse causation” does not explain the strength of the observed links between income and health; the most important effects are those of income on health.
Studies reporting that more income does not lead to better health suffer from other methodologic limitations: • Short observation periods. Based on the pathways and biological mechanisms through which
income can affect health, it makes sense that short-term increases in income would not necessarily lead to improved health. It is long-term, chronic poverty/low income that is expected to have appreciable effects.
• Ignoring the heterogeneity of health outcomes. One would not expect income to affect all health outcomes. Some authors who reviewed findings by those who concluded that income has no effect on health found that these reviewers had overlooked significant income effects on particular outcomes.
• Ignoring the heterogeneity of individuals. One would not expect income to have a positive effect on health among all individuals in all contexts. One study (Snyder & Evans, NBER 2002) found that increases in Social Security income did not improve health among the elderly; accumulated wealth may be more important than income among the elderly. Research suggests that income would have the greatest effects on children and that the effects would diminish with age. In addition, that study found that Social Security recipients who received higher payments were less likely to continue working, and other studies have documented that employment is associated with better health. One would not expect income to improve health in all circumstances.
• Adjustment for the wrong covariates. Many studies are biased against detecting the health effects of income because they adjust for education, health insurance, and other factors that are likely to be on the causal pathway between income and health at an earlier stage of the life course.

16
The evidence of a causal effect is not universal. For example, examination of mortality effects of the “social security notch”—a decline in payments created by legislation in the 1970s—did not show a causal effect (Snyder and Evans, 2006). However, that study focused on senior citizens, a population less likely to experience health benefits from economic changes. Many studies that have failed to observe an income effect on health have had observation periods that were too short to detect the health effects that would be predicted based on current knowledge of development and stress physiology. Others have failed to focus on the populations most likely to be affected. Some frequently-raised questions about the links between income and health are noted below, along with a brief summary of relevant evidence answering the questions. However, analysts who have carefully critiqued this literature have concluded that income plays an important causal role in health (Kawachi et al., 2010). “None of this evidence is perfect, which is certainly not unusual in the policy arena, but the consistency and breadth of the evidence is impressive” (Kaplan, 2009). Question 1: The role of health insurance. Aren’t the links between greater income and better health explained primarily by the fact that having more money allows a person to obtain medical care by purchasing medical insurance and/or paying out-of-pocket for medical expenses not covered by insurance? Answer 1: No. The ability to pay for medical care undoubtedly contributes to health, but the evidence (including that presented earlier) indicates that this does not fully explain the links between economic resources and health. Strong and consistent stepwise gradient patterns linking health and socioeconomic advantage—with
health improvements seen with every step up the socioeconomic latter—have been observed pervasively in western European countries including the United Kingdom, France and the Netherlands, despite universal medical care insurance coverage (Marmot, Smith et al. 1991, Kunst, del Rios et al. 1998, Mackenbach, Cavelaars et al. 2000, Kunst, Bos et al. 2005, Avendano, Kunst et al. 2006).
A number of studies in the United States have found strong associations between income and different health indicators even after taking insurance coverage into account (Sorlie, Johnson et al. 1994, Ross and Mirowsky 2000, Newacheck, Hung et al. 2003, Sudano and Baker 2006, Szanton, Allen et al. 2008, McGrail, van Doorslaer et al. 2009, Victorino and Gauthier 2009).
Question 2: Does income affect health, or does health affect income? Many researchers have asked whether the links between income and health are actually explained by the fact that poorer health leads to reduced income, rather than lower income leading to worse health. This is referred to as “reverse causation.” Answer 2: Both are true, but studies have shown that the effects of income on health are more important than the reverse. We know that the pathways linking health and economic resources operate in both directions—income affects health, and health can affect income. For example, serious illness can lead to loss of employment and the burden of medical expenses. This question arises particularly when studies examine only a single point or short period in people’s lives. As summarized above, however, based on well-designed studies that have followed people over time, it is clear that substantial changes in health and important health-related risk factors occur following changes in income; this means that the changes cannot be due only to the effects of health on income (Daly, Duncan et al. 2002, Herd, Goesling et al. 2007, Avendano and Glymour 2008). Thus, reverse causation does not fully explain the observed connections between income and health (Backlund, Sorlie et al. 1996, McDonough, Duncan et al. 1997, Goldman 2001, Case, Lubotsky et al. 2002, Muennig 2008, Kawachi, Adler et al. 2010).

17
Question 3: Other factors.Could the links between income and health be due to other factors that haven’t been considered? Answer 3: Unlikely. The case supporting the health effects of economic resources has been presented above, including the evidence regarding scientifically plausible pathways that may explain the observed links. Some researchers have contended that income differences in health reflect differences in innate intelligence (Herrnstein and Murray 1994); that proposition has been discredited (Link, Phelan et al. 2008). It is further strengthened by evidence from several randomized studies and natural experiments (Kawachi, Adler et al. 2010). SUPPLEMENTAL REFERENCES FOR APPENDIX B (SEE ADDITIONAL CITATIONS BELOW)
Adams P, Hurd MD, McFadden D, Merrill A, Ribeiro T. Health, wealth, and wise? Tests for direct causal paths between health and socioeconomic status. Journal of Econometrics. 2003;112(1):3-56. Adda J, Banks J, von Gaudecker HM. The impact of income shocks on health: evidence from cohort data. Discussion Paper No. 3329 January 2008. Bonn: Institute for the Study of Labor (IZA), 2008. Avendano M, Glymour MM. Stroke disparities in older Americans: is wealth a more powerful indicator of risk than income and education? Stroke. 2008;39(5): 1533-1540. Avendano M, Kunst AE, Huisman M, Lenthe FV, et al. Socioeconomic status and ischaemic heart disease mortality in 10 western European populations during the 1990s. Heart. 2006;92(4): 461-467. Backlund E,Sorlie PD, Johnson N J. The shape of the relationship between income and mortality in the United States. Evidence from the National Longitudinal Mortality Study. Ann Epidemiol. 1996;6(1): 12-20; discussion 21-12. Buckley NJ, Denton FT, Robb AL, Spencer BG. Healthy aging at older ages: are income and education important? Can J Aging. 2004;23 Suppl 1:S155-69. Case A. Does money protect health status? Evidence from South African pensions. In: Wise DA, editor. Perspective on the Economics of Aging. Chicago, IL: University of Chicago Press; 2004: 287-312. Daly MC, Duncan GJ, McDonough P, Williams DR. Optimal indicators of socioeconomic status for health research. Am J Public Health. 2002;92(7): 1151-1157. Deaton AS, Paxson CH. Aging and inequality in health and income. American Economic Review. 1998;88(2): 248-253. Goldman N. Social inequalities in health disentangling the underlying mechanisms. Ann NY Acad Sci. 2001;954: 118-139. Hajat A, Kaufman JS, Rose KM, Siddiqi A, Thomas JC. Long-term effects of wealth on mortality and self-rated health status. Am J Epidemiol. January 15, 2011;173(2):192-200. Herd P, Goesling B, House JS. Socioeconomic position and health: the differential effects of education versus income on the onset versus progression of health problems. J Health Soc Behav. 2007;48(3): 223-238. Herd P, Schoeni RF, House JS. Upstream solutions: does the supplemental security income program reduce disability in the elderly? Milbank Q. March 2008;86(1):5-45. Herrnstein RJ, Murray CA. The Bell Curve : Intelligence and Class Structure in American Life. New York, NY: Free Press; 1994. Kaplan GA, Baltrus PT, Raghunathan TE. The shape of health to come: prospective study of the determinants of 30-year health trajectories in the Alameda County Study. Int J Epidemiol. June 2007;36(3):542-8. Kaplan GA, Ranjit N, Burgard S. Lifting gates--lengthening lives: Did civil rights policies improve the health of African-American women in the 1960's and 1970's? In: House JS, Schoeni RF, Kaplan GA, Pollack H, editors. Social and Economic Policy as Health Policy. New York, NY: Russell Sage; 2008. Kunst AE, Bos V, Lahelma E, et al.Trends in socioeconomic inequalities in self-assessed health in 10 European countries. Int J Epidemiol. 2005;34(2): 295-305. Lindahl M. Estimating the Effect of Income on Health and Mortality Using Lottery Prizes as Exogenous Source of Variation in Income. Bonn, Germany: Institute for the Study of Labor; February 2002 . Report No.: IZA DP No. 442. Kunst AE, del Rios M, Groenhof F, Mackenbach JP. Socioeconomic inequalities in stroke mortality among middle-aged men: an international overview. European Union Working Group on Socioeconomic Inequalities in Health. Stroke. 1998;29(11): 2285-2291. Link BG, Phelan JC, Miech R, Westin EL. The resources that matter: fundamental social causes of health disparities and the challenge of intelligence. J Health Soc Behav. 2008;49(1): 72-91. Mackenbach JP, Cavelaars AE, Kunst AE, Groenhof F. Socioeconomic inequalities in cardiovascular disease mortality; an international study. Eur Heart J. 2000;21(14): 1141-1151. McDonough P, Duncan GJ, Williams D, House J. Income dynamics and adult mortality in the United States, 1972 through 1989. Am J Public Health. 1997;87(9): 1476-1483. McGrail KM, van Doorslaer E, Ross NA, Sanmartin C. Income-related health inequalities in Canada and the United States: a decomposition analysis. Am J Public Health. 2009;99(10): 1856-1863. Meer J, Miller DL, Rosen HS. Exploring the health-wealth nexus. J Health Econ. 2003;22(5):713–730. Newacheck PW, Hung YY, Park MJ, Brindis CD, Irwin CE Jr. Disparities in adolescent health and health care: does socioeconomic status matter? Health Serv Res. 2003;38(5): 1235-1252. Paxson C, Schady N. Does money matter? The effects of cash transfers on child development in rural Ecuador. Econ Dev Cult Change. 2010;59(1):187-229. Ross CE, Mirowsky J. Does medical insurance contribute to socioeconomic differentials in health? Milbank Q. 2000;78(2): 291-321, 151-292.

18
Snyder SE, Evans WN. The effect of income on mortality: evidence from the social security notch. Review of Economics and Statistics. 2006;88(3):482-95 Sorlie PD, Johnson NJ, Backlund E, Bradham DD. Mortality in the uninsured compared with that in persons with public and private health insurance. Arch Intern Med. 1994;154(21): 2409-2416. Sudano JJ, Baker DW. Explaining US racial/ethnic disparities in health declines and mortality in late middle age: the roles of socioeconomic status, health behaviors, and health insurance. Soc Sci Med. 2006;62(4): 909-922. Szanton SL, Allen JK, Thorpe RJ Jr, Seeman T, Bandeen-Roche K, Fried LP. Effect of financial strain on mortality in community-dwelling older women. J Gerontol B Psychol Sci Soc Sci. 2008;63(6): S369-374. Victorino CC, Gauthier AH. The social determinants of child health: variations across health outcomes - a population-based cross-sectional analysis. BMC Pediatr. 2009;9: 53.

19
REFERENCES
1 Borjas, G. Food insecurity and public assistance. Journal of Public Economics. 2004;88:1421-1443. 2 Krueger, Patrick M. To help or to harm? Food stamp receipt and mortality risk prior to the 1996 Welfare Reform Act. Social Forces. 2004; 82(4):1573-1599. 3 Effects of Food Assistance and Nutrition Programs on Nutrition and Health: Volume 4, Executive Summary of the Literature Review. By Mary Kay Fox and William Hamilton, Abt Associates Inc., and Biing-Hwan Lin, Food and Rural Economics Division, Economic Research Service, U.S. Department of Agriculture. Food Assistance and Nutrition Research Report No. 19-4. 4 Hoynes HW, Schanzenbach DW, Almond D. Long Run Impacts of Childhood Access to the Safety Net. National Bureau on Economic Research; November 2012. 5 Wilde PE. Measuring the effect of food stamps on food insecurity and hunger: Research and policy considerations. The Journal of Nutrition. 2007;137:307-310. 6 Cason KL, Wenrich TR, Cox R, Burney JL, Poole K. Do food stamps without education improve the nutrient intake of recipients? Top Clin Nutr. 2002;17(4):74-82. 7 Cason KL, Cox RH, Wenrich TR, Poole KP, Burney JL. Food stamp and non-food stamp program participants show similarly positive change with nutrition education. Top Clin Nutr. 2004;19(2):136-147. 8 Shapiro JM. Is there a daily discount rate? Evidence from the food stamp nutrition cycle. Journal of Public Economics. 2005; 89:303-325. 9 Hamermesh JM, Johannes M. Food Stamps as Money and Income. NBER Working Paper Series. National Bureau of Economic Research. 1983. 10 Whitmore D. What are Food Stamps Worth? Working Paper #468. Princeton University Industrial Relations Section. 2002. 11 National Center for Health Statistics. Health, United States, 2011: With special feature on socioeconomic status and health. Hyattsville, MD: National Center for Health Statistics; 2012. 12 Alaimo K, Olson CM, Frongillo EA. Family food insufficiency, but not low family income, is positively associated with dysthymia and suicide symptoms in adolescents. J. Nut. 2002;132:719-725. 13 Laitinen J, Ek E, Sovio U. Stress-related eating and drinking behavior and body mass index and predictors of this behavior. Prev. Med. 2002;34:29-39. 14 Woolf SH, Braveman P. Where health disparities begin: the role of social and economic determinants—and why current policies could make matters worse. Health Affairs. 2011;30:1852-9. 15 Orzechowski S, Sepielli P. Net Worth and Asset Ownership of Households: 1998 and 2000. Current Population Reports, US Census Bureau. 2003. 16 Kawachi I, DanielsN, Robinson DE. Health disparities by race and class: Why both matter. Health Affairs. 2005;24(2), 343-352. 17 Commission on Social Determinants of Health. Closing the Gap in a Generation: Health Equity Through Action on the Social Determinants of Health. Final Report of the Commission on Social Determinants of Health. Geneva, World Health Organization,. 2008. 18 Taylor SE, Repetti RL, Seeman T. Health psychology: what is an unhealthy environment and how does it get under the skin? Annu Rev Psychol. 1997;48: 411-447. 19 Shonkoff J P, Boyce WT, McEwen BS. Neuroscience, molecular biology, and the childhood roots of health disparities: building a new framework for health promotion and disease prevention. JAMA. 2009;301(21): 2252-2259. 20 Institute of Medicine. From Neurons to Neighborhoods: The Science of Early Childhood Development. Washington, D.C., National Academy Press; 2000. 21 Boyce, W.T, Sokolowski MB, Robinson GE. Toward a new biology of social adversity. Proc Natl Acad Sci USA. 2012; 109 (suppl 2): 17143-17148. 22 Braveman P,Egerter S, Barclay C. Issue Brief Series: Exploring the Social Determinants of Health: Income, Wealth and Health. Princeton, Robert Wood Johnson Foundation; 2011. 23 Shah RU, Winkleby MA, Van Horn L,et al. Education, income, and incident heart failure in post-menopausal women: the Women's Health Initiative Hormone Therapy Trials. J Am Coll Cardiol. 2011;58(14): 1457-1464. 24 Braveman P, Barclay C. Health disparities beginning in childhood: a life-course perspective. Pediatrics. 2009;124 (suppl 3): S163-175. 25 Blumenshine P, Egerter S, Barclay C J, Cubbin C, Braveman PA. Socioeconomic disparities in adverse birth outcomes: a systematic review. Am J Prev Med. 2010;39(3): 263-272.
20
26 Pamuk E, Makuc D, Keck K, Reuban C, Lochner K. Socioeconomic Status and Health Chartbook. Health, United States, 1998. Hyattsville, MD: National Center for Health Statistics; 1998. 27 Case A, Lubotsky D, Paxson C. Economic Status and health in childhood: The origins of the gradient. American Economic Review. 2002;92: 1308-1334. 28 Braveman P, Egerter S. Overcoming obstacles to health: report from the Robert Wood Johnson Foundation to the Commission to Build a Healthier America. Princeton, NJ: Robert Wood Johnson Foundation; 2008. 29 Le F, Diez Roux A, Morgenstern H. Effects of child and adolescent health on educational progress. Soc Sci Med. 2013;.76(1), 57-66. 30 Kawachi I, Adler NE, Dow WH. Money, schooling, and health: Mechanisms and causal evidence. Annals of the New York Academy of Sciences. 2010;1186(1): 56-68. 31 Kaplan G. The Poor Pay More--Poverty's High Cost to Health (Trans. Ed.). Princeton, N.J.: Robert Wood Johnson Foundation; 2009. 32 National Research Council and Institute of Medicine. Children's Health, the Nation's Wealth: Assessing and Improving Child Health (Trans. Ed.^Eds. ed. Vol.). Washington, DC: The National Academies Press; 2004. 33 Marmot, M. The influence of income on health: views of an epidemiologist. Health Aff (Millwood). 2002; 21(2), 31-46. 34 Subramanian SV, Kawachi I. Being well and doing well: On the importance of income for health. Int J Soc Welfare. 2006;15(Suppl 1): S13-S22. 35 Muennig P. Health selection vs. causation in the income gradient: what can we learn from graphical trends? J Health Care Poor Underserved. 2008;19(2): 574-579. 36 Benzeval M, Judge K. Income and health: the time dimension. Soc Sci Med. 2001;52(9), 1371-90. 37 Dowd J B, Albright J, Raghunathan TE, Schoeni RF, Leclere F, Kaplan GA. Deeper and wider: income and mortality in the USA over three decades. Int J Epidemiol. 2011;40(1): 183-188. 38 Kaplan GA, Shema SJ, Leite CM. Socioeconomic determinants of psychological well-being: the role of income, income change, and income sources during the course of 29 years. Ann Epidemiol. 2008;18(7), 531-7. 39 Braveman P, Marchi K, Egerter S, Kim S, Metzler M, Stancil T, Libet M. Poverty, near-poverty, and hardship around the time of pregnancy. Matern Child Health J. 2009;14(1): 20-35. 40 Matthews KA, Gallo LC, Taylor SE . Are psychosocial factors mediators of socioeconomic status and health connections? A progress report and blueprint for the future. Ann N Y Acad Sci. 2010;1186: 146-173. 41 Baum A, Garofalo JP, Yali AM. Socioeconomic status and chronic stress. Does stress account for SES effects on health? Ann N Y Acad Sci. 1999;896: 131-144. 42 Lynch M. Consequences of children's exposure to community violence. Clin Child Fam Psychol Rev. 2003;6(4): 265-274. 43 McEwen BS. The neurobiology of stress: from serendipity to clinical relevance. Brain Res. 2000;886(1-2): 172-189. 44 Evans GW. The environment of childhood poverty. Am Psychol. 2004;59(2): 77-92. 45 Evans GW, Kim P. Childhood poverty and health: cumulative risk exposure and stress dysregulation. Psychol Sci. 2007;18(11): 953-957. 46 Kahn JR, Pearlin LI. Financial strain over the life course and health among older adults. J Health Soc Behav. 2006;47(1): 17-31. 47 Hertzman C, Power C. Health and human development: understandings from life-course research. Dev Neuropsychol. 2003;24(2-3): 719-744. 48 Steptoe A, Marmot M. The role of psychobiological pathways in socio-economic inequalities in cardiovascular disease risk. Eur Heart J. 2002;23(1): 13-25. 49 Sapolsky RM. The influence of social hierarchy on primate health. Science. 2005;308(5722): 648-652. 50 McEwen BS. Stress, adaptation, and disease. Allostasis and allostatic load. Ann N Y Acad Sci. 1998;840: 33-44. 51 Cohen S, Evans GW, Stokols D, Krantz DS. Behavior, Health and Environmental Stress. New York, NY, Plenum Press; 1986. 52 Bauer AM, Boyce WT. Prophecies of childhood: how children's social environments and biological propensities affect the health of populations. Int J Behav Med. 2004;11(3): 164-175. 53 Seeman TE, Singer BH, Rowe JW, Horwitz RI, McEwen BS. Price of adaptation--allostatic load and its health consequences. MacArthur studies of successful aging. Arch Intern Med. 1997;157(19): 2259-2268. 54 Seeman TE, McEwen BS, Rowe JW, Singer BH. Allostatic load as a marker of cumulative biological risk: MacArthur studies of successful aging. Proc Natl Acad Sci U.S.A. 2001; 98(8): 4770-4775.

21
55 McEwen BS. Protective and damaging effects of stress mediators: central role of the brain. Dialogues Clin Neurosci. 2006;8(4): 367-381. 56 Puterman E, Epel E. An intricate dance: Life experience, multisystem resiliency, and rate of telomere decline throughout the lifespan. Soc Personal Psychol Compass. 2012;6(11): 807-825. 57 Morley R. Fetal origins of adult disease. Semin Fetal Neonatal Med. 2006;11(2): 73-78. 58 Institute of Medicine, Committee on Understanding Premature Birth and Assuring Healthy Outcomes and Board on Health Sciences Policy. Preterm Birth: Causes, Consequences, and Prevention. Washington, DC, The National Academies Press; 2007. 59 Barker DJ. The developmental origins of adult disease. J Am Coll Nutr. 2004;23(6 Suppl): 588S-595S. 60 Centers for Disease Control and Prevention. Blood lead levels--United States, 1999-2002. MMWR Morb Mortal Wkly Rep. Centers for Disease Control and Prevention. 2005;54: 513-516. 61 Bhattacharya J, Currie J, Haider S. Poverty, food insecurity, and nutritional outcomes in children and adults. J Health Econ. 2004;23(4): 839-862. 62 Wadsworth ME. Health inequalities in the life course perspective. Social Science & Medicine. 1997;44(6): 859-869. 63 Lynch J, Davey Smith G. A life course approach to chronic disease epidemiology. Annual Review of Public Health. 2005;26: 1-35. 64 Joint WHO/FAO Expert Consultation. Diet, Nutrition, and the Prevention of Chronic Diseases. WHO Technical Report Series 916. Geneva, Switzerland, World Health Organization; 2003. 65 Bradley RH, Corwyn RF. Socioeconomic status and child development. Annual Review of Psychology. 2002;53: 371-399. 66 Singh GK, Siahpush M, Kogan MD. Rising social inequalities in US childhood obesity, 2003-2007. Ann Epidemiol. 2010;20(1): 40-52. 67 Power C, Lake JK, Cole TJ. Measurement and long-term health risks of child and adolescent fatness. Int J Obes Relat Metab Disord. 1997;21(7): 507-526. 68 Woolf SH, Dekker MM,Byrne FR, Miller WD. Citizen-centered health promotion: building collaborations to facilitate healthy living. Am J Prev Med. 2011;40(1 suppl 1): S38-47. 69 Votruba-Drzal E. Income changes and cognitive stimulation in young children's home learning environments. Journal of Marriage and Family. 2003;65(2): 341-355. 70 Duncan GJ,Yeung WJ,Brooks-Gunn J, Smith JR. How much does childhood poverty affect the life chances of children? Am Sociol Rev. 1998;63(3): 406-423. 71 Dearing E. Psychological costs of growing up poor. Ann N Y Acad Sci. 2008;1136: 324-332. 72 Heckman JJ. Role of income and family influence on child outcomes. Ann N Y Acad Sci. 2008;1136: 307-323. 73 Kaplan G. The Poor Pay More--Poverty's High Cost to Health. Princeton, N.J.; Robert Wood Johnson Foundation; 2009. 74 Kittleson MM,Meoni LA,Wang NY,Chu AY,Ford DE, Klag MJ. Association of childhood socioeconomic status with subsequent coronary heart disease in physicians. Arch Intern Med. 2006;166(21): 2356-2361. 75 Hayward MD, Gorman BK. The long arm of childhood: the influence of early-life social conditions on men's mortality. Demography. 2004;41(1): 87-107. 76 Davey-Smith G,Hart C,Blane D, Hole D. Adverse socioeconomic conditions in childhood and cause specific adult mortality: prospective observational study. BMJ. 1998;316(7145): 1631-1635. 77 Case A,Fertig A, Paxson C. The lasting impact of childhood health and circumstance. Journal of Health Economics. 2005;24(2): 365-389. 78 Miller C,Huston A, Duncan G, McLoyd V, Weisner T. New Hope for the Working Poor: Effects after Eight Years for Families and Children. New York, NY: MDRC; 2008. 79 Kehrer BH, Wolin CM. Impact of income maintenance on low birth weight: evidence from the Gary Experiment. J Hum Resour. 1979;14(4): 434-462. 80 Herd P, House J, Schoeni R. Income support policies and health among the elderly. Health Effects of Non-Health Policy. Bethesda, MD; 2006. 81 Lindahl M. Estimating the effect of income on health and mortality using lottery prizes as an exogenous source of variation in income. The Journal of Human Resources. 2005;40(1): 144-168. 82 Costello EJ, Compton SN, Keeler G, Angold A. Relationships between poverty and psychopathology: a natural experiment. JAMA. 2003;290(15): 2023-2029. 83 Congressional Budget Office letter to Honorable Debbie Stabenow, Chairman, Committee on Agriculture, Nutrition, and Forestry, April 26, 2012.

22
84 Congressional Budget Office Cost Estimate, July 26, 2012, H.R. 6083, Federal Agriculture Reform and Risk Management Act of 2012, As ordered reported by the House Committee on Agriculture July 11, 2012.