Embed Size (px)
Citation preview
June 2016
A Division of the New York State Department of Labor
The Health Care Sector in
New York State
1
Overview of the U.S. Health Care System: Big and Getting Bigger
The U.S. health care system is big and growing at an above-average rate. In 2014, health care spending
in our nation grew by 5.3% to $3.0 trillion, or $9,523 per person, and accounted for 17.5% of U.S. Gross
Domestic Product (GDP), according to the Centers for Medicare & Medicaid Services (CMS).
Projections from CMS covering the 2015-2025 period indicate U.S. health care spending is expected to
grow at an average rate of 5.8 %/year. This rate of increase is 1.3 percentage points faster than
projected annual growth in overall U.S. GDP over this period. As a result, health care’s share of
American GDP is expected to rise from 17.5% in 2014 to 20.1% by 2025.
This projected increase in health care spending is a continuation of a trend that has been in place over
the past half century. For example, U.S. health care spending experienced phenomenal growth
between 1960 and 1980 as its share of GDP almost doubled, rising from only 5.0% in 1960 to 8.9% in
1980.
What accounts for the rapid, long-term growth in U.S. health care spending? Health care economists
cite several key factors as contributing to above-average increases in U.S. health care expenditures,
including:
Advancements in technology are a primary driver. As knowledge in health and health care
conditions expands, new and improved products, techniques, and services are developed. For
example, Sovaldi, a specialty drug introduced in 2013 to treat hepatitis C, costs about $95,000
for a full treatment.
Rising personal income is another important factor. As disposable personal income increases, a
greater proportion of it is typically spent on health care products and services.
The aging of the U.S. population is a third key factor. By 2030, our nation’s 76 million baby
boomers (people born in 1946-1964) will account for one in five Americans. As this group ages,
they will require more care and have more long-term medical needs.
Related to the third factor above is increasing life expectancy (at birth) in the U.S. It grew from
73.7 to 78.8 years between 1980 and 2013 due to the combined effects of innovations in health
care, reduction in malnutrition, improvements in sanitation, and infectious disease control.
2
A Significant Industry in New York State
Health care also plays a significant role in New York State’s economy. It employed more than 1.2
million workers (private and public sectors combined) in 2015, according to the Quarterly Census of
Employment and Wages (QCEW), which is based on employers’ Unemployment Insurance records. This
translates into about one in seven jobs in the state in 2015. Total wages paid out by the state’s health
care sector were $66.7 billion in 2015, or about 11% of total payrolls in the state. The average pay for
health care workers was $55,500 in 2015.
Between 2009 and 2015, combined private and public sector health care employment grew by 9%. This
rate of change was slightly above the growth rate registered by all non-health care industries in the
state (+8%) over the same time frame. A growing health care sector has a significant employment
impact in New York State. Data from Economic Modeling Specialists International indicate that for
every 100 new health care jobs created in New York, an additional 107 spin-off jobs are created within
the state.
Employment and Wages in New York State’s Health Care Sector
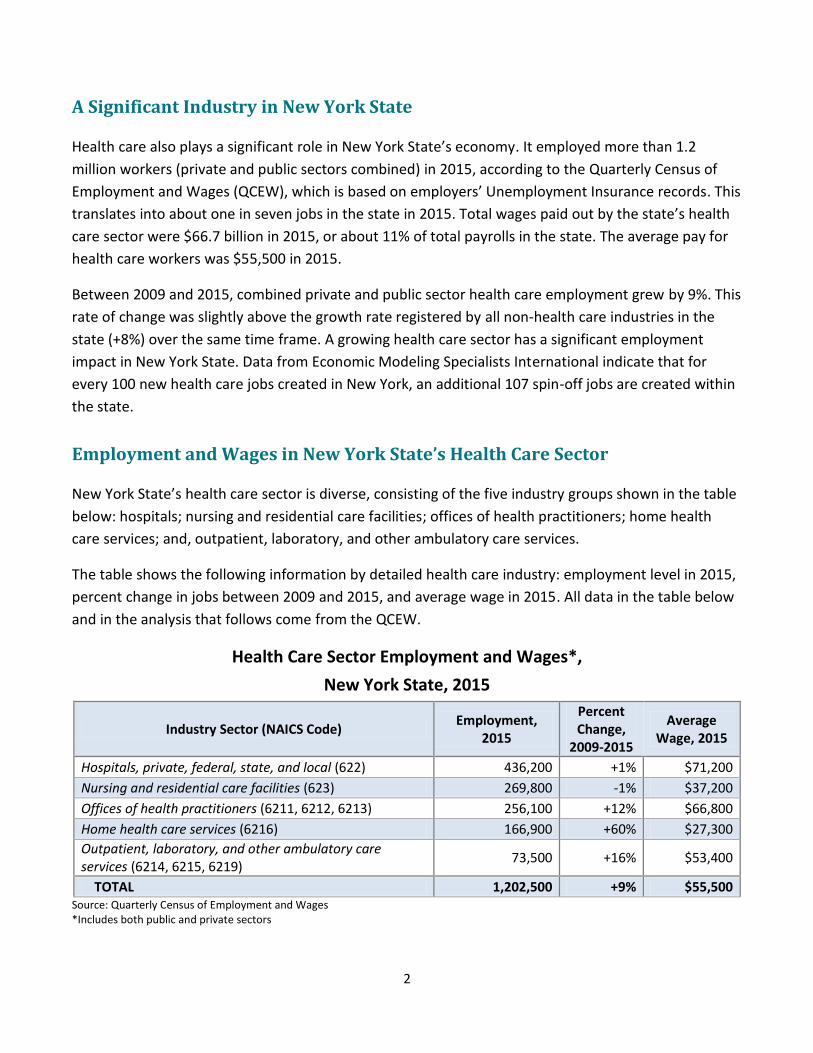
New York State’s health care sector is diverse, consisting of the five industry groups shown in the table
below: hospitals; nursing and residential care facilities; offices of health practitioners; home health
care services; and, outpatient, laboratory, and other ambulatory care services.
The table shows the following information by detailed health care industry: employment level in 2015,
percent change in jobs between 2009 and 2015, and average wage in 2015. All data in the table below
and in the analysis that follows come from the QCEW.
Health Care Sector Employment and Wages*,
New York State, 2015
Industry Sector (NAICS Code) Employment,
2015
Percent Change,
2009-2015
Average Wage, 2015
Hospitals, private, federal, state, and local (622) 436,200 +1% $71,200
Nursing and residential care facilities (623) 269,800 -1% $37,200
Offices of health practitioners (6211, 6212, 6213) 256,100 +12% $66,800
Home health care services (6216) 166,900 +60% $27,300
Outpatient, laboratory, and other ambulatory care services (6214, 6215, 6219)
73,500 +16% $53,400
TOTAL 1,202,500 +9% $55,500 Source: Quarterly Census of Employment and Wages *Includes both public and private sectors
3
Hospitals – This industry accounted for the most jobs (436,200) in New York State’s health care sector
in 2015, making up 36% of overall employment. This industry group experienced a small (+1%)
employment gain between 2009 and 2015. Hospitals have the highest average wage ($71,200) in New
York State among the five health care industries in this analysis.
The primary role of this industry is to provide inpatient services including surgery, diagnostic tests and
specialized medical treatments. Hospitals often also offer outpatient services to meet the needs of
patients. This industry encompasses a variety of hospitals, from surgical hospitals to psychiatric
hospitals.
Nursing and Residential Care Facilities – This industry group makes up 22% of total health care
employment in New York State, making it the second largest overall. This industry group experienced a
small (-1%) employment loss between 2009 and 2015. Workers in the Nursing and Residential Care
Facilities industry had the second lowest average wage ($37,200) in New York State in 2015.
Facilities in this industry are designed to provide extended stay and long-term services, through
nursing and supervisory care. Examples include nursing care facilities, substance abuse facilities and
developmental disability facilities.
Offices of Health Practitioners – This is the third largest health care industry in New York State, with
just over 256,000 workers in 2015. Offices of Health Practitioners saw a 12% employment increase in
2009-2015. Earning an average of $66,800/year, workers in this industry had the second highest
average wage in 2015, trailing only hospital workers.
Employers in this sector operate private or group practices either in their own offices or in larger
facilities, such as medical centers. This sector is comprised primarily of the offices of physicians and
dentists. They made up 21% of New York’s health care sector employment in 2015. Offices of other
medical specialties, such as optometrists and podiatrists, are also found in this industry.
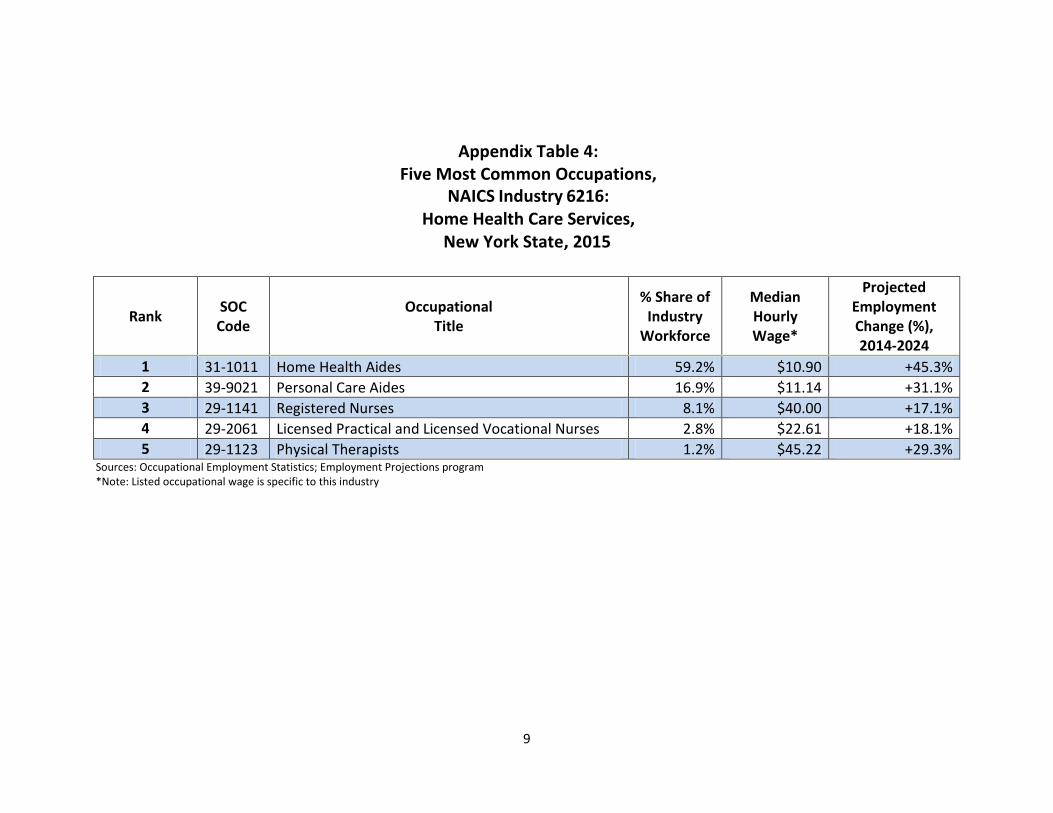
Home Health Care – Accounting for 14% of health care jobs in New York State in 2015, this is the
lowest-paying health care industry, with an annual average wage of just $27,300. However, Home
Health Care experienced the most rapid employment increase (+60%) of any health care industry in the
state between 2009 and 2015.
This industry provides nursing and care services in the home to patients. Some types of home health
services provided are physical therapy, nutritional services and personal care services. Home health
care agencies and visiting nurse associations are two types of employers that fall into this industry
sector.
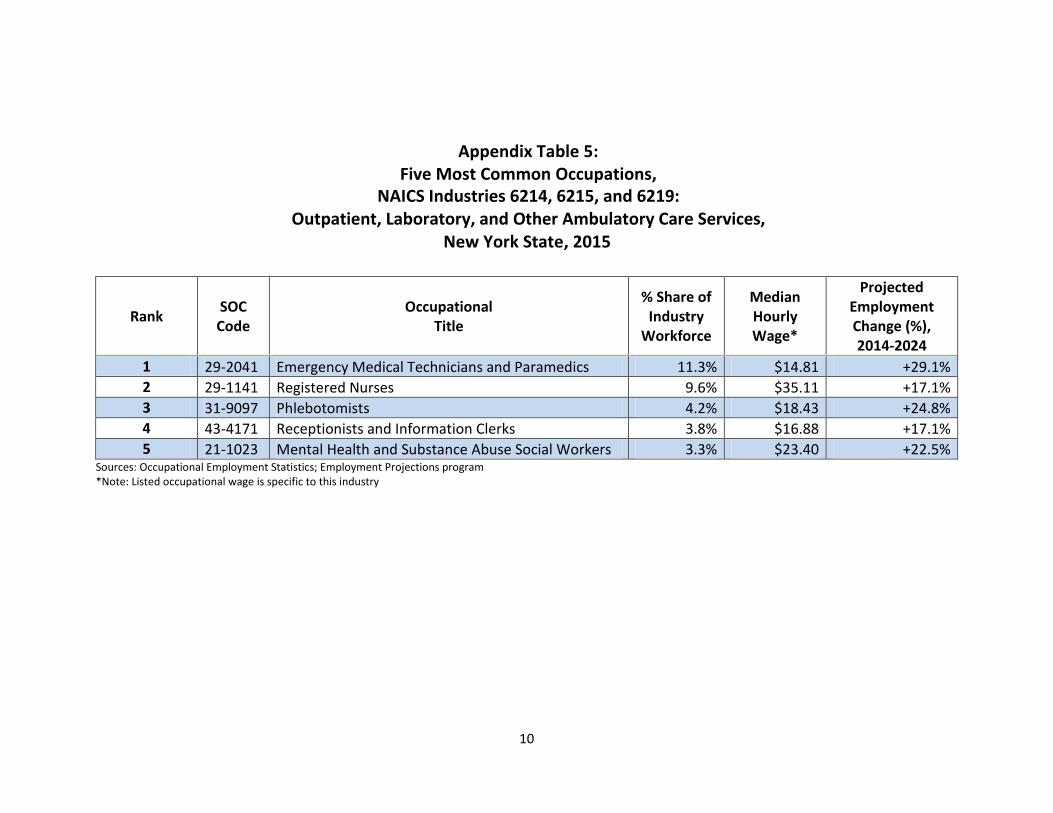
Outpatient, Lab & Other Ambulatory Care – This is the smallest health care industry in the state,
accounting for only 6% of overall sector jobs in 2015. The employment count in the Outpatient, Lab &
4
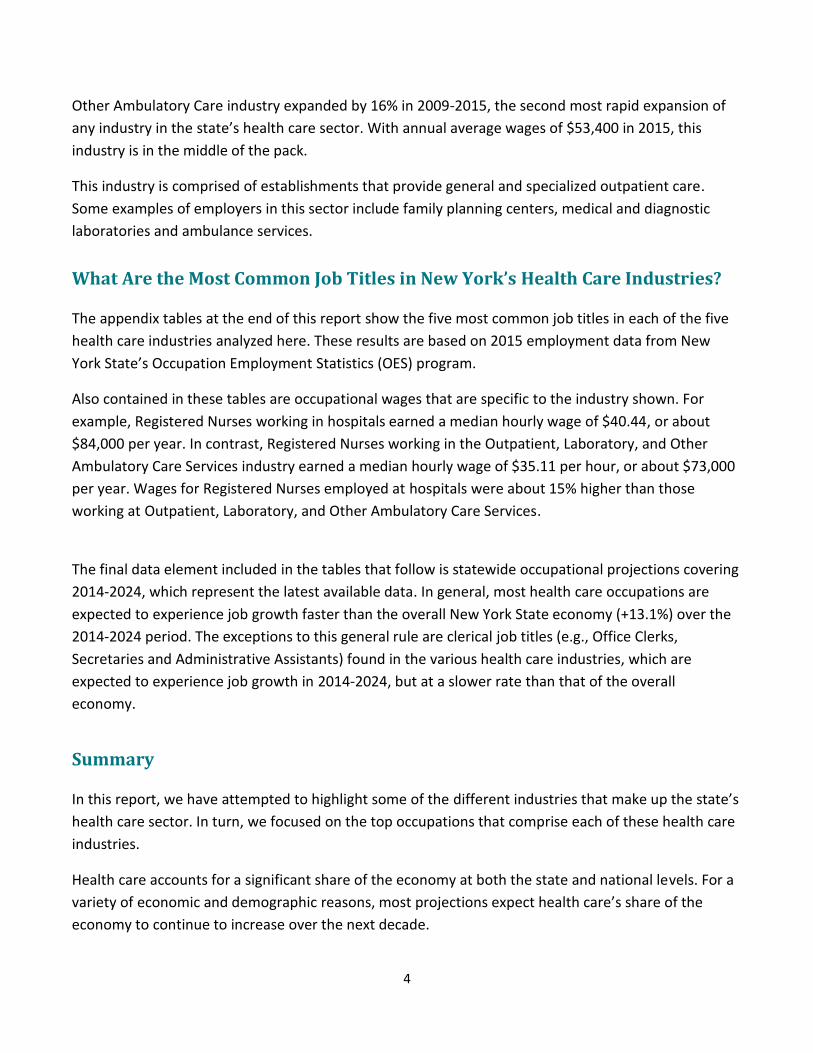
Other Ambulatory Care industry expanded by 16% in 2009-2015, the second most rapid expansion of
any industry in the state’s health care sector. With annual average wages of $53,400 in 2015, this
industry is in the middle of the pack.
This industry is comprised of establishments that provide general and specialized outpatient care.
Some examples of employers in this sector include family planning centers, medical and diagnostic
laboratories and ambulance services.
What Are the Most Common Job Titles in New York’s Health Care Industries?
The appendix tables at the end of this report show the five most common job titles in each of the five
health care industries analyzed here. These results are based on 2015 employment data from New
York State’s Occupation Employment Statistics (OES) program.
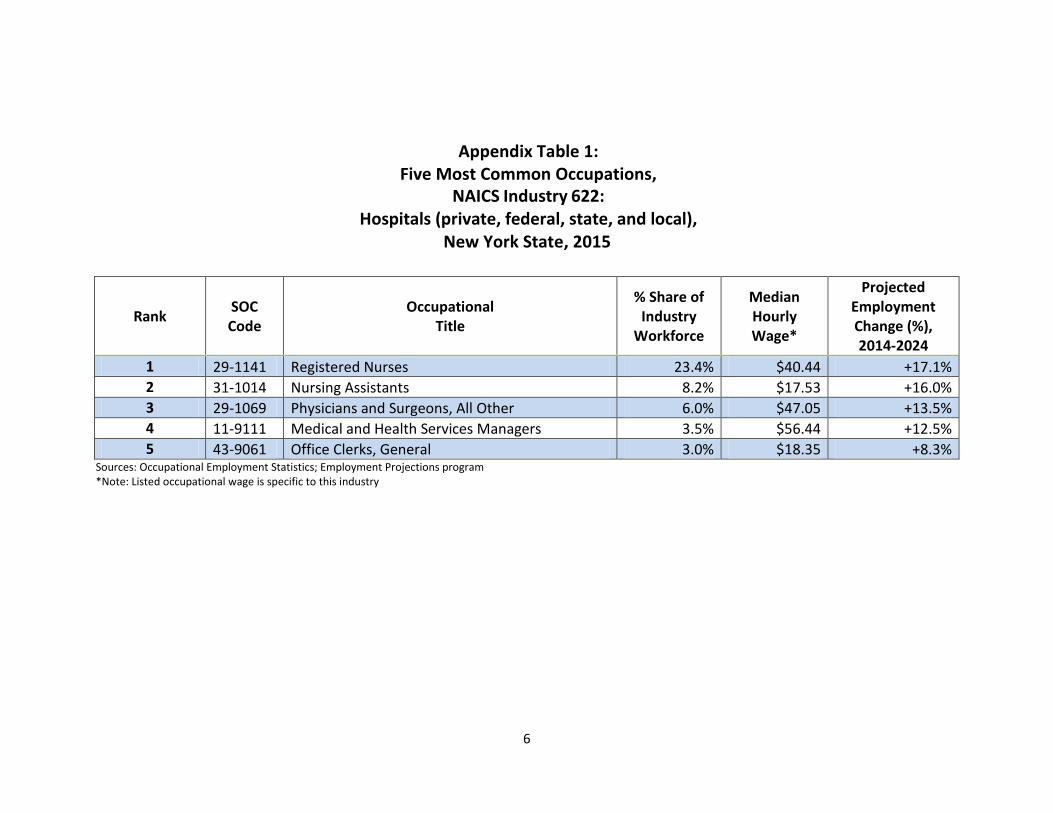
Also contained in these tables are occupational wages that are specific to the industry shown. For
example, Registered Nurses working in hospitals earned a median hourly wage of $40.44, or about
$84,000 per year. In contrast, Registered Nurses working in the Outpatient, Laboratory, and Other
Ambulatory Care Services industry earned a median hourly wage of $35.11 per hour, or about $73,000
per year. Wages for Registered Nurses employed at hospitals were about 15% higher than those
working at Outpatient, Laboratory, and Other Ambulatory Care Services.
The final data element included in the tables that follow is statewide occupational projections covering
2014-2024, which represent the latest available data. In general, most health care occupations are
expected to experience job growth faster than the overall New York State economy (+13.1%) over the
2014-2024 period. The exceptions to this general rule are clerical job titles (e.g., Office Clerks,
Secretaries and Administrative Assistants) found in the various health care industries, which are
expected to experience job growth in 2014-2024, but at a slower rate than that of the overall
economy.
Summary
In this report, we have attempted to highlight some of the different industries that make up the state’s
health care sector. In turn, we focused on the top occupations that comprise each of these health care
industries.
Health care accounts for a significant share of the economy at both the state and national levels. For a
variety of economic and demographic reasons, most projections expect health care’s share of the
economy to continue to increase over the next decade.

5
For Further Information
Questions regarding this report should be directed to Kevin Jack, Statewide Labor Market Analyst. He
can be reached via email at [email protected] or by phone at (518) 457-3800.
6
Appendix Table 1: Five Most Common Occupations,
NAICS Industry 622: Hospitals (private, federal, state, and local),
New York State, 2015
Rank SOC Code
Occupational Title
% Share of Industry
Workforce
Median Hourly Wage*
Projected Employment Change (%), 2014-2024
1 29-1141 Registered Nurses 23.4% $40.44 +17.1%
2 31-1014 Nursing Assistants 8.2% $17.53 +16.0%
3 29-1069 Physicians and Surgeons, All Other 6.0% $47.05 +13.5%
4 11-9111 Medical and Health Services Managers 3.5% $56.44 +12.5%
5 43-9061 Office Clerks, General 3.0% $18.35 +8.3% Sources: Occupational Employment Statistics; Employment Projections program *Note: Listed occupational wage is specific to this industry
7
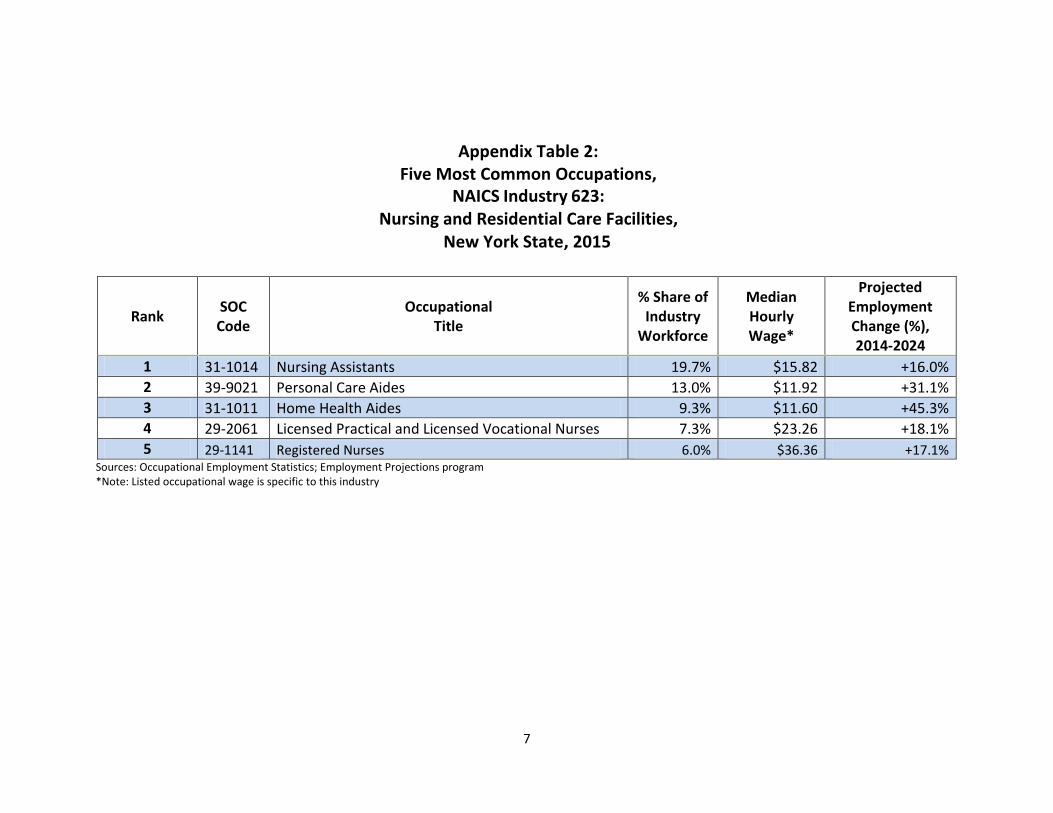
Appendix Table 2: Five Most Common Occupations,
NAICS Industry 623: Nursing and Residential Care Facilities,
New York State, 2015
Rank SOC Code
Occupational Title
% Share of Industry
Workforce
Median Hourly Wage*
Projected Employment Change (%), 2014-2024
1 31-1014 Nursing Assistants 19.7% $15.82 +16.0%
2 39-9021 Personal Care Aides 13.0% $11.92 +31.1%
3 31-1011 Home Health Aides 9.3% $11.60 +45.3%
4 29-2061 Licensed Practical and Licensed Vocational Nurses 7.3% $23.26 +18.1%
5 29-1141 Registered Nurses 6.0% $36.36 +17.1% Sources: Occupational Employment Statistics; Employment Projections program *Note: Listed occupational wage is specific to this industry
8
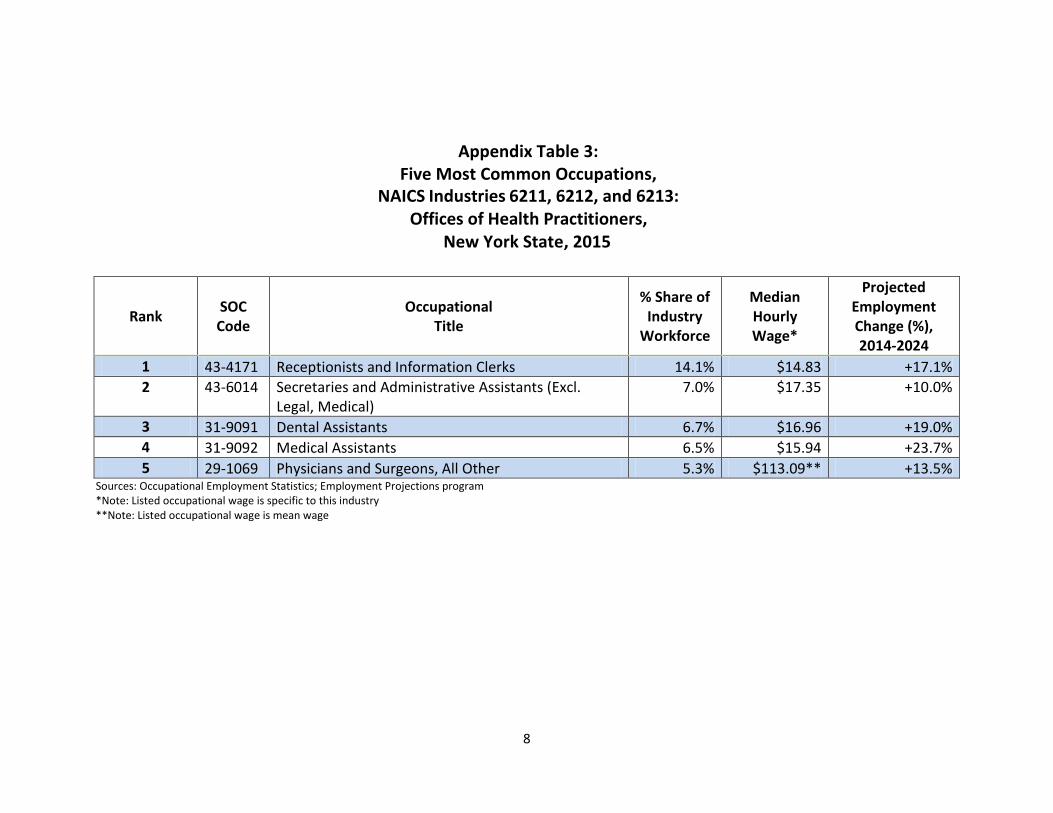
Appendix Table 3: Five Most Common Occupations,
NAICS Industries 6211, 6212, and 6213: Offices of Health Practitioners,
New York State, 2015
Rank SOC Code
Occupational Title
% Share of Industry
Workforce
Median Hourly Wage*
Projected Employment Change (%), 2014-2024
1 43-4171 Receptionists and Information Clerks 14.1% $14.83 +17.1%
2 43-6014 Secretaries and Administrative Assistants (Excl. Legal, Medical)
7.0% $17.35 +10.0%
3 31-9091 Dental Assistants 6.7% $16.96 +19.0%
4 31-9092 Medical Assistants 6.5% $15.94 +23.7%
5 29-1069 Physicians and Surgeons, All Other 5.3% $113.09** +13.5% Sources: Occupational Employment Statistics; Employment Projections program *Note: Listed occupational wage is specific to this industry **Note: Listed occupational wage is mean wage
9
Appendix Table 4: Five Most Common Occupations,
NAICS Industry 6216: Home Health Care Services,
New York State, 2015
Rank SOC Code
Occupational Title
% Share of Industry
Workforce
Median Hourly Wage*
Projected Employment Change (%), 2014-2024
1 31-1011 Home Health Aides 59.2% $10.90 +45.3%
2 39-9021 Personal Care Aides 16.9% $11.14 +31.1%
3 29-1141 Registered Nurses 8.1% $40.00 +17.1%
4 29-2061 Licensed Practical and Licensed Vocational Nurses 2.8% $22.61 +18.1%
5 29-1123 Physical Therapists 1.2% $45.22 +29.3% Sources: Occupational Employment Statistics; Employment Projections program *Note: Listed occupational wage is specific to this industry
10
Appendix Table 5: Five Most Common Occupations,
NAICS Industries 6214, 6215, and 6219: Outpatient, Laboratory, and Other Ambulatory Care Services,
New York State, 2015
Rank SOC Code
Occupational Title
% Share of Industry
Workforce
Median Hourly Wage*
Projected Employment Change (%), 2014-2024
1 29-2041 Emergency Medical Technicians and Paramedics 11.3% $14.81 +29.1%
2 29-1141 Registered Nurses 9.6% $35.11 +17.1%
3 31-9097 Phlebotomists 4.2% $18.43 +24.8%
4 43-4171 Receptionists and Information Clerks 3.8% $16.88 +17.1%
5 21-1023 Mental Health and Substance Abuse Social Workers 3.3% $23.40 +22.5% Sources: Occupational Employment Statistics; Employment Projections program *Note: Listed occupational wage is specific to this industry
This workforce product was funded by a grant awarded by the U.S. Department of Labor's Employment and
Training Administration. The product was created by the recipient and does not necessarily reflect the official
position of the U.S. Department of Labor. The Department of Labor makes no guarantees, warranties, or
assurances of any kind, express or implied, with respect to such information, including any information on
linked sites and including, but not limited to, accuracy of the information or its completeness, timeliness,
usefulness, adequacy, continued availability, or ownership. This product is copyrighted by the institution that
created it. Internal use by an organization and/or personal use by an individual for non-commercial purposes
is permissible. All other uses require the prior authorization of the copyright owner.
A Division of the Department of Labor
The New York State Department of Labor is an Equal Opportunity Employer/Program. Auxiliary aids and services are available upon request to individuals with disabilities.