Embed Size (px)
Citation preview
HAYS ADVISORY: TOPICAL REPORT – AUGUST 5, 2010
The Hays Advisory Market Trend Analyzer (MTA) is a technical tool that analyzes the action of
proprietary short, medium and long-term moving averages. The MTA is designed to buffer
unforeseen, serious secular market declines not being forecasted and implemented already by the
Asset Allocation Matrix. It is not a stop loss trigger and it is not designed to catch every bear
market. It is designed to detect if markets are deteriorating beyond the normal bull/bear cycle,
into a more serious decline like we experienced in 2000 and 2008.
The Hays Advisory Market Trend Analyzer
The Hays Advisory Market Trend Analyzer incorporates two distinct sets of disciplines described as
the Investment Phase and the Trading Phase.
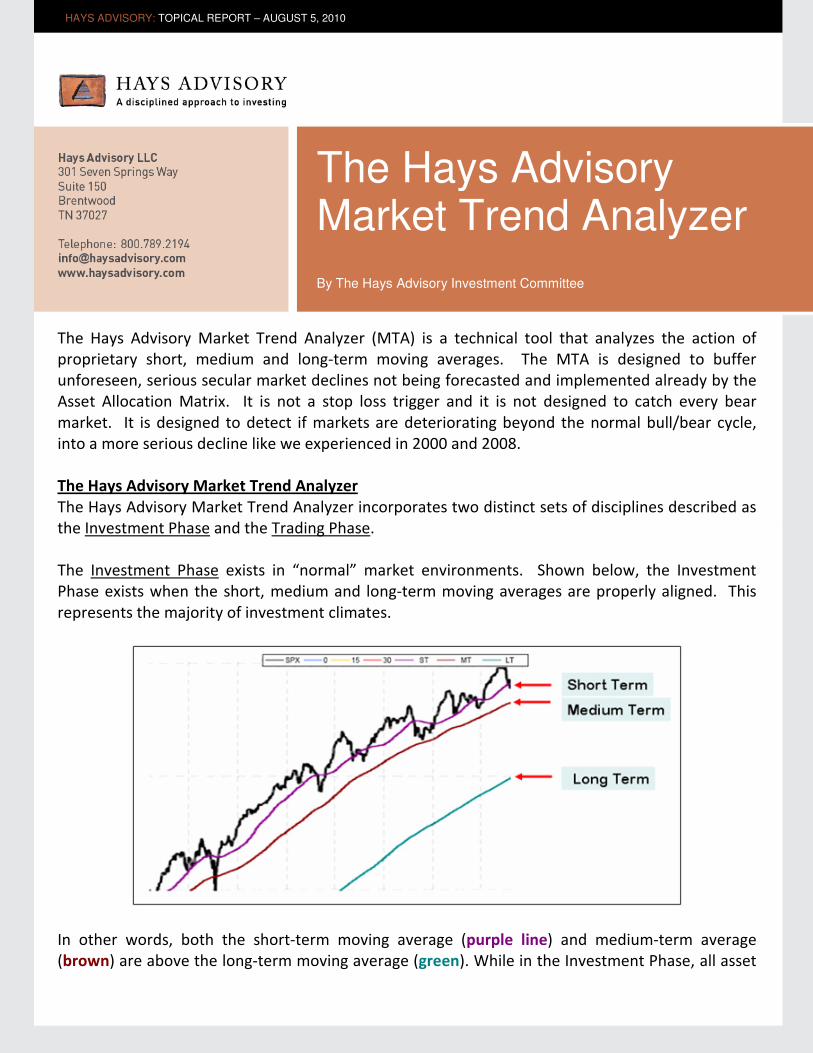
The Investment Phase exists in “normal” market environments. Shown below, the Investment
Phase exists when the short, medium and long-term moving averages are properly aligned. This
represents the majority of investment climates.
In other words, both the short-term moving average (purple line) and medium-term average
(brown) are above the long-term moving average (green). While in the Investment Phase, all asset
The Hays Advisory Market Trend Analyzer
By The Hays Advisory Investment Committee
HAYS ADVISORY: TOPICAL REPORT – AUGUST 5, 2010
HAYS ADVISORY: TOPICAL REPORT – AUGUST 5, 2010
allocation decisions are determined by the Hays Asset Allocation Model and our portfolio
management process proceeds as usual.
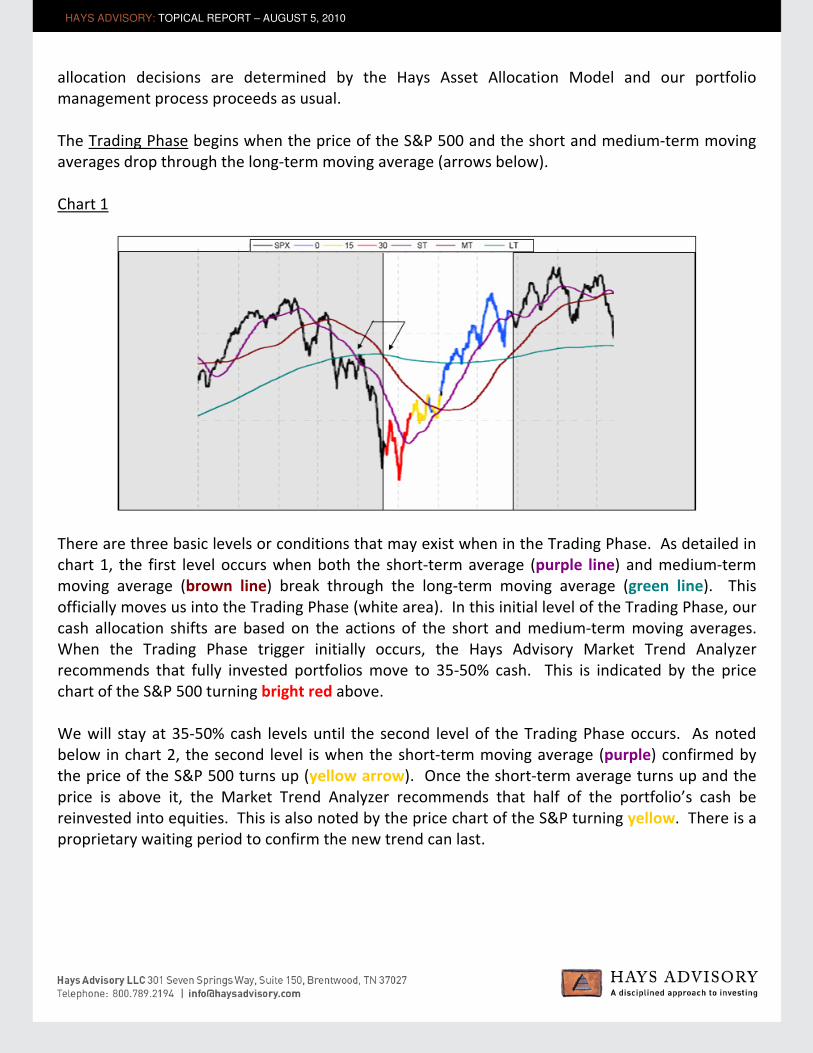
The Trading Phase begins when the price of the S&P 500 and the short and medium-term moving
averages drop through the long-term moving average (arrows below).
Chart 1
There are three basic levels or conditions that may exist when in the Trading Phase. As detailed in
chart 1, the first level occurs when both the short-term average (purple line) and medium-term
moving average (brown line) break through the long-term moving average (green line). This
officially moves us into the Trading Phase (white area). In this initial level of the Trading Phase, our
cash allocation shifts are based on the actions of the short and medium-term moving averages.
When the Trading Phase trigger initially occurs, the Hays Advisory Market Trend Analyzer
recommends that fully invested portfolios move to 35-50% cash. This is indicated by the price
chart of the S&P 500 turning bright red above.
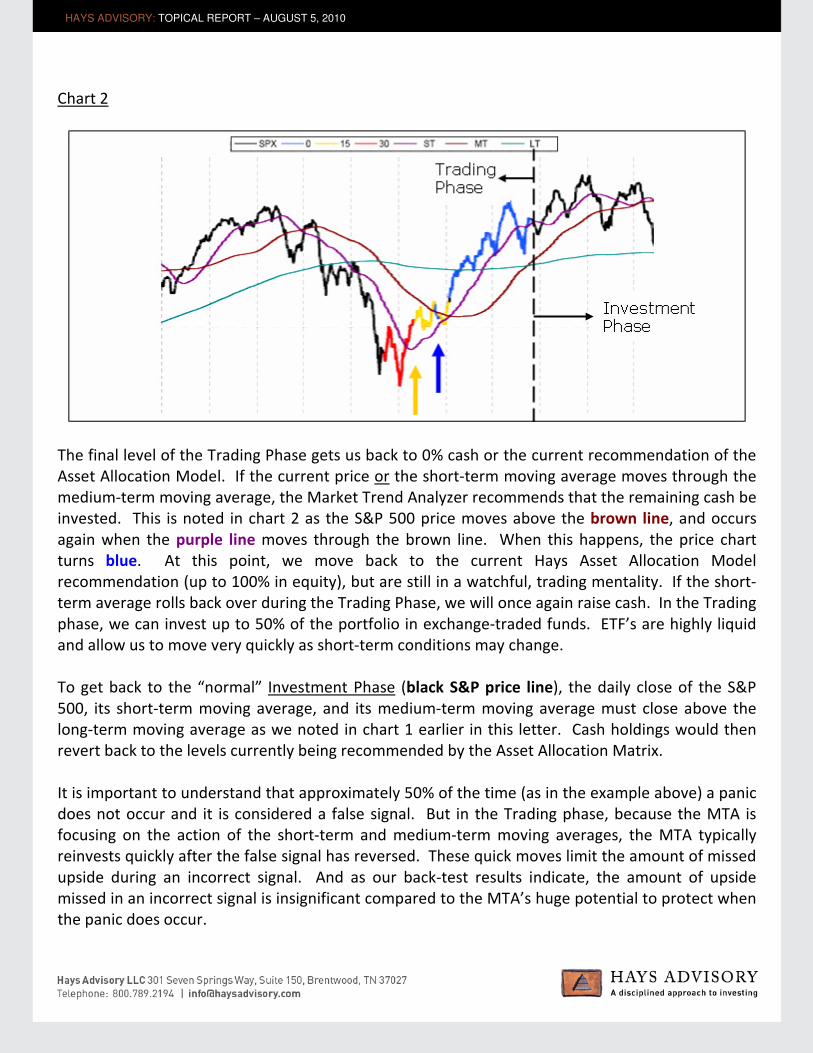
We will stay at 35-50% cash levels until the second level of the Trading Phase occurs. As noted
below in chart 2, the second level is when the short-term moving average (purple) confirmed by
the price of the S&P 500 turns up (yellow arrow). Once the short-term average turns up and the
price is above it, the Market Trend Analyzer recommends that half of the portfolio’s cash be
reinvested into equities. This is also noted by the price chart of the S&P turning yellow. There is a
proprietary waiting period to confirm the new trend can last.
HAYS ADVISORY: TOPICAL REPORT – AUGUST 5, 2010
Chart 2
The final level of the Trading Phase gets us back to 0% cash or the current recommendation of the
Asset Allocation Model. If the current price or the short-term moving average moves through the
medium-term moving average, the Market Trend Analyzer recommends that the remaining cash be
invested. This is noted in chart 2 as the S&P 500 price moves above the brown line, and occurs
again when the purple line moves through the brown line. When this happens, the price chart
turns blue. At this point, we move back to the current Hays Asset Allocation Model
recommendation (up to 100% in equity), but are still in a watchful, trading mentality. If the short-
term average rolls back over during the Trading Phase, we will once again raise cash. In the Trading
phase, we can invest up to 50% of the portfolio in exchange-traded funds. ETF’s are highly liquid
and allow us to move very quickly as short-term conditions may change.
To get back to the “normal” Investment Phase (black S&P price line), the daily close of the S&P
500, its short-term moving average, and its medium-term moving average must close above the
long-term moving average as we noted in chart 1 earlier in this letter. Cash holdings would then
revert back to the levels currently being recommended by the Asset Allocation Matrix.
It is important to understand that approximately 50% of the time (as in the example above) a panic
does not occur and it is considered a false signal. But in the Trading phase, because the MTA is
focusing on the action of the short-term and medium-term moving averages, the MTA typically
reinvests quickly after the false signal has reversed. These quick moves limit the amount of missed
upside during an incorrect signal. And as our back-test results indicate, the amount of upside
missed in an incorrect signal is insignificant compared to the MTA’s huge potential to protect when
the panic does occur.
HAYS ADVISORY: TOPICAL REPORT – AUGUST 5, 2010
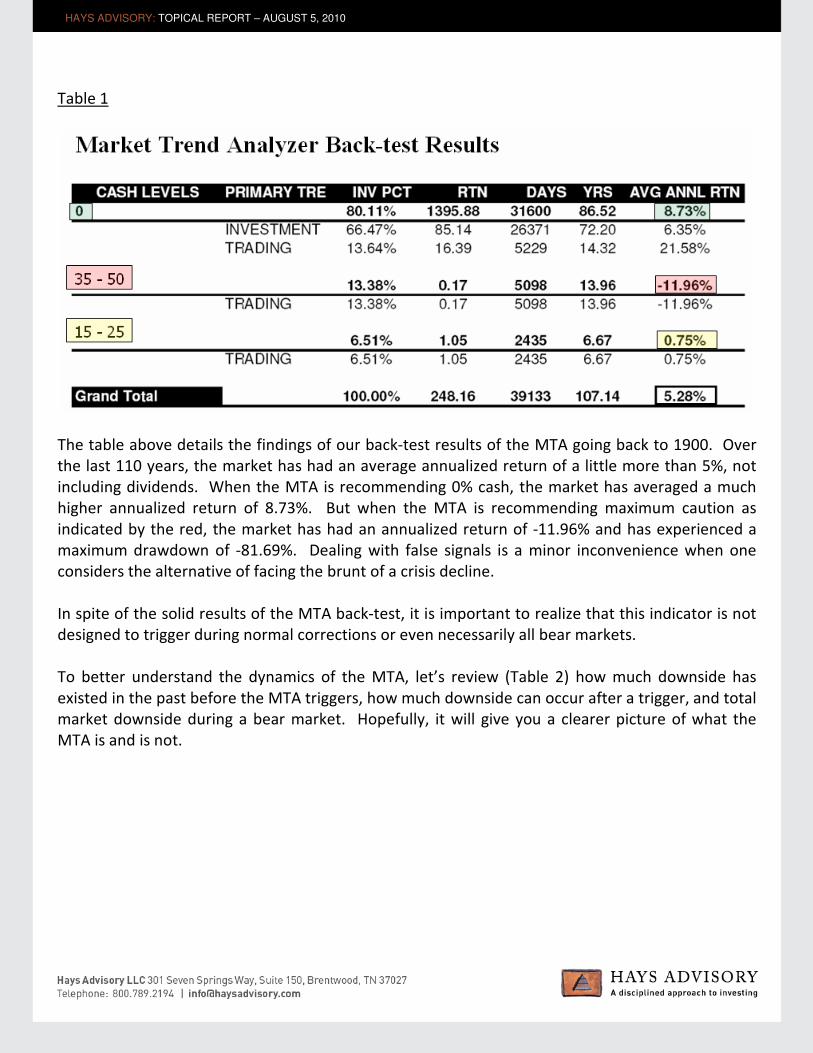
Table 1
The table above details the findings of our back-test results of the MTA going back to 1900. Over
the last 110 years, the market has had an average annualized return of a little more than 5%, not
including dividends. When the MTA is recommending 0% cash, the market has averaged a much
higher annualized return of 8.73%. But when the MTA is recommending maximum caution as
indicated by the red, the market has had an annualized return of -11.96% and has experienced a
maximum drawdown of -81.69%. Dealing with false signals is a minor inconvenience when one
considers the alternative of facing the brunt of a crisis decline.
In spite of the solid results of the MTA back-test, it is important to realize that this indicator is not
designed to trigger during normal corrections or even necessarily all bear markets.
To better understand the dynamics of the MTA, let’s review (Table 2) how much downside has
existed in the past before the MTA triggers, how much downside can occur after a trigger, and total
market downside during a bear market. Hopefully, it will give you a clearer picture of what the
MTA is and is not.
HAYS ADVISORY: TOPICAL REPORT – AUGUST 5, 2010
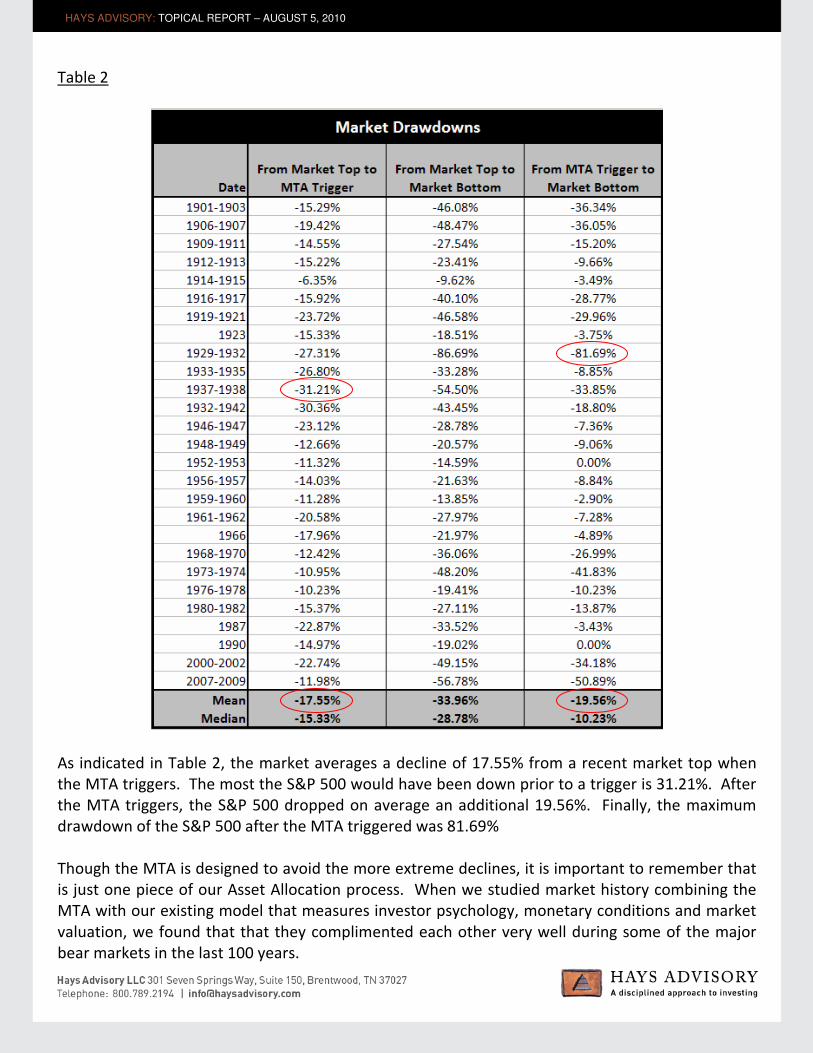
Table 2
As indicated in Table 2, the market averages a decline of 17.55% from a recent market top when
the MTA triggers. The most the S&P 500 would have been down prior to a trigger is 31.21%. After
the MTA triggers, the S&P 500 dropped on average an additional 19.56%. Finally, the maximum
drawdown of the S&P 500 after the MTA triggered was 81.69%
Though the MTA is designed to avoid the more extreme declines, it is important to remember that
is just one piece of our Asset Allocation process. When we studied market history combining the
MTA with our existing model that measures investor psychology, monetary conditions and market
valuation, we found that that they complimented each other very well during some of the major
bear markets in the last 100 years.
HAYS ADVISORY: TOPICAL REPORT – AUGUST 5, 2010
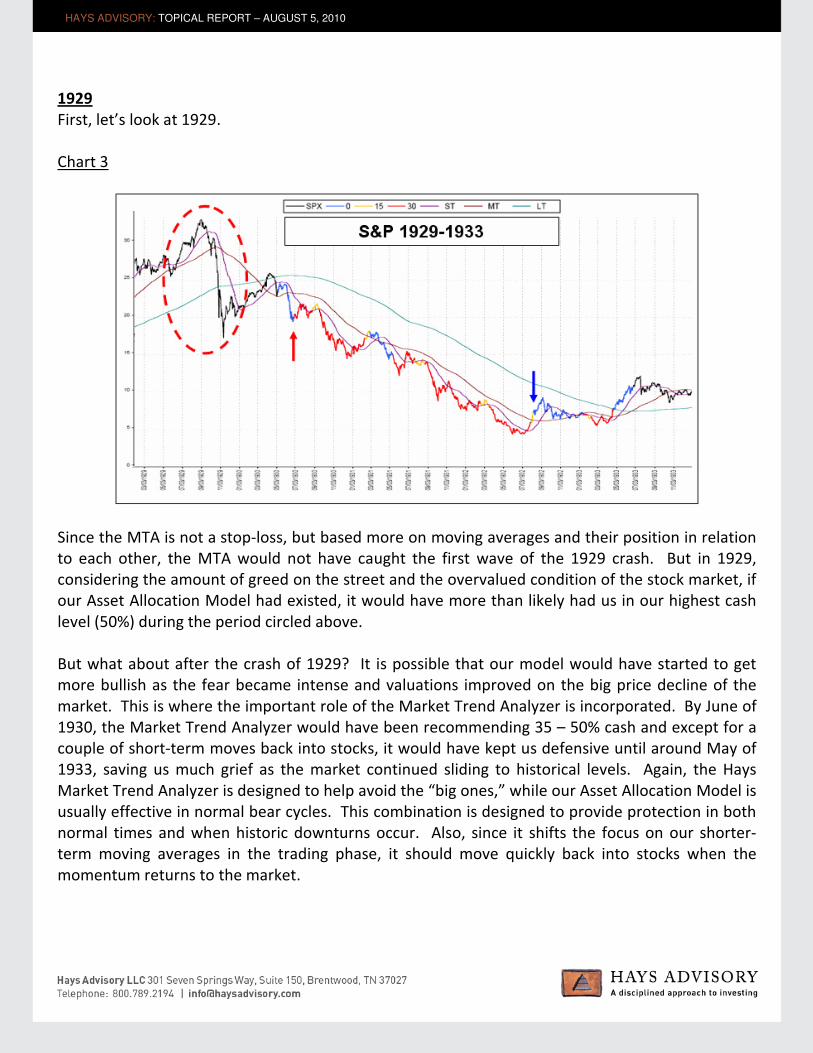
1929
First, let’s look at 1929.
Chart 3
Since the MTA is not a stop-loss, but based more on moving averages and their position in relation
to each other, the MTA would not have caught the first wave of the 1929 crash. But in 1929,
considering the amount of greed on the street and the overvalued condition of the stock market, if
our Asset Allocation Model had existed, it would have more than likely had us in our highest cash
level (50%) during the period circled above.
But what about after the crash of 1929? It is possible that our model would have started to get
more bullish as the fear became intense and valuations improved on the big price decline of the
market. This is where the important role of the Market Trend Analyzer is incorporated. By June of
1930, the Market Trend Analyzer would have been recommending 35 – 50% cash and except for a
couple of short-term moves back into stocks, it would have kept us defensive until around May of
1933, saving us much grief as the market continued sliding to historical levels. Again, the Hays
Market Trend Analyzer is designed to help avoid the “big ones,” while our Asset Allocation Model is
usually effective in normal bear cycles. This combination is designed to provide protection in both
normal times and when historic downturns occur. Also, since it shifts the focus on our shorter-
term moving averages in the trading phase, it should move quickly back into stocks when the
momentum returns to the market.
HAYS ADVISORY: TOPICAL REPORT – AUGUST 5, 2010
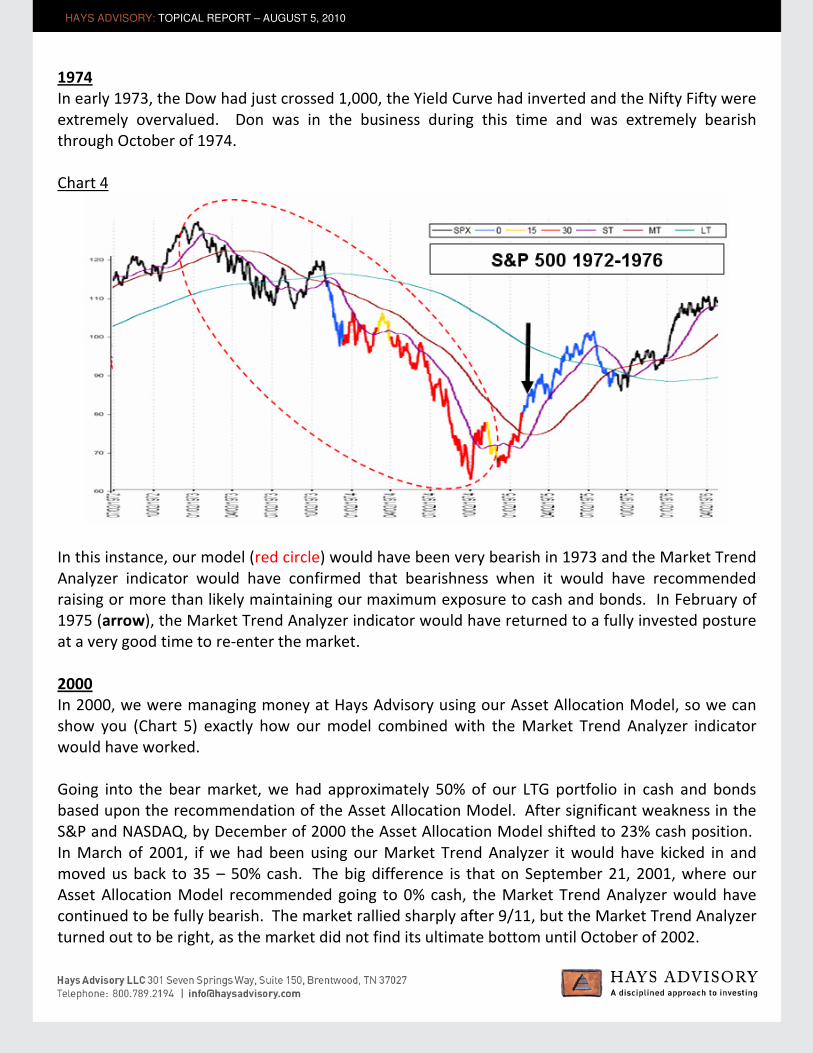
1974
In early 1973, the Dow had just crossed 1,000, the Yield Curve had inverted and the Nifty Fifty were
extremely overvalued. Don was in the business during this time and was extremely bearish
through October of 1974.
Chart 4
In this instance, our model (red circle) would have been very bearish in 1973 and the Market Trend
Analyzer indicator would have confirmed that bearishness when it would have recommended
raising or more than likely maintaining our maximum exposure to cash and bonds. In February of
1975 (arrow), the Market Trend Analyzer indicator would have returned to a fully invested posture
at a very good time to re-enter the market.
2000
In 2000, we were managing money at Hays Advisory using our Asset Allocation Model, so we can
show you (Chart 5) exactly how our model combined with the Market Trend Analyzer indicator
would have worked.
Going into the bear market, we had approximately 50% of our LTG portfolio in cash and bonds
based upon the recommendation of the Asset Allocation Model. After significant weakness in the
S&P and NASDAQ, by December of 2000 the Asset Allocation Model shifted to 23% cash position.
In March of 2001, if we had been using our Market Trend Analyzer it would have kicked in and
moved us back to 35 – 50% cash. The big difference is that on September 21, 2001, where our
Asset Allocation Model recommended going to 0% cash, the Market Trend Analyzer would have
continued to be fully bearish. The market rallied sharply after 9/11, but the Market Trend Analyzer
turned out to be right, as the market did not find its ultimate bottom until October of 2002.
HAYS ADVISORY: TOPICAL REPORT – AUGUST 5, 2010
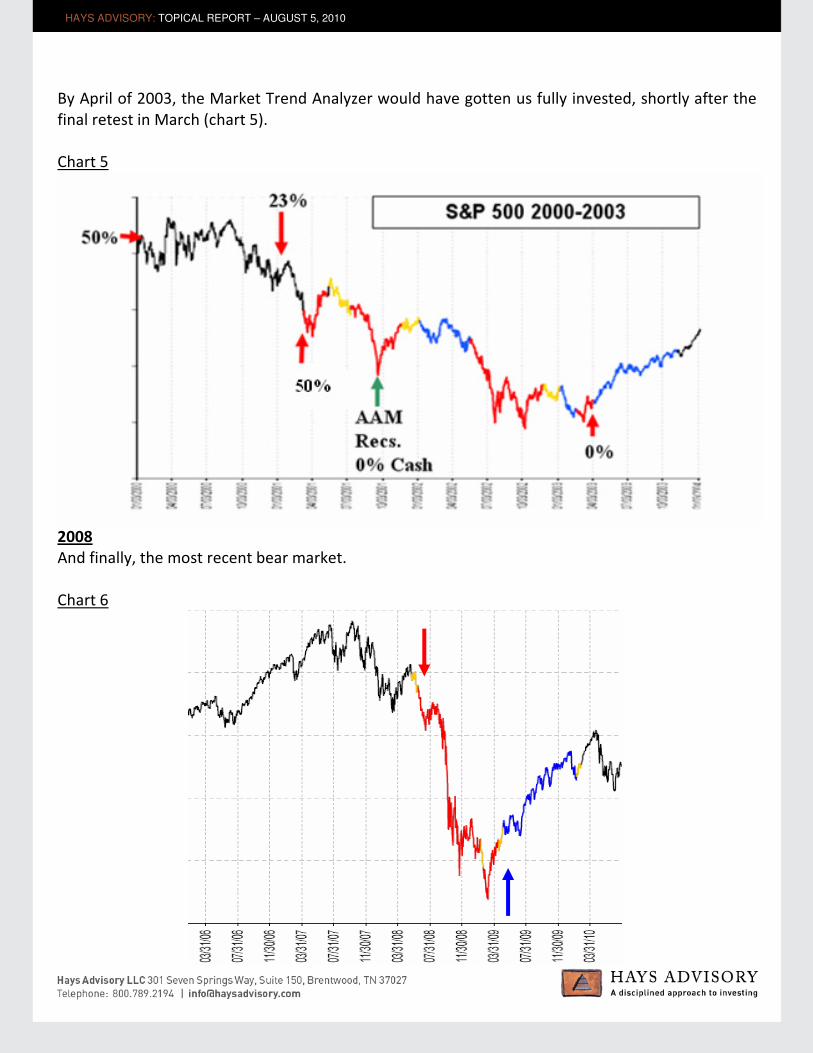
By April of 2003, the Market Trend Analyzer would have gotten us fully invested, shortly after the
final retest in March (chart 5).
Chart 5
2008
And finally, the most recent bear market.
Chart 6
HAYS ADVISORY: TOPICAL REPORT – AUGUST 5, 2010
For the first time in recent history, a massive bear market occurred in the absence of excessive
greed by investors, tight monetary policy or over-valuation. So unfortunately, we would have been
fully invested in the initial phase of this most recent decline. But in June of 2008, the Market Trend
Analyzer would have taken us to 35 – 50% cash, getting defensive prior to the largest part of this
decline and then getting back fully invested by May 5, 2009.
Summary
The Market Trend Analyzer is a great compliment to our current Asset Allocation Model. It is not
perfect and will cause some false signals, but we believe history has shown that it will add
significantly to our results over the long-term. The Market Trend Analyzer strives to protect in
those dramatic downturns that can really hurt a portfolio, and move assets back in quickly when
momentum returns to the market.
Let us summarize some of the major points highlighted in this report regarding the Market Trend
Analyzer:
• The MTA is a technical tool, not a stop loss trigger, designed to detect panic declines.
• The MTA would have triggered 27 times since 1900 – approx. once every four years.
• On average the market is down 17.55% from a recent market top when the MTA triggers.
• The most the S&P 500 would have been down when the MTA triggers is 31.21%. (‘37/’38)
• After the MTA triggers, the S&P 500 dropped an additional 19.56% on average.
• The maximum drawdown of the S&P 500 after the MTA triggers was 81.69%.
And finally, let us review how it triggers:
• When the MTA triggers the trading phase by the short and medium term moving averages
breaking the long-term average, our equity portfolios will raise between 35% - 50% cash.
• When the short-term moving average turns up while in the trading phase, ½ of this cash will
be invested in Exchange Traded Funds (ETFs).
• If the current price or the short-term moving average moves through the medium-term
moving average, the MTA recommends that the remaining cash be invested.
• Once fully invested while in the Trading phase, if the short-term moving average turns back
down, our equity portfolios will raise 15 – 25% cash.
• In the trading phase, if the short-term moving average moves through medium term moving
average, our cash levels will return to 35 – 50%.
• When the daily close of the S&P 500, its short-term moving average, and its medium-term
moving average close above the long-term moving average, the MTA moves back to the
investment phase and all allocation decisions are made by the AAM.
Over the next several pages we have provided the decade-by-decade results using color coded
charts of our Market Trend back - testing beginning with the 1900’s. I suggest quickly skimming
through these charts to get a better feel for how MTA reacts in different market environments.
HAYS ADVISORY: TOPICAL REPORT – AUGUST 5, 2010
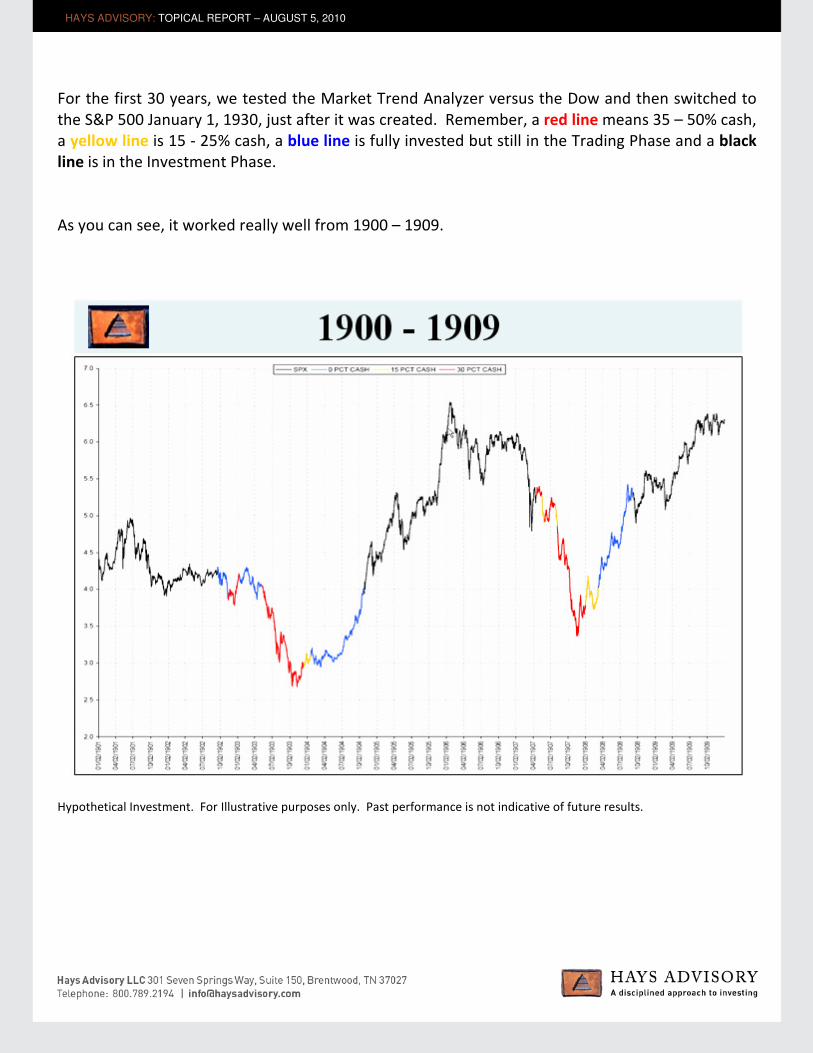
For the first 30 years, we tested the Market Trend Analyzer versus the Dow and then switched to
the S&P 500 January 1, 1930, just after it was created. Remember, a red line means 35 – 50% cash,
a yellow line is 15 - 25% cash, a blue line is fully invested but still in the Trading Phase and a black
line is in the Investment Phase.
As you can see, it worked really well from 1900 – 1909.
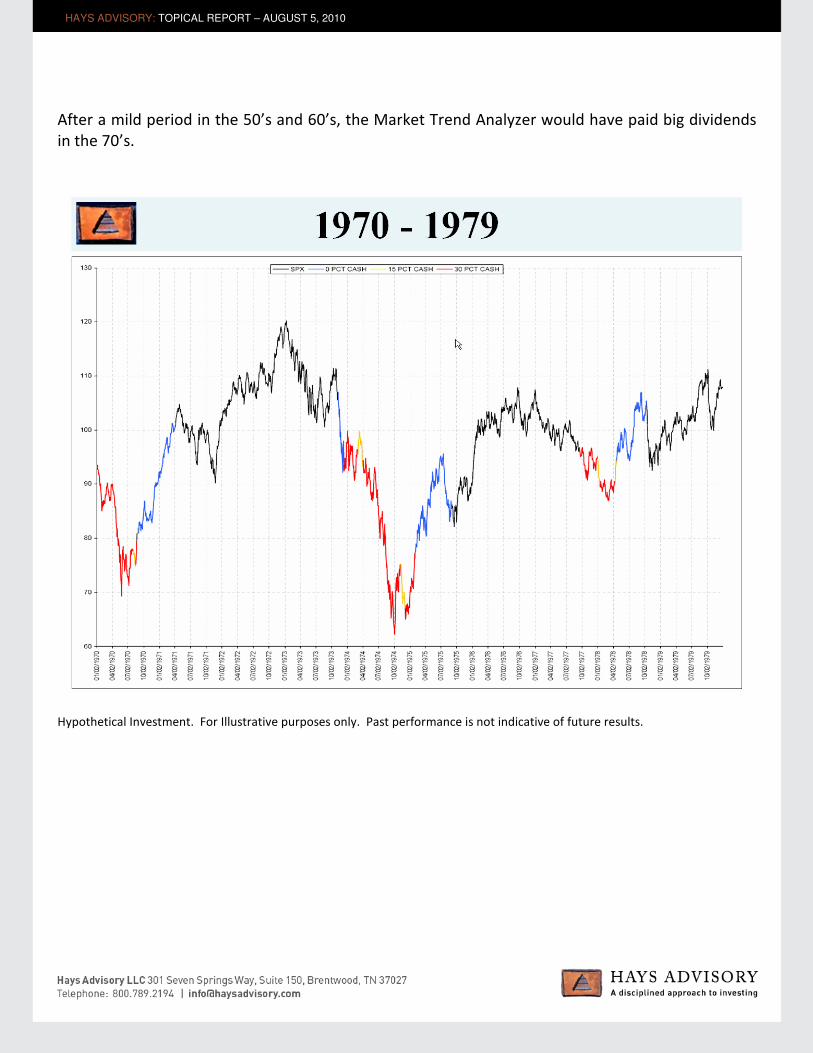
Hypothetical Investment. For Illustrative purposes only. Past performance is not indicative of future results.
HAYS ADVISORY: TOPICAL REPORT – AUGUST 5, 2010
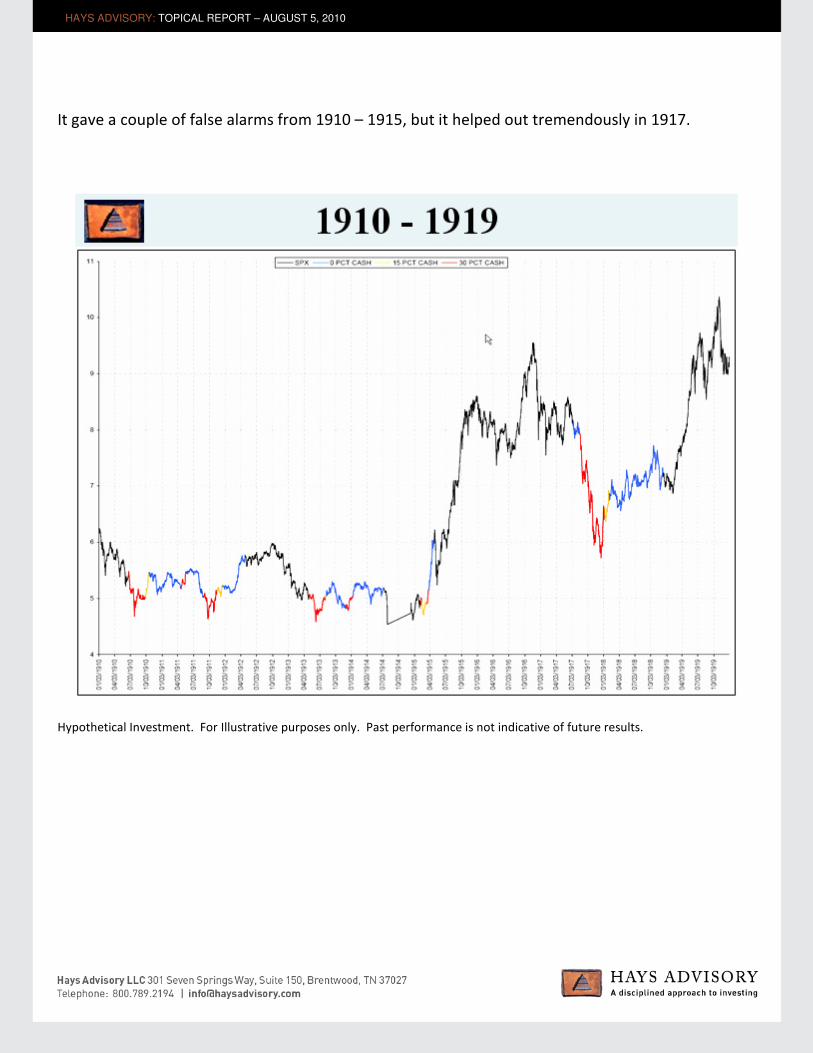
It gave a couple of false alarms from 1910 – 1915, but it helped out tremendously in 1917.
Hypothetical Investment. For Illustrative purposes only. Past performance is not indicative of future results.
HAYS ADVISORY: TOPICAL REPORT – AUGUST 5, 2010
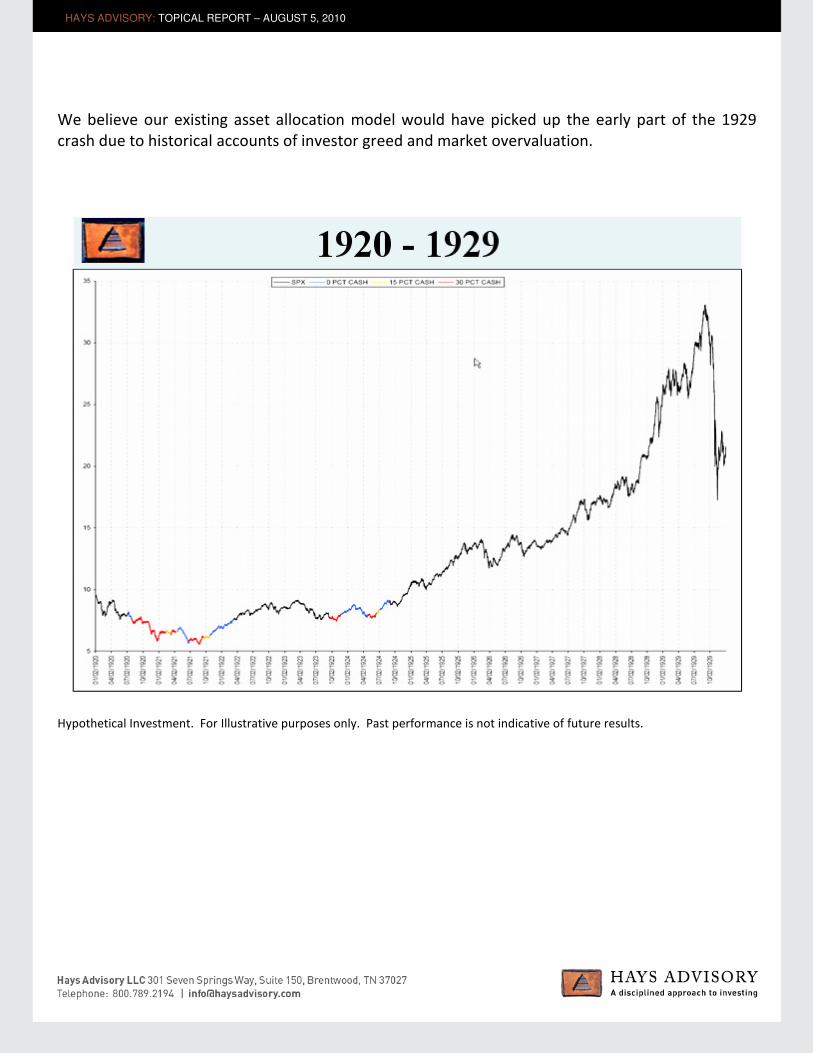
We believe our existing asset allocation model would have picked up the early part of the 1929
crash due to historical accounts of investor greed and market overvaluation.
Hypothetical Investment. For Illustrative purposes only. Past performance is not indicative of future results.
HAYS ADVISORY: TOPICAL REPORT – AUGUST 5, 2010
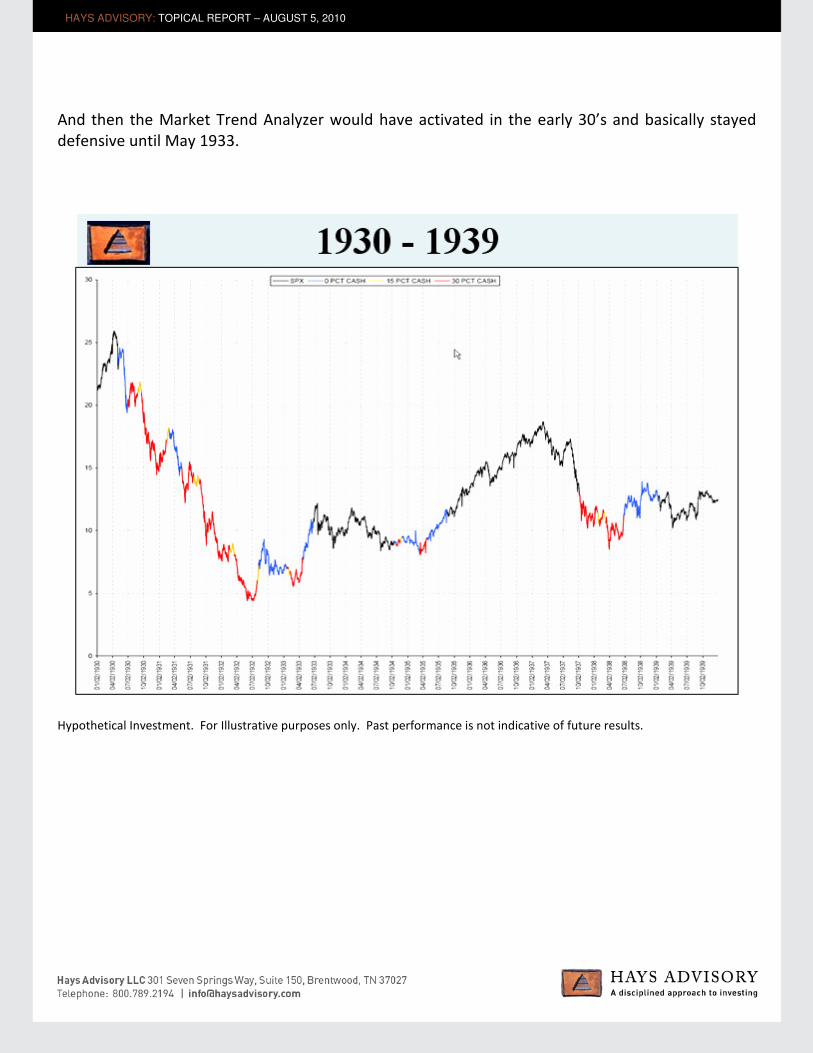
And then the Market Trend Analyzer would have activated in the early 30’s and basically stayed
defensive until May 1933.
Hypothetical Investment. For Illustrative purposes only. Past performance is not indicative of future results.
HAYS ADVISORY: TOPICAL REPORT – AUGUST 5, 2010
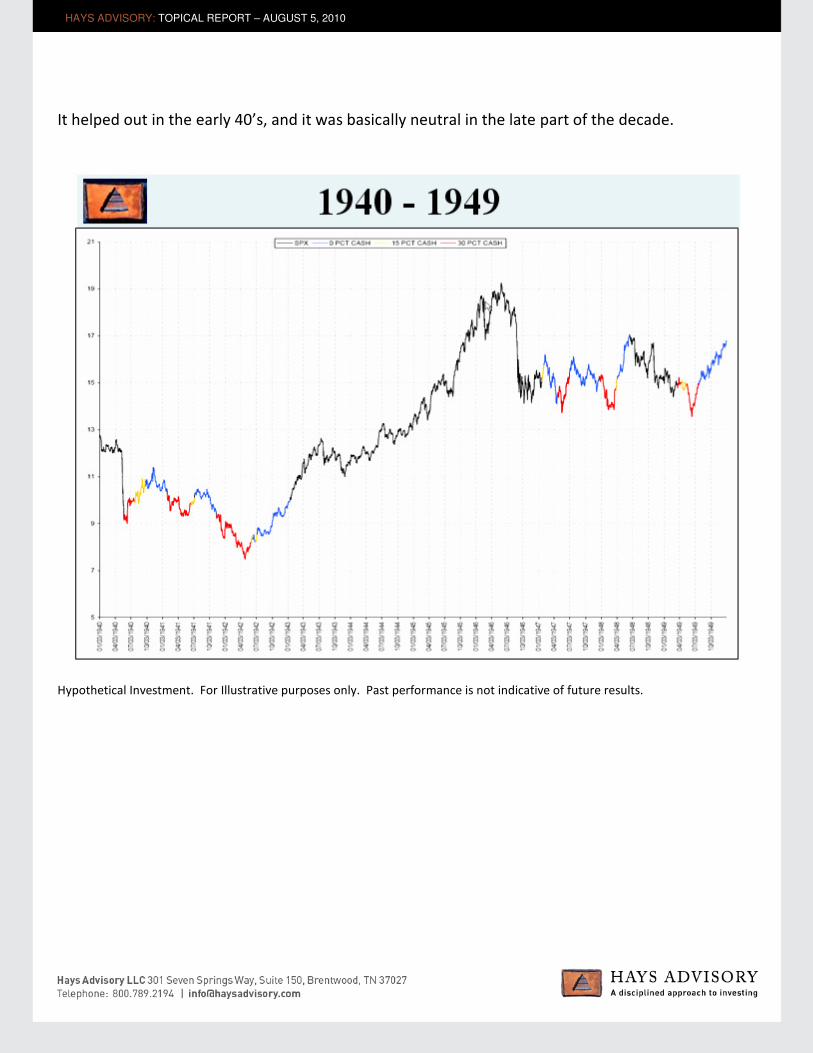
It helped out in the early 40’s, and it was basically neutral in the late part of the decade.
Hypothetical Investment. For Illustrative purposes only. Past performance is not indicative of future results.
HAYS ADVISORY: TOPICAL REPORT – AUGUST 5, 2010
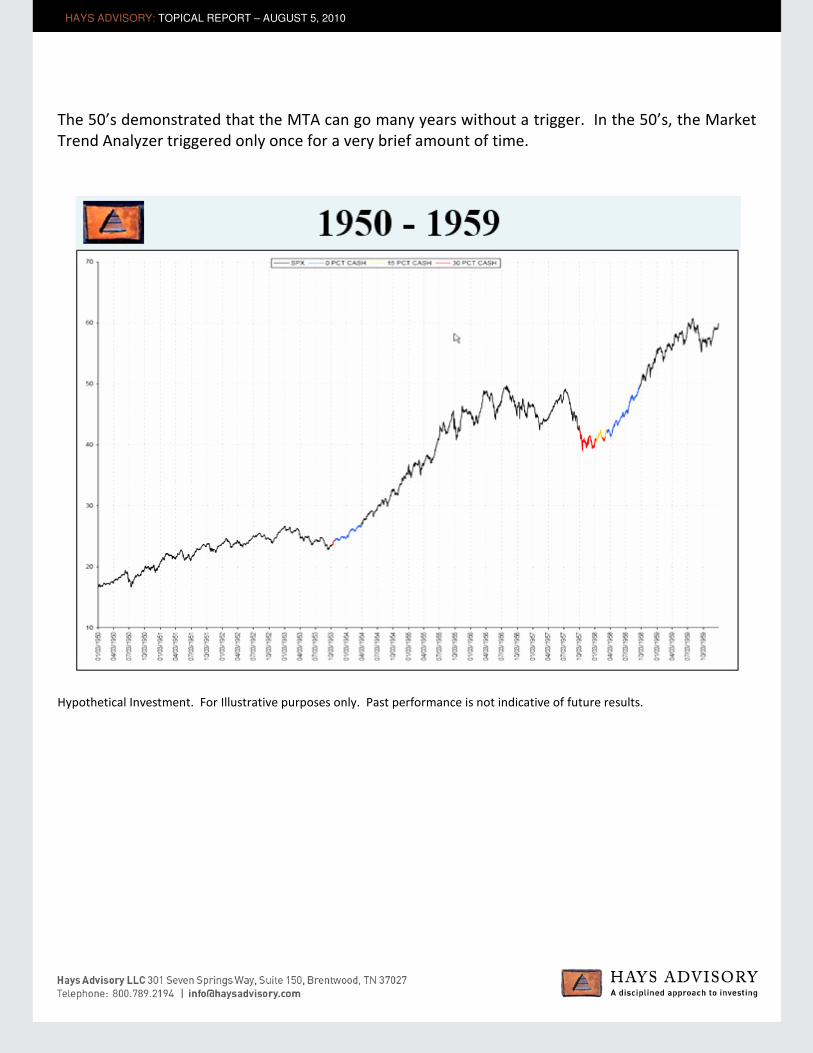
The 50’s demonstrated that the MTA can go many years without a trigger. In the 50’s, the Market
Trend Analyzer triggered only once for a very brief amount of time.
Hypothetical Investment. For Illustrative purposes only. Past performance is not indicative of future results.
HAYS ADVISORY: TOPICAL REPORT – AUGUST 5, 2010
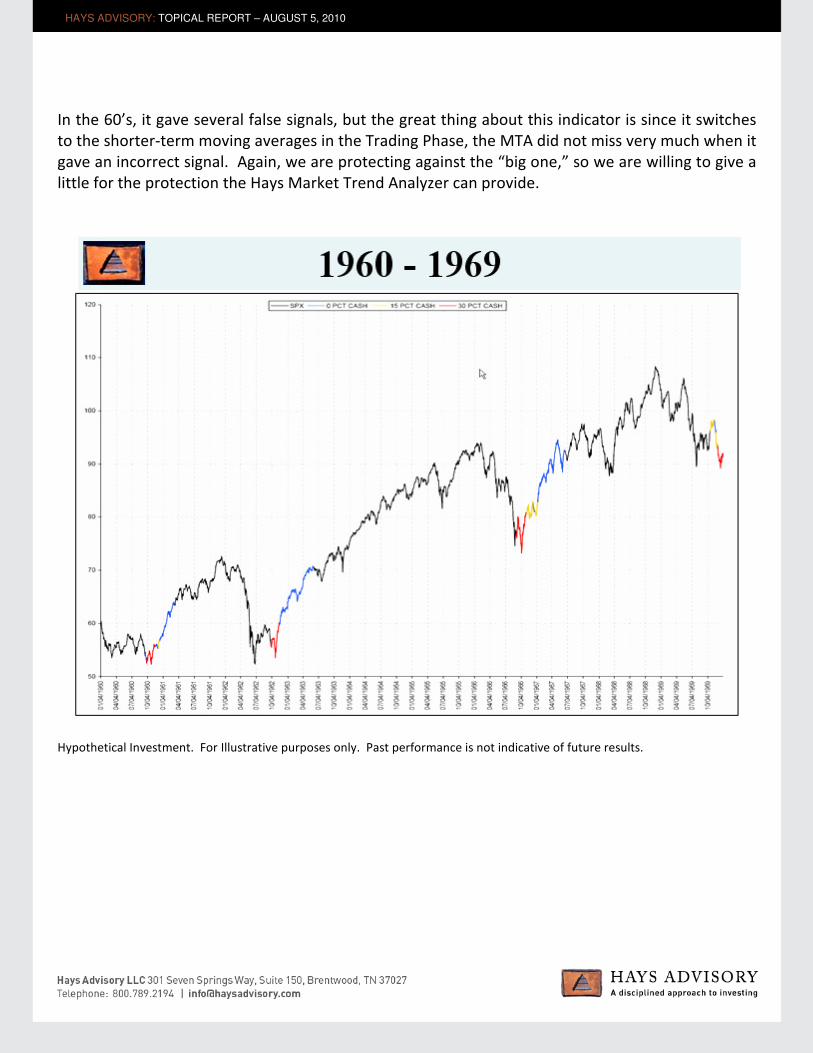
In the 60’s, it gave several false signals, but the great thing about this indicator is since it switches
to the shorter-term moving averages in the Trading Phase, the MTA did not miss very much when it
gave an incorrect signal. Again, we are protecting against the “big one,” so we are willing to give a
little for the protection the Hays Market Trend Analyzer can provide.
Hypothetical Investment. For Illustrative purposes only. Past performance is not indicative of future results.
HAYS ADVISORY: TOPICAL REPORT – AUGUST 5, 2010
After a mild period in the 50’s and 60’s, the Market Trend Analyzer would have paid big dividends
in the 70’s.
Hypothetical Investment. For Illustrative purposes only. Past performance is not indicative of future results.
HAYS ADVISORY: TOPICAL REPORT – AUGUST 5, 2010
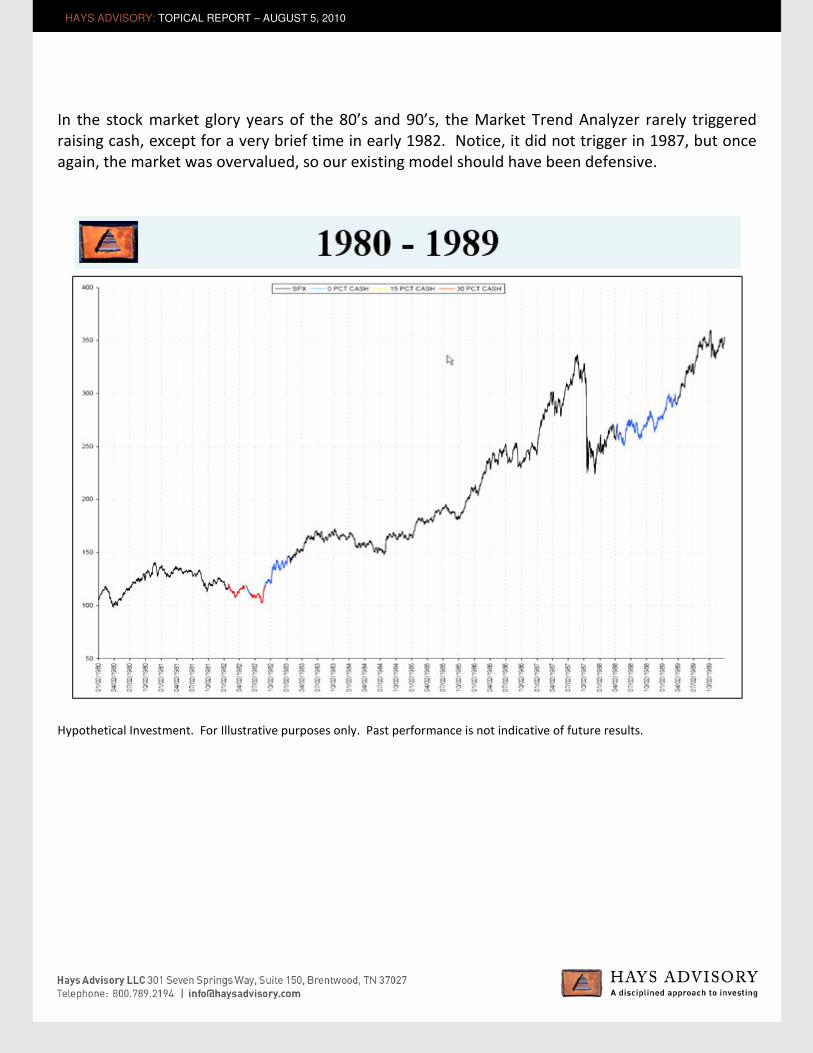
In the stock market glory years of the 80’s and 90’s, the Market Trend Analyzer rarely triggered
raising cash, except for a very brief time in early 1982. Notice, it did not trigger in 1987, but once
again, the market was overvalued, so our existing model should have been defensive.
Hypothetical Investment. For Illustrative purposes only. Past performance is not indicative of future results.
HAYS ADVISORY: TOPICAL REPORT – AUGUST 5, 2010
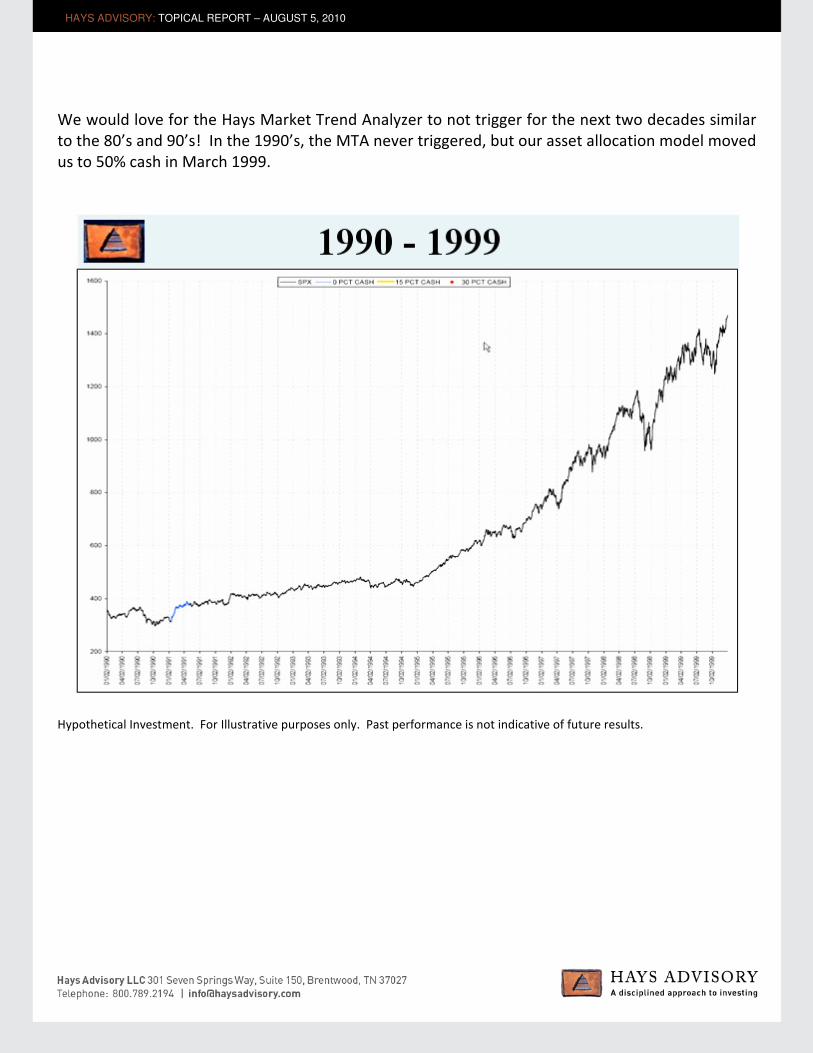
We would love for the Hays Market Trend Analyzer to not trigger for the next two decades similar
to the 80’s and 90’s! In the 1990’s, the MTA never triggered, but our asset allocation model moved
us to 50% cash in March 1999.
Hypothetical Investment. For Illustrative purposes only. Past performance is not indicative of future results.
HAYS ADVISORY: TOPICAL REPORT – AUGUST 5, 2010
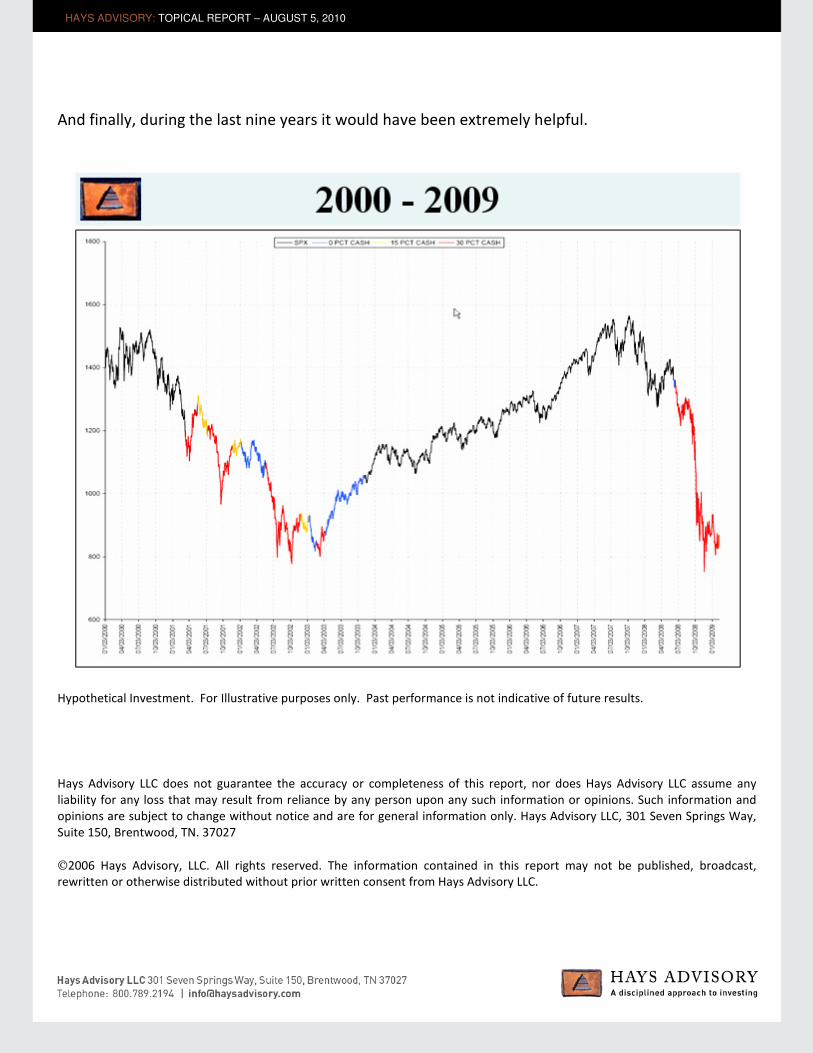
And finally, during the last nine years it would have been extremely helpful.
Hypothetical Investment. For Illustrative purposes only. Past performance is not indicative of future results.
Hays Advisory LLC does not guarantee the accuracy or completeness of this report, nor does Hays Advisory LLC assume any
liability for any loss that may result from reliance by any person upon any such information or opinions. Such information and
opinions are subject to change without notice and are for general information only. Hays Advisory LLC, 301 Seven Springs Way,
Suite 150, Brentwood, TN. 37027
2006 Hays Advisory, LLC. All rights reserved. The information contained in this report may not be published, broadcast,
rewritten or otherwise distributed without prior written consent from Hays Advisory LLC.