Embed Size (px)
Citation preview

Copyright © 2013 by The Hartford. Confidential. All rights reserved. No part of this document may be reproduced, published or posted without the permission of The Hartford.
The Hartford’s Investor Presentation on
Talcott Resolution
April 11, 2013
Hartford, Connecticut

Copyright © 2013 by The Hartford. Confidential. All rights reserved. No part of this document may be reproduced, published or posted without the permission of The Hartford.
Agenda
9:00 – 9:05 Safe Harbor Sabra Purtill
9:05 – 9:15 Welcome and Overview Liam McGee
9:15 – 9:50 Talcott Resolution Beth Bombara
9:50 – 10:10 Risk Management and Hedging Bob Rupp
10:10 – 10:30 Coffee Break
10:30 – 11:15 VA Metrics and Capital Margins Chris Swift
11:15 – 12:15 Q&A session Panel
12:15 – 1:30 Luncheon with Management
2

Copyright © 2013 by The Hartford. Confidential. All rights reserved. No part of this document may be reproduced, published or posted without the permission of The Hartford.
Safe Harbor
Some of the statements in this presentation should be considered forward-looking statements as defined in the Private Securities Litigation Reform Act of 1995. Forward-looking statements can be identified by words such as "anticipates,"
"intends," "plans," "seeks," "believes," "estimates," "expects," "projects" and similar references to the future. Examples of forward-looking statements include, but are not limited to, statements the company makes regarding future results of
operations. The Hartford cautions investors that these forward-looking statements are not guarantees of future performance, and actual results may differ materially. Investors should consider the important risks and uncertainties that may
cause actual results to differ. These important risks and uncertainties include: challenges related to The Hartford's and its subsidiaries' (collectively, the "Company") current operating environment, including continuing uncertainty about the
strength and speed of the recovery in the United States and other key economies and the impact of governmental stimulus and austerity initiatives, sovereign credit concerns, a sustained low interest rate environment, higher tax rates and
other potentially adverse developments on financial, commodity and credit markets and consumer and business spending and investment and the effect of these events on our returns in investment portfolios and our hedging costs associated
with our variable annuities business; the risks, challenges and uncertainties associated with our capital management plan and our strategic realignment to focus on our property and casualty, group benefits and mutual fund businesses, place
our Individual Annuity business into run-off and the sale of the Individual Life, Woodbury Financial Services and the Retirement Plans businesses; execution risk related to the continued reinvestment of our investment portfolios and refinement
of our hedge program for our run-off annuity block; the capital self-sufficiency of the Company’s Talcott Resolution business in stress scenarios; market risks associated with our business, including changes in interest rates, credit spreads,
equity prices, market volatility and foreign exchange rates, and implied volatility levels, as well as continuing uncertainty in key sectors such as the global real estate market; the possibility of unfavorable loss development including with
respect to long-tailed exposures; the possibility of a pandemic, earthquake, or other natural or man-made disaster that may adversely affect our businesses; weather and other natural physical events, including the severity and frequency of
storms, hail, winter storms, hurricanes and tropical storms, as well as climate change and its potential impact on weather patterns; risk associated with the use of analytical models in making decisions in key areas such as underwriting,
capital, reserving, and catastrophe risk management; the uncertain effects of emerging claim and coverage issues; the Company's ability to effectively price its property and casualty policies, including its ability to obtain regulatory consents to
pricing actions or to non-renewal or withdrawal of certain product lines; the impact on our statutory capital of various factors, including many that are outside the Company's control, which can in turn affect our credit and financial strength
ratings, cost of capital, regulatory compliance and other aspects of our business and results; risks to our business, financial position, prospects and results associated with negative rating actions or downgrades in the Company's financial
strength and credit ratings or negative rating actions or downgrades relating to our investments; the impact on our investment portfolio if our investment portfolio is concentrated in any particular segment of the economy; volatility in our
earnings and potential material changes to our results resulting from our adjustment of our risk management program to emphasize protection of economic value; the potential for differing interpretations of the methodologies, estimations and
assumptions that underlie the valuation of the Company's financial instruments that could result in changes to investment valuations; the subjective determinations that underlie the Company's evaluation of other-than-temporary impairments
on available-for-sale securities; losses due to nonperformance or defaults by others; the potential for further acceleration of deferred policy acquisition cost amortization; the potential for further impairments of our goodwill or the potential for
changes in valuation allowances against deferred tax assets; the possible occurrence of terrorist attacks and the Company's ability to contain its exposure, including the effect of the absence or insufficiency of applicable terrorism legislation on
coverage; the difficulty in predicting the Company's potential exposure for asbestos and environmental claims; the response of reinsurance companies under reinsurance contracts and the availability, pricing and adequacy of reinsurance to
protect the Company against losses; actions by our competitors, many of which are larger or have greater financial resources than we do; the Company's ability to distribute its products through distribution channels, both current and future;
the cost and other effects of increased regulation as a result of the enactment of the Dodd-Frank Wall Street Reform and Consumer Protection Act of 2010, which, among other effects, vests a Financial Services Oversight Council with the
power to designate "systemically important" institutions, will require central clearing of, and/or impose new margin and capital requirements on, derivatives transactions, and created a new "Federal Insurance Office" within the U.S. Department
of the Treasury; unfavorable judicial or legislative developments; the potential effect of other domestic and foreign regulatory developments, including those that could adversely impact the demand for the Company's products, operating costs
and required capital levels; regulatory limitations on the ability of the Company and certain of its subsidiaries to declare and pay dividends; the Company's ability to maintain the availability of its systems and safeguard the security of its data in
the event of a disaster, cyber or other information security incident or other unanticipated event; the risk that our framework for managing operational risks may not be effective in mitigating material risk and loss to the Company; the potential
for difficulties arising from outsourcing relationships; the impact of changes in federal or state tax laws; regulatory requirements that could delay, deter or prevent a takeover attempt that shareholders might consider in their best interests; the
impact of potential changes in accounting principles and related financial reporting requirements; the impact of any future errors in financial reporting; the Company's ability to protect its intellectual property and defend against claims of
infringement; the company’s ability to implement its capital plan, and other factors described in such forward-looking statements and other factors described in The Hartford's 2012 Annual Report on Form 10-K, and other filings The Hartford
makes with the Securities and Exchange Commission.
Any forward-looking statement made by the company in this presentation speaks only as of the date of this presentation. Factors or events that could cause the company's actual results to differ may emerge from time to time, and it is not
possible for the company to predict all of them. The company undertakes no obligation to publicly update any forward-looking statement, whether as a result of new information, future developments or otherwise.
USE OF NON-GAAP FINANCIAL MEASURES: The discussion in this presentation of The Hartford’s financial performance includes financial measures that are not derived from generally accepted accounting principles, or GAAP. Information
regarding these non-GAAP financial measures, including reconciliations to the most directly comparable GAAP financial measures, is provided in the appendix to this presentation.
.
3

Copyright © 2013 by The Hartford. Confidential. All rights reserved. No part of this document may be reproduced, published or posted without the permission of The Hartford.
Liam McGee, Chairman, President & CEO
1
Welcome and Overview

Copyright © 2013 by The Hartford. Confidential. All rights reserved. No part of this document may be reproduced, published or posted without the permission of The Hartford.
A Sharper Focus to Create Shareholder Value
Creating Shareholder Value
A sharper focus on businesses with: • Strong market positions • Capital generation • Low capital markets sensitivity • High return potential
Leading
Property &
Casualty
Franchise
Major Group
Benefits
Company
Top Performing
Mutual Funds
Reducing Size
and Risk of
Talcott
Resolution
2
Copyright © 2013 by The Hartford. Confidential. All rights reserved. No part of this document may be reproduced, published or posted without the permission of The Hartford.
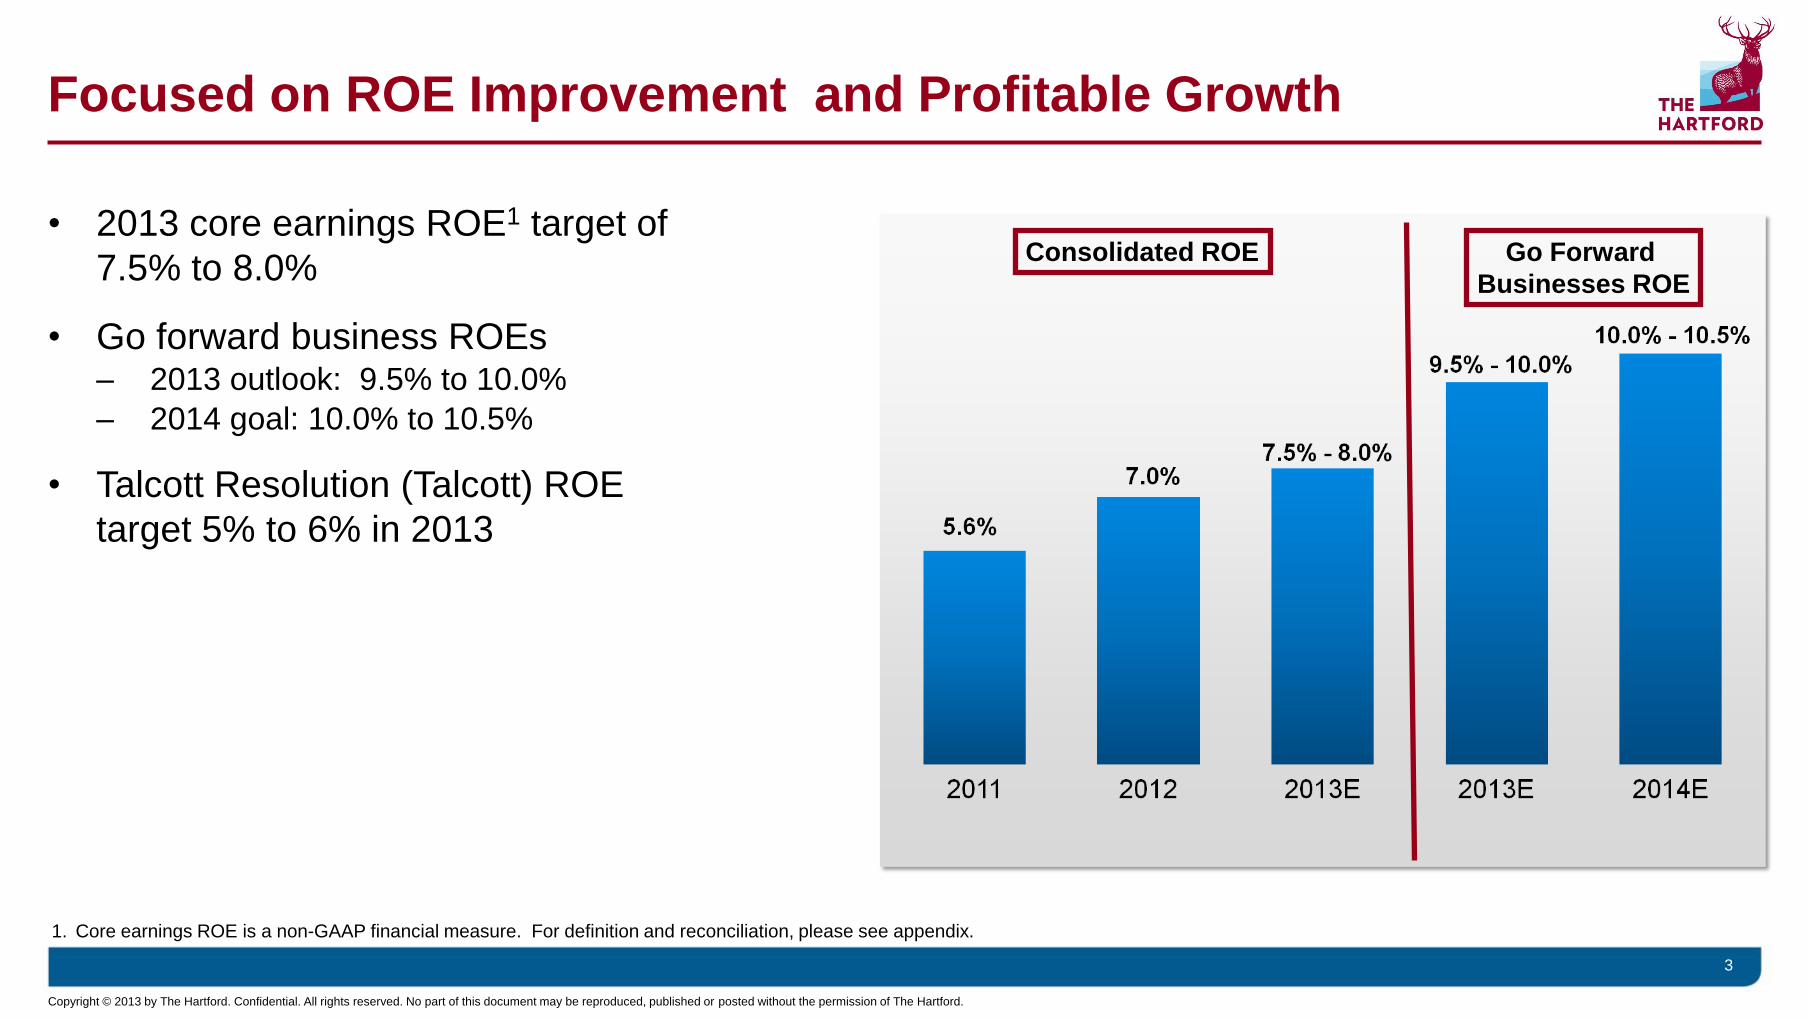
Focused on ROE Improvement and Profitable Growth
• 2013 core earnings ROE1 target of
7.5% to 8.0%
• Go forward business ROEs – 2013 outlook: 9.5% to 10.0%
– 2014 goal: 10.0% to 10.5%
• Talcott Resolution (Talcott) ROE
target 5% to 6% in 2013
3
1. Core earnings ROE is a non-GAAP financial measure. For definition and reconciliation, please see appendix.
Consolidated ROE Go Forward
Businesses ROE

Copyright © 2013 by The Hartford. Confidential. All rights reserved. No part of this document may be reproduced, published or posted without the permission of The Hartford.
4
The Hartford’s Risk Profile Has Been Materially Reduced
Dec. 31,
2009
Mar. 31,
2013E4
Risk
Reduction
Distressed Investments1 $13 billion $1 billion 93%
Debt Leverage2 31.9% 26.9%5 5 points
Variable Annuity NAR3 $6.2 billion $1.6 billion 74%
1. Distressed investments are general account investments with market values at 80% or less of book value
2. Debt leverage calculated as rating agency adjusted debt to total capitalization
3. Variable Annuity (VA) net amount at risk (NAR) is calculated by adding U.S. Guaranteed Minimum Withdrawal Benefit (GMWB) and Japan Guaranteed Minimum Income Benefits (GMIB) NAR
4. NAR and distressed investments are actual; Debt leverage is Dec. 31, 2012 pro forma for debt tender, DAC write-off and sale of Individual Life and Retirement Plans
5. See appendix for calculation
Copyright © 2013 by The Hartford. Confidential. All rights reserved. No part of this document may be reproduced, published or posted without the permission of The Hartford.
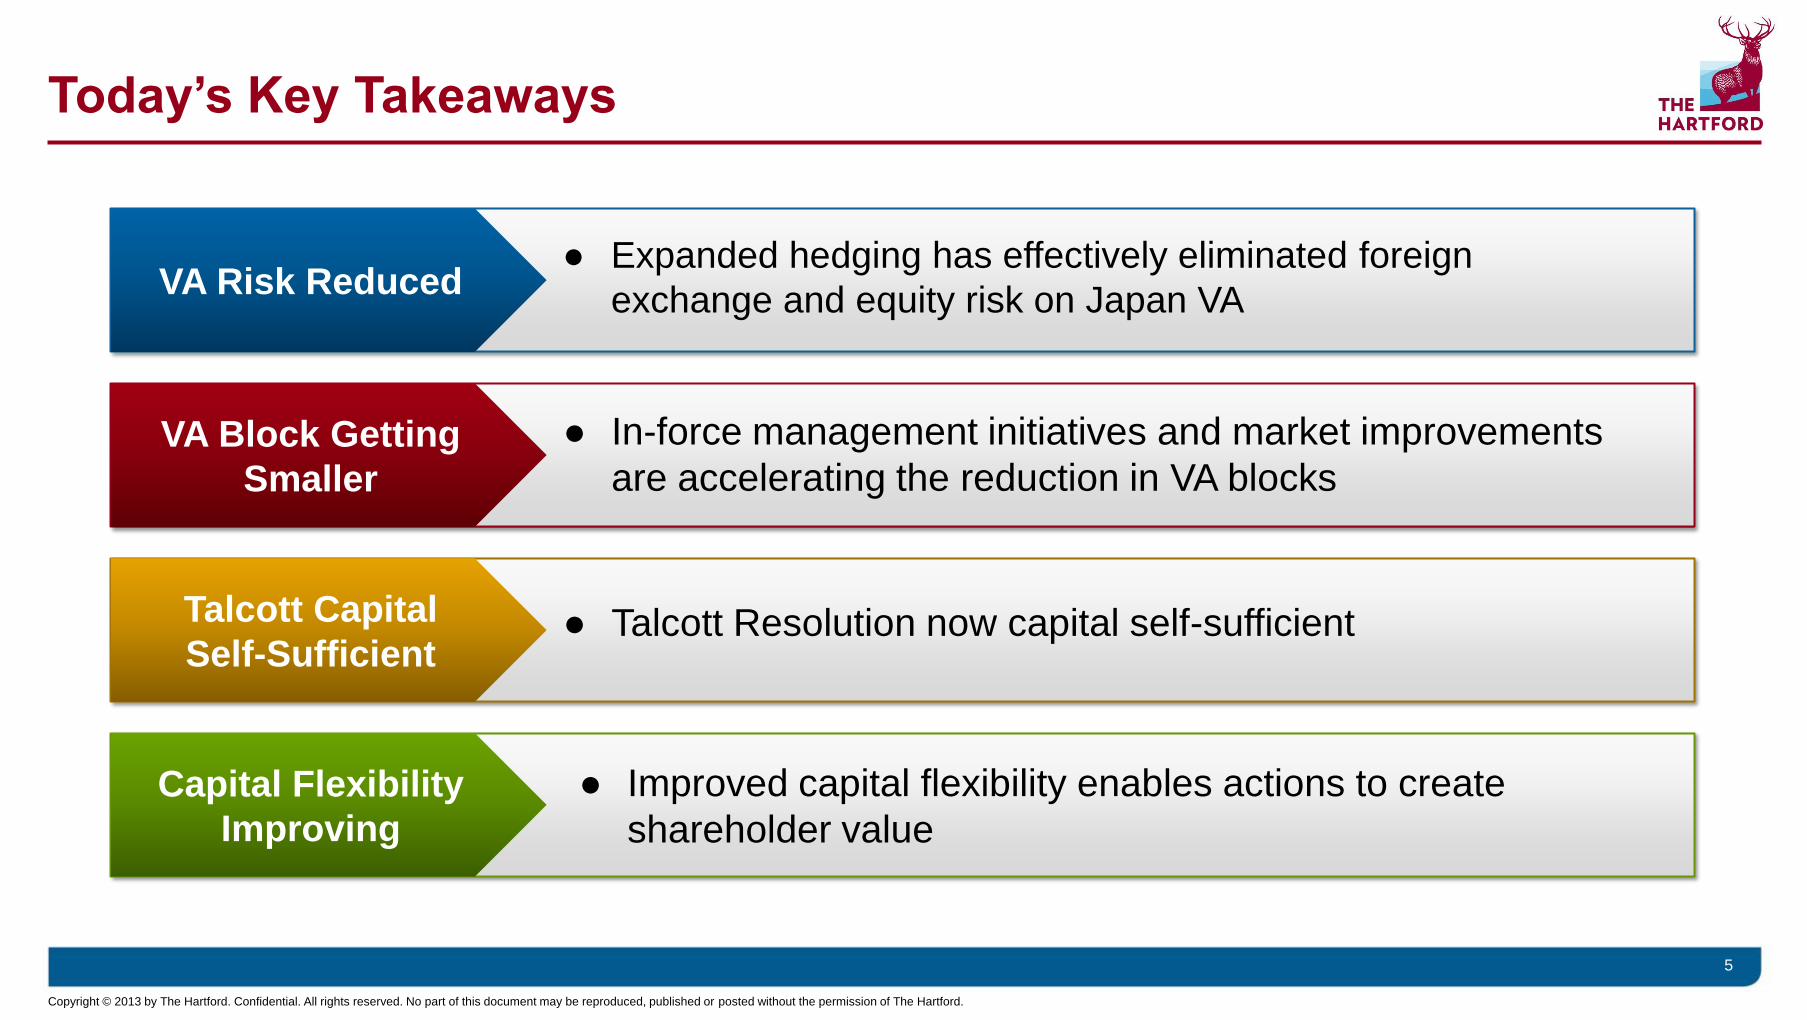
Today’s Key Takeaways
5
VA Risk Reduced
VA Block Getting
Smaller
Talcott Capital
Self-Sufficient
Capital Flexibility
Improving
● Expanded hedging has effectively eliminated foreign
exchange and equity risk on Japan VA
● In-force management initiatives and market improvements
are accelerating the reduction in VA blocks
● Talcott Resolution now capital self-sufficient
● Improved capital flexibility enables actions to create
shareholder value

Copyright © 2013 by The Hartford. Confidential. All rights reserved. No part of this document may be reproduced, published or posted without the permission of The Hartford.
1
Beth Bombara, President, Talcott Resolution
Talcott Resolution
Copyright © 2013 by The Hartford. Confidential. All rights reserved. No part of this document may be reproduced, published or posted without the permission of The Hartford.
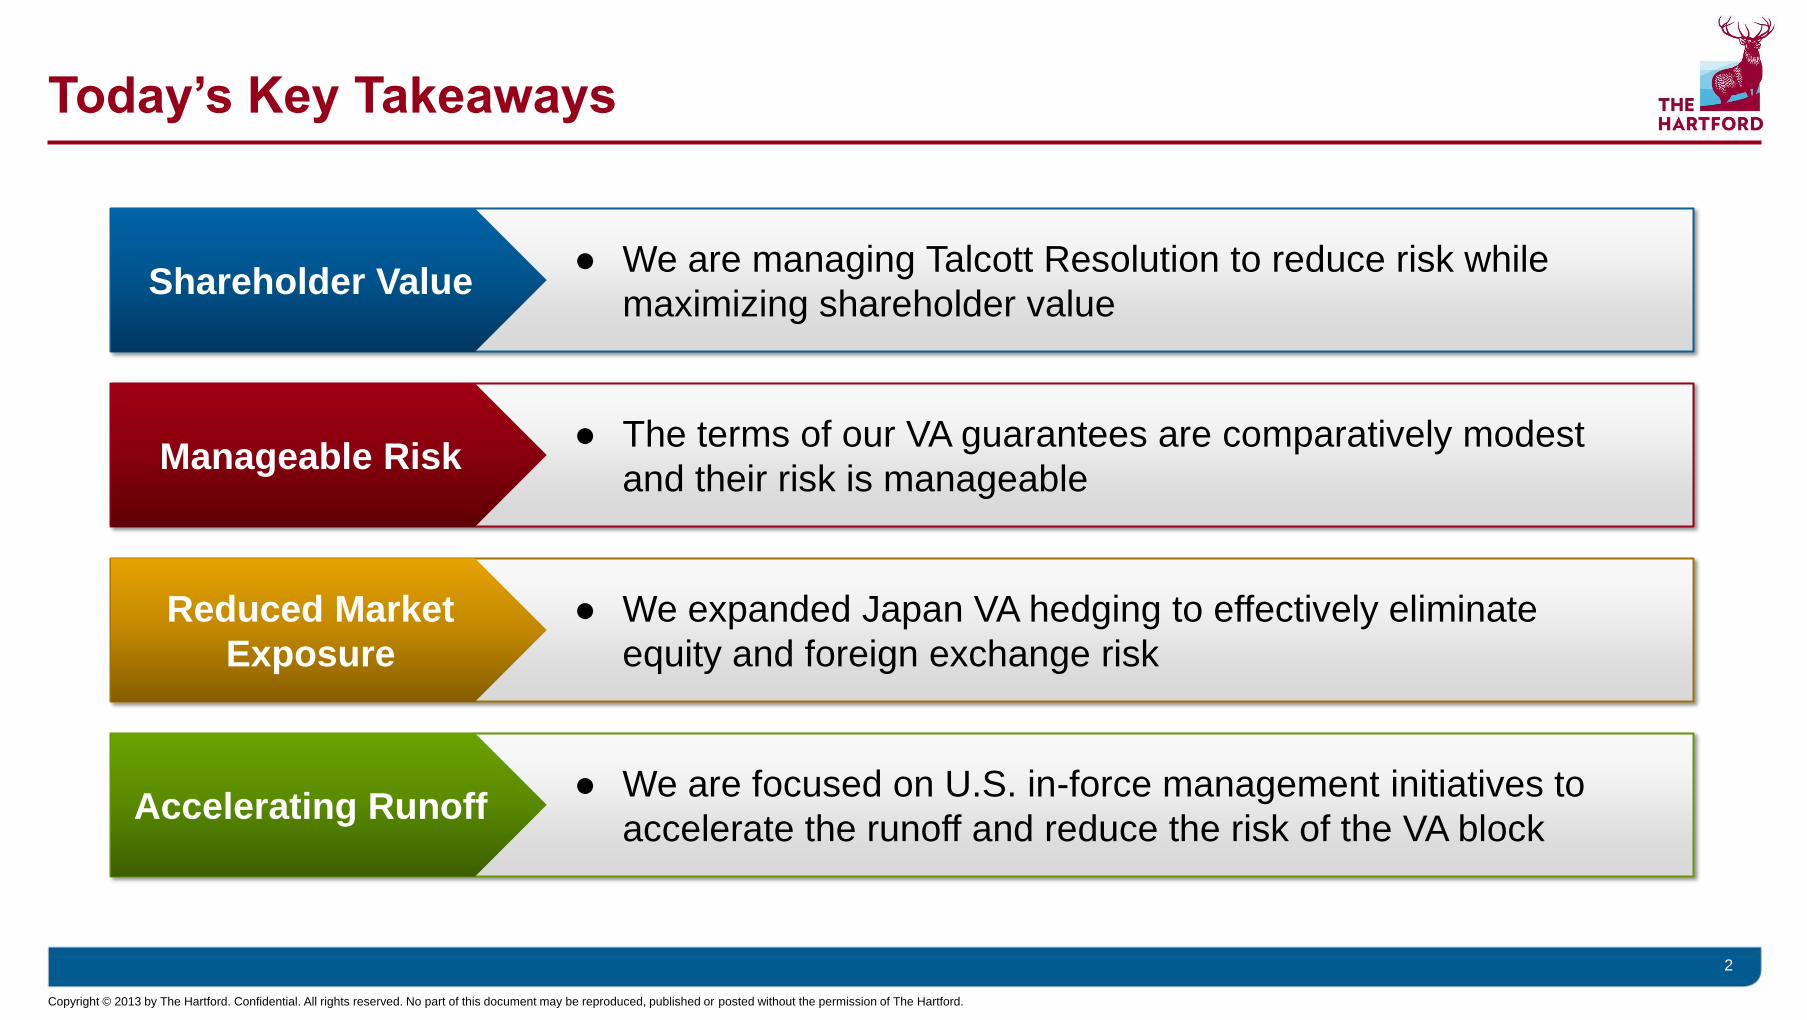
Today’s Key Takeaways
2
● We are managing Talcott Resolution to reduce risk while
maximizing shareholder value Shareholder Value
Manageable Risk
Reduced Market
Exposure
Accelerating Runoff
● The terms of our VA guarantees are comparatively modest
and their risk is manageable
● We expanded Japan VA hedging to effectively eliminate
equity and foreign exchange risk
● We are focused on U.S. in-force management initiatives to
accelerate the runoff and reduce the risk of the VA block

Copyright © 2013 by The Hartford. Confidential. All rights reserved. No part of this document may be reproduced, published or posted without the permission of The Hartford.
3
Agenda
U.S. VA Overview
Talcott Today
Japan VA Overview
Expanded Japan Hedging
U.S. In-Force Management Initiatives

Copyright © 2013 by The Hartford. Confidential. All rights reserved. No part of this document may be reproduced, published or posted without the permission of The Hartford.
Talcott Resolution Account Value1
$162.7 Billion as of Mar. 31, 2013 • Variable Annuity (VA) Block:
– >50% of Talcott account value
• Non-VA Block:
– Private Placement Life Insurance
(COLI/BOLI): Experience-rated mortality risk
– Institutional: Interest rate risk
– Fixed Annuity: Interest rate risk
4
1. Total account value includes the separate account and general account. Figure excludes the account value associated with the Retirement Plans and Individual Life businesses
VA
58%
FA
9%
Institutional
10%
PPLI
23%
Talcott Resolution is Predominately Variable Annuity

Copyright © 2013 by The Hartford. Confidential. All rights reserved. No part of this document may be reproduced, published or posted without the permission of The Hartford.
5
VA Account Value ~70% U.S. and ~30% Japan
VA Account Value By Country $94.2 Billion as of Mar. 31, 2013
*Total Account Value = Separate Account + General Account
Japan
29%
U.K.
2%
U.S.
69%
VA Contracts By Country
1.3 Million as of Mar. 31, 2013
U.S.
68% Japan
31%
U.K.
1%

Copyright © 2013 by The Hartford. Confidential. All rights reserved. No part of this document may be reproduced, published or posted without the permission of The Hartford.
6
Even Without In-Force Management Initiatives, VA Contracts
Expected To Decline By 50% By The End of 2017
-
500
1,000
1,500
2,000
2,500
2007 2012 2013 2014 2015 2016 2017 2018
Japan VA U.S. VA
-50%
-30%
Nu
mb
er
of
VA
co
ntr
ac
ts, in
th
ou
sa
nd
s
Projected1 Actual
1. Assumed 2012 organic attrition rate , exclusive of in-force management initiatives, and based on projected mortality, annuitization and surrender rates at Dec. 31, 2012.
Copyright © 2013 by The Hartford. Confidential. All rights reserved. No part of this document may be reproduced, published or posted without the permission of The Hartford.
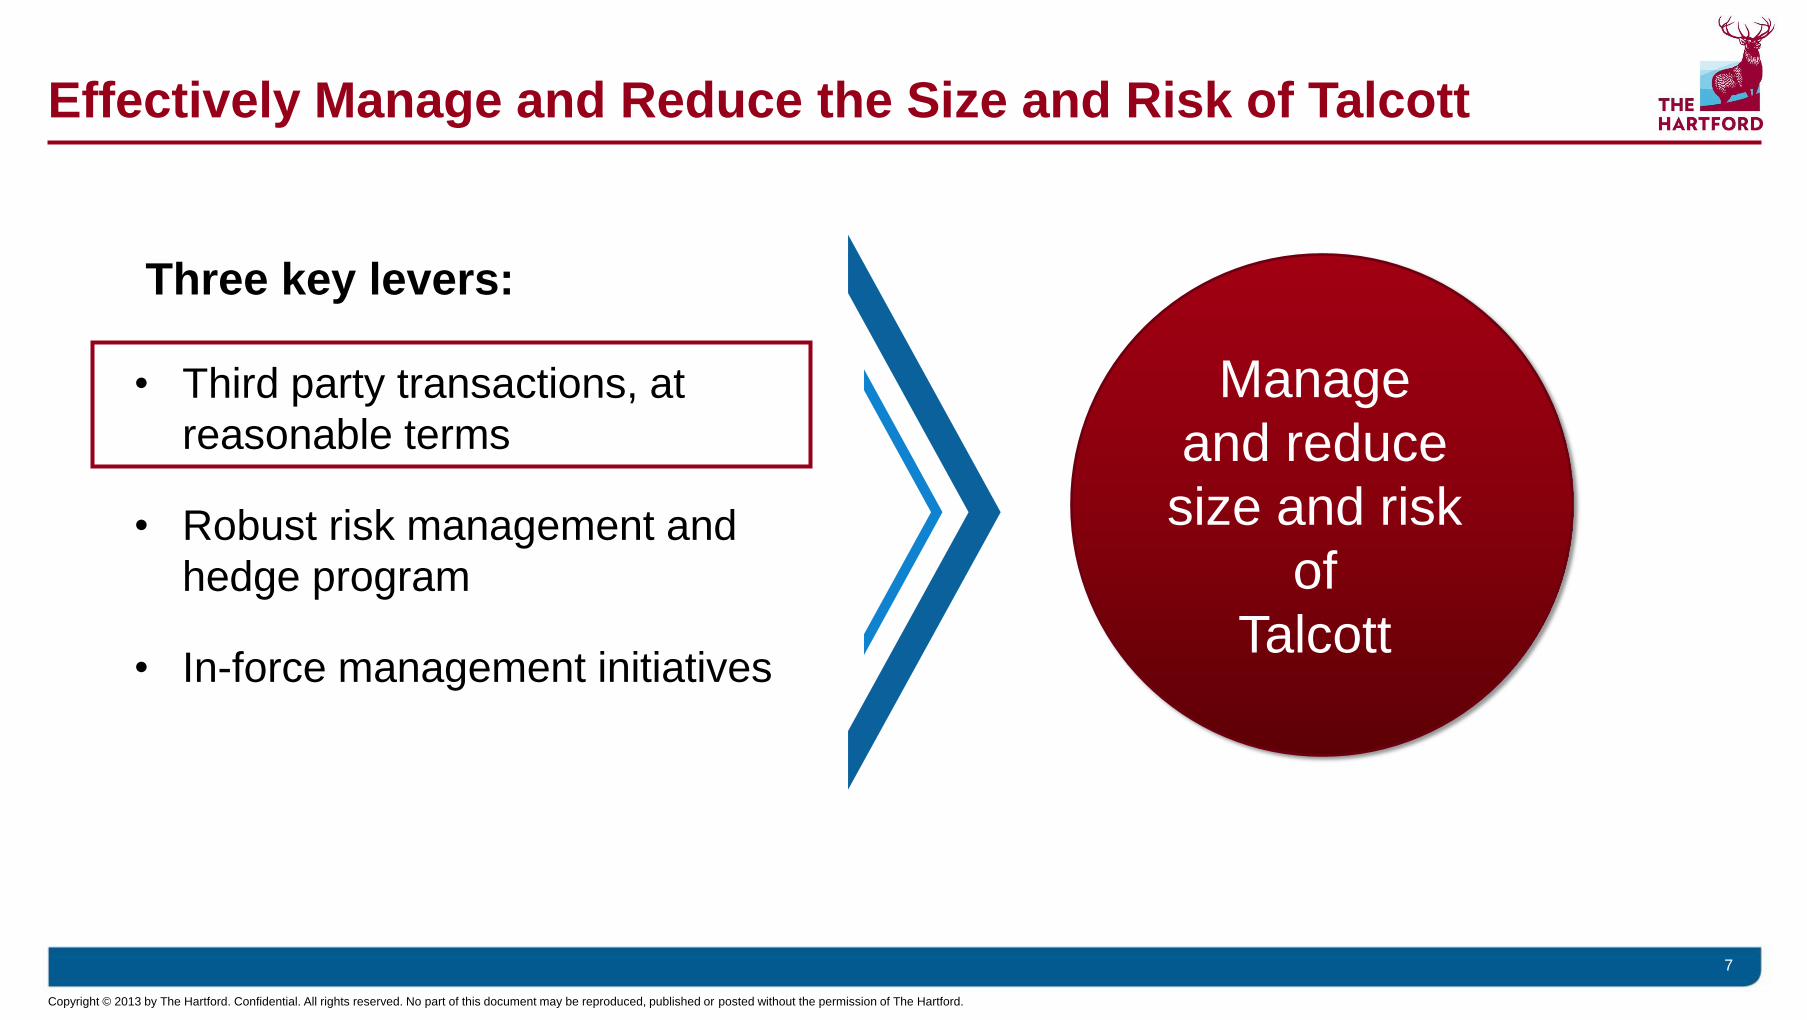
Effectively Manage and Reduce the Size and Risk of Talcott
7
Three key levers:
Manage
and reduce
size and risk
of
Talcott
• Third party transactions, at
reasonable terms
• Robust risk management and
hedge program
• In-force management initiatives

Copyright © 2013 by The Hartford. Confidential. All rights reserved. No part of this document may be reproduced, published or posted without the permission of The Hartford.
8
Agenda
U.S. VA Overview
Talcott Today
Japan VA Overview
Expanded Japan Hedging
U.S. In-Force Management Initiatives

Copyright © 2013 by The Hartford. Confidential. All rights reserved. No part of this document may be reproduced, published or posted without the permission of The Hartford.
9
Japan VA Primarily Comprised of Return of Premium Guarantees
$26.9 Billion as of Mar. 31, 2013
9
Japan VA Account Value
By Type of Guarantee
• 100% of guaranteed minimum income
benefit (GMIB) guarantees are return of
initial premium
– Payout over the annuitization period, not
lump sum
• 82% of guaranteed minimum death
benefit (GMDB) guarantees are return
of initial premium
GMIB & GMDB
$22.4 (83%)
GMDB Only
$1.8 (7%)
GMDB & Other Living Benefits
$2.7(10%)

Copyright © 2013 by The Hartford. Confidential. All rights reserved. No part of this document may be reproduced, published or posted without the permission of The Hartford.
Account Value by Currency1
U.S. Dollar
23%
Euro
17% Yen
49%
10
Japan VA Account Value ~60% Fixed Income and ~40% Equities As of Mar 31, 2013
Account Value by Asset Type
Japan Equity
20%
Global Equity
9%
Global Equity
Hedged to Yen
13% Japan
Gov’t Bonds
16%
Global Gov’t
Bonds
42%
Other
11%
1Currency reflects the denomination of the sub-account.

Copyright © 2013 by The Hartford. Confidential. All rights reserved. No part of this document may be reproduced, published or posted without the permission of The Hartford.
11
Japan VA Economics Dramatically Improved Since Sept. 2012
Contracts ITM –
Average Moneyness
Retained NAR
($ in billions)
Japan GMIB – Retained NAR & Moneyness
-20%
-18%
-16%
-14%
-12%
-10%
-8%
-6%
-4%
-2%
0%
$0
$1
$2
$3
$4
$5
$6
$7
3Q12 4Q12 Jan. 13 Feb. 13 Mar. 13
• Retained net amount at risk
has declined from $6.1 billion
to $1.3 billion
• The average moneyness1 of
in-the-money (ITM)2 GMIB
contracts has declined from
19% to 7%
• One-third of contracts are
out-of-the-money (OTM)2,
compared with 98% ITM at
Sept. 30, 2012
(IT
M)/
OT
M
1. For contracts that are in–the-money, percentage by which the average contract is in –the-money
2. In-the-money contracts have an account value that is less than its guaranteed value, at a point in time. Out-of the money contracts have an account value greater than the guaranteed value, at a point in time.

Copyright © 2013 by The Hartford. Confidential. All rights reserved. No part of this document may be reproduced, published or posted without the permission of The Hartford.
Japan Surrenders Rose Sharply in 1Q13 as Moneyness Improved;
Majority of Block Beyond Surrender Charge Period
12
• 1Q13 annualized surrender
rate of 10%
• 68% of the GMIB block beyond
surrender charge period as of
Mar. 31, 2013 – 80% expected at year-end 2013
Japan GMIB – Annualized Surrender Rate
0%
2%
4%
6%
8%
10%
12%
14%
16%
Q1 Q2 Q3 Q4 J F M
2012 2013
4%
11%
14%

Copyright © 2013 by The Hartford. Confidential. All rights reserved. No part of this document may be reproduced, published or posted without the permission of The Hartford.
13
Agenda
U.S. VA Overview
Talcott Today
Japan VA Overview
Expanded Japan Hedging
U.S. In-Force Management Initiatives

Copyright © 2013 by The Hartford. Confidential. All rights reserved. No part of this document may be reproduced, published or posted without the permission of The Hartford.
14
Effectively Manage and Reduce the Size and Risk of Talcott
Three key levers
Manage
and reduce
size and risk
of
Talcott
• Third party transactions, at
reasonable terms
• Robust risk management and
hedge program
• In-force management initiatives

Copyright © 2013 by The Hartford. Confidential. All rights reserved. No part of this document may be reproduced, published or posted without the permission of The Hartford.
Expanded Japan Hedging Effectively Eliminates
Equity and Foreign Exchange Risk
• Japan VA hedges now effectively eliminates equity and foreign exchange (FX)
risk
• Hedging strategy, coupled with current moneyness levels, significantly offsets
risk in Japan VA GMIB guarantees
• Expanded hedging program intended to preserve improved economics
• Talcott now capital self-sufficient
15

Copyright © 2013 by The Hartford. Confidential. All rights reserved. No part of this document may be reproduced, published or posted without the permission of The Hartford.
Expanded Japan Hedge Meaningfully Reduces Surplus Volatility
16
Cumulative Impact to Surplus From Japan VA, Including Hedge
2013 through 2014 ($ in millions, before tax)
Based on cumulative 2013-2014 impact to surplus, including the HLIKK legal entity
$150
($1780)
($140)
$40
Before Expanded Hedging After Expanded Hedging
Base Scenario Stress Scenario

Copyright © 2013 by The Hartford. Confidential. All rights reserved. No part of this document may be reproduced, published or posted without the permission of The Hartford.
Why Now? Limited Upside to Japan’s Economic Value Remains
• Much of the improvement in
economic value has already
occurred
• As favorable markets drive
account values above the
guaranteed values, the company
derives less marginal economic
value
• Expanded hedging will effectively
eliminate adverse impact of stress
market scenarios
– Will also increase hedging
costs, thereby eliminating
expected gross profits Declining Markets Improving Markets
Ma
rke
t C
on
sis
ten
t V
alu
e,
Ex
clu
din
g H
ed
gin
g Today’s
market
17

Copyright © 2013 by The Hartford. Confidential. All rights reserved. No part of this document may be reproduced, published or posted without the permission of The Hartford.
Why Now? Because ITM Account Values Can Fund Future Payout
18
• For ITM accounts, GMIB account
value is 93% of guaranteed future
payout, as of Mar. 31, 2013
• To fully fund the guarantee, the
portfolio needs a 1% average
annual return during the 10 to 15
year payout phase
As of Mar. 31, 2013
($ in billions)
$14.6
$15.7
$14
$15
$16
ITM GMIB Account Value GMIB Guaranteed Payout
Over 10-15 year payout
period
Represents in-the-money contracts
~100 bp return/yr

Copyright © 2013 by The Hartford. Confidential. All rights reserved. No part of this document may be reproduced, published or posted without the permission of The Hartford.
$0.3
$4.0
$6.8
$2.3 $2.6
$1.3
$0.6 $1.1
$2.4
$1.0
2013 2014 2015 2016 2017 2018 2019 2020 2021 2022+
Ma
rch
31
, 2
01
3
Ac
co
un
t V
alu
e
Capital Released as Contracts Annuitize or Surrender in Future
Annuitization eligibility assumes no surrenders and no deaths after March 31, 2013
19
GMIB Account Value by Year of Initial Annuitization Eligibility
As of Mar. 31, 2013
($ in billions)
• 50% of block eligible for
annuitization in next 3 years
– Expect 50-60% annuitization rates
for contracts 0-10% in the money in
the first year
– 20% expected in each year
thereafter
• If markets continue to rise,
surrender rates likely to increase
and annuitizations to decline
• Death benefit claims will be
funded by reserves
50% of AV
Average
Moneyness
(ITM)/OTM 8.2% 3.3% (2.0%) (8.1%) (10.8%) (1.8%) 4.4% (7.7%) (8.4%) (5.3%)

Copyright © 2013 by The Hartford. Confidential. All rights reserved. No part of this document may be reproduced, published or posted without the permission of The Hartford.
Agenda
U.S. VA Overview
Talcott Today
Japan VA Overview
Expanded Japan Hedging
U.S. In-Force Management Initiatives
20

Copyright © 2013 by The Hartford. Confidential. All rights reserved. No part of this document may be reproduced, published or posted without the permission of The Hartford.
21
*Total Account Value = Separate Account + General Account
$65.5 Billion of Account Value as of Mar. 31, 2013
U.S. VA: GMDB Guarantee by Type
U.S. GMDB Is Significantly Reinsured
Gross NAR Retained NAR
$5.4
$1.5
($ in billions)
72% of
GMDB
NAR is
reinsured
$15.0 (23%)
$20.1 (31%)
$25.0 (38%)
$3.2 (5%)
$2.2 (3%)
Resets Return on Premium Rollups Capped Step Ups Full Step Ups
($ in billions)

Copyright © 2013 by The Hartford. Confidential. All rights reserved. No part of this document may be reproduced, published or posted without the permission of The Hartford.
22
*Total Account Value = Separate Account + General Account
• 66% of the Non-Lifetime guaranteed
minimum withdrawal benefit (GMWB)
NAR is covered by reinsurance with
third parties; the balance is covered
by dynamic hedging
– 37% by traditional reinsurance
– 29% by capital markets reinsurance
• Lifetime GMWB risks are managed
through U.S. Macro Hedge program
$65.5 Billion of Account Value as of Mar. 31, 2013
U.S. VA: Living Benefits by Type
No Living
Benefit
$31.4 (48%)
Non-Lifetime
GMWB
$21.2 (32%)
LifetimeWB
w/Caps
$10.2 (16%)
Uncapped
LifetimeWB
$2.7 (4%)
52% of U.S. VA Has Living Benefit Guarantee

Copyright © 2013 by The Hartford. Confidential. All rights reserved. No part of this document may be reproduced, published or posted without the permission of The Hartford.
Contracts ITM –
Average Moneyness
Retained NAR
($ in billions)
(IT
M)/
OT
M
23
Almost 90% of U.S. VA Contracts are Above Guaranteed Values
U.S. GMWB – Retained NAR & Moneyness
-16%
-14%
-12%
-10%
-8%
-6%
-4%
-2%
0%
0.0
0.5
1.0
1.5
2.0
2.5
3.0
3Q11 4Q11 1Q12 2Q12 3Q12 4Q12 1Q13
• Since Sept. 2011, retained
GMWB NAR has improved
from $2.5 billion to $0.3 billion
• At Mar. 31, 2013:
– 89% of contracts are OTM
– Of the 11% of contracts ITM,
average moneyness is 9%

Copyright © 2013 by The Hartford. Confidential. All rights reserved. No part of this document may be reproduced, published or posted without the permission of The Hartford.
24
U.S. Surrender Rate Rose in 1Q13, Including
Enhanced Surrender Value Offer
• 65% of GMWB contracts were
beyond the surrender charge
period at Mar. 31, 2013
– 73% expected at year-end 2013
• U.S. GMWB policyholder
behavior has closely tracked
our assumptions
Annualized Surrender Rate on U.S. GMWB
0%
5%
10%
15%
20%
25%
Q1 Q2 Q3 Q4 Q1 Q2 Q3 Q4 Q1
Total Surrender Rate Total Surrender Rate Excluding ESV
2011 2012 2013

Copyright © 2013 by The Hartford. Confidential. All rights reserved. No part of this document may be reproduced, published or posted without the permission of The Hartford.
25
Agenda
U.S. VA Overview
Talcott Today
Japan VA Overview
Expanded Japan Hedging
U.S. In-Force Management Initiatives

Copyright © 2013 by The Hartford. Confidential. All rights reserved. No part of this document may be reproduced, published or posted without the permission of The Hartford.
Effectively Manage and Reduce the Size and Risk of Talcott
26
Three key levers
Manage
and reduce
size and risk
of
Talcott
• Third party transactions, at
reasonable terms
• Robust risk management and
hedge program
• In-force management initiatives
Copyright © 2013 by The Hartford. Confidential. All rights reserved. No part of this document may be reproduced, published or posted without the permission of The Hartford.
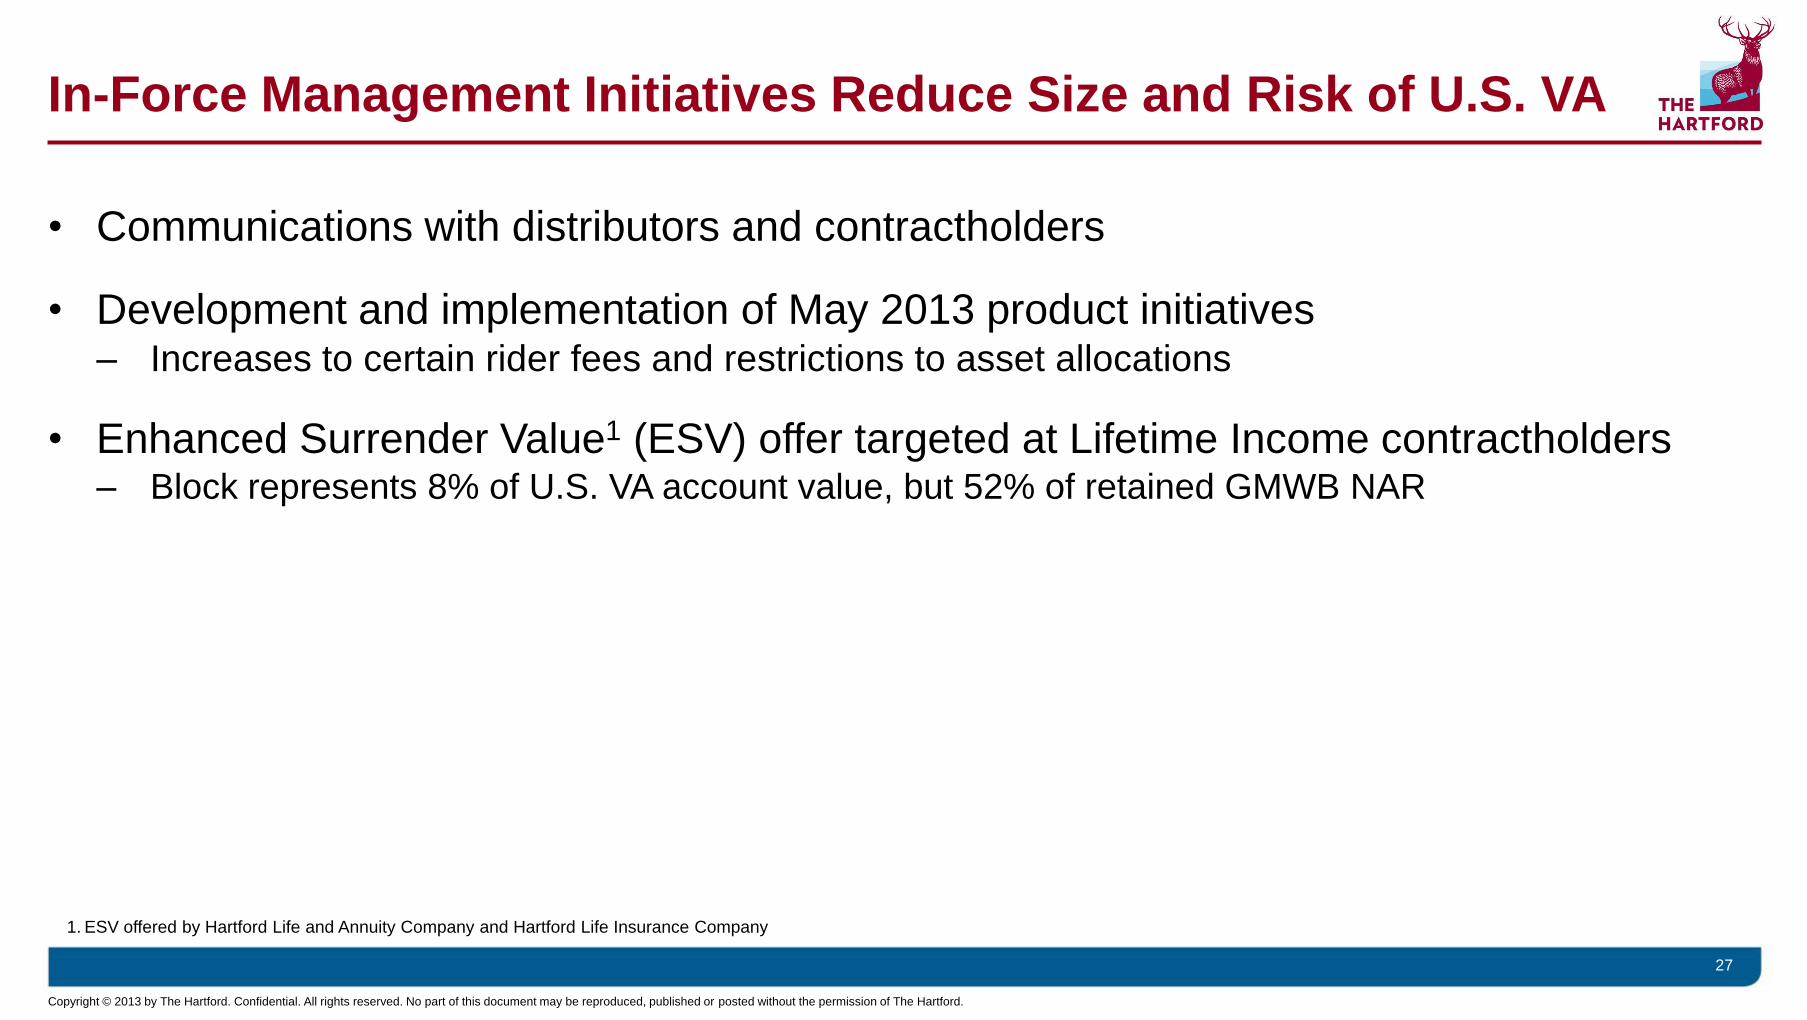
In-Force Management Initiatives Reduce Size and Risk of U.S. VA
• Communications with distributors and contractholders
• Development and implementation of May 2013 product initiatives – Increases to certain rider fees and restrictions to asset allocations
• Enhanced Surrender Value1 (ESV) offer targeted at Lifetime Income contractholders – Block represents 8% of U.S. VA account value, but 52% of retained GMWB NAR
27
1. ESV offered by Hartford Life and Annuity Company and Hartford Life Insurance Company

Copyright © 2013 by The Hartford. Confidential. All rights reserved. No part of this document may be reproduced, published or posted without the permission of The Hartford.
$60,000
$80,000
Account Value Enhanced Surrender Value
ESV Provides Attractive Surrender Value While Accelerating
Runoff of Most Capital Intensive U.S. VA Block
28
Original Contract Terms1 Illustrative ESV Offer2
1. Illustrative example assumes $100,000 payment base, with current account value of $60,000 and $2,000 surrender charge.
2. Illustrative example assumes $100,000 payment base. Under the ESV, the surrender charge is waived, and the contractholder is eligible to receive current account value plus 20% of the payment base; up to 90% of
the payment base. In some circumstances contract holders would only receive a waiver of surrender charges and other fees. See the annuity product prospectus for other illustrative examples.
$60,000 $58,000
Account Value Original Surrender Value
$100,000 Payment Base $100,000 Payment Base

Copyright © 2013 by The Hartford. Confidential. All rights reserved. No part of this document may be reproduced, published or posted without the permission of The Hartford.
29
ESV Acceptance Rate To Date Above Initial Expectations
Phase1
Cumulative
Acceptance Rate
To Date2 Mailing Date
Number of
Eligible Policies
Amount of Eligible
Account Value ($ in billions)
1 22% February 1, 2013 20,500 $2.2
2 12% March 1, 2013 14,000 $1.5
3 NA April 1, 2013 4,500 $0.4
1. Offers to contract holders were made in phases, based on state regulatory approvals
2. As of April 5, 2013

Copyright © 2013 by The Hartford. Confidential. All rights reserved. No part of this document may be reproduced, published or posted without the permission of The Hartford.
Today’s Key Takeaways
30
● We are managing Talcott Resolution to reduce risk while
maximizing shareholder value Shareholder Value
Manageable Risk
Reduced Market
Exposure
Accelerating Runoff
● The terms of our VA guarantees are comparatively modest
and their risk is manageable
● We expanded Japan VA hedging to effectively eliminate
equity and FX risk
● We are focused on U.S. in-force management initiatives to
accelerate the runoff and reduce the risk of the VA block

Copyright © 2013 by The Hartford. Confidential. All rights reserved. No part of this document may be reproduced, published or posted without the permission of The Hartford.
Bob Rupp, Executive Vice President and Chief Risk Officer
1
Risk Management and Hedging
Copyright © 2013 by The Hartford. Confidential. All rights reserved. No part of this document may be reproduced, published or posted without the permission of The Hartford.
U.S. GMWB Hedge Program
U.S. Macro Hedge Program
Japan Hedge Program
2
Agenda
Hedging Programs Overview
Copyright © 2013 by The Hartford. Confidential. All rights reserved. No part of this document may be reproduced, published or posted without the permission of The Hartford.
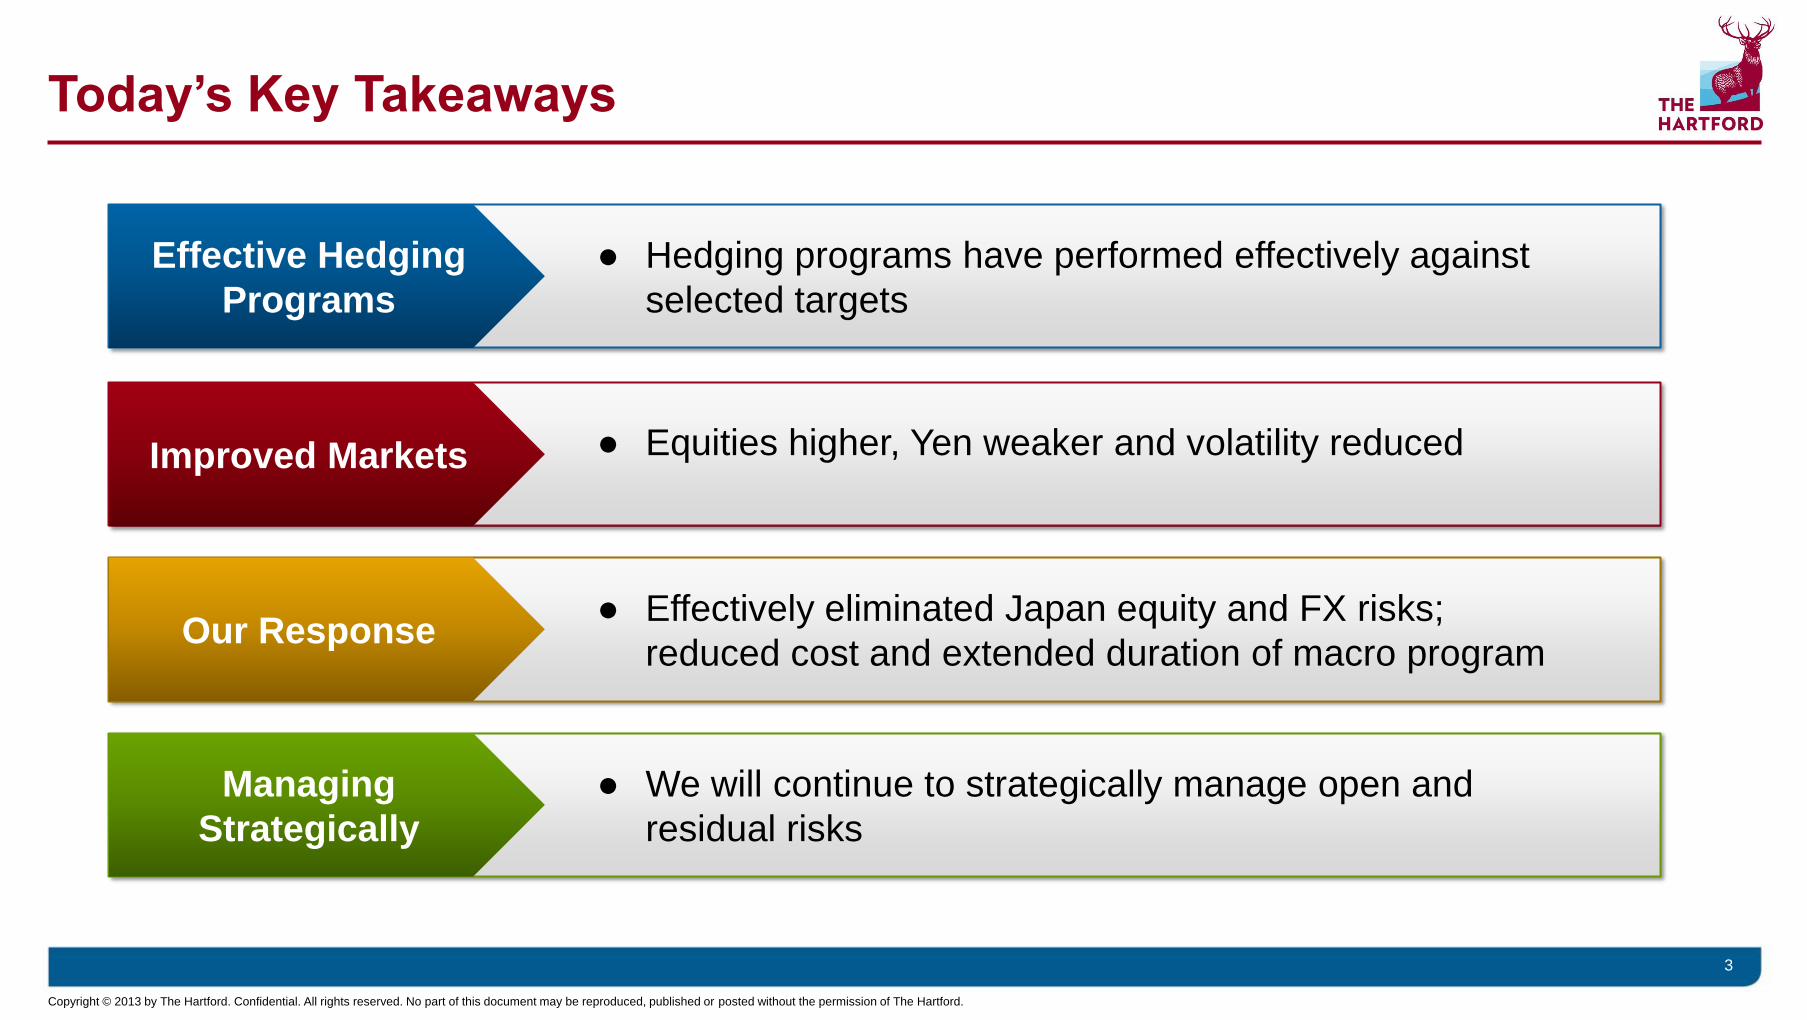
Today’s Key Takeaways
● Hedging programs have performed effectively against
selected targets
3
● Equities higher, Yen weaker and volatility reduced
● Effectively eliminated Japan equity and FX risks;
reduced cost and extended duration of macro program
● We will continue to strategically manage open and
residual risks
Effective Hedging
Programs
Improved Markets
Our Response
Managing
Strategically

Copyright © 2013 by The Hartford. Confidential. All rights reserved. No part of this document may be reproduced, published or posted without the permission of The Hartford.
4
Our Risks Are Covered by Comprehensive
and Effective Hedging Programs
U.S. 69%
UK 2%
Japan 29%
Copyright © 2013 by The Hartford. Confidential. All rights reserved. No part of this document may be reproduced, published or posted without the permission of The Hartford.
5
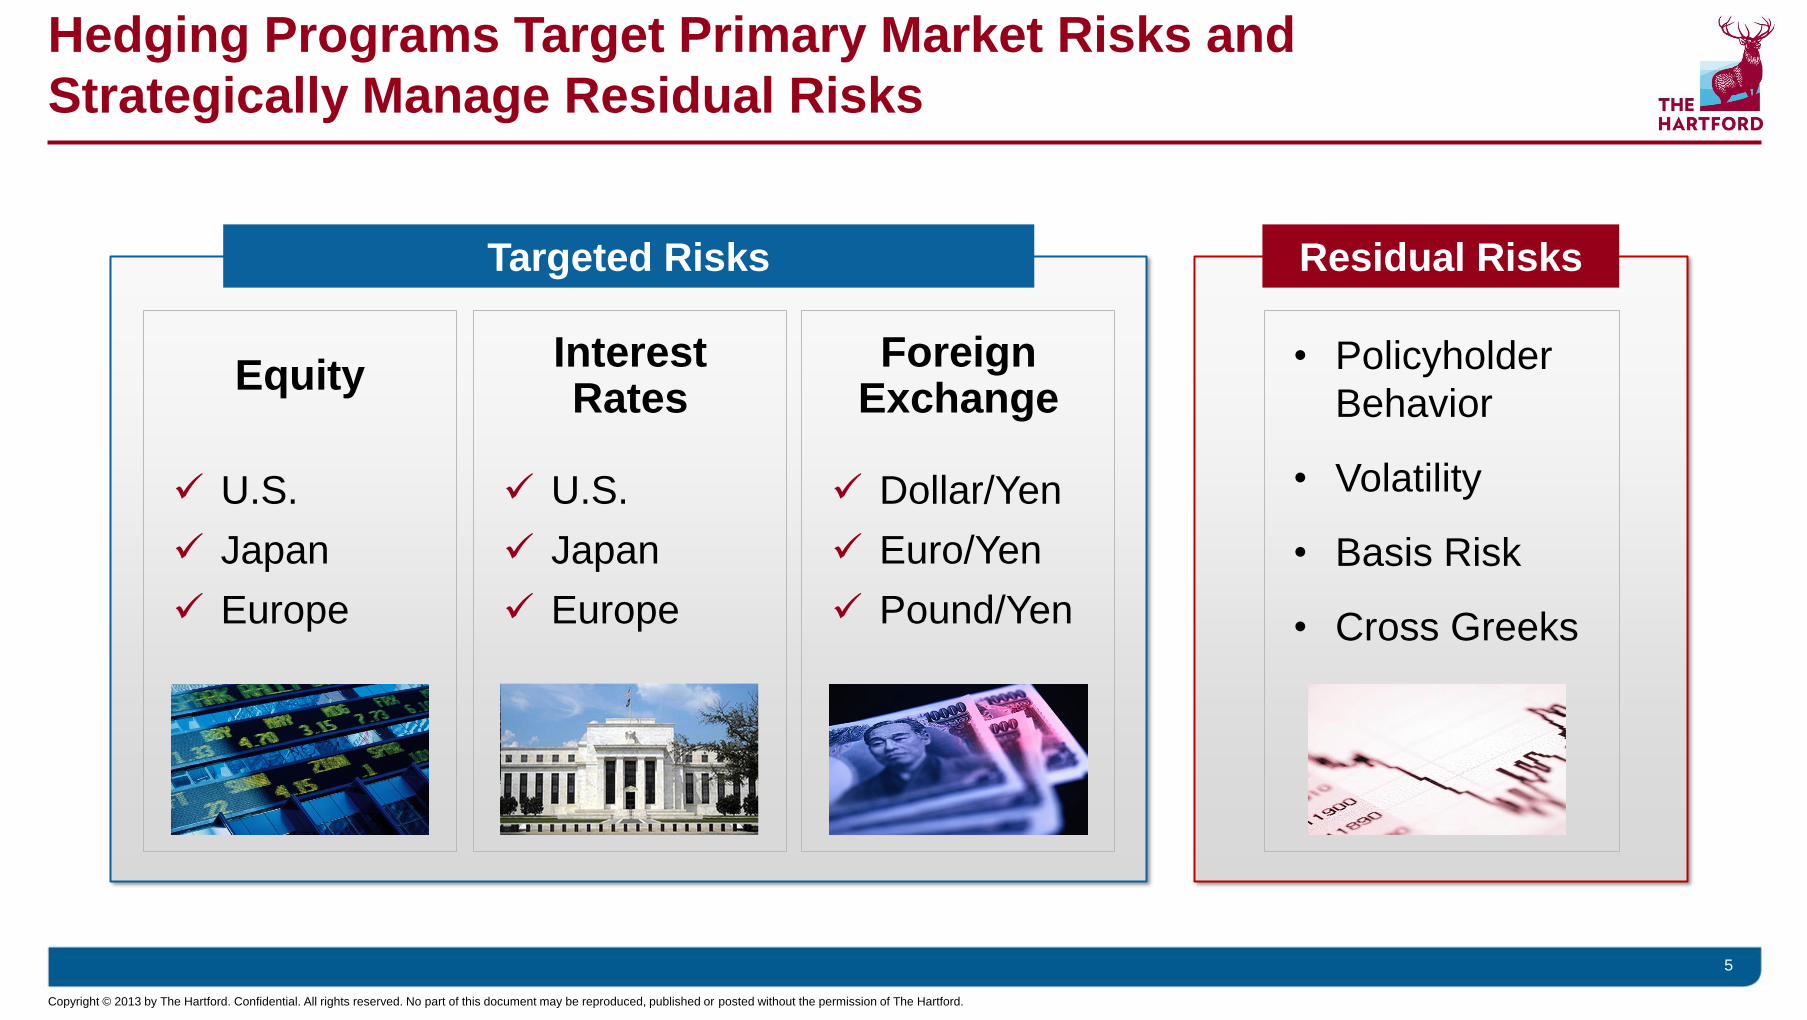
Hedging Programs Target Primary Market Risks and
Strategically Manage Residual Risks
Targeted Risks Residual Risks
Equity Interest Rates
Foreign Exchange
U.S.
Japan
Europe
U.S.
Japan
Europe
Dollar/Yen
Euro/Yen
Pound/Yen
• Policyholder
Behavior
• Volatility
• Basis Risk
• Cross Greeks

Copyright © 2013 by The Hartford. Confidential. All rights reserved. No part of this document may be reproduced, published or posted without the permission of The Hartford.
U.S. GMWB Hedge Program • Overview
• Results
U.S. Macro Hedge Program
Japan Hedge Program
6
Agenda
Hedging Programs Overview

Copyright © 2013 by The Hartford. Confidential. All rights reserved. No part of this document may be reproduced, published or posted without the permission of The Hartford.
7
A Decade of Experience Hedging U.S. GMWB
• Target: Full hedge of
FAS 157/133 liability which is
correlated to economics
• Dynamically managed
Targeted Risks Program
• Instituted in 2003
• 52% of U.S. VA account
value includes withdrawal
benefit guarantees
• GAAP sensitivity largely
driven by residual risks

Copyright © 2013 by The Hartford. Confidential. All rights reserved. No part of this document may be reproduced, published or posted without the permission of The Hartford.
1 Risks reflected in target liability include equities, interest rates, and equity volatility (per FAS 157/133 calculation)
8
U.S. GMWB Hedges Have Been Effective Against Targets
Change in Hedge Target Liability1 Change in Hedge Assets
Change in Value of Hedge Asset and Target Liability
Ab
so
lute
Valu
e o
f C
han
ge (
$ i
n m
illi
on
s)
$0
$100
$200
$300
$400
$500
$600
$700
Q1 2012 Q2 2012 Q3 2012 Q4 2012 Q1 2013

Copyright © 2013 by The Hartford. Confidential. All rights reserved. No part of this document may be reproduced, published or posted without the permission of The Hartford.
U.S. GMWB Hedge Program
U.S. Macro Hedge Program • Overview
• Program Enhancements
Japan Hedge Program
9
Agenda
Hedging Programs Overview

Copyright © 2013 by The Hartford. Confidential. All rights reserved. No part of this document may be reproduced, published or posted without the permission of The Hartford.
10
U.S. Macro Hedge Protects Statutory Surplus in Stress Scenarios
• Targets equity tail risk
• More static approach
• Protects statutory surplus in
stress scenarios
Targeted Risks Program
• Instituted in 2009
• Primarily options-based
coverage focused on GMDB
and other risks
• GAAP sensitivity includes
change in hedge assets only
Copyright © 2013 by The Hartford. Confidential. All rights reserved. No part of this document may be reproduced, published or posted without the permission of The Hartford.
10
13
16
19
22
25
1200
1300
1400
1500
1600
SPX Index VIX Index
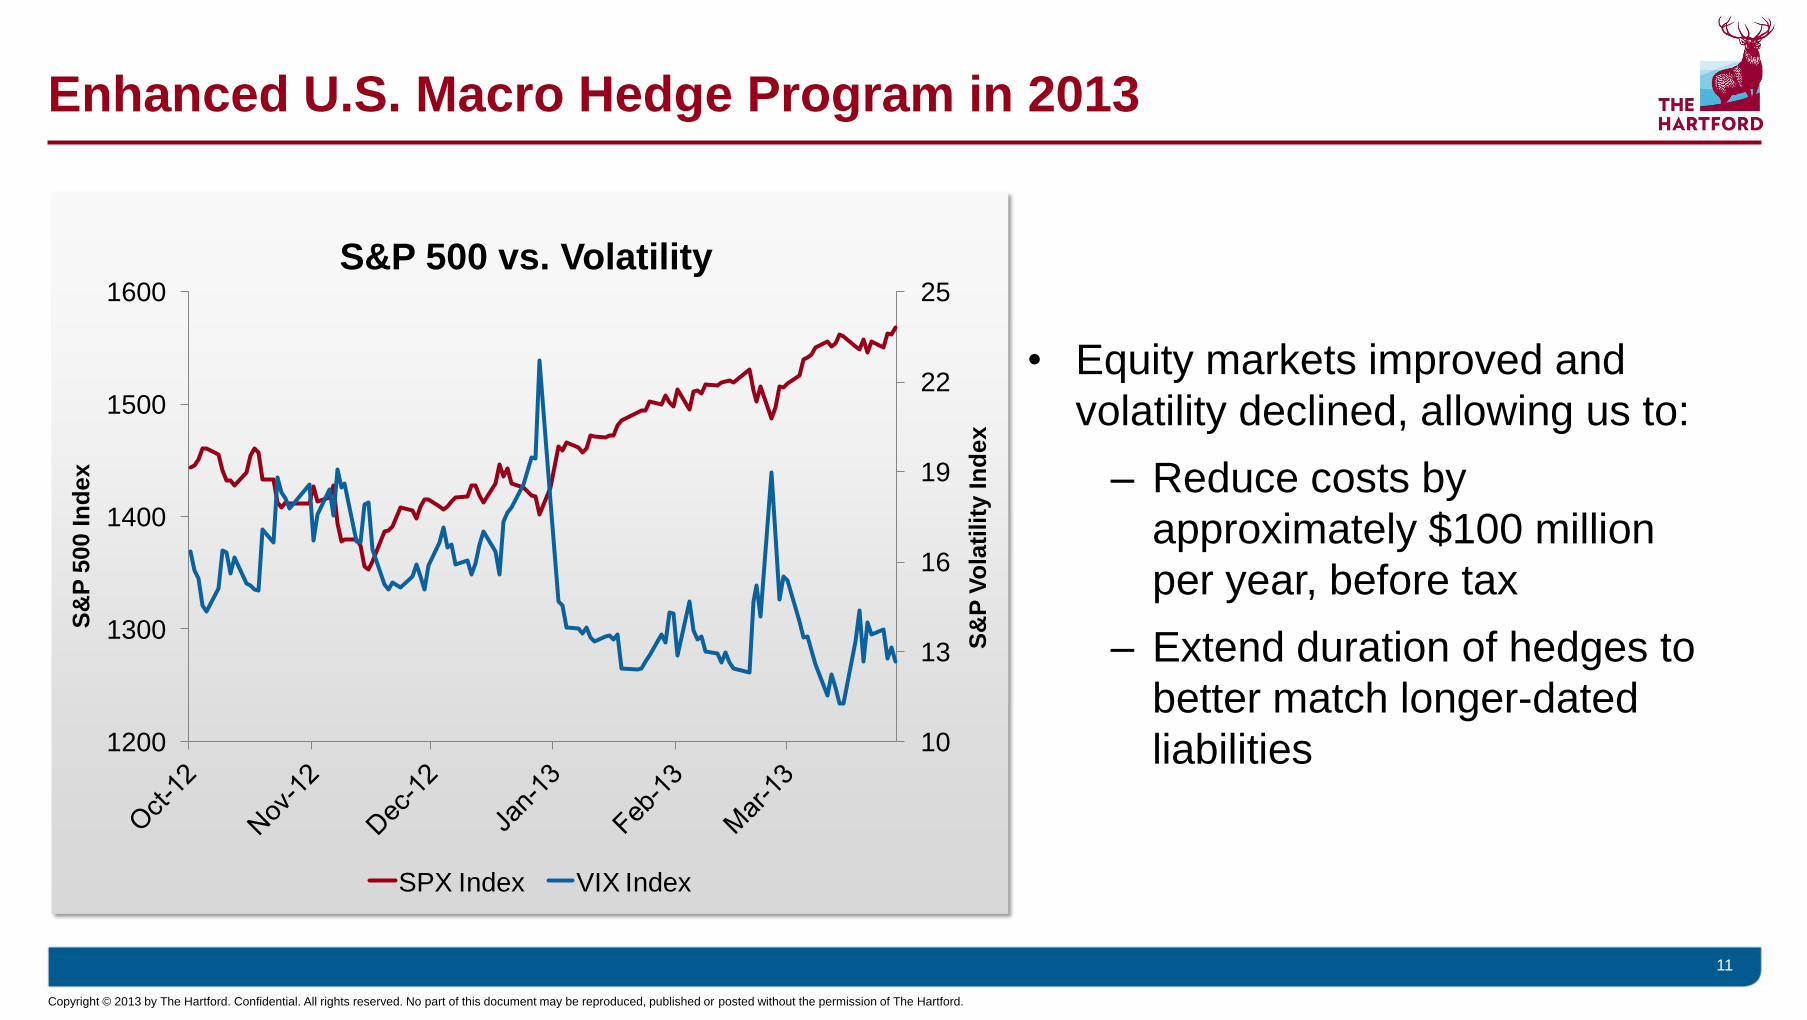
Enhanced U.S. Macro Hedge Program in 2013
11
S&P 500 vs. Volatility
• Equity markets improved and
volatility declined, allowing us to:
– Reduce costs by
approximately $100 million
per year, before tax
– Extend duration of hedges to
better match longer-dated
liabilities
S&
P 5
00 I
nd
ex
S&
P V
ola
tili
ty I
nd
ex

Copyright © 2013 by The Hartford. Confidential. All rights reserved. No part of this document may be reproduced, published or posted without the permission of The Hartford.
U.S. GMWB Hedge Program
U.S. Macro Hedge Program
Japan Hedge Program • Overview
• Results
• Market Developments
• Program Enhancements
Agenda
Hedging Programs Overview
12

Copyright © 2013 by The Hartford. Confidential. All rights reserved. No part of this document may be reproduced, published or posted without the permission of The Hartford.
13
Japan Hedge Program Targets “Tail” in VA Block
• Global equity, interest rates,
and FX
• Expanded program to
effectively eliminate equity
and FX risk in early 2013
• Dynamically managed
Targeted Risks Program
• Instituted in 2011
• Tail approach: designed to
increase/decrease hedge
target in response to market
movements
• GAAP sensitivity includes
change in hedge assets only

Copyright © 2013 by The Hartford. Confidential. All rights reserved. No part of this document may be reproduced, published or posted without the permission of The Hartford.
Eco
no
mic
Valu
e o
f L
iab
ilit
y
Hedge
Coverage
• The Hartford’s economic value of the VA
liability changes with market movements
driven by equity, FX and interest rates
14
Japan Tail Hedge Program Dynamically
Responds to Market Movements
Declining Markets Improving Markets
Perc
en
t o
f L
iab
ilit
y H
ed
ged
100%
0%
• Tail hedge program accelerates hedge
protection in declining markets

Copyright © 2013 by The Hartford. Confidential. All rights reserved. No part of this document may be reproduced, published or posted without the permission of The Hartford.
15
Japan Tail Hedge Has Been Effective Against Target
Change in Hedge Target Liability1 Change in Hedge Assets
Ab
so
lute
Valu
e o
f C
han
ge (
$ i
n m
illi
on
s)
Change in Value of Hedge Assets and Target Liability
$0
$500
$1,000
$1,500
$2,000
Q1 2012 Q2 2012 Q3 2012 Q4 2012 Q1 2013
1 Risks reflected in target liability include Japan tail claims from foreign currency, equities and interest rates

Copyright © 2013 by The Hartford. Confidential. All rights reserved. No part of this document may be reproduced, published or posted without the permission of The Hartford.
600
700
800
900
1000
1100
1200
1300
1400
1500
1600
1700
16
Market Developments:
Equity Markets Have Improved
SPX Index: +25%
1258
1569
Topix: +42%
1035
729

Copyright © 2013 by The Hartford. Confidential. All rights reserved. No part of this document may be reproduced, published or posted without the permission of The Hartford.
Economic
Liability
Hedge
Coverage
17
Transitioned to Full Dynamic Hedging of Equity Risk
Hedge
Coverage
Declining Markets Improving Markets
Pe
rce
nt
of
Lia
bilit
y H
ed
ge
d
100%
0%
Tail Hedge Program Full Dynamic Hedging
Declining Markets Improving Markets
Pe
rce
nt
of
Lia
bilit
y H
ed
ge
d
100%
0%

Copyright © 2013 by The Hartford. Confidential. All rights reserved. No part of this document may be reproduced, published or posted without the permission of The Hartford.
70
75
80
85
90
95
100
80
90
100
110
120
130
140
Market Developments:
Yen Has Weakened
18
USD/JPY Currency: +23%
76.9
94.2 Euro/JPY Currency: +21%
99.7
120.8

Copyright © 2013 by The Hartford. Confidential. All rights reserved. No part of this document may be reproduced, published or posted without the permission of The Hartford.
19
Transitioned to Full Dynamic Hedging of FX Risk
Economic
Liability
Hedge
Coverage Hedge
Coverage
Declining Markets Improving Markets
Pe
rce
nt
of
Lia
bilit
y H
ed
ge
d
100%
0%
Tail Hedge Program Full Dynamic Hedging
Declining Markets Improving Markets
Pe
rce
nt
of
Lia
bilit
y H
ed
ge
d
100%
0%

Copyright © 2013 by The Hartford. Confidential. All rights reserved. No part of this document may be reproduced, published or posted without the permission of The Hartford.
0
1
2
3
0
0.5
1
1.5
Market Developments:
Interest Rates At or Near Historically Low Levels
20
Japan Rates: -30bps
0.7%
1.0%
U.S. Rates: -2bps
2.0% 2.0%

Copyright © 2013 by The Hartford. Confidential. All rights reserved. No part of this document may be reproduced, published or posted without the permission of The Hartford.
21
Tail Hedge Program Remains in Place for Interest Rates
Hedge
Coverage
Declining Markets Improving Markets
Pe
rce
nt
of
Lia
bilit
y H
ed
ge
d
100%
0%
Tail Hedge Program

Copyright © 2013 by The Hartford. Confidential. All rights reserved. No part of this document may be reproduced, published or posted without the permission of The Hartford.
Risk Mitigation After Risk Mitigation Before
22
Japan Equity and FX Risks Now Effectively Eliminated
Strategically
Managed Tail Full
Equity
Foreign Exchange
Interest Rates
Residual Risk
Strategically
Managed Tail Full
Equity
Foreign Exchange
Interest Rates
Residual Risk

Copyright © 2013 by The Hartford. Confidential. All rights reserved. No part of this document may be reproduced, published or posted without the permission of The Hartford.
23
Today’s Key Takeaways
● Hedging programs have performed effectively against
selected targets
● Equities higher, Yen weaker and volatility reduced
● Effectively eliminated Japan equity and FX risks;
reduced cost and extended duration of macro program
● We will continue to strategically manage open and
residual risks
Effective Hedging
Programs
Improved Markets
Our Response
Managing
Strategically

Copyright © 2013 by The Hartford. Confidential. All rights reserved. No part of this document may be reproduced, published or posted without the permission of The Hartford.
1
Chris Swift, Executive Vice President and Chief Financial Officer
VA Metrics and Capital Margins

Copyright © 2013 by The Hartford. Confidential. All rights reserved. No part of this document may be reproduced, published or posted without the permission of The Hartford.
Agenda
VA Market Consistent Value (MCV) and cash flows
Capital margins and capital generation
First quarter 2013 actions and updates
2

Copyright © 2013 by The Hartford. Confidential. All rights reserved. No part of this document may be reproduced, published or posted without the permission of The Hartford.
Today’s Key Takeaways
3
Valuation
Capital Margin
Capital Management
Future
● MCV and cash flows show significant intrinsic value of VA blocks
● Capital margins are strong and Talcott is now capital self-sufficient
● Goals are to return excess capital to shareholders, reduce debt
leverage and improve fixed charges coverage
● The Hartford is on the right path with increased capital generation
and financial flexibility heading into 2014 and beyond

Copyright © 2013 by The Hartford. Confidential. All rights reserved. No part of this document may be reproduced, published or posted without the permission of The Hartford.
Significant 1Q13 Capital Activities
• $800 million debt tender closed in March – Reduced annual interest expense by $51 million, before
tax
• Repurchased $58 million of common shares and
warrants ($55 million shares, $3 million warrants)
through April 5, 2013
• Capital plan targets $1 billion net debt reduction in
2013-2014, inclusive of 1Q13 activity
• 2012 earnings to fixed charges coverage ratio2
improved from 4.0x to 4.8x pro forma
4
$7.1
$6.3
Dec. 31, 2012 Dec. 31, 2012 Pro Forma
4.0x
4.8x
2012 2012 Pro Forma
1 Dec. 31, 2012 pro forma for $800 million of debt purchased in March 2013 debt tender and conversion of the mandatory convertible preferred
2 Core earnings and core earnings before interest and taxes to fixed charges coverage ratio are non-GAAP financial measures. For definition and reconciliation, please see appendix.
.
Total Debt ($ in billions)
Core Earnings Before Interest and Taxes
To Fixed Charges Coverage2
1
1

Copyright © 2013 by The Hartford. Confidential. All rights reserved. No part of this document may be reproduced, published or posted without the permission of The Hartford.
Updated 2013 Outlook
• 2013 core earnings outlook updated to $1.45 billion to $1.55 billion
– Reflects $75 million increase in Talcott core earnings due to elimination of Japan VA DAC
amortization expense beginning in the second quarter of 2013
– No other changes
• 1Q13 net income results to include charges for:
– $600 million, after tax, for Japan VA DAC write-off
– $140 million, after tax, for extinguishment of debt
• 1Q13 catastrophe losses estimated at $22 million, after-tax, $35 million lower than
prior 1Q13 outlook of $57 million
• 1Q13 results will be released on April 29th
5

Copyright © 2013 by The Hartford. Confidential. All rights reserved. No part of this document may be reproduced, published or posted without the permission of The Hartford.
Agenda
VA MCV and cash flows
Capital margins and capital generation
First quarter 2013 actions and updates
6

Copyright © 2013 by The Hartford. Confidential. All rights reserved. No part of this document may be reproduced, published or posted without the permission of The Hartford.
MCV
Cash Flows
• MCV is a better metric of economic value for VA liabilities – MCV is the basis of our hedging programs
7
VA MCV and Cash Flows Show Significant Intrinsic Value
MCV Value • MCV VA liability estimated at $500 million at Mar. 31, 2013
• Cash flows of our VA block indicate significant intrinsic value

Copyright © 2013 by The Hartford. Confidential. All rights reserved. No part of this document may be reproduced, published or posted without the permission of The Hartford.
What is Market Consistent Value (MCV)?
• MCV1 is similar to FAS 133/157 fair value for
GMWB accounting but applied to all VA
guarantees, including guarantee benefit riders
and base contract fees
• MCV does not reflect the price a buyer would
pay or receive for the block
• Does not include investment income on capital
or risk premiums for cost of capital
8
What is Included in Calculation of MCV?
Average of present value of cash flows from
>5,000 stochastic scenarios
Fees, claims and expense cash flows
Current observed market price inputs for
interest rates, FX, equity markets, volatility, etc.
Reflects present value of expected cash flows based on market consistent assumptions
1. The Hartford uses Market Consistent Value (MCV) as a measure of the risk and economic value of
its run-off variable annuity block. MCV may differ from financial metrics used by other companies to
measure the risk and value of an existing variable annuity block. Accordingly, investors should be
careful when comparing MCV to similar measures used by other companies. For more information on
MCV, please see the appendix to this presentation.

Copyright © 2013 by The Hartford. Confidential. All rights reserved. No part of this document may be reproduced, published or posted without the permission of The Hartford.
MCV Is a Better Measure of Economic Value
• MCV is a better measure of economic value
than either GAAP or statutory accounting
– Fair value metric using current market inputs
– Values all VA fees, benefits and expenses
• Is used as the basis for our hedging programs
• March 31, 2013 MCV of U.S. and Japan VA
liability estimated at $500 million, before tax
9
Market Consistent
Value ($ in billions)
Mar. 2013E
Asset (Liability)
U.S. $0.7
Japan (1.2)
Total ($0.5)

Copyright © 2013 by The Hartford. Confidential. All rights reserved. No part of this document may be reproduced, published or posted without the permission of The Hartford.
Conversion of MCV to Statutory
($ in billions)
Mar. 2013E
MCV
Asset
(Liability)
A
Mar. 2013E
Statutory
Reserves2,3
B
Difference
(Before Tax)
A – B
U.S. $0.7 ($0.6) $1.3
Japan (1.2) (1.6) 0.4
Total ($0.5) ($2.2) $1.7
Conversion of MCV to GAAP
($ in billions)
Mar. 2013E
MCV
Asset
(Liability)
A
Mar. 2013E
GAAP1
Equivalent
Value
(Liability)2,
B
Difference
(Before Tax)
A – B
U.S. $0.7 $0.9 $(0.2)
Japan (1.2) (0.5) (0.7)
Total ($0.5) $0.4 ($0.9)
Comparison of MCV To GAAP and Statutory Reserves
10
Converting estimated statutory reserves
at Mar. 31, 2013 to an MCV basis implies
that statutory surplus would increase by
$1.7 billion, before tax
Converting estimated GAAP reserves,
net of DAC, at Mar. 31, 2013
to an MCV basis implies that
GAAP equity would be reduced by
$900 million, before tax
1. GAAP equivalent carrying value is FAS 157 & SOP 03-1 reserves, net DAC and reinsurance recoverable.
2. Liabilities are negative; assets are positive.
3. Statutory reserves are preliminary and include $800 million in HLIKK contingency reserves

Copyright © 2013 by The Hartford. Confidential. All rights reserved. No part of this document may be reproduced, published or posted without the permission of The Hartford.
Three Scenarios Used for Cash Flow and
Capital Margin Projections
11
Dec. 31, 2013 Market Level By Scenario
Market Factor Base
Scenario
Favorable
Scenario
Stress
Scenario
March 31, 2013
Actual
S&P 500 1553 1650 900 1569
10 Year Treasury 1.99% 2.26% 1.25% 1.85%
Yen/$ 91.7 100.0 70.0 94.2
10 Year JGB1 0.75% 0.93% 0.60% 0.55%
Detailed assumptions for base, favorable and stress scenarios are provided in appendix
1. Japanese Government Bond (JGB)

Copyright © 2013 by The Hartford. Confidential. All rights reserved. No part of this document may be reproduced, published or posted without the permission of The Hartford.
Net Present Value of Cash Flows Include VA Fees, Claims,
Expenses and Hedge Gains (Losses)
12
What is Included in Cash Flows?
Present Value (PV) of cash flows for one scenario with explicit assumptions for: • Interest rates
• Equity returns
• FX
• Volatility
• Dynamic policyholder behavior
Base contract fees and all rider fees, claims, and expenses
Liability cash flows only; no investment income on capital backing block
Modeled hedge gains and losses
Discounted at swap rates

Copyright © 2013 by The Hartford. Confidential. All rights reserved. No part of this document may be reproduced, published or posted without the permission of The Hartford.
Base Scenario ($ in billions, Jan. 31, 2013)
Cas
h F
low
s
Cumulative Cash Flow Summary ($ in billions) U.S. Japan Total
PV of fees and expenses $4.4 $2.8 $7.1
PV of claims (0.8) (1.3) (2.0)
PV of net cumulative cash flows, before tax $3.6 $1.5 $5.1
PV of hedge gains (losses) (1.6) (2.0) (3.6)
PV of cumulative cash flow, before tax $2.0 $(0.5) $1.5
Base Scenario VA Cash Flows Are Positive
$1.5 Billion, Net of Hedges
13
• PV of cumulative cash flows from
U.S. and Japan blocks total $1.5
billion, before tax
• U.S. VA cash flows are positive,
with fees exceeding claims,
expenses and hedge losses by
$2.0 billion
• Japan cash flows are negative
$0.5 billion, including hedge
losses
-0.5
-0.3
-0.1
0.1
0.3
0.5
0.7
0.9
1.1
1.3
1.5
1 2 3 4 5 6 7 8 9 10 11 12 13 14 15 16 17 18 19 20
Fees & Exp. Claims

Copyright © 2013 by The Hartford. Confidential. All rights reserved. No part of this document may be reproduced, published or posted without the permission of The Hartford.
Positive Total Net Cash Flows in Favorable and Stress Scenarios
14
($ in billions)
U.S. Japan Total
Favorable Stress Favorable Stress Favorable Stress
PV of fees and expenses $4.6 $3.3 $3.0 $1.9 $7.6 $5.2
PV of claims (0.7) (3.3) (0.6) (7.0) (1.2) (10.3)
PV of net cumulative cash flows,
before tax1 $4.0 $(0.0) $2.4 $(5.1) $6.3 $(5.1)
PV of hedge gains (losses) (1.7) 0.6 (2.4) 5.1 (4.1) 5.7
PV of Cumulative cash
flow, before tax1 $2.3 $0.6 $0.0 $0.0 $2.3 $0.6
Cumulative net PV of VA cash flows are $0.6 billion positive in the stress scenario and $2.3
billion positive in the favorable scenario
1. Totals may not add up due to rounding

Copyright © 2013 by The Hartford. Confidential. All rights reserved. No part of this document may be reproduced, published or posted without the permission of The Hartford.
MCV
Cash Flows
• MCV is a better metric of economic value for VA liabilities – MCV is the basis of our hedging programs
15
VA MCV and Cash Flows Show Significant Intrinsic Value
MCV Value • MCV VA liability estimated at $500 million at Mar. 31, 2013
• Cash flows of our VA block indicate significant intrinsic value

Copyright © 2013 by The Hartford. Confidential. All rights reserved. No part of this document may be reproduced, published or posted without the permission of The Hartford.
Agenda
VA MCV and cash flows
Capital margins and capital generation
First quarter 2013 actions and updates
16

Copyright © 2013 by The Hartford. Confidential. All rights reserved. No part of this document may be reproduced, published or posted without the permission of The Hartford.
Principles
Goals
Capital Management Goals: Return Excess Capital to Shareholders and
Reduce Debt Leverage, Improve Fixed Charges Coverage
17
• Executing announced capital management plan
• Develop next phase of capital management plan Short term:
Future:
• Return excess capital to shareholders
• Reduce debt leverage to low 20s%; improve earnings1
to fixed charges coverage to 5x to 6x
• Capital sufficient to support and grow businesses and maintain
current ratings
• Talcott to remain capital self-sufficient
• Holding company resources support interest, dividends and capital
management
1. Core earnings before interest and taxes. See appendix for calculation.

Copyright © 2013 by The Hartford. Confidential. All rights reserved. No part of this document may be reproduced, published or posted without the permission of The Hartford.
Beginning 2013 with Strong Capital Margin
• 2012 pro forma capital margin1 of $4.9 billion – Before capital management plan announced in Feb.
2013
• Pro forma risk-based capital (RBC) ratios remain
strong
– Hartford Life & Accident consolidated RBC ratio
remains strong, in excess of 400%
– White River Re RBC in excess of 150%
• P&C capital margin remains strong, despite the
impact of 2012 catastrophe losses and low
interest rates
18
$2.5B
$4.9B
2012 Actual 2012 Pro Forma 2
Capital Margin1 In Base Scenario ($ in billions)
1 Capital margin measured against an enterprise aggregate minimum to reflect U.S. Life Company Action Level RBC of 325%, White River Re Company Action Level RBC of 125%, and P&C capital
consistent with “AA” FSR. 2 2012 pro forma for sales of Individual Life and Retirement Plans and before impact of announced capital management plan.

Copyright © 2013 by The Hartford. Confidential. All rights reserved. No part of this document may be reproduced, published or posted without the permission of The Hartford.
~60% of Statutory Capital Allocated to Go Forward Businesses;
~40% Allocated to Talcott
The Hartford (NYSE:HIG)
Hartford Fire
Hartford Holdings
Mutual Funds
Hartford Life Inc.
Hartford Life & Accident
Hartford Life Ins. Co.
Hartford Life & Annuity
HLIKK (Japan)
White River Re
Talcott
Go Forward
$7.7
$1.5
$2.2
$1.4
$2.6
P&C
Group Benefits
International VA
U.S VA
Talcott Non-VA
2
3
$15.4 billion Total U.S. & Japan
Statutory Capital
Holding Co.
1 Pro forma for the impact of the sales of the Individual Life and Retirement Plans businesses closed in Jan. 2013 and after the $1.5
billion dividend to the holding company
2 Includes $1.1 billion in HLIKK and $0.7 billion in Hartford Life Limited.
3 Includes approximately $450 million of statutory capital related to reinsurance recoverables from sale of Individual Life and
Retirement Plans.
Statutory Capital Allocation
as of Dec. 31, 2012, Pro Forma1
($ in billions)
Graphic is a simplified
version of The Hartford’s
organizational structure
for illustrative purposes.
19

Copyright © 2013 by The Hartford. Confidential. All rights reserved. No part of this document may be reproduced, published or posted without the permission of The Hartford.
2013 Capital Margin Scenarios Compared to 2011
• Business sales and changes – Individual Life and Retirement Plans sold
– U.S. VA in runoff
– Smaller VA block
– Expanded VA hedging
• Market levels – Improved for FX and equities
– Interest rates lower
• Assumption changes: – U.S. equity return, including dividends, reduced
from 9% to 6%
– Japan equity return reduced from 8% to 6%
– S&P 500 shocked to 900 in 2013 stress
scenario; was 800 in 2011
20
Key Market
Assumptions
2011
Base
Scenario At Dec. 31, 2011
2013
Base
Scenario At Dec. 31, 2013
S&P 500 1240 1553
10 Yr. Treasury 2.30% 1.99%
Yen/$ 76.7 91.7
10 Year JGB 1.07% 0.75%

Copyright © 2013 by The Hartford. Confidential. All rights reserved. No part of this document may be reproduced, published or posted without the permission of The Hartford.
Talcott operations in aggregate are capital self-sufficient
Base
Scenario (S&P 1553)
Favorable
Scenario (S&P 1650)
Stress
Scenario (S&P 900)
December 2014 $5.5 $6.1 $2.2
Capital Margins Strong In Base, Favorable and Stress Scenarios
21
1 Capital margins measured against an enterprise aggregate minimum to reflect U.S. Life Company Action Level RBC of 325%, White River Re Company Action Level RBC of 125%,
and P&C capital consistent with “AA” FSR
Capital margins in 2014 are net of Feb. 2013 announced capital management plan
Projected Capital Margins1 from Scenarios
($ in billions)
Copyright © 2013 by The Hartford. Confidential. All rights reserved. No part of this document may be reproduced, published or posted without the permission of The Hartford.
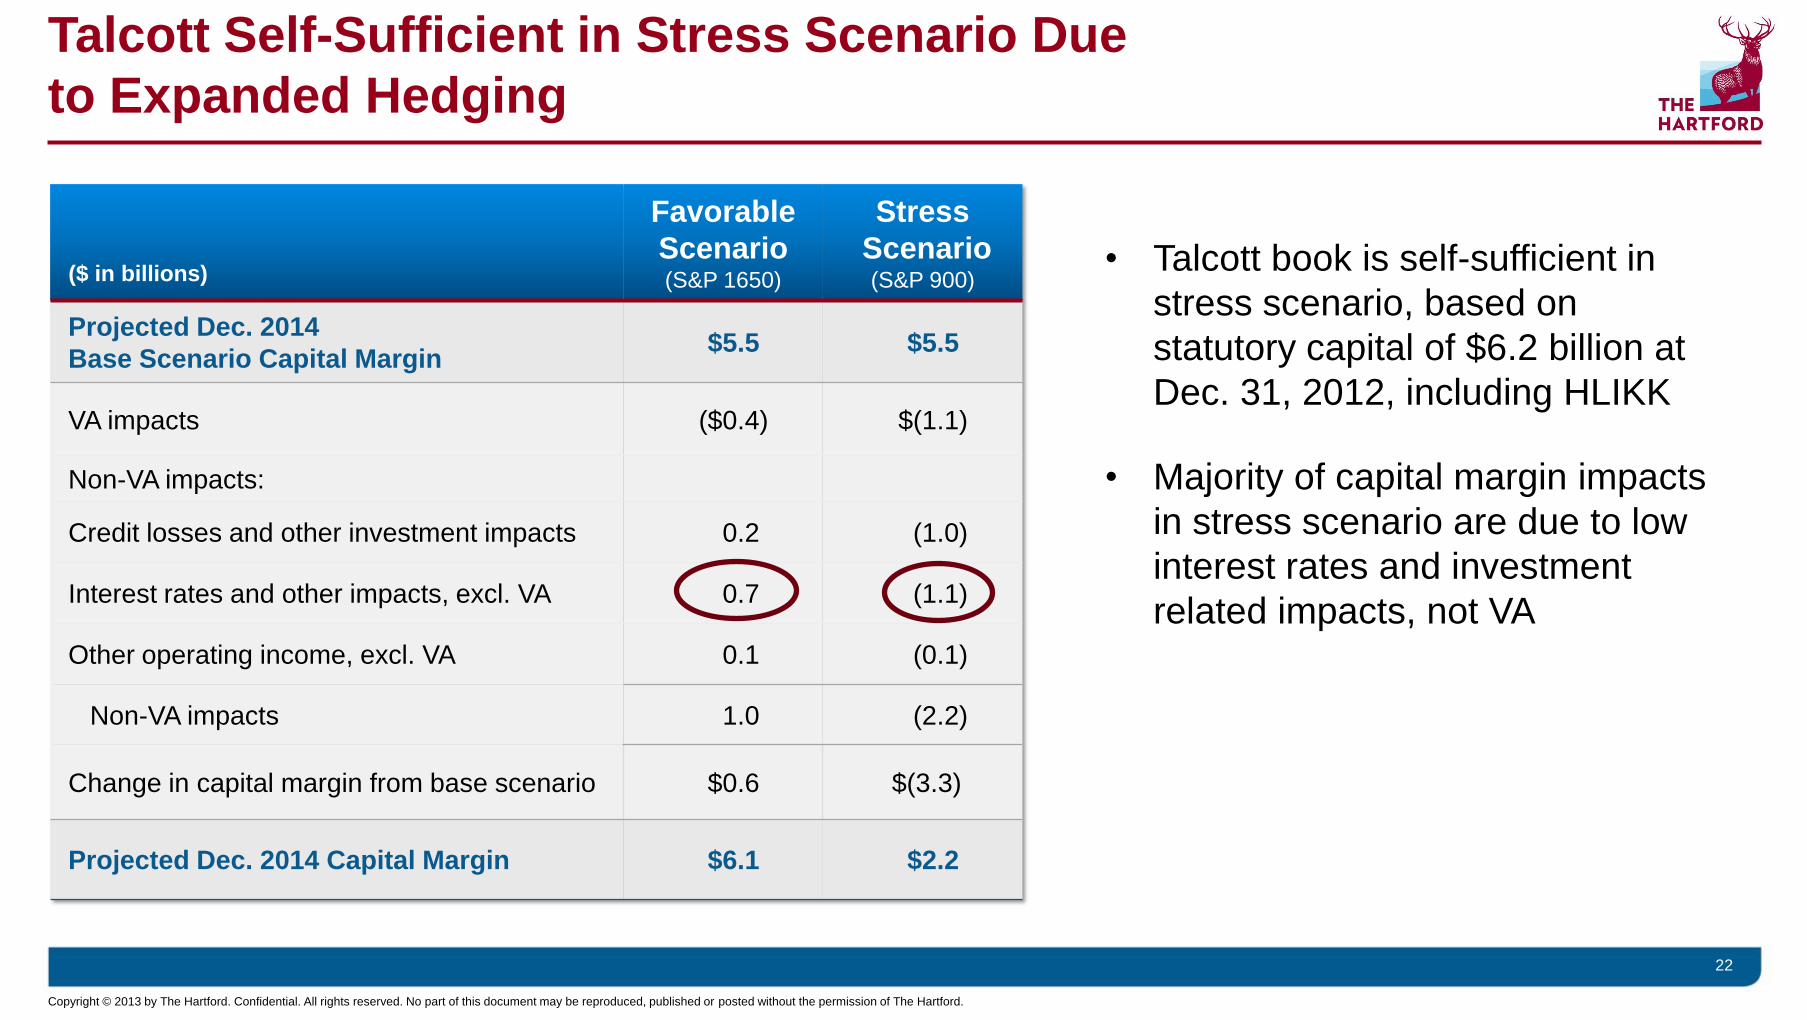
($ in billions)
Favorable
Scenario (S&P 1650)
Stress
Scenario (S&P 900)
Projected Dec. 2014
Base Scenario Capital Margin $5.5 $5.5
VA impacts ($0.4) $(1.1)
Non-VA impacts:
Credit losses and other investment impacts 0.2 (1.0)
Interest rates and other impacts, excl. VA 0.7 (1.1)
Other operating income, excl. VA 0.1 (0.1)
Non-VA impacts 1.0 (2.2)
Change in capital margin from base scenario $0.6 $(3.3)
Projected Dec. 2014 Capital Margin $6.1 $2.2
Talcott Self-Sufficient in Stress Scenario Due
to Expanded Hedging
22
• Talcott book is self-sufficient in
stress scenario, based on
statutory capital of $6.2 billion at
Dec. 31, 2012, including HLIKK
• Majority of capital margin impacts
in stress scenario are due to low
interest rates and investment
related impacts, not VA

Copyright © 2013 by The Hartford. Confidential. All rights reserved. No part of this document may be reproduced, published or posted without the permission of The Hartford.
Talcott Capital
Self-Sufficient
Improved
Capital
Generation
Capital
Management
Improved Capital Generation Expected in 2014 and Beyond
• Talcott now capital self-sufficient
– Declining in-the-moneyness of the VA block and reduction in size of block will
reduce required capital over time
23
• Heading into 2014, capital flexibility provides opportunities for
additional actions
• Expect improved statutory capital generation from
go forward businesses
‒ Improved margins and profitable growth increase future capital generation

Copyright © 2013 by The Hartford. Confidential. All rights reserved. No part of this document may be reproduced, published or posted without the permission of The Hartford.
24
Conclusion
Copyright © 2013 by The Hartford. Confidential. All rights reserved. No part of this document may be reproduced, published or posted without the permission of The Hartford.
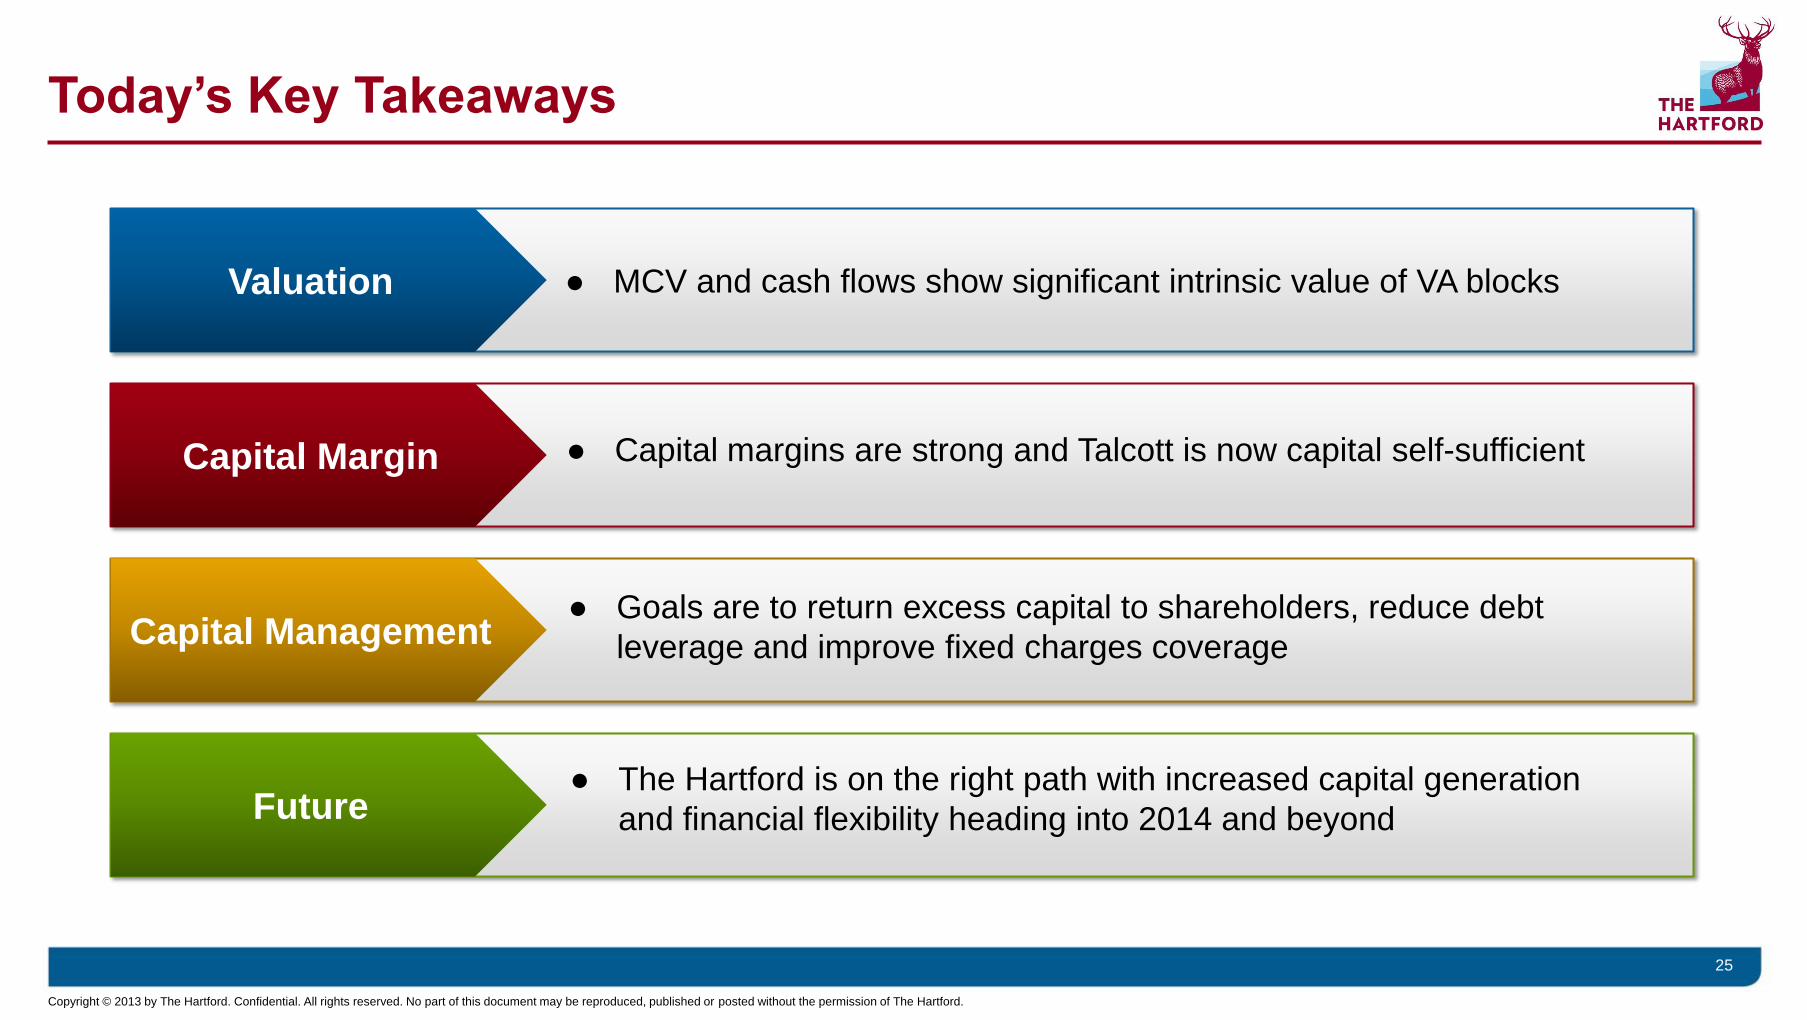
Today’s Key Takeaways
25
Valuation
Capital Margin
Capital Management
Future
● MCV and cash flows show significant intrinsic value of VA blocks
● Capital margins are strong and Talcott is now capital self-sufficient
● Goals are to return excess capital to shareholders, reduce debt
leverage and improve fixed charges coverage
● The Hartford is on the right path with increased capital generation
and financial flexibility heading into 2014 and beyond

Copyright © 2013 by The Hartford. Confidential. All rights reserved. No part of this document may be reproduced, published or posted without the permission of The Hartford.
26
Question & Answer Period

Copyright © 2013 by The Hartford. Confidential. All rights reserved. No part of this document may be reproduced, published or posted without the permission of The Hartford.
Appendix

Copyright © 2013 by The Hartford. Confidential. All rights reserved. No part of this document may be reproduced, published or posted without the permission of The Hartford.
Variable Annuity – Key Definitions
• Guaranteed Minimum Income Benefits (GMIB) – potential benefits associated with contract guarantee that establishes a
minimum income amount, based on return of principal, which is in excess of account value
• Guaranteed Minimum Withdrawal Benefits (GMWB) – potential benefits associated with contract guarantee that establishes a
minimum periodic withdrawal amount that would continue beyond the point where account value is reduced to zero
• Guaranteed Minimum Death Benefits (GMDB) – value of benefit provided to beneficiary(ies) in excess of account value upon
death of the contract’s covered life/lives
• In the Money (ITM) – when a contract has an account value that is less than its guaranteed value, at a point in time
• Out of the Money (OTM) – when a contract has an account value that is greater than its guaranteed value, at a point in time
• Contracts ITM – Average Moneyness – for all contracts that are in the money, percentage by which the average contract is in the
money
• Average Moneyness of Total Block – weighted average differential between guaranteed value and account value for all contracts
• Retained Net Amount at Risk (NAR) – the difference between the guarantee and the account value for all in-the-money accounts
at a point in time, net of reinsurance, but excluding hedging impacts
1

Copyright © 2013 by The Hartford. Confidential. All rights reserved. No part of this document may be reproduced, published or posted without the permission of The Hartford.
Market Scenarios Used in Cash Flow Examples
Base Favorable Stress
Interest Rate • Held flat for 2 years
• Follows forward rates
thereafter
• Follows Forward rates • 0 – 80bps decrease across term structure
in 2013
• Flat in 2014
• Follows forwards thereafter
FX • Flat
• USD/JPY 91.7
• EUR/JPY 124.5
• Yen weakens to 100 in 2013
• USD/JPY 100.0 at YE 2013
• EUR/JPY 135.8 at YE 2013
• Flat thereafter
• Yen strengthens to 70 in 2013
• USD/JPY 70.0 at YE 2013
• EUR/JPY 95.1 at YE 2013
• Flat thereafter
Equity • 4% index growth plus 1.8%
dividend yield in all years
• S&P 1553 at YE 2013
• Nikkei 11547 at YE 2013
• Equities increase 10% in 2013
• S&P 1650 at YE 2013
• Nikkei 12268 at YE 2013
• 4% index growth plus 1.8%
dividend yield thereafter
• All indices decline 40% in 2013
• S&P 900 at YE 2013
• Nikkei 6692 at YE 2013
• 4% index growth thereafter plus 1.8%
dividend yield thereafter
Investment
Related Impact,
Before Tax
• $(200) million in 2013 and
2014
• $0 million in 2013 and 2014 • $(1,200) million in 2013 and 2014
2
Note: Market indices were established based on January 31, 2013 market levels

Copyright © 2013 by The Hartford. Confidential. All rights reserved. No part of this document may be reproduced, published or posted without the permission of The Hartford.
Favorable Market Scenario ($ in billions, 1/31/2013)
Ca
sh
Flo
ws
Cu
mu
lati
ve
Cas
h F
low
s
Cash Flow Summary U.S. Japan Total
PV fees and expenses $4.6 $3.0 $7.6
PV of claims (0.7) (0.6) (1.2)
PV of net liabilities 4.0 2.4 6.3
PV of hedge (losses) (1.7) (2.4) (4.1)
PV of cumulative
cash flows $2.3 $0.0 $2.3
PV of Cash Flows is $2.3 Billion In Favorable Scenario
-0.5
-0.3
-0.1
0.1
0.3
0.5
0.7
0.9
1.1
1.3
1.5
1 2 3 4 5 6 7 8 9 10 11 12 13 14 15 16 17 18 19 20
Fees & Exp. Claims
• In favorable market scenario, cash flows are
higher than base case by $0.8 billion, as
increased fees and lower expenses are offset
by higher hedge losses
• In this scenario, Japan VA cash flows are
breakeven
3

Copyright © 2013 by The Hartford. Confidential. All rights reserved. No part of this document may be reproduced, published or posted without the permission of The Hartford.
Cas
h F
low
s
PV of Cash Flows is $0.6 Billion in Stress Scenario
-1.5
-1.0
-0.5
0.0
0.5
1.0
1.5
1 2 3 4 5 6 7 8 9 10 11 12 13 14 15 16 17 18
Fees & Exp. Claims
Cash Flow Summary U.S. Japan Total
PV of fees & expenses 3.3 1.9 5.2
PV claims (3.3) (7.0) (10.3)
PV net liabilities (0.0) (5.1) (5.1)
PV of hedge gains 0.6 5.1 5.7
PV of cumulative
cash flows $0.6 $0.0 $0.6
• In adverse scenario, cash flows are a positive
$0.6 billion
• U.S. is $0.6 billion but Japan is breakeven
• Hedge gains total $5.7 billion, more than
offsetting negative cash flows from contracts
Adverse Market Scenario ($ in billions, 1/31/2013)
4

Copyright © 2013 by The Hartford. Confidential. All rights reserved. No part of this document may be reproduced, published or posted without the permission of The Hartford.
Expanded Japan Hedge Increases GAAP Volatility Due to
Asymmetric Accounting
• GAAP Impact – Impact on derivative sensitivity disclosures
Equity Market Returns -20% -10% +10%
Potential Net Fair Value
Impact $ 509 $247 ($248)
Yen Strengthens +/
Weakens - +20% +10% -10%
Potential Net Fair Value
Impact $1,131 $353 ($242)
As of 12/31/12 (Pre-tax/DAC )(1) As of 4/8/13 (Pre-tax/DAC )(2)
(1) These sensitivities are based on the following key market levels as of December 31, 2012: 1) S&P of 1,426 and FX rates of USDJPY @86.75 and EURJPY @114.46.
(2) These sensitivities are based on the following key market levels as of April 8, 2013: 1) S&P of 1,563 and FX rates of USDJPY @99.36 and EURJPY @129.26
Equity Market Returns -20% -10% +10%
Potential Net Fair Value
Impact $ 904 $456 ($489)
Yen Strengthens +/
Weakens - +20% +10% -10%
Potential Net Fair Value
Impact $1,415 $533 ($437)
5

Copyright © 2013 by The Hartford. Confidential. All rights reserved. No part of this document may be reproduced, published or posted without the permission of The Hartford.
Non-VA Profile
Non-VA Account Value
$68.5 Billion as of Mar. 31, 2013
*Total Account Value = Separate Account + General Account
PPLI
55%
Institutional
24%
Japan Fixed
5%
U.S. Fixed
16%
PPLI
Account Value: $37.8 billion
Variable COLI and High Net Worth
Mortality exposure, mitigated by reinsurance and experience
rating
Institutional
Includes Structured Settlements, Terminal Funding,
Guaranteed Investment Products (GIPs), Consumer Notes and
The Hartford Pension Plan
Institutional Account Value: $16.4 billion
Covered Lives (in thousands) 180
Average Contract Term Duration (Years):10.9
U.S. Fixed
Fixed Annuity Account Value: $10.8 billion
Covered Lives (in thousands): 183
Average Contract Term Duration(Years):3.0
Japan Fixed
Fixed Annuity Account Value: $3.5 billion
Covered Lives (in thousands): 26
Average Contract Term Duration(Years):3.5
6

Copyright © 2013 by The Hartford. Confidential. All rights reserved. No part of this document may be reproduced, published or posted without the permission of The Hartford.
Non-GAAP and Other Financial Measures

Copyright © 2013 by The Hartford. Confidential. All rights reserved. No part of this document may be reproduced, published or posted without the permission of The Hartford.
Guidelines for Creating Presentations
Discussion of Non-GAAP and Other Financial Measures DISCUSSION OF NON-GAAP AND OTHER FINANCIAL MEASURES
The Hartford uses non-GAAP and other financial measures in this presentation to assist investors in analyzing the company's operating performance and financial condition for the periods presented herein.
Because The Hartford's calculation of these measures may differ from similar measures used by other companies, investors should be careful when comparing The Hartford's non-GAAP and other financial
measures to those of other companies. Definitions of the non-GAAP and other financial measures used in this presentation, and reconciliations of such non-GAAP financial measures to the most directly
comparable GAAP financial measure, can be found below. Definitions and calculations of financial measures used in this presentation can be found in The Hartford’s Investor Financial Supplement for the
fourth quarter of 2012, which is available on The Hartford’s website, http://ir.thehartford.com.
Core Earnings: The Hartford uses the non-GAAP financial measure core earnings as an important measure of the Company's operating performance. We believe that the measure core earnings provides
investors with a valuable measure of the performance of the Company's ongoing businesses because it reveals trends in our insurance and financial services businesses that may be obscured by including
the net effect of certain realized capital gains and losses, discontinued operations, loss on extinguishment of debt, gains and losses from disposal of businesses, certain restructuring charges and the impact
of Unlocks to deferred policy acquisition costs (“DAC”), sales inducement assets ("SIA"), unearned revenue reserve ("URR") and death and other insurance benefit reserve balances. Some realized capital
gains and losses are primarily driven by investment decisions and external economic developments, the nature and timing of which are unrelated to the insurance and underwriting aspects of our business.
Accordingly, core earnings excludes the effect of all realized gains and losses (after tax and the effects of DAC) that tend to be highly variable from period to period based on capital market conditions. The
Hartford believes, however, that some realized capital gains and losses are integrally related to our insurance operations, so core earnings includes net realized gains and losses such as net periodic
settlements on credit derivatives and net periodic settlements on the Japan fixed annuity cross-currency swap. These net realized gains and losses are directly related to an offsetting item included in the
income statement such as net investment income. Net income is the most directly comparable GAAP measure. Core earnings should not be considered as a substitute for net income and does not reflect the
overall profitability of the Company's business. Therefore, The Hartford believes that it is useful for investors to evaluate both net income and core earnings when reviewing the company's performance. A
reconciliation of core earnings to net income for the year ended December 31, 2012 can be found below. The 2013 earnings guidance presented in this release is based on core earnings (loss). A quantitative
reconciliation of The Hartford’s net income (loss) to core earnings (loss) is not calculable on a forward-looking basis because it is not possible to provide a reliable forecast of realized capital gains and losses,
which typically vary substantially from period to period.
($ in millions) 2012
Consolidated core earnings $1,403
Add:
Unlock impact on net income (loss) 31
Restructuring and other costs, after tax (129)
Income (loss) from discontinued operations (5)
Loss on extinguishment of debt, after tax (587)
Reinsurance loss on disposition, after tax (388)
Net realized capital gains (losses),
after tax and DAC, excluded from core earnings (363)
Net income (loss) ($38)
1
Copyright © 2013 by The Hartford. Confidential. All rights reserved. No part of this document may be reproduced, published or posted without the permission of The Hartford.
Guidelines for Creating Presentations
Discussion of Non-GAAP and Other Financial Measures
Core Earnings ROE. ROE (core earnings last twelve months to common equity, excluding AOCI) (“Core ROE”), is calculated based on non-GAAP financial measures. Core ROE is calculated
by dividing (a) core earnings for the prior four fiscal quarters by (b) average common stockholders' equity, excluding AOCI. When calculating Core ROE for the 2011 and 2012 periods, the
Mandatory Convertible preferred stock (“MCP”) is included in average common stockholders' equity and MCP dividends are added back to net income (loss) available to common shareholders
and core earnings (losses) available to common shareholders. The Company provides to investors return-on-equity measures based on its non-GAAP core earnings financial measures for the
reasons set forth in the core earnings discussion above. The Company excludes AOCI in the calculation of these return-on-equity measures to provide investors with a measure of how effectively
the Company is investing the portion of the Company's net worth that is primarily attributable to the Company's business operations. ROE (net income last twelve months to common equity,
including AOCI) (“Net Income ROE”) is the most directly comparable GAAP measure. A reconciliation of 2012 Core ROE to Net Income ROE is below. This presentation includes Core ROE
outlooks. A quantitative reconciliation of The Hartford’s Net Income ROE to Core ROE is not calculable on a forward-looking basis because it is not possible to provide a reliable forecast of
realized capital gains and losses, which typically vary substantially from period to period.
OTHER FINANCIAL MEASURES
Reconciliations for prior year periods can be found in year-end Investor Financial Supplements which are available on the Investor Relations section of The Hartford's website at
http://ir.thehartford.com.
Market Consistent Value. The Hartford uses Market Consistent Value (MCV) as a measure of the risk and economic value of its run-off variable annuity block. [MCV is calculated through
deriving a simple average of the present value of fee, claim and expense cash flows under 5,000 stochastic scenarios based on current observed market inputs for such items as interest rates,
currency exchange rates, equity market performance and volatility, as well as assumptions regarding policyholder behavior. We believe MCV is a useful metric for investors because it provides a
fair value measure of all VA liabilities, including all guaranteed benefit riders and base contract fees, in a manner that is similar to the GAAP valuation accounting methodology applied to the
Guaranteed Minimum Withdrawal Benefit rider. Neither GAAP nor statutory accounting principles provide for such a valuation across all VA liabilities.] MCV may differ from financial metrics
used by other companies to measure the risk and value of an existing block of variable annuities. Accordingly, investors should be careful when comparing MCV to similar measures used by
other companies. MCV is a metric derived from cash flow testing procedures and does not have a comparable GAAP financial measure.
2012
Core Earnings $1,403
Shareholders' equity $22,477
less: Accumulated other comprehensive income 2,843
Shareholders' equity, ex-accumulated other comprehensive income $19,634
Average shareholders' equity, ex-accumulated other comprehensive income $19,935
Core earnings return on equity 7.0%
2012
Net income (loss) ($38)
Shareholder's equity $22,447
Average shareholders' equity $21,966
Net earnings ROE (0.2)%
Net Earnings Return on Equity Core Earnings Return on Equity, ex Accumulated Other Comprehensive Income
2

Copyright © 2013 by The Hartford. Confidential. All rights reserved. No part of this document may be reproduced, published or posted without the permission of The Hartford.
Pro Forma Rating Agency Adjusted Debt to Total Capitalization
1. Pro forma for the first quarter 2013 debt tender, conversion of mandatorily convertible preferred shares, write-down of DAC associated with the Japan
business, and the disposition of the Retirement Plans and Individual Life businesses
2012 Actual
2012 Pro
Forma1
Change to 2012
Actual
Senior debt $6,026 $5,226 ($800)
Hybrids 1,100 1,100 0
MCP 556 0 (556)
Moody's pension adjustment 1,117 1,117 0
Moody's lease adjustment 628 628 0
Equity credit hybrid (275) (275) 0
Equity credit MCP (556) 0 556
Moody's adjusted leverage with equity credit $8,596 $7,796 ($800)
Common equity $19,048 $18,842 ($206)
Accumulated other comprehensive income 2,843 2,092 (751)
Moody's adjusted capitalization $31,318 $29,005 ($2,313)
Moody's leverage ratio 27.4% 26.9% -0.6%
3

Copyright © 2013 by The Hartford. Confidential. All rights reserved. No part of this document may be reproduced, published or posted without the permission of The Hartford.
Pro Forma Earnings to Fixed Charges
1. Pro forma for the first quarter 2013 debt tender and conversion of preferred shares. Reflects annualized interest savings for tender only. Does not include interest expense on any
potential new debt or interest savings on $520mn debt maturities in 2013-2014.
4
2012 Actual 2012 Pro Forma
Core earnings after tax $1,403 $1,436
Add taxes 271 289
Add interest expense (pre-tax) 457 407
Add interest on rentals 41 41
Pre-tax earnings excluding fixed charges $2,172 $2,172
Fixed charges
Interest expense $457 $407
MCP dividend 42 0
Interest on rentals 41 41
Total fixed charges $540 $448
Earnings to fixed charges 4.0x 4.8x

Copyright © 2013 by The Hartford. Confidential. All rights reserved. No part of this document may be reproduced, published or posted without the permission of The Hartford.
Guidelines for Creating Presentations
Investor Relations
Sabra Purtill Sean Rourke
Senior Vice President Assistant Vice President
Investor Relations Investor Relations
Telephone: 860.547.8691 Telephone: 860.547.5688
[email protected] [email protected]
5


![Complexity Theory & Political Change: Talcott Parsons ... · Talcott Parsons’ [15-16] “action system” is a theoretical framework for modeling societal phenomena. While the model](https://img.pdfslide.us/doc/110x75/5e94769bbc08e024c8166781/complexity-theory-political-change-talcott-parsons-talcott-parsonsa.jpg)