Embed Size (px)
Citation preview
The Hand Clap as an Impulse Source forMeasuring Room Acoustics
Prem Seetharaman, Stephen P. Tarzia
Northwestern University
April 11, 2012
1 / 27
Why?
The Upshot
Claps are easy to produce.Reliable acoustic measurements from claps allows amateurs todiagnose acoustic problems quickly and easily.
2 / 27
Background
Room acousticsThere are three qualities which determine a room’s sound.
1. Space
2. Warmth
3. Clarity
3 / 27
Background
Room acousticsThere are three qualities which determine a room’s sound.
1. Space - Reverberation time
2. Warmth - Frequency response
3. Clarity - Frequency decay
4 / 27
Background
Impulse response
Definition: how a room reacts to a short, loud sound.
Ideal impulse response
1. Very short
2. Covers a wide frequency range
3. Consistent
5 / 27
Background
Good impulse sources
1. Balloon pops
2. Starter pistol shots
3. Firecrackers, etc.
6 / 27
Motivation
An amateur acoustician’s ideal workflow
1. Clap a few times in a room.
2. Have a program quickly respond with analysis.
3. Diagnose and improve room based on analysis.
7 / 27
Motivation
An amateur acoustician’s current workflow
1. Hire a professional acoustician.
8 / 27
Hand Claps
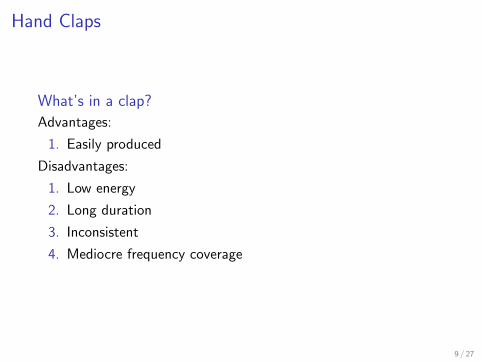
What’s in a clap?
Advantages:
1. Easily produced
Disadvantages:
1. Low energy
2. Long duration
3. Inconsistent
4. Mediocre frequency coverage
9 / 27
Approach
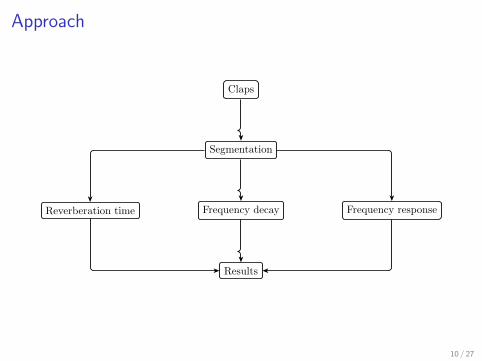
Claps
Segmentation
Reverberation time Frequency decay Frequency response
Results
10 / 27
Setup
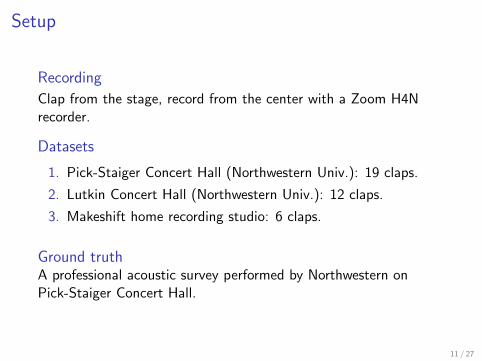
Recording
Clap from the stage, record from the center with a Zoom H4Nrecorder.
Datasets
1. Pick-Staiger Concert Hall (Northwestern Univ.): 19 claps.
2. Lutkin Concert Hall (Northwestern Univ.): 12 claps.
3. Makeshift home recording studio: 6 claps.
Ground truthA professional acoustic survey performed by Northwestern onPick-Staiger Concert Hall.
11 / 27
Segment claps
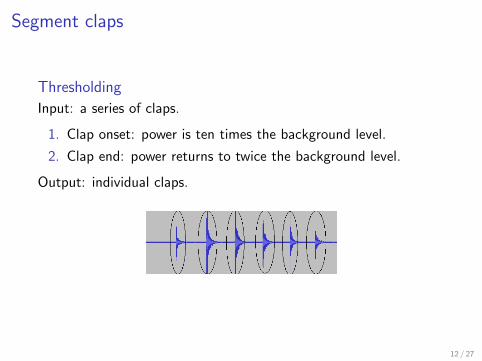
Thresholding
Input: a series of claps.
1. Clap onset: power is ten times the background level.
2. Clap end: power returns to twice the background level.
Output: individual claps.
12 / 27
Reverberation time
DefinitionRT60: time required for a sound level to decay by 60 dB.Problem: 60 dB above background level = jet engine − a dial tone.Solution: Extrapolate the rest via a line-fitting approximation.
13 / 27
Reverberation time
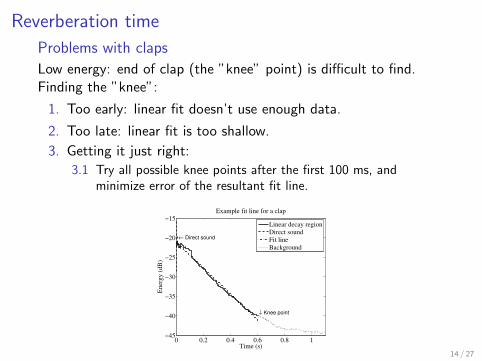
Problems with claps
Low energy: end of clap (the ”knee” point) is difficult to find.Finding the ”knee”:
1. Too early: linear fit doesn’t use enough data.
2. Too late: linear fit is too shallow.
3. Getting it just right:
3.1 Try all possible knee points after the first 100 ms, andminimize error of the resultant fit line.
0 0.2 0.4 0.6 0.8 1−45
−40
−35
−30
−25
−20
−15
Time (s)
Ener
gy (
dB
)
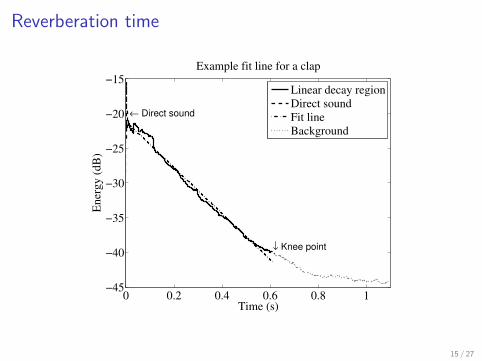
Example fit line for a clap
← Direct sound
↓ Knee point
Linear decay region
Direct sound
Fit line
Background
14 / 27
Reverberation time
0 0.2 0.4 0.6 0.8 1−45
−40
−35
−30
−25
−20
−15
Time (s)
Ener
gy (
dB
)
Example fit line for a clap
← Direct sound
↓ Knee point
Linear decay region
Direct sound
Fit line
Background
15 / 27
Reverberation time
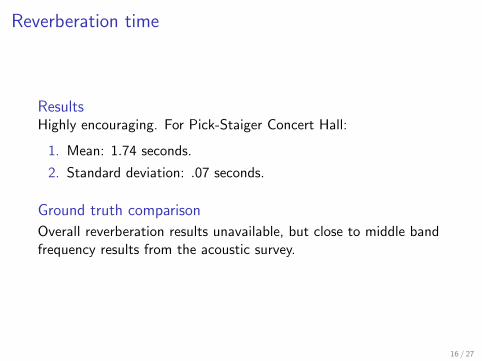
ResultsHighly encouraging. For Pick-Staiger Concert Hall:
1. Mean: 1.74 seconds.
2. Standard deviation: .07 seconds.
Ground truth comparison
Overall reverberation results unavailable, but close to middle bandfrequency results from the acoustic survey.
16 / 27
Frequency decay
DefinitionRT60 of a particular frequency.Process:
1. Split recording up into frequencies using a spectrogrammethod.
2. Pass each signal to our RT60 method.
17 / 27
Frequency decay
Problems with claps
Lacks low freqency information.Balloons also lack low frequencies, but claps provide about anoctave less than balloons do.
18 / 27
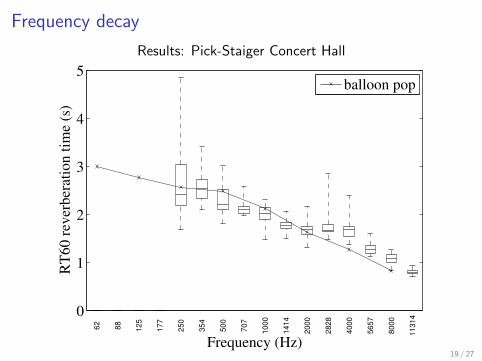
Frequency decay
Results: Pick-Staiger Concert Hall
0
1
2
3
4
5
6
2
8
8
1
25
1
77
2
50
3
54
5
00
7
07
10
00
14
14
20
00
28
28
40
00
56
57
80
00
11
31
4
Frequency (Hz)
RT
60 r
ever
ber
atio
n t
ime
(s)
balloon pop
19 / 27
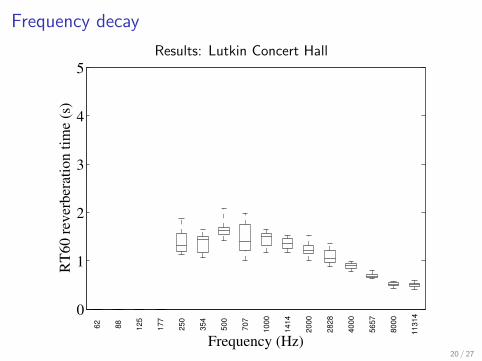
Frequency decay
Results: Lutkin Concert Hall
0
1
2
3
4
5
6
2
8
8
1
25
1
77
2
50
3
54
5
00
7
07
10
00
14
14
20
00
28
28
40
00
56
57
80
00
11
31
4
Frequency (Hz)
RT
60
rev
erb
erat
ion
tim
e (s
)
20 / 27
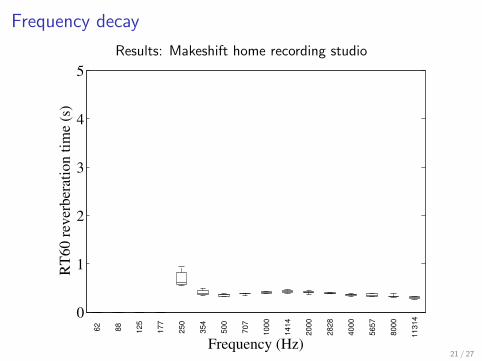
Frequency decay
Results: Makeshift home recording studio
0
1
2
3
4
5
6
2
8
8
1
25
1
77
2
50
3
54
5
00
7
07
10
00
14
14
20
00
28
28
40
00
56
57
80
00
11
31
4
Frequency (Hz)
RT
60
rev
erb
erat
ion
tim
e (s
)
21 / 27
Frequency response
DefinitionRatio of reverberant and direct sound spectra.Process:
1. Split signal up into frequency bins
2. Divide reverberant sound spectrum by direct sound spectrum.
22 / 27
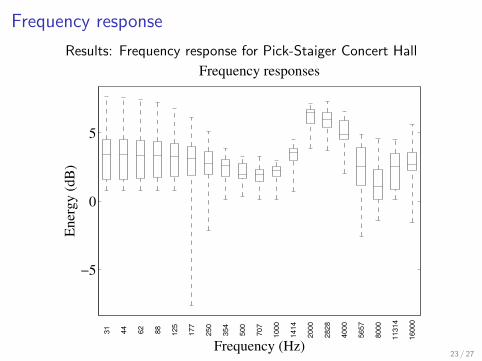
Frequency response
Results: Frequency response for Pick-Staiger Concert Hall
−5
0
5
3
1
4
4
6
2
8
8
1
25
1
77
2
50
3
54
5
00
7
07
10
00
14
14
20
00
28
28
40
00
56
57
80
00
11
31
4
16
00
0
Frequency (Hz)
Frequency responsesE
ner
gy (
dB
)
23 / 27
Clap consistency
Not all claps are created equal?
Claps can vary in intensity and frequency spread.We can account for this using the direct sound spectrum.
24 / 27
Clap consistency
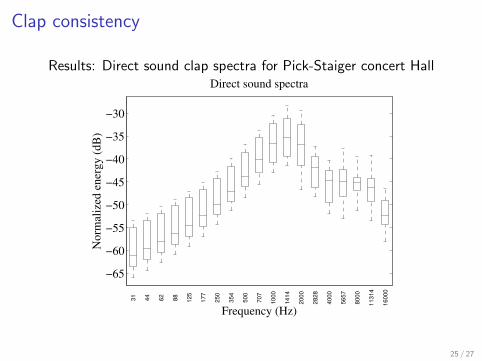
Results: Direct sound clap spectra for Pick-Staiger concert Hall
−65
−60
−55
−50
−45
−40
−35
−30
3
1
4
4
6
2
8
8
1
25
1
77
2
50
3
54
5
00
7
07
10
00
14
14
20
00
28
28
40
00
56
57
80
00
11
31
4
16
00
0
Frequency (Hz)
Direct sound spectraN
orm
aliz
ed e
ner
gy
(d
B)
25 / 27
Conclusions
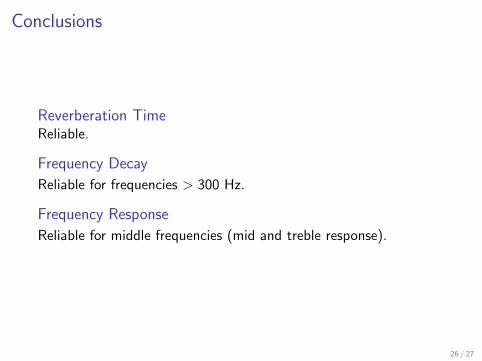
Reverberation TimeReliable.
Frequency Decay
Reliable for frequencies > 300 Hz.
Frequency Response
Reliable for middle frequencies (mid and treble response).
26 / 27
Application
iOS app: ClapIR
A mobile application that allows amateurs to obtain reliableacoustic measurements in any room.
27 / 27


![Gloria [clap clap], Gloria [clap clap], in excelsis Deo](https://img.pdfslide.us/doc/110x75/62107ac91ae5b738792e36b6/gloria-clap-clap-gloria-clap-clap-in-excelsis-deo-.jpg)