Embed Size (px)
Citation preview
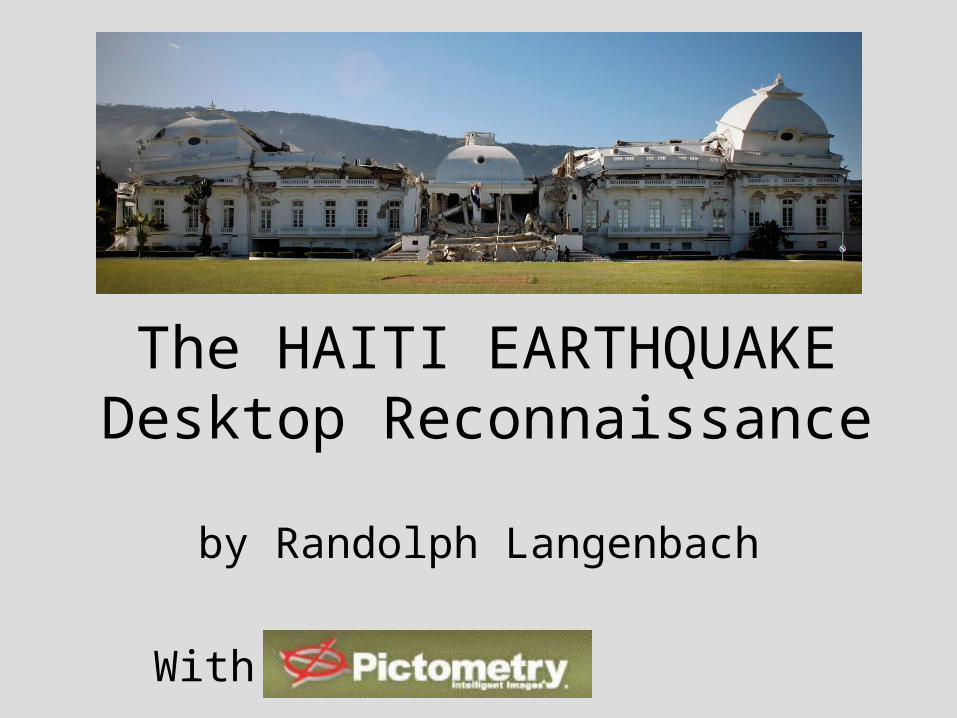
The HAITI EARTHQUAKE Desktop Reconnaissance
by Randolph Langenbach
With:
Aerial Images (c)Pictometry 2010
A use license donated to ICOMOS by Pictometry
2
• The following slide show will demonstrate a way of utilizing the oblique-view aerial photographic survey of the Haiti damage district.
• Access to this imagery has been generously donated to ICOMOS volunteers by Pictometry Co. of Rochester, N.Y. through the generous support by Shoreh Elhami, founder of URISA GISCorps.

Aerial Images (c)Pictometry 2010
A use license donated to ICOMOS by Pictometry
3
IMPORTANT NOTE
• To avoid a jerky appearance to slide changes, I recommend that, before you begin, you go to SLIDE SHOW in the top menu bar and select SET UP SHOW, and then click to turn on “USE GRAPHICS ACCELERATION”.
• Then enjoy the show.
Aerial Images (c)Pictometry 2010
A use license donated to ICOMOS by Pictometry
4
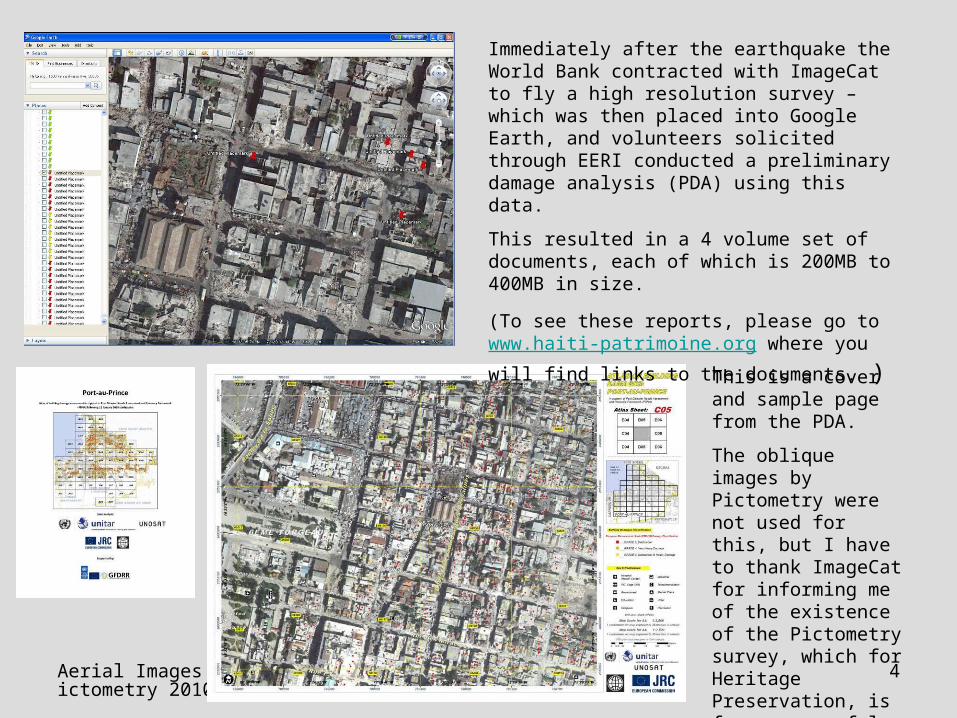
Immediately after the earthquake the World Bank contracted with ImageCat to fly a high resolution survey – which was then placed into Google Earth, and volunteers solicited through EERI conducted a preliminary damage analysis (PDA) using this data.
This resulted in a 4 volume set of documents, each of which is 200MB to 400MB in size.
(To see these reports, please go to www.haiti-patrimoine.org where you will find links
to the documents. )
This is a cover and sample page from the PDA.
The oblique images by Pictometry were not used for this, but I have to thank ImageCat for informing me of the existence of the Pictometry survey, which for Heritage Preservation, is far more useful.
Aerial Images (c)Pictometry 2010
A use license donated to ICOMOS by Pictometry
5
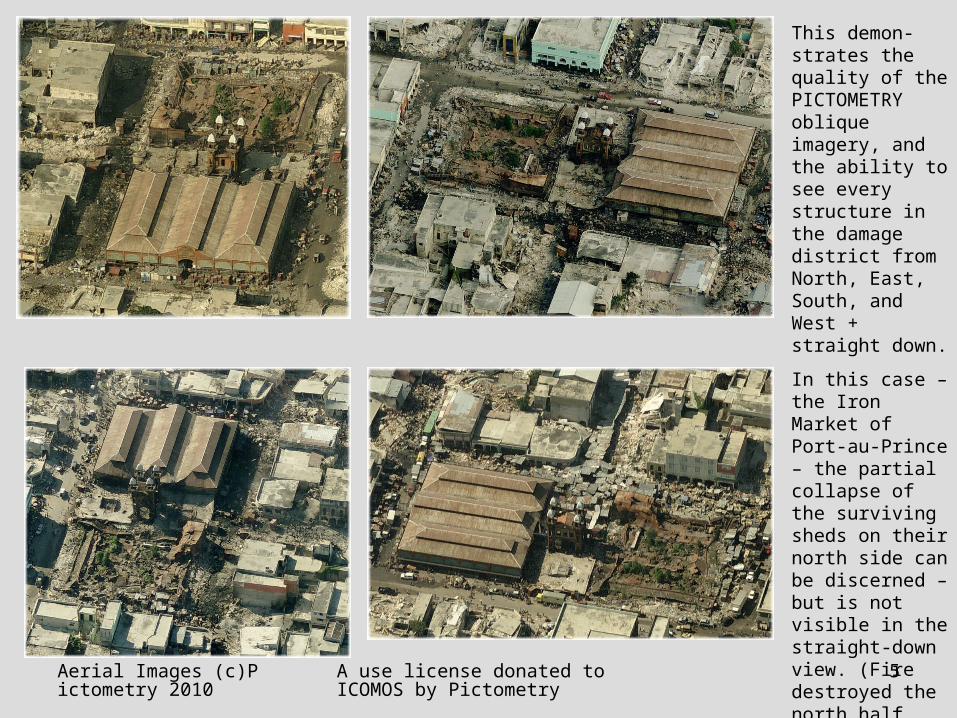
This demon-strates the quality of the PICTOMETRY oblique imagery, and the ability to see every structure in the damage district from North, East, South, and West + straight down.
In this case – the Iron Market of Port-au-Prince – the partial collapse of the surviving sheds on their north side can be discerned – but is not visible in the straight-down view. (Fire destroyed the north half prior to the EQ.)
Aerial Images (c)Pictometry 2010
A use license donated to ICOMOS by Pictometry
6
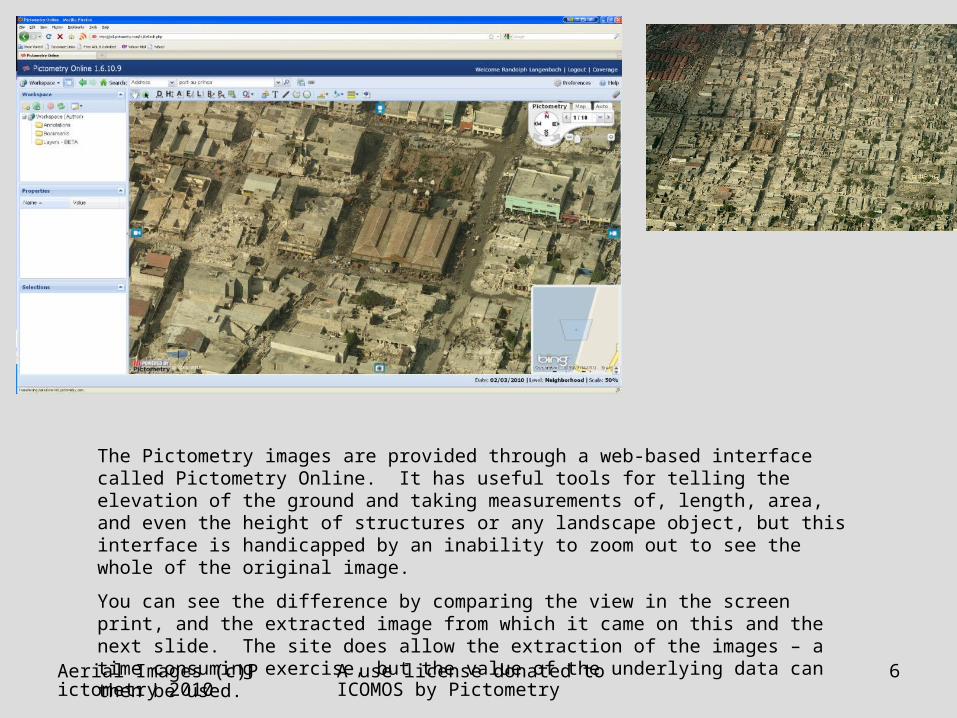
The Pictometry images are provided through a web-based interface called Pictometry Online. It has useful tools for telling the elevation of the ground and taking measurements of, length, area, and even the height of structures or any landscape object, but this interface is handicapped by an inability to zoom out to see the whole of the original image.
You can see the difference by comparing the view in the screen print, and the extracted image from which it came on this and the next slide. The site does allow the extraction of the images – a time consuming exercise, but the value of the underlying data can then be used.
Aerial Images (c)Pictometry 2010
A use license donated to ICOMOS by Pictometry
7
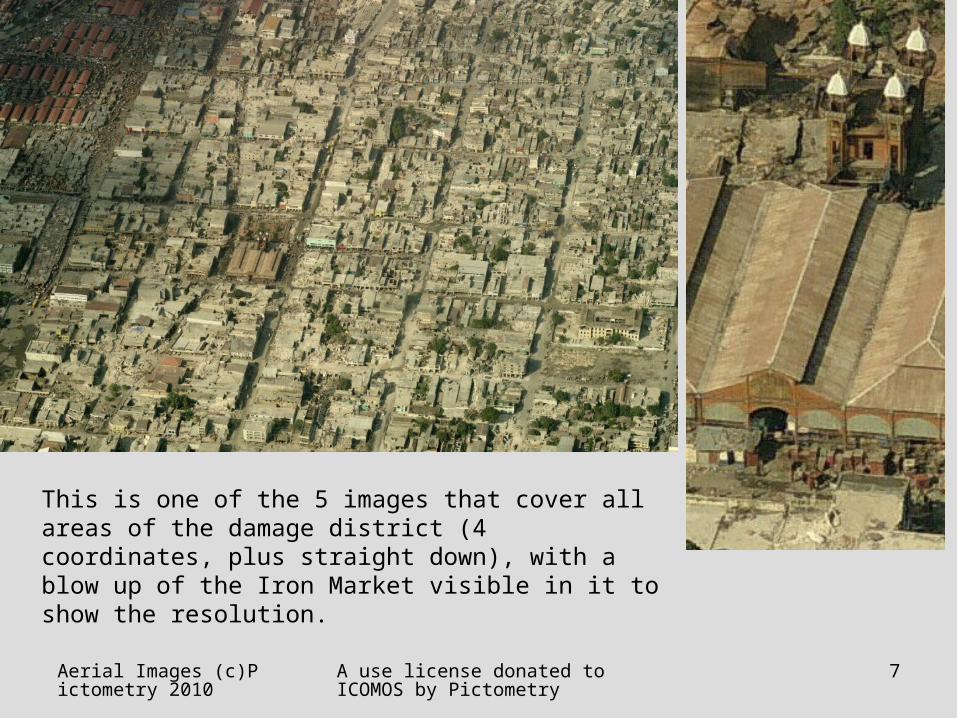
This is one of the 5 images that cover all areas of the damage district (4 coordinates, plus straight down), with a blow up of the Iron Market visible in it to show the resolution.
Aerial Images (c)Pictometry 2010
A use license donated to ICOMOS by Pictometry
8
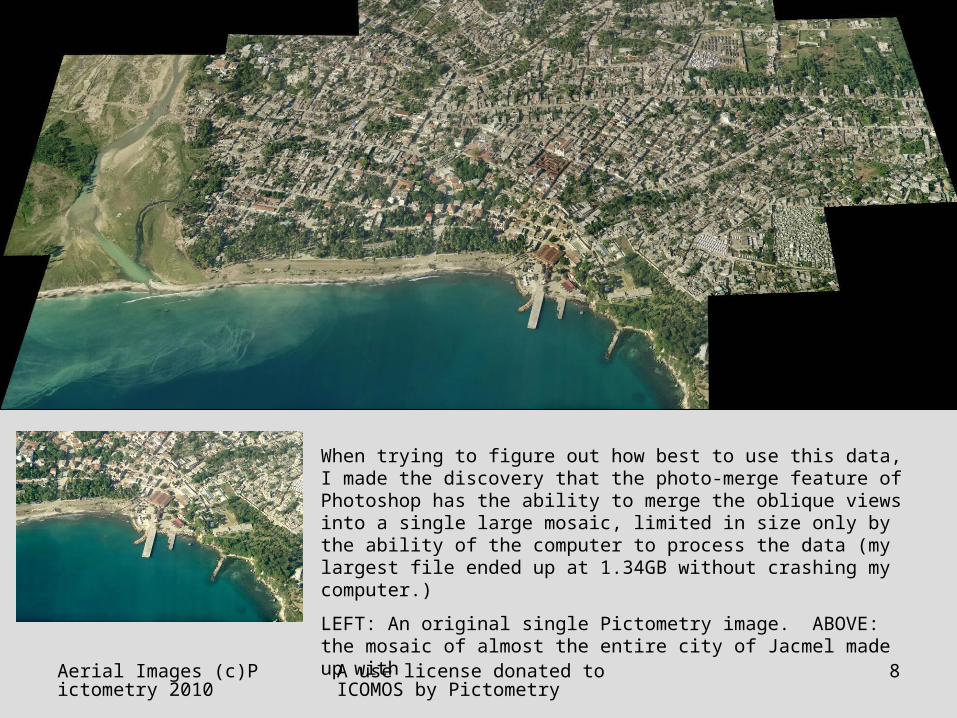
When trying to figure out how best to use this data, I made the discovery that the photo-merge feature of Photoshop has the ability to merge the oblique views into a single large mosaic, limited in size only by the ability of the computer to process the data (my largest file ended up at 1.34GB without crashing my computer.)
LEFT: An original single Pictometry image. ABOVE: the mosaic of almost the entire city of Jacmel made up with
Aerial Images (c)Pictometry 2010
A use license donated to ICOMOS by Pictometry
9
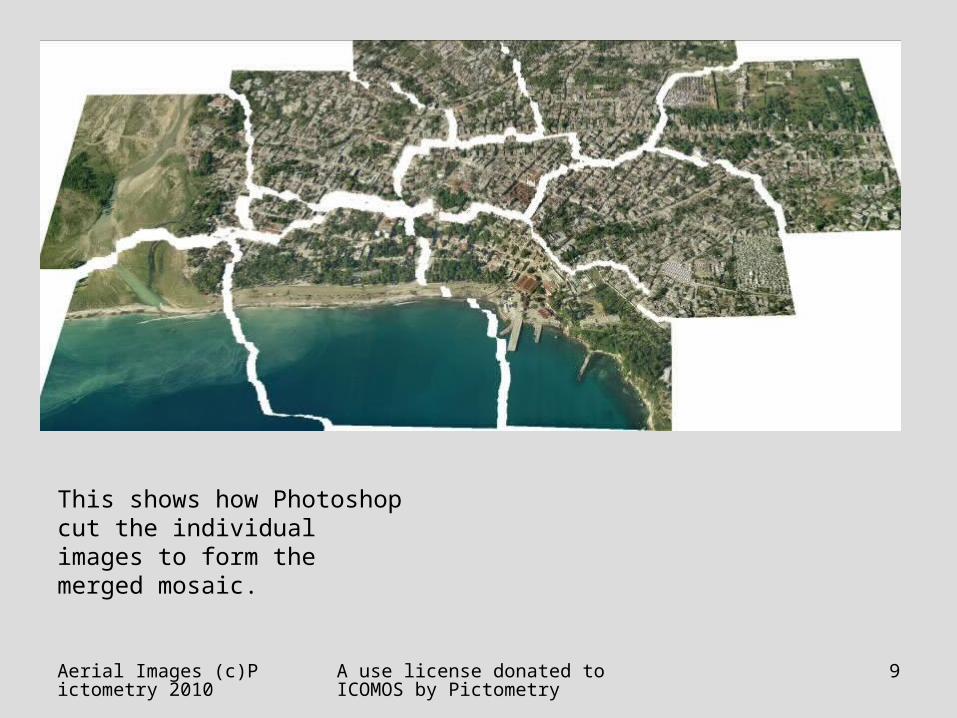
This shows how Photoshop cut the individual images to form the merged mosaic.
Aerial Images (c)Pictometry 2010
A use license donated to ICOMOS by Pictometry
10
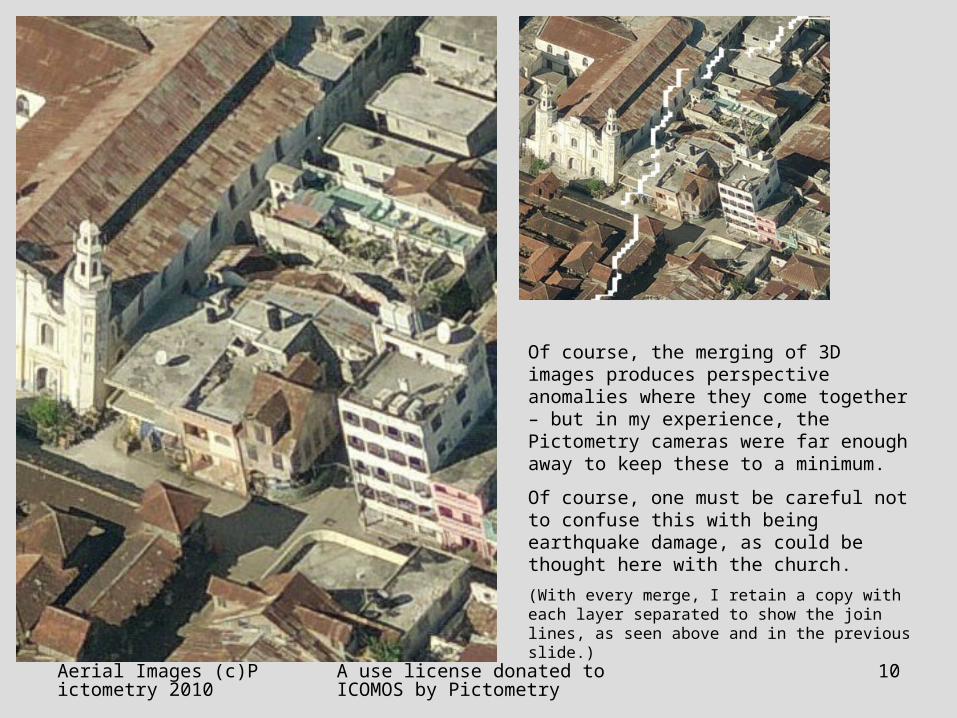
Of course, the merging of 3D images produces perspective anomalies where they come together – but in my experience, the Pictometry cameras were far enough away to keep these to a minimum.
Of course, one must be careful not to confuse this with being earthquake damage, as could be thought here with the church.
(With every merge, I retain a copy with each layer separated to show the join lines, as seen above and in the previous slide.)

Aerial Images (c)Pictometry 2010
A use license donated to ICOMOS by Pictometry
11
I also discovered that almost all the Pictometry images have extensive overlaps. These can be exploited to make STEREO PAIRS. The value of this can be seen in this pair which shows that a high bluff runs to the left of the Iron Market. The pictometry elevation tool shows this as a 14’ bluff, followed by another 25’ feet upslope to the market.
TO SEE IN STEREO, CROSS YOUR EYES TO MERGE THE IMAGES to see in 3D.
3D
Aerial Images (c)Pictometry 2010
A use license donated to ICOMOS by Pictometry
12
The Jacmel Desktop Reconnaissance
• The following slides show how I undertook a survey of Jacmel utilizing this data.
• This is my first comprehensive effort of this kind working with such data, but even with figuring out how to do it, it took only 8 to 10 hours.
• Other colleagues may develop different methodologies.
Aerial Images (c)Pictometry 2010
A use license donated to ICOMOS by Pictometry
13
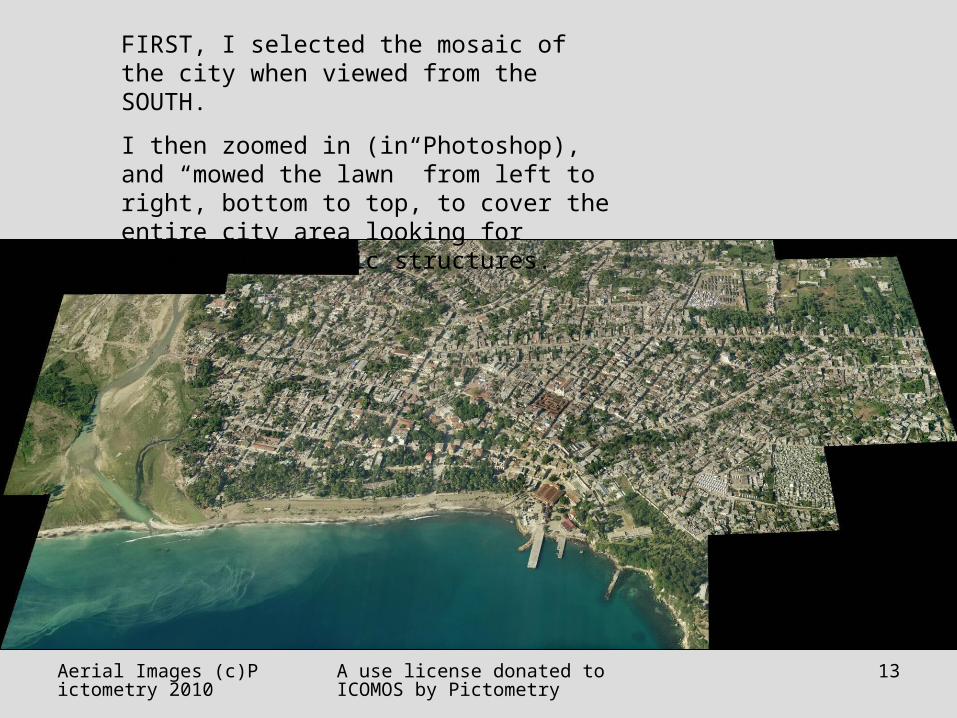
FIRST, I selected the mosaic of the city when viewed from the SOUTH.
I then zoomed in (in Photoshop), and “mowed the lawn” from left to right, bottom to top, to cover the entire city area looking for potential historic structures.
Aerial Images (c)Pictometry 2010
A use license donated to ICOMOS by Pictometry
14
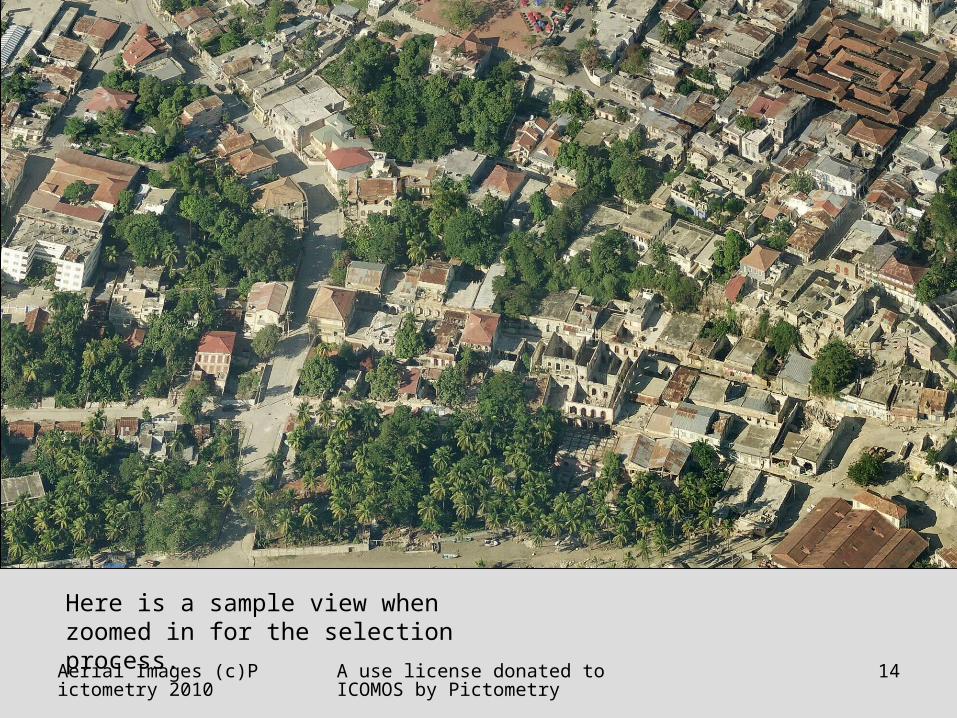
Here is a sample view when zoomed in for the selection process.
Aerial Images (c)Pictometry 2010
A use license donated to ICOMOS by Pictometry
15
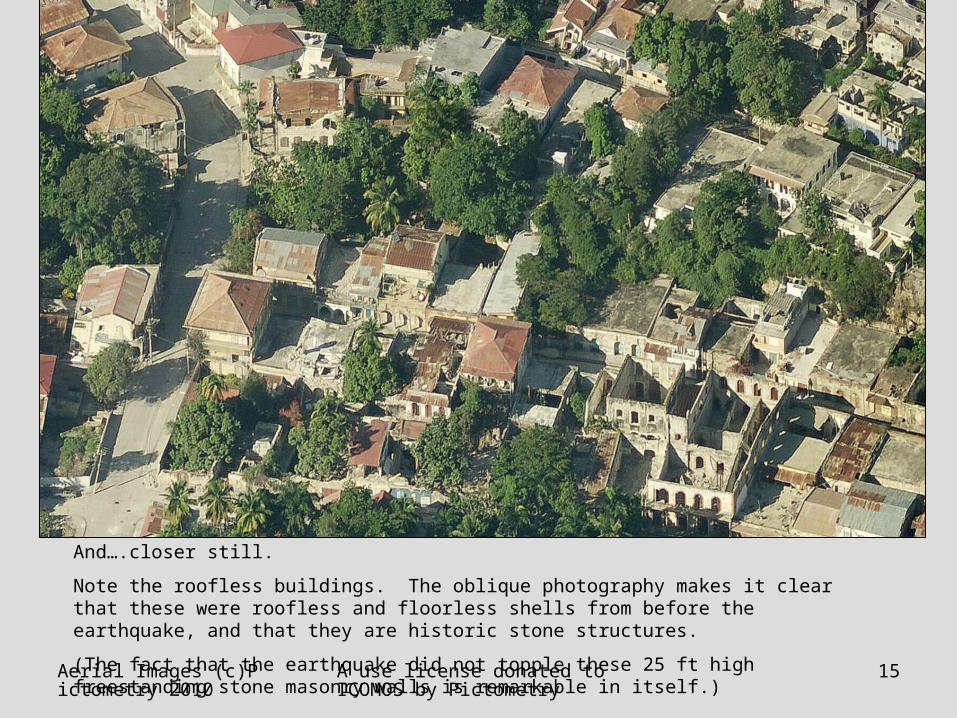
And….closer still.
Note the roofless buildings. The oblique photography makes it clear that these were roofless and floorless shells from before the earthquake, and that they are historic stone structures.
(The fact that the earthquake did not topple these 25 ft high freestanding stone masonry walls is remarkable in itself.)
Aerial Images (c)Pictometry 2010
A use license donated to ICOMOS by Pictometry
16
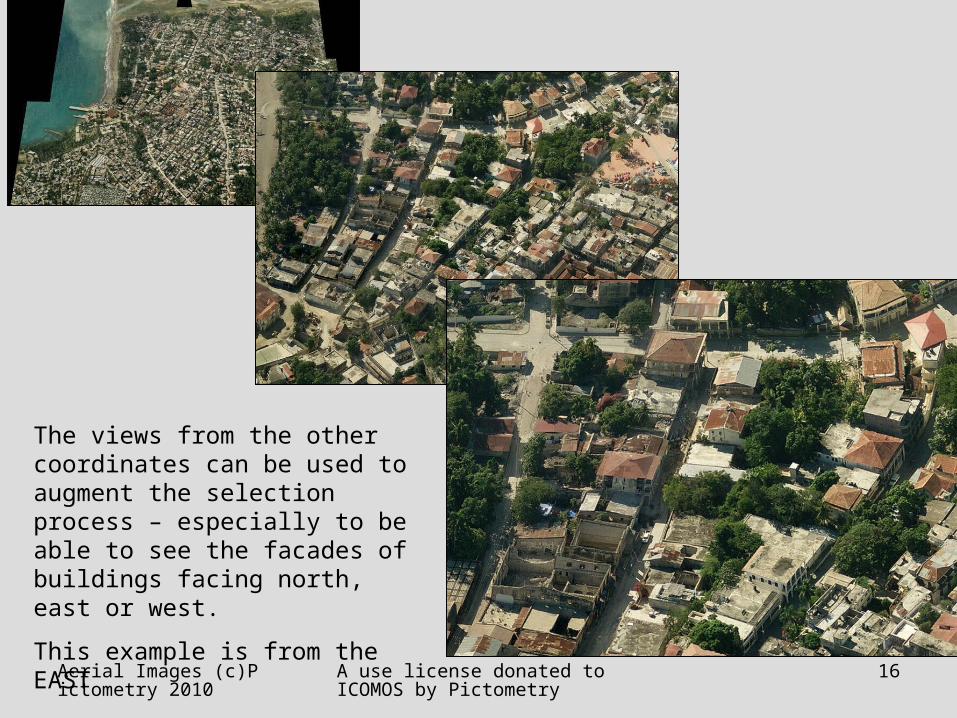
The views from the other coordinates can be used to augment the selection process – especially to be able to see the facades of buildings facing north, east or west.
This example is from the EAST
Aerial Images (c)Pictometry 2010
A use license donated to ICOMOS by Pictometry
17
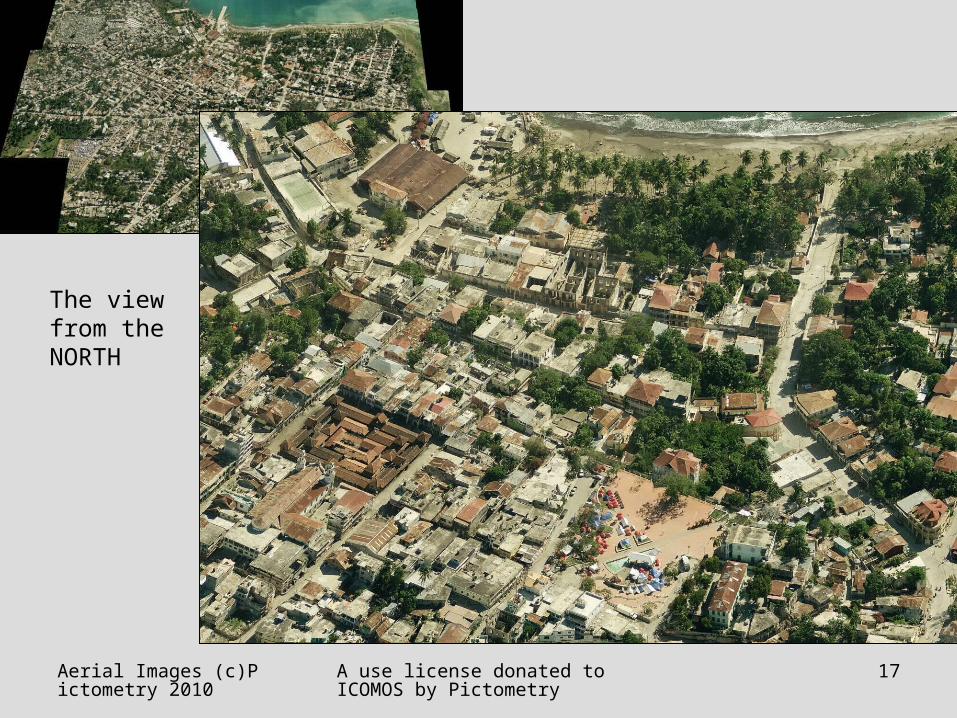
The view from the NORTH
Aerial Images (c)Pictometry 2010
A use license donated to ICOMOS by Pictometry
18
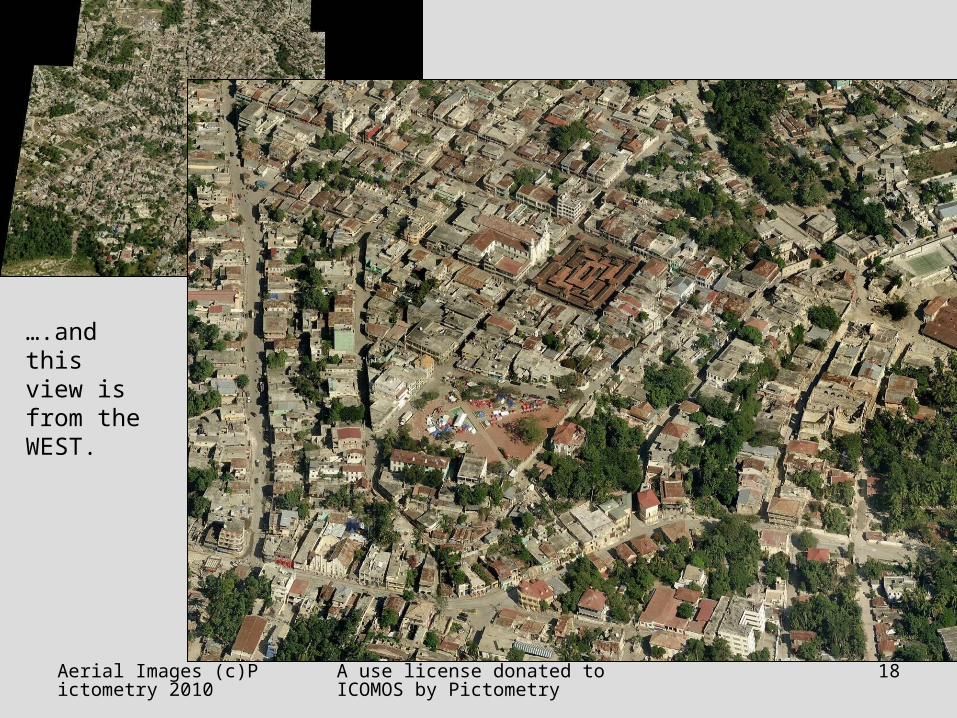
….and this view is from the WEST.
Aerial Images (c)Pictometry 2010
A use license donated to ICOMOS by Pictometry
19
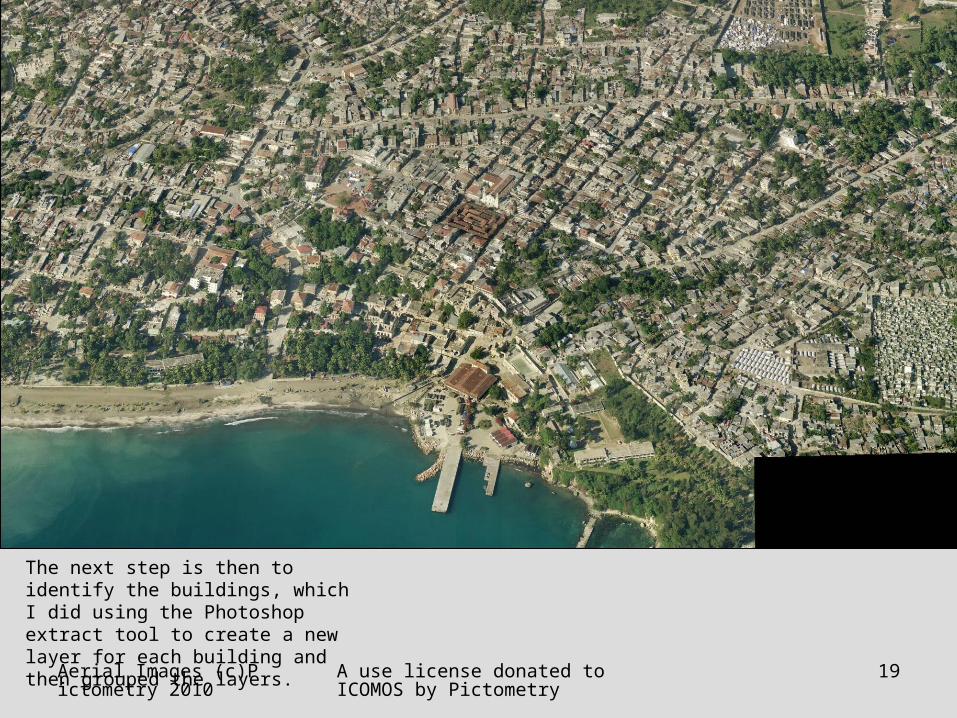
The next step is then to identify the buildings, which I did using the Photoshop extract tool to create a new layer for each building and then grouped the layers.
Aerial Images (c)Pictometry 2010
A use license donated to ICOMOS by Pictometry
20
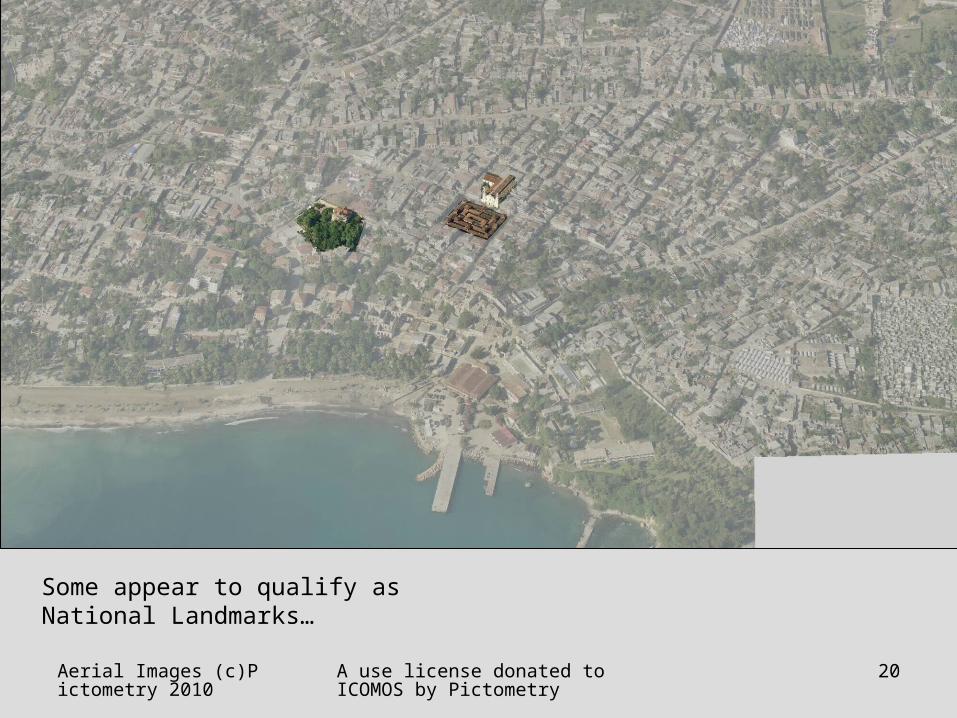
Some appear to qualify as National Landmarks…
Aerial Images (c)Pictometry 2010
A use license donated to ICOMOS by Pictometry
21
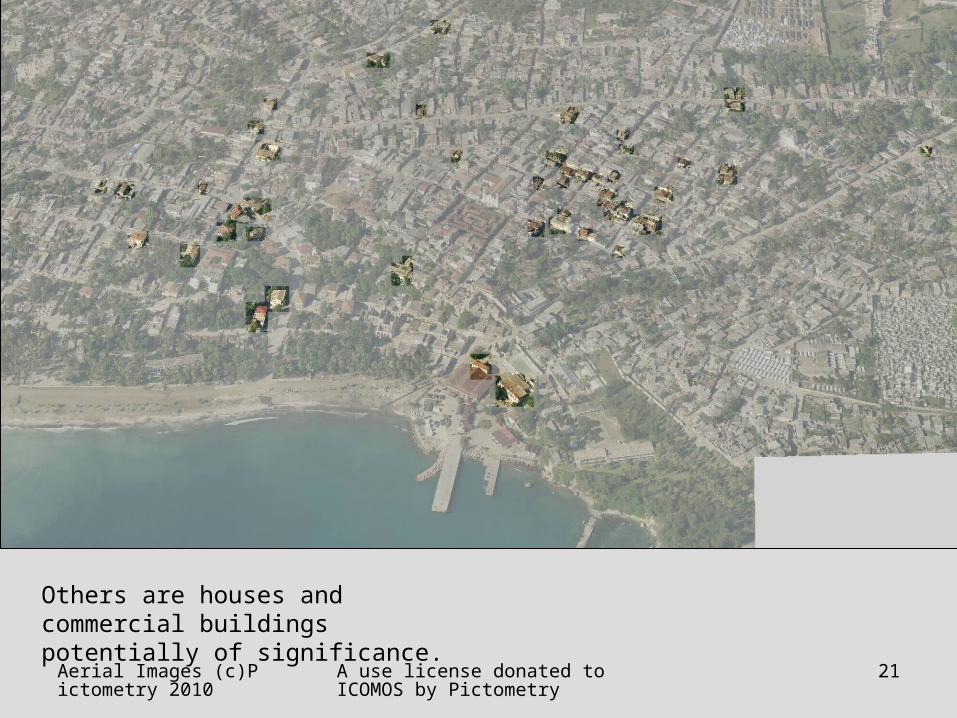
Others are houses and commercial buildings potentially of significance.
Aerial Images (c)Pictometry 2010
A use license donated to ICOMOS by Pictometry
22
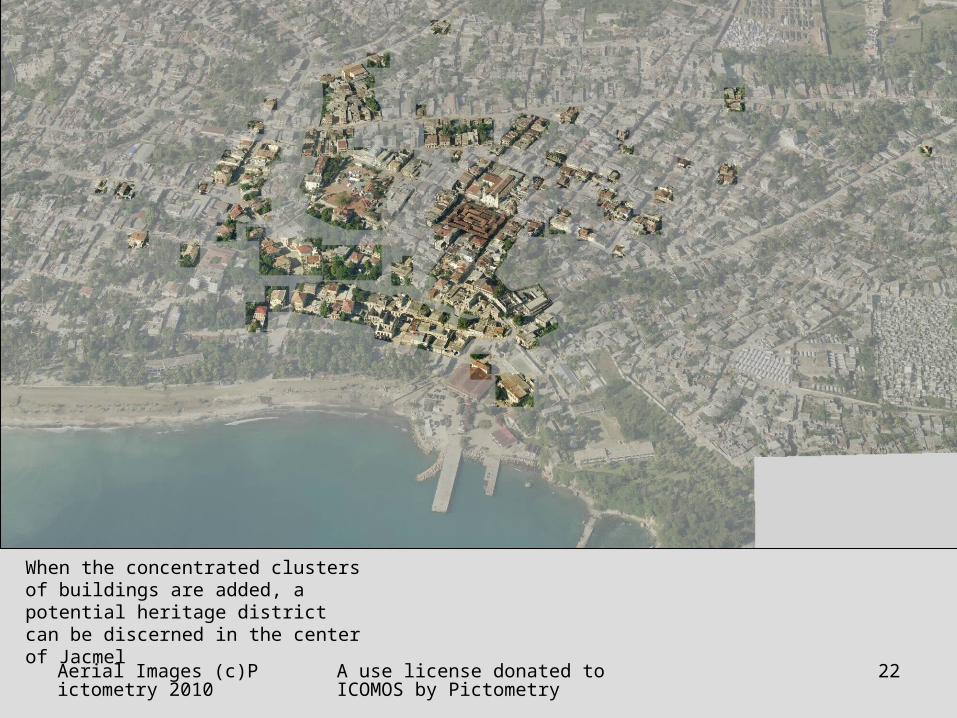
When the concentrated clusters of buildings are added, a potential heritage district can be discerned in the center of Jacmel
Aerial Images (c)Pictometry 2010
A use license donated to ICOMOS by Pictometry
23
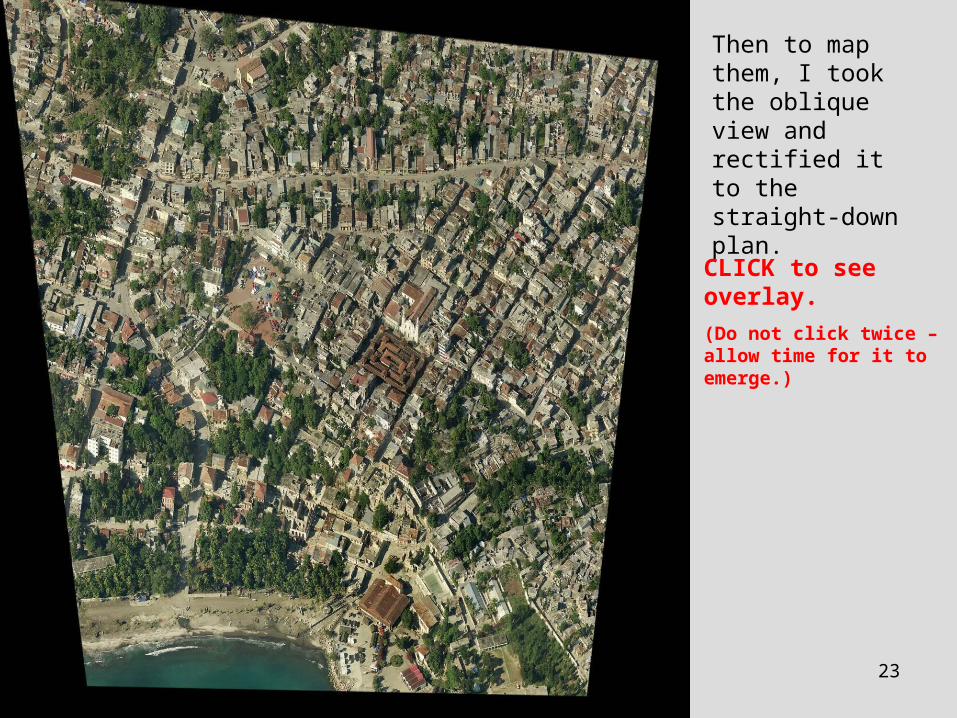
Then to map them, I took the oblique view and rectified it to the straight-down plan.
CLICK to see overlay.
(Do not click twice – allow time for it to emerge.)
Aerial Images (c)Pictometry 2010
A use license donated to ICOMOS by Pictometry
24
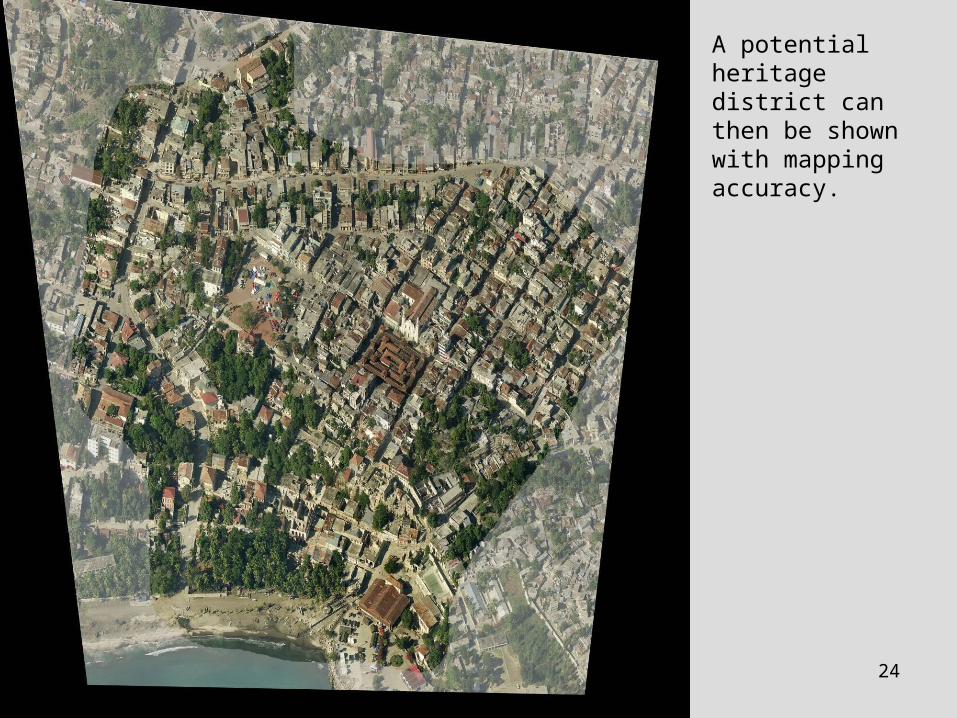
A potential heritage district can then be shown with mapping accuracy.
Aerial Images (c)Pictometry 2010
A use license donated to ICOMOS by Pictometry
25
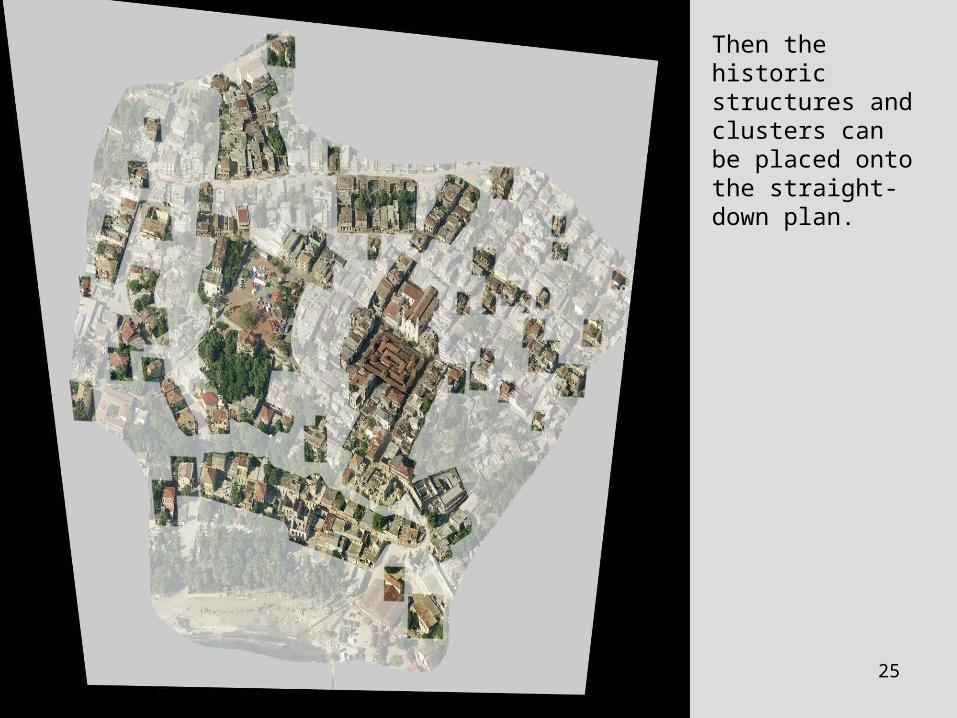
Then the historic structures and clusters can be placed onto the straight-down plan.
Aerial Images (c)Pictometry 2010
A use license donated to ICOMOS by Pictometry
26
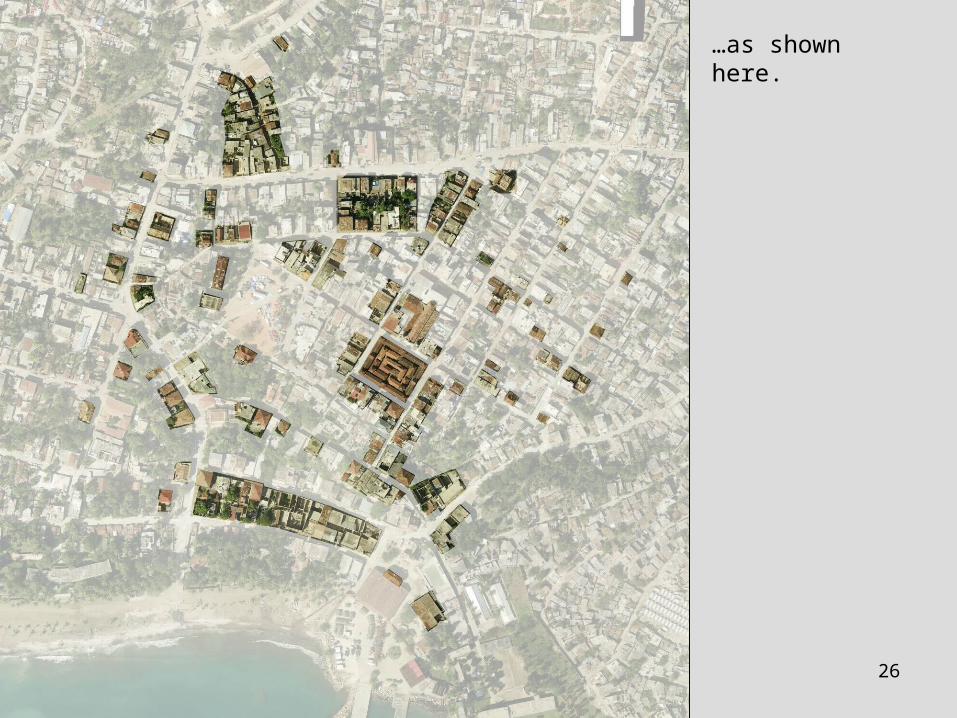
…as shown here.
Aerial Images (c)Pictometry 2010
A use license donated to ICOMOS by Pictometry
27
• As a tool for reconnaissance, this can be used throughout the city.
• Pictometry covered all of Port-au-Prince, Carrefour, Leogane, and Jacmel.
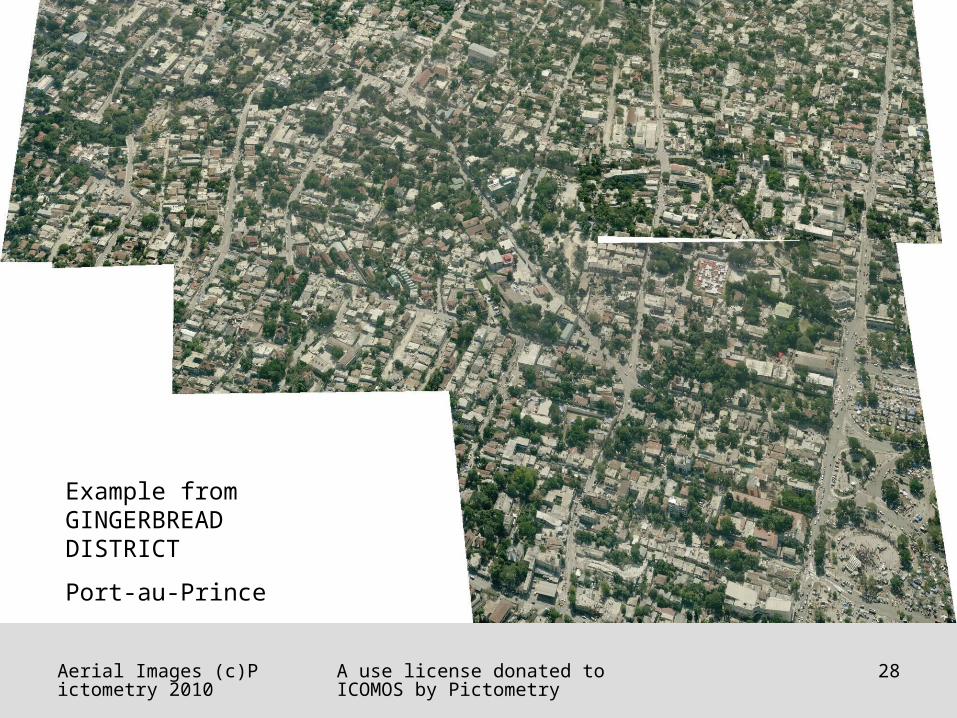
• I expect it will be particularly useful to map resources and see damage and construction typology in the Gingerbread district – as demonstrated in the next slides.
Aerial Images (c)Pictometry 2010
A use license donated to ICOMOS by Pictometry
28
Example from GINGERBREAD DISTRICT
Port-au-Prince
Aerial Images (c)Pictometry 2010
A use license donated to ICOMOS by Pictometry
29
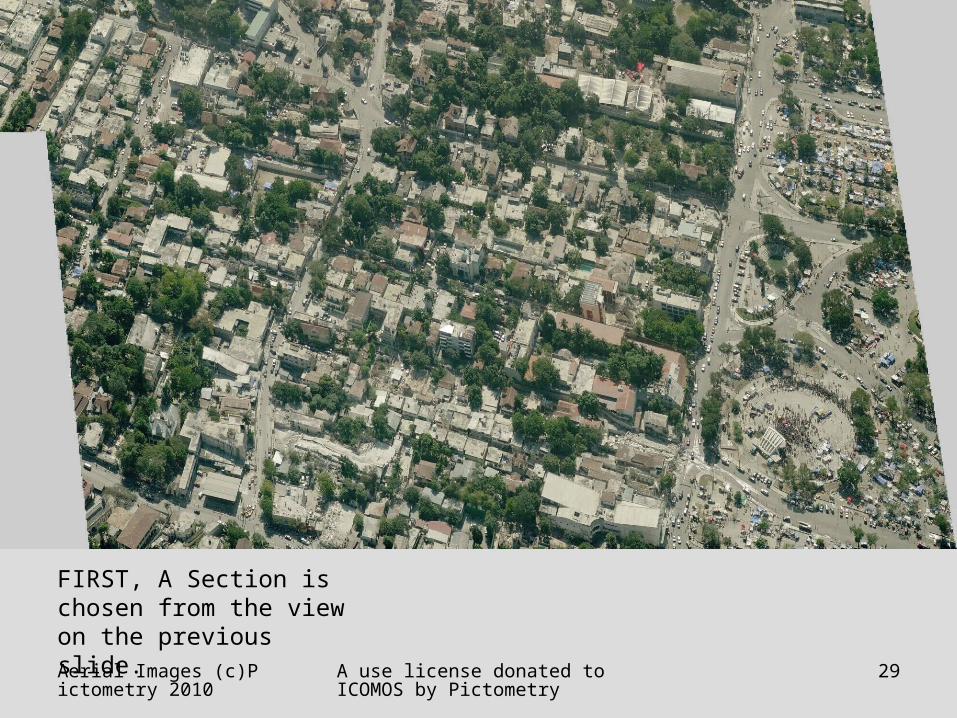
FIRST, A Section is chosen from the view on the previous slide.
Aerial Images (c)Pictometry 2010
A use license donated to ICOMOS by Pictometry
30
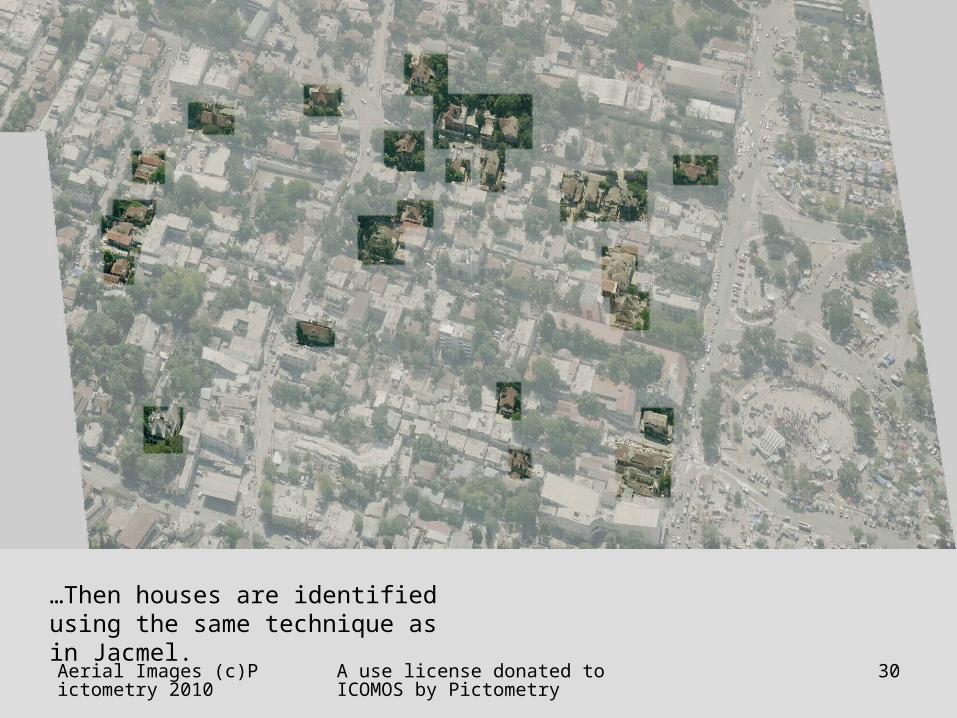
…Then houses are identified using the same technique as in Jacmel.
Aerial Images (c)Pictometry 2010
A use license donated to ICOMOS by Pictometry
31
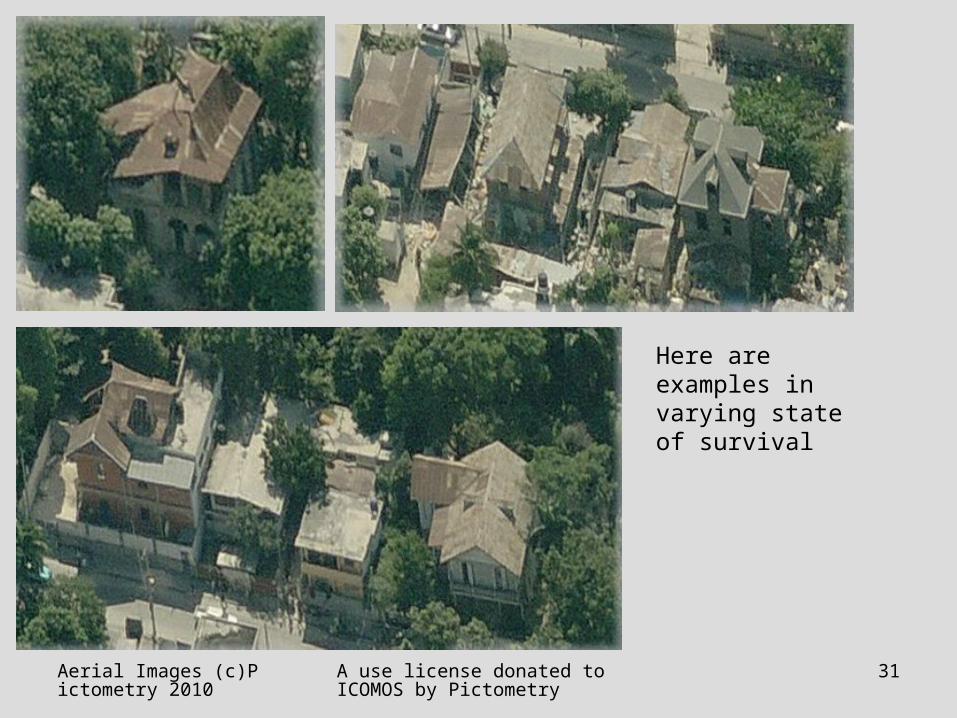
Here are examples in varying state of survival
Aerial Images (c)Pictometry 2010
A use license donated to ICOMOS by Pictometry
32
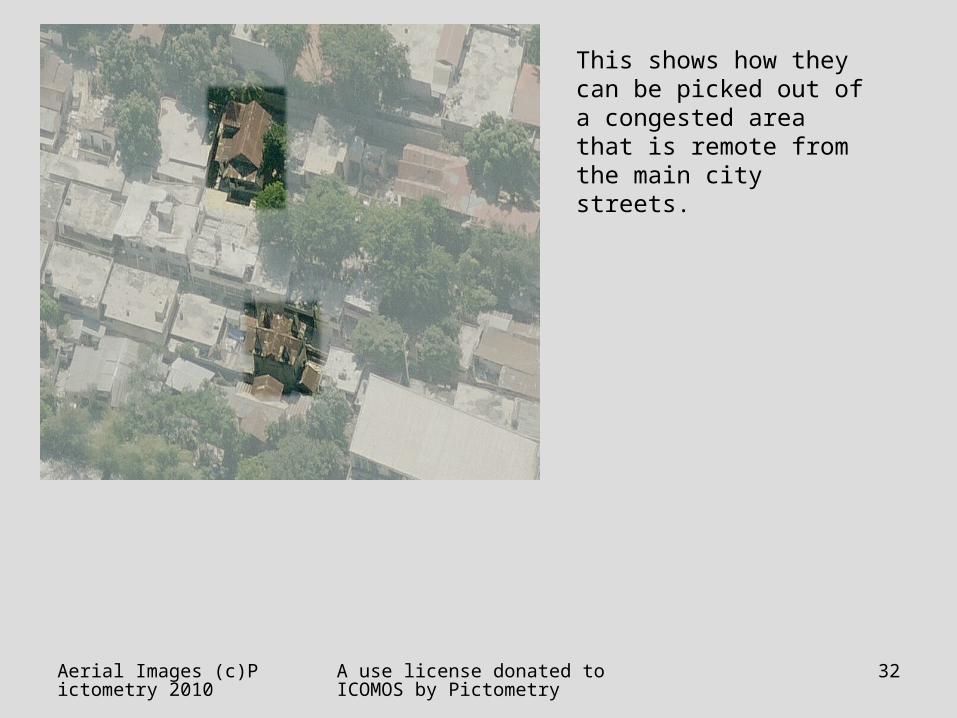
This shows how they can be picked out of a congested area that is remote from the main city streets.
Aerial Images (c)Pictometry 2010
A use license donated to ICOMOS by Pictometry
33
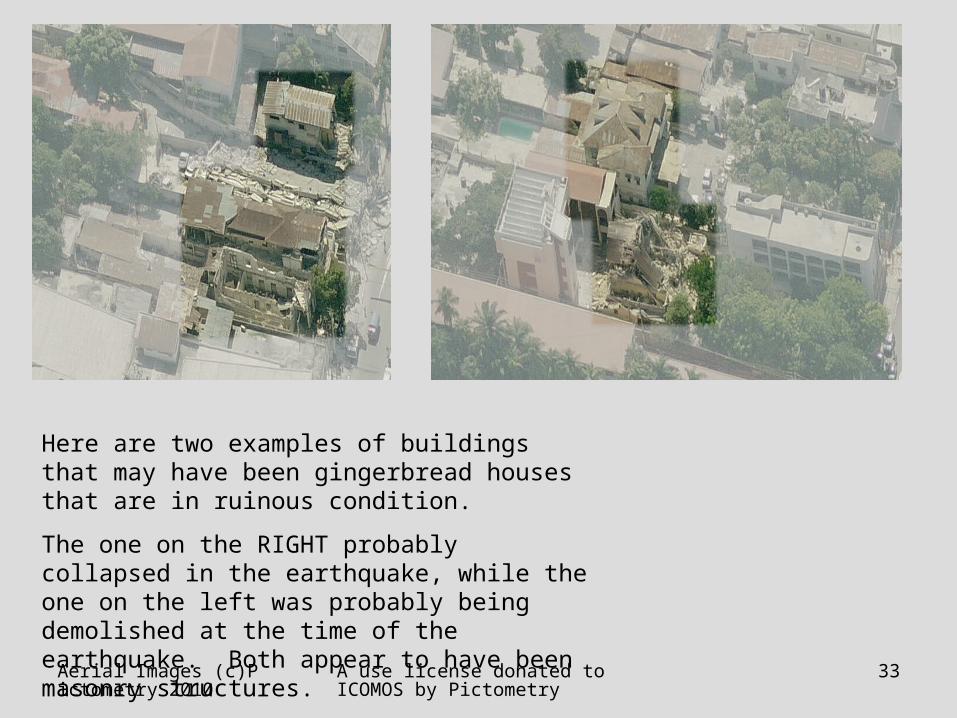
Here are two examples of buildings that may have been gingerbread houses that are in ruinous condition.
The one on the RIGHT probably collapsed in the earthquake, while the one on the left was probably being demolished at the time of the earthquake. Both appear to have been masonry structures.
Aerial Images (c)Pictometry 2010
A use license donated to ICOMOS by Pictometry
34
• All of this I hope shows the value of this data for an ICOMOS preservation initiative in Haiti, and the value of working with it before going there.
Thank you,
Randolph Langenbach
www.conservationtech.com