Embed Size (px)
Citation preview
The #H2IQ Hour
This presentation is part of the monthly H2IQ hour to highlight research and development activities funded by U.S. Department of Energy’s Hydrogen and Fuel Cell Technologies Office (HFTO) within the Office of Energy Efficiency and Renewable Energy (EERE).
Today’s Topic:
Long Duration Energy Storage Using Hydrogen and Fuel Cells

The #H2IQ HourQ&A
Please type your questions into the Q&A Box
StoreFAST Model Overview:Long Duration Energy Storage Using Hydrogen and Fuel Cells
NREL: Chad Hunter, Michael Penev, Evan Reznicek, Josh EichmanHFTO: Neha Rustagi, Marc Melaina, Mariya KolevaSPIA: Sam BaldwinMarch 24, 2021H2IQ Hour
This presentation does not contain any proprietary, confidential, or otherwise restricted information.
NREL | 4
Outline
• Methods
• Results
• StoreFAST modelling tool & demo
NREL | 5
High variable renewable energy (VRE) grids will require seasonal energy storage or flexible power generation
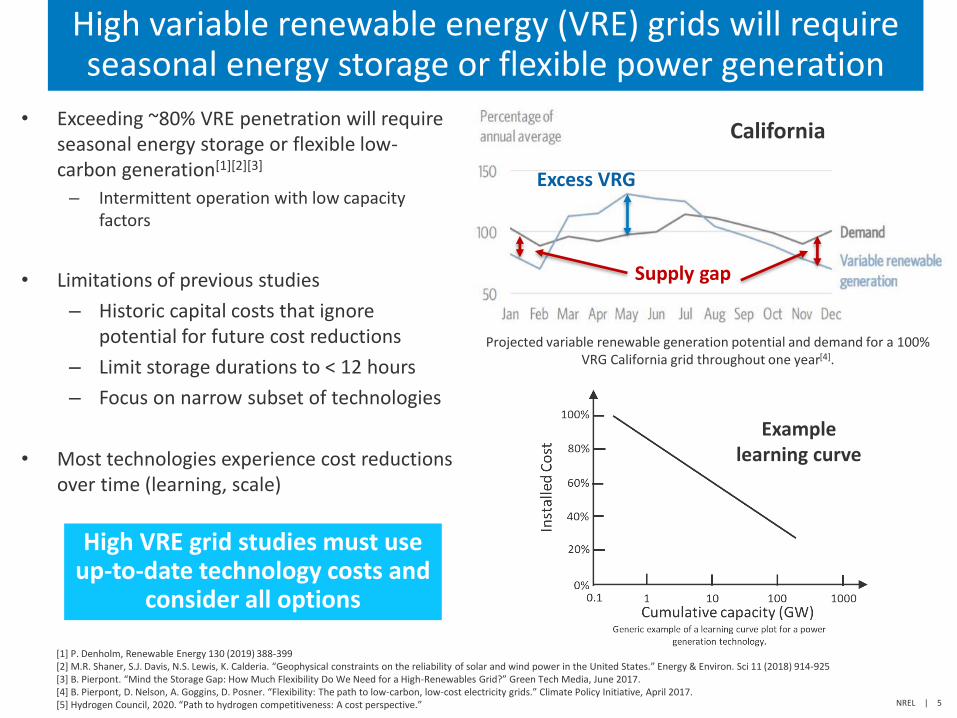
• Exceeding ~80% VRE penetration will require seasonal energy storage or flexible low-carbon generation[1][2][3]
– Intermittent operation with low capacity factors
• Limitations of previous studies
– Historic capital costs that ignore potential for future cost reductions
– Limit storage durations to < 12 hours
– Focus on narrow subset of technologies
• Most technologies experience cost reductions over time (learning, scale)
[1] P. Denholm, Renewable Energy 130 (2019) 388-399[2] M.R. Shaner, S.J. Davis, N.S. Lewis, K. Calderia. “Geophysical constraints on the reliability of solar and wind power in the United States.” Energy & Environ. Sci 11 (2018) 914-925[3] B. Pierpont. “Mind the Storage Gap: How Much Flexibility Do We Need for a High-Renewables Grid?” Green Tech Media, June 2017. [4] B. Pierpont, D. Nelson, A. Goggins, D. Posner. “Flexibility: The path to low-carbon, low-cost electricity grids.” Climate Policy Initiative, April 2017. [5] Hydrogen Council, 2020. “Path to hydrogen competitiveness: A cost perspective.”
California
High VRE grid studies must use up-to-date technology costs and
consider all options
Excess VRG
Supply gap
Projected variable renewable generation potential and demand for a 100% VRG California grid throughout one year[4].
Example learning curve
NREL | 6
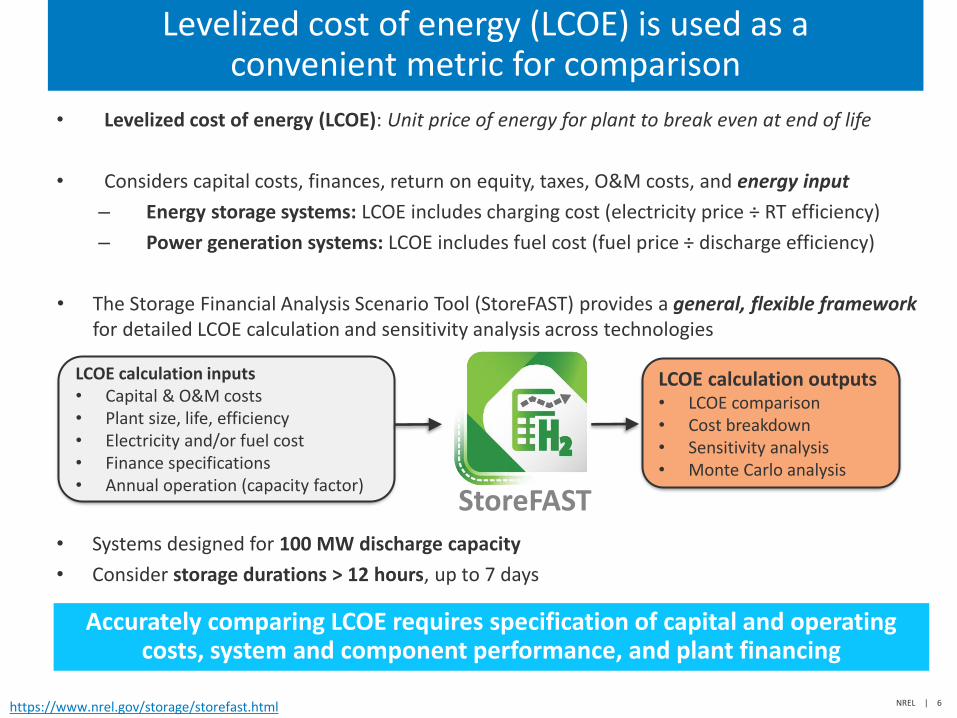
• Levelized cost of energy (LCOE): Unit price of energy for plant to break even at end of life
• Considers capital costs, finances, return on equity, taxes, O&M costs, and energy input
– Energy storage systems: LCOE includes charging cost (electricity price ÷ RT efficiency)
– Power generation systems: LCOE includes fuel cost (fuel price ÷ discharge efficiency)
• The Storage Financial Analysis Scenario Tool (StoreFAST) provides a general, flexible framework for detailed LCOE calculation and sensitivity analysis across technologies
• Systems designed for 100 MW discharge capacity
• Consider storage durations > 12 hours, up to 7 days
Levelized cost of energy (LCOE) is used as a convenient metric for comparison
LCOE calculation inputs• Capital & O&M costs• Plant size, life, efficiency• Electricity and/or fuel cost• Finance specifications• Annual operation (capacity factor)
Accurately comparing LCOE requires specification of capital and operating costs, system and component performance, and plant financing
LCOE calculation outputs• LCOE comparison• Cost breakdown• Sensitivity analysis• Monte Carlo analysis
https://www.nrel.gov/storage/storefast.html
StoreFAST
NREL | 7
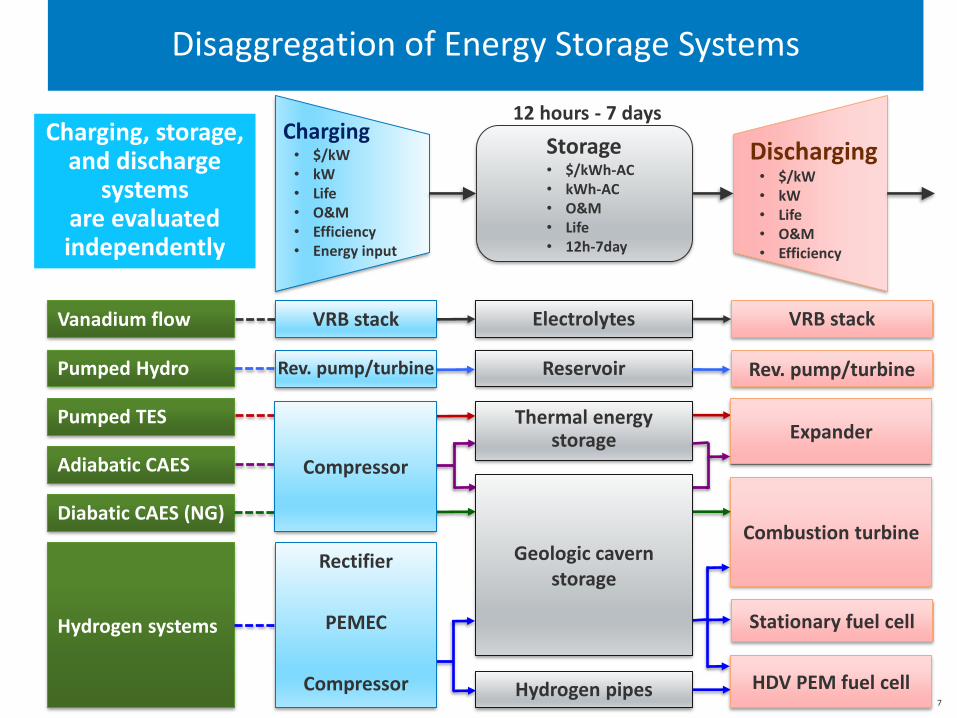
Disaggregation of Energy Storage Systems
Storage• $/kWh-AC• kWh-AC• O&M• Life• 12h-7day
Charging• $/kW• kW• Life• O&M• Efficiency• Energy input
Discharging• $/kW• kW• Life• O&M• Efficiency
Reservoir Rev. pump/turbinePumped Hydro
Diabatic CAES (NG)
Adiabatic CAES
Pumped TES Thermal energy storage
Vanadium flow Electrolytes VRB stack
Hydrogen systems
Hydrogen pipes
Stationary fuel cell
Combustion turbine
HDV PEM fuel cell
Charging, storage, and discharge
systems are evaluated independently
Expander
Geologic cavern storage
Rev. pump/turbine
VRB stack
Compressor
Rectifier
PEMEC
Compressor
12 hours - 7 days
NREL | 8
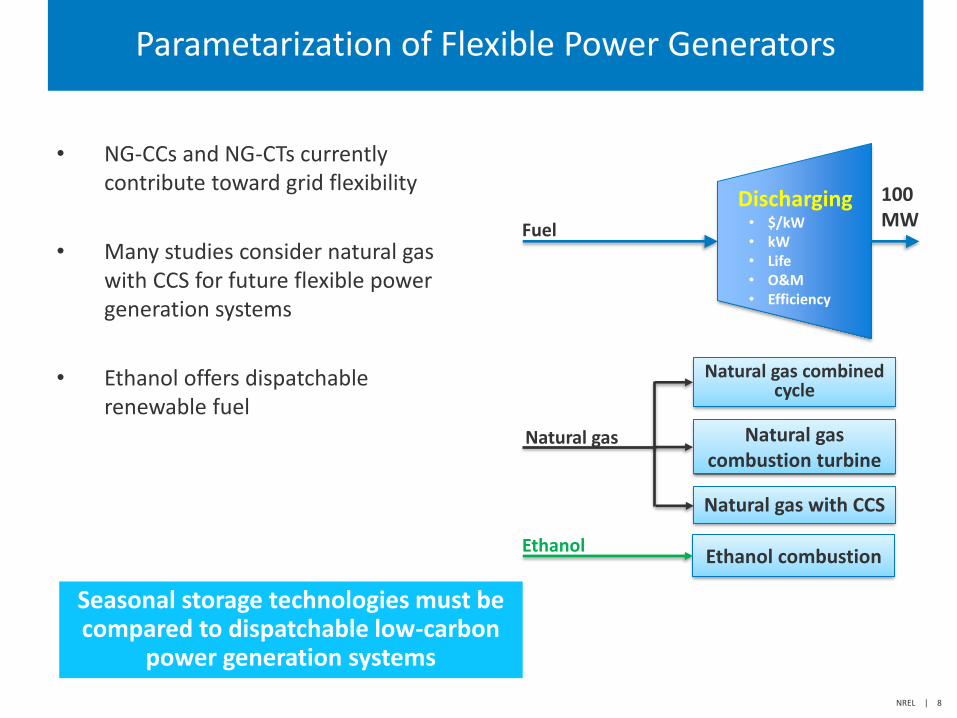
Parametarization of Flexible Power Generators
• NG-CCs and NG-CTs currently contribute toward grid flexibility
• Many studies consider natural gas with CCS for future flexible power generation systems
• Ethanol offers dispatchable renewable fuel
Discharging• $/kW• kW• Life• O&M• Efficiency
Natural gas with CCS
Ethanol combustion
Natural gas combined cycle
Natural gas combustion turbine
Natural gas
Ethanol
Seasonal storage technologies must be compared to dispatchable low-carbon
power generation systems
100 MWFuel
NREL | 9
NGCC
NGCT
NGCC+90%CCS
EthCC
0%
5%
10%
15%
20%
25%
0.00 0.02 0.04 0.06 0.08 0.10 0.12 0.14 0.16 0.18 0.20
Variable operating expense (2018$/kWh)
Cap
acity
facto
rs (
%)
0%
10%
20%
30%
40%
50%
0% 20% 40% 60% 80% 100%
Charging Capacity Factor
Discharging Capacity Factor
ESS Round Trip Efficiency (AC/AC)
Cap
acity f
acto
rs (
%)
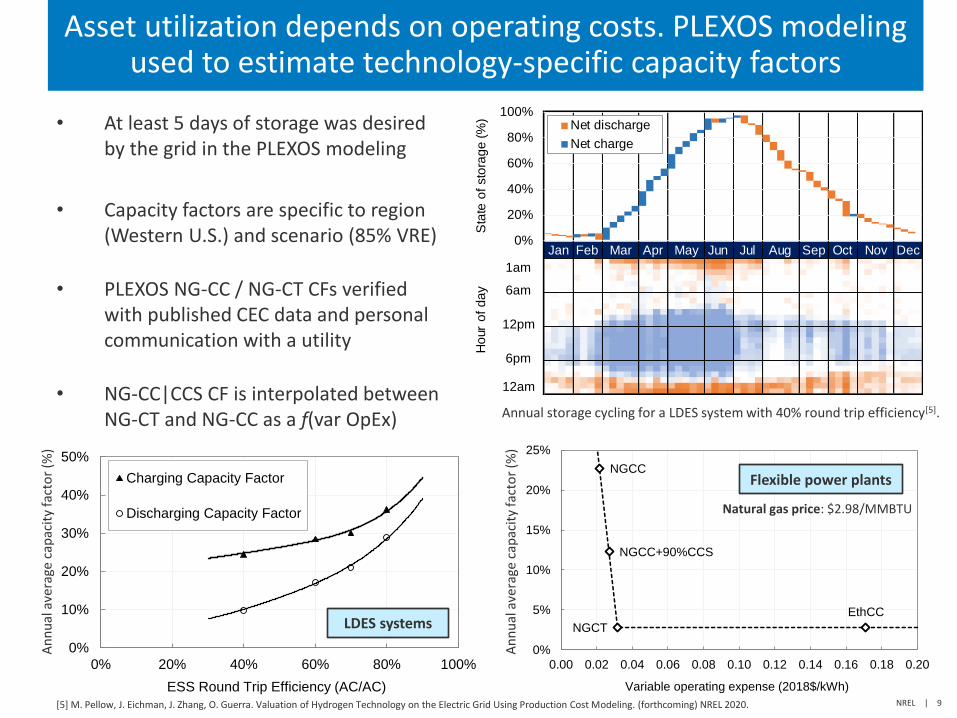
Asset utilization depends on operating costs. PLEXOS modeling used to estimate technology-specific capacity factors
• At least 5 days of storage was desired by the grid in the PLEXOS modeling
• Capacity factors are specific to region (Western U.S.) and scenario (85% VRE)
• PLEXOS NG-CC / NG-CT CFs verified with published CEC data and personal communication with a utility
• NG-CC|CCS CF is interpolated between NG-CT and NG-CC as a f(var OpEx)
[5] M. Pellow, J. Eichman, J. Zhang, O. Guerra. Valuation of Hydrogen Technology on the Electric Grid Using Production Cost Modeling. (forthcoming) NREL 2020.
Annual storage cycling for a LDES system with 40% round trip efficiency[5].
LDES systems
Flexible power plants
12am
1am
6am
12pm
6pm
0%
20%
40%
60%
80%
100%Net discharge
Net charge
Sta
te o
f sto
rag
e (
%)
Ho
ur
of
da
y
Jan Feb Mar Apr May Jun Jul Aug Sep Oct Nov Dec
Natural gas price: $2.98/MMBTU
An
nu
al a
vera
ge c
apac
ity
fact
or
(%)
An
nu
al a
vera
ge c
apac
ity
fact
or
(%)
NREL | 10
Outline
• Methods
• Results
• StoreFAST modelling tool & demo
NREL | 11
First, let’s evaluate the Current Cost scenarios
Current Costs Future Costs
NREL | 12
24h(1d)
48h(2d)
72h(3d)
96h(4d)
120h(5d)
144h(6d)
168h(7d)
130
0
50
100
150
200
250
300
350
400
LC
OE
of p
ea
k p
ow
er
(20
18
$/M
Wh
)L
CO
Eo
f p
ea
k p
ow
er
(20
18
$/M
Wh
)
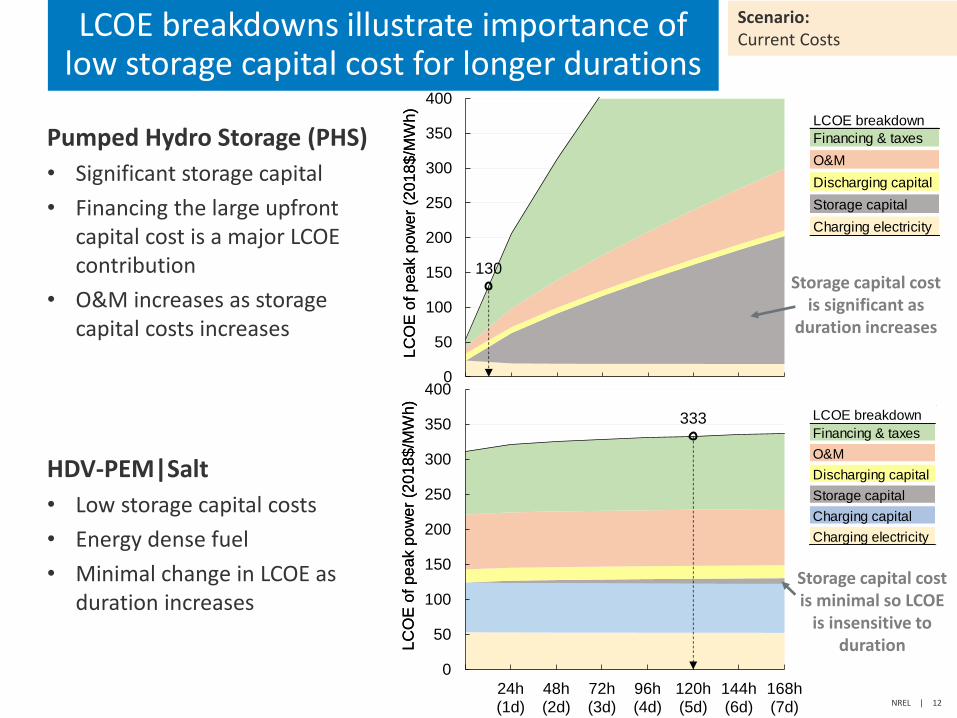
LCOE breakdown
Financing & taxes
O&M
Discharging capital
Storage capital
Charging electricity
Pumped Hydro Storage (PHS)
• Significant storage capital
• Financing the large upfront capital cost is a major LCOE contribution
• O&M increases as storage capital costs increases
HDV-PEM|Salt
• Low storage capital costs
• Energy dense fuel
• Minimal change in LCOE as duration increases
Scenario: Current Costs
LCOE breakdowns illustrate importance of low storage capital cost for longer durations
Storage capital cost is significant as
duration increases
LCOE breakdown
Financing & taxes
O&M
Discharging capital
Storage capital
Charging capital
Charging electricity
24h(1d)
48h(2d)
72h(3d)
96h(4d)
120h(5d)
144h(6d)
168h(7d)
333
0
50
100
150
200
250
300
350
400
LC
OE
of p
ea
k p
ow
er
(20
18
$/M
Wh
)L
CO
Eo
f p
ea
k p
ow
er
(20
18
$/M
Wh
)
Storage capital cost is minimal so LCOE
is insensitive to duration
NREL | 13
12h 18h 24h(1d)
30h 36h 42h 48h(2d)
HDV-PEM|Salt
HDV-PEM|Pipes
Stat-PEM|Salt
H2-CC|Salt
NG-CC
NG-CT
NG-CC|CCS
Eth-CC
PHS
A-CAES|Salt
D-CAES|Salt
VRB
P-TES
0
100
200
300
400
500
600
LC
OE
(20
18
$/M
Wh
)
Discharge duration at full power
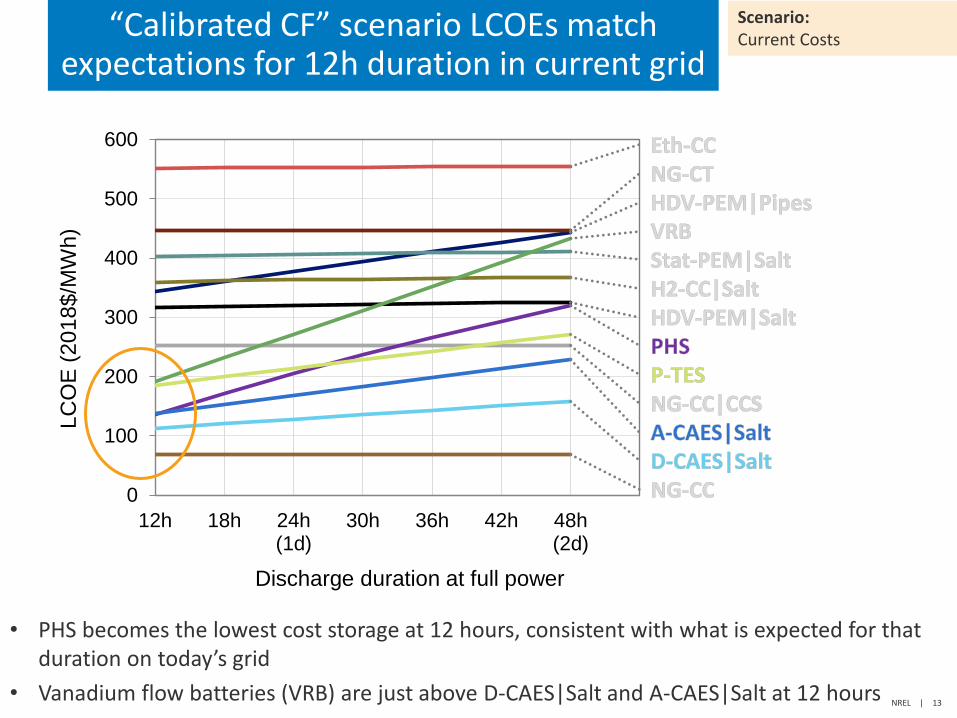
• PHS becomes the lowest cost storage at 12 hours, consistent with what is expected for that duration on today’s grid
• Vanadium flow batteries (VRB) are just above D-CAES|Salt and A-CAES|Salt at 12 hours
Scenario: Current Costs
“Calibrated CF” scenario LCOEs match expectations for 12h duration in current grid
NREL | 14
48h(2d)
72h(3d)
96h(4d)
120h(5d)
144h(6d)
168h(7d)
HDV-PEM|Salt
HDV-PEM|Pipes
Stat-PEM|Salt
H2-CC|Salt
NG-CC
NG-CT
NG-CC|CCS
Eth-CC
PHS
A-CAES|Salt
D-CAES|Salt
VRB
P-TES
0
200
400
600
800
1,000
1,200
LC
OE
(20
18
$/M
Wh
)
Discharge duration at full power
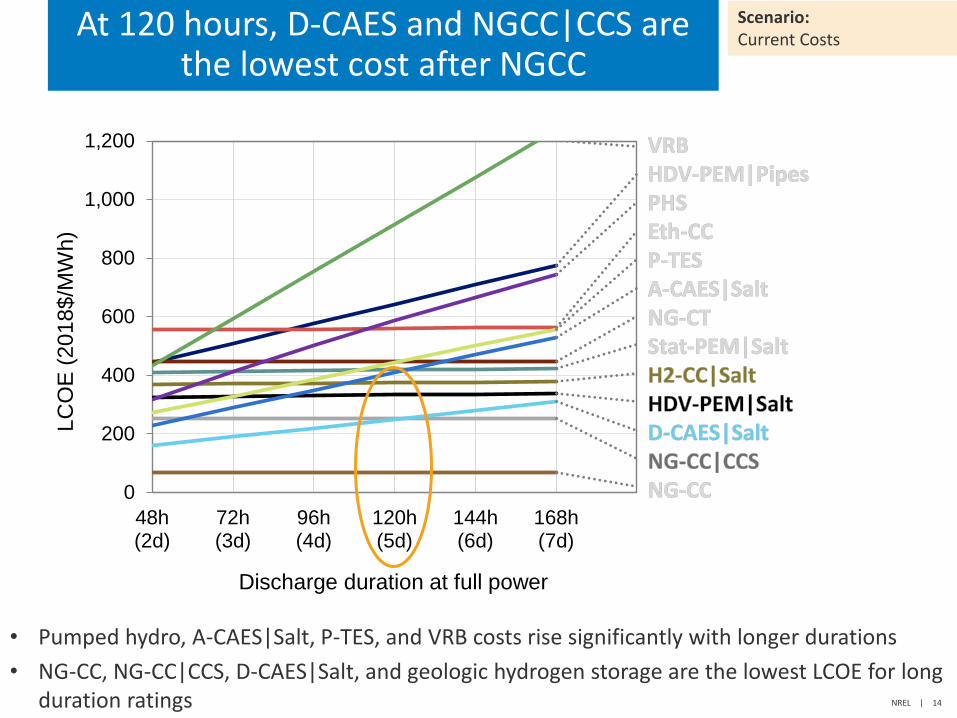
• Pumped hydro, A-CAES|Salt, P-TES, and VRB costs rise significantly with longer durations
• NG-CC, NG-CC|CCS, D-CAES|Salt, and geologic hydrogen storage are the lowest LCOE for long duration ratings
Scenario: Current Costs
At 120 hours, D-CAES and NGCC|CCS are the lowest cost after NGCC
NREL | 15
Next, let’s evaluate the Future Cost scenario
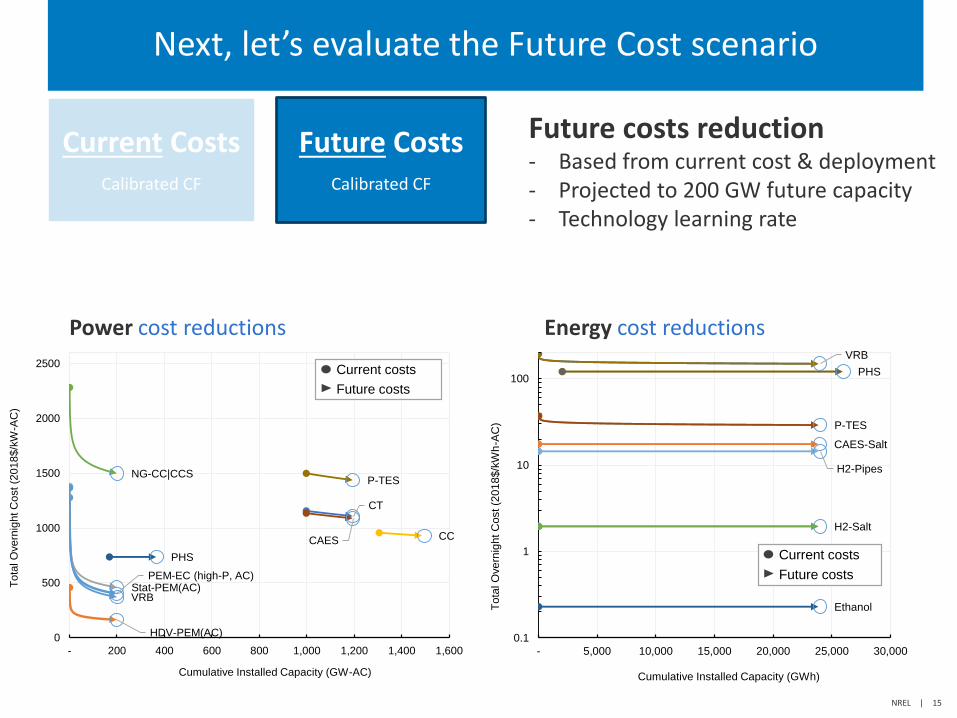
Future costs reduction- Based from current cost & deployment- Projected to 200 GW future capacity- Technology learning rate
Power cost reductions Energy cost reductions
Current CostsCalibrated CF
Future CostsCalibrated CF
PEM-EC (high-P, AC)
HDV-PEM(AC)
Stat-PEM(AC)
CC
CT
NG-CC|CCS
PHS
CAES
VRB
P-TES
0
500
1000
1500
2000
2500
- 200 400 600 800 1,000 1,200 1,400 1,600
To
tal O
ve
rnig
ht C
ost (2
01
8$
/kW
-AC
)
Cumulative Installed Capacity (GW-AC)
Current costs
Future costs
H2-Salt
CAES-Salt
P-TES
PHS
VRB
Ethanol
H2-Pipes
0.1
1
10
100
- 5,000 10,000 15,000 20,000 25,000 30,000
To
tal O
ve
rnig
ht C
ost (2
01
8$
/kW
h-A
C)
Cumulative Installed Capacity (GWh)
Current costs
Future costs
NREL | 16
12h 18h 24h(1d)
30h 36h 42h 48h(2d)
HDV-PEM|Salt
HDV-PEM|Pipes
Stat-PEM|Salt
H2-CC|Salt
NG-CC|CCS
Eth-CC
PHS
A-CAES|Salt
VRB
P-TES
0
100
200
300
400
500
600
LC
OE
(20
18
$/M
Wh
)
Discharge duration at full power
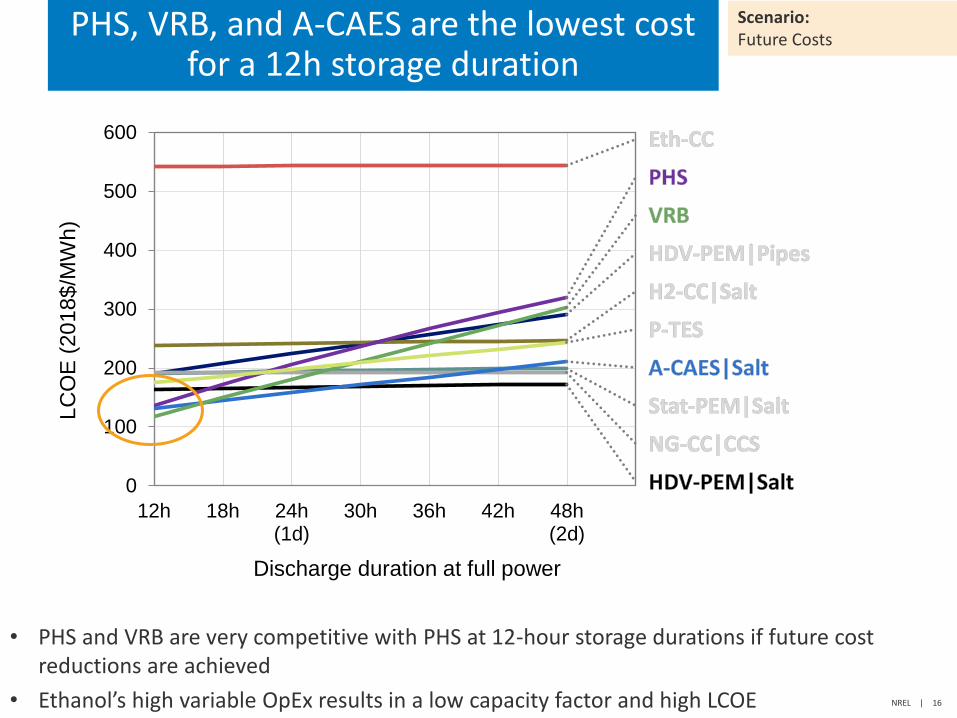
• PHS and VRB are very competitive with PHS at 12-hour storage durations if future cost reductions are achieved
• Ethanol’s high variable OpEx results in a low capacity factor and high LCOE
Scenario: Future Costs
PHS, VRB, and A-CAES are the lowest cost for a 12h storage duration
NREL | 17
48h(2d)
72h(3d)
96h(4d)
120h(5d)
144h(6d)
168h(7d)
HDV-PEM|Salt
HDV-PEM|Pipes
Stat-PEM|Salt
H2-CC|Salt
NG-CC|CCS
Eth-CC
PHS
A-CAES|Salt
VRB
P-TES
0
200
400
600
800
1,000
1,200
LC
OE
(20
18
$/M
Wh
)
Discharge duration at full power
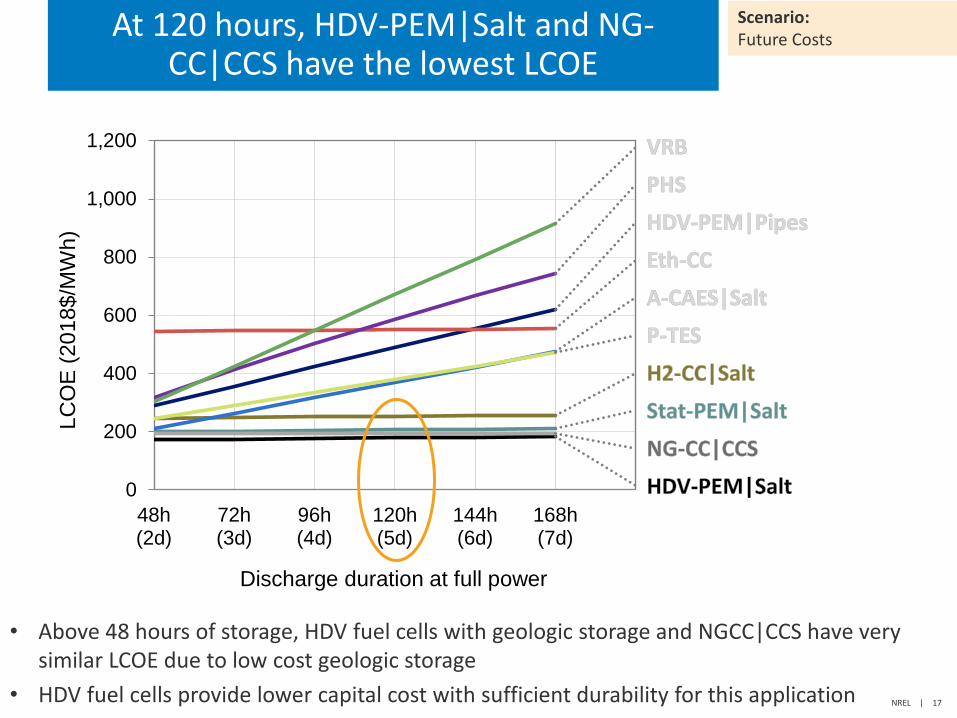
• Above 48 hours of storage, HDV fuel cells with geologic storage and NGCC|CCS have very similar LCOE due to low cost geologic storage
• HDV fuel cells provide lower capital cost with sufficient durability for this application
Scenario: Future Costs
At 120 hours, HDV-PEM|Salt and NG-CC|CCS have the lowest LCOE
NREL | 18
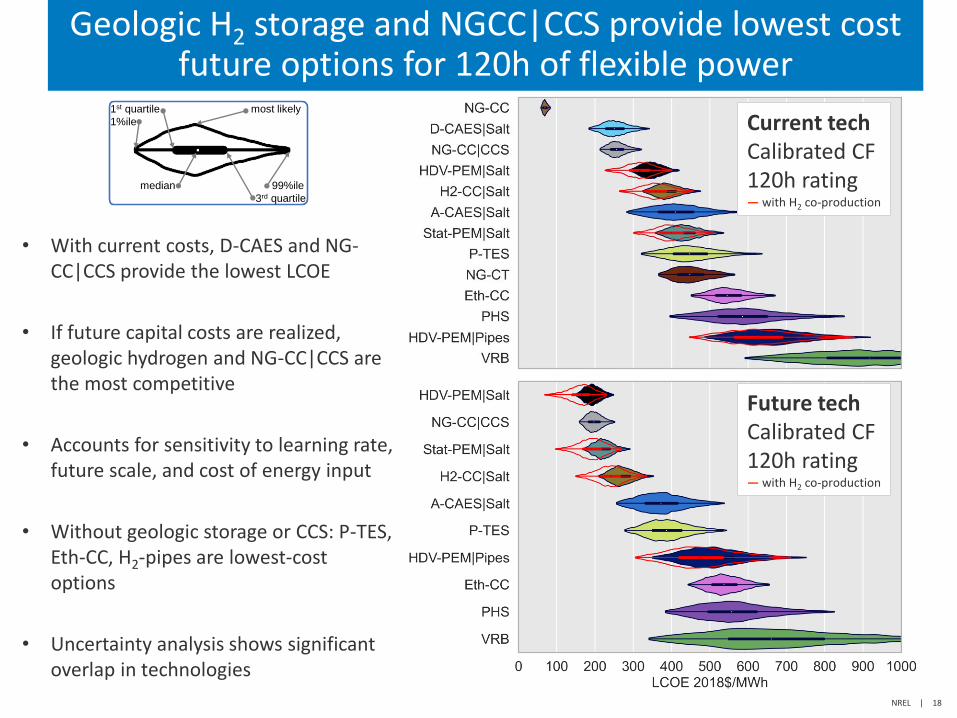
• With current costs, D-CAES and NG-CC|CCS provide the lowest LCOE
• If future capital costs are realized, geologic hydrogen and NG-CC|CCS are the most competitive
• Accounts for sensitivity to learning rate, future scale, and cost of energy input
• Without geologic storage or CCS: P-TES, Eth-CC, H2-pipes are lowest-cost options
• Uncertainty analysis shows significant overlap in technologies
Geologic H2 storage and NGCC|CCS provide lowest cost future options for 120h of flexible power
Current techCalibrated CF120h rating― with H2 co-production
Future techCalibrated CF120h rating― with H2 co-production
1st quartile most likely
1%ile
median 99%ile
3rd quartile
NREL | 19
Outline
• Methods
• Results
• StoreFAST modelling tool & demo
NREL | 20
Store-FAST Purpose
• Provide consistent framework for evaluation of utility scale flexible power
– Energy storage systems
– Flexible power generators
• Allow side-by-side evaluation of diverse technology options
• Incorporate use profiles informed by grid models
• Provide risk analysis based on for variability and uncertainty of inputs
NREL | 21
Caveats and Limitations
• The model attributes cost to energy and hydrogen co-products only. Revenue is not modeled from other possible value streams:
– ancillary services
– transmission deferment
• Model reflects an 85% renewable grid scenario.
• Model can use simple amortization of any refurbishment costs (it does not perform detailed capitalization of refurbishment costs such as stack replacements, battery replacements)
NREL | 22
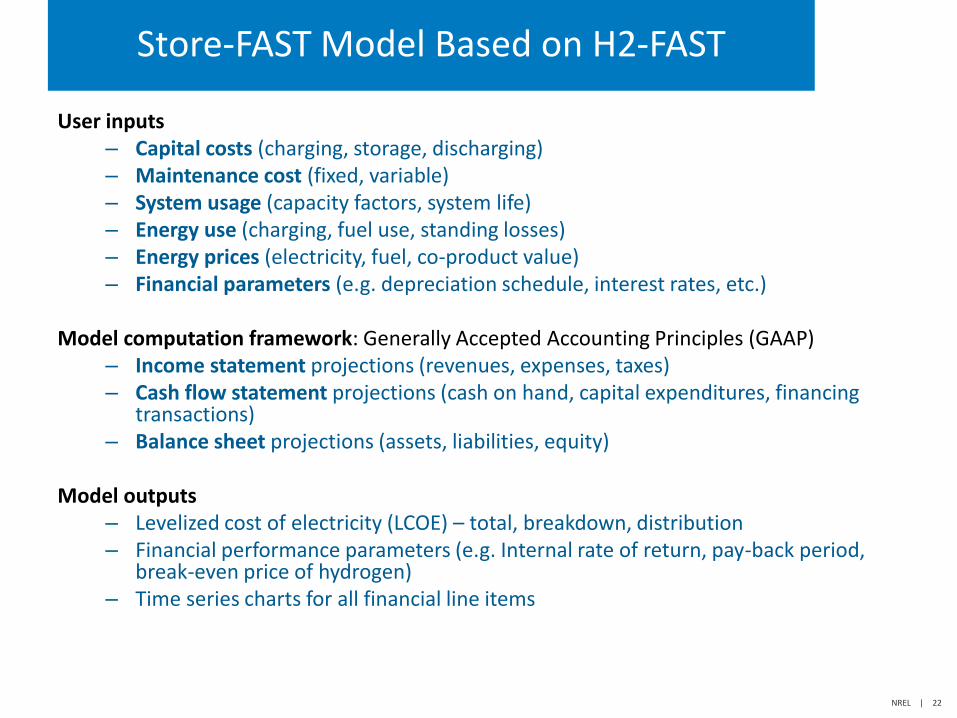
Store-FAST Model Based on H2-FAST
User inputs– Capital costs (charging, storage, discharging)– Maintenance cost (fixed, variable)– System usage (capacity factors, system life)– Energy use (charging, fuel use, standing losses) – Energy prices (electricity, fuel, co-product value)– Financial parameters (e.g. depreciation schedule, interest rates, etc.)
Model computation framework: Generally Accepted Accounting Principles (GAAP)– Income statement projections (revenues, expenses, taxes)– Cash flow statement projections (cash on hand, capital expenditures, financing
transactions)– Balance sheet projections (assets, liabilities, equity)
Model outputs– Levelized cost of electricity (LCOE) – total, breakdown, distribution– Financial performance parameters (e.g. Internal rate of return, pay-back period,
break-even price of hydrogen)– Time series charts for all financial line items
NREL | 23
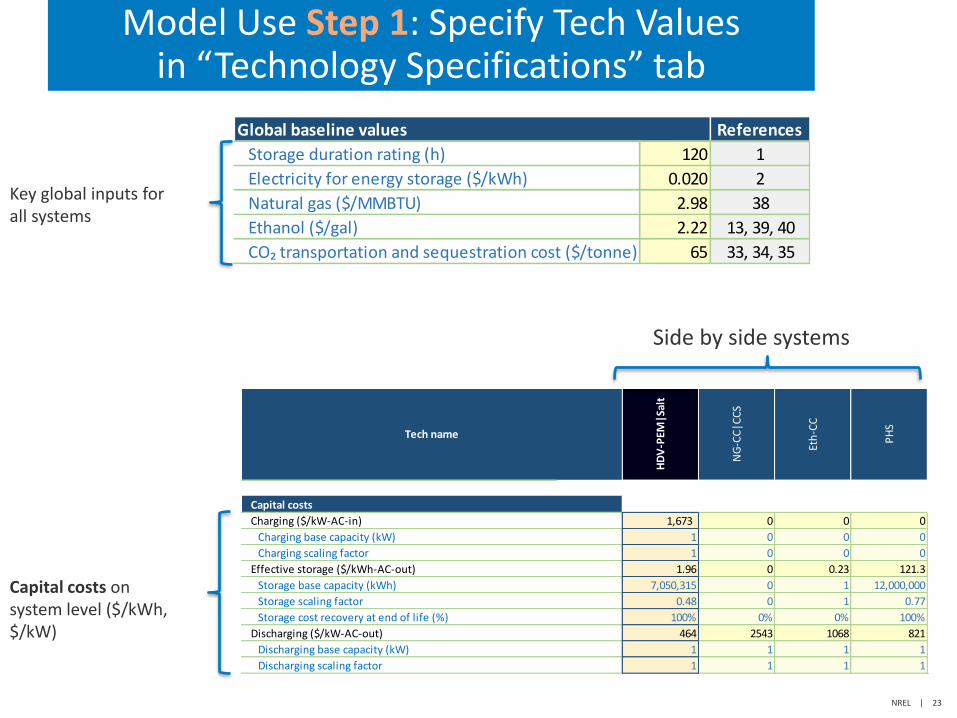
Model Use Step 1: Specify Tech Valuesin “Technology Specifications” tab
Global baseline values References
Storage duration rating (h) 120 1
Electricity for energy storage ($/kWh) 0.020 2
Natural gas ($/MMBTU) 2.98 38
Ethanol ($/gal) 2.22 13, 39, 40
CO₂ transportation and sequestration cost ($/tonne) 65 33, 34, 35
Key global inputs for all systems
HD
V-P
EM|S
alt
NG
-CC
|CC
S
Eth
-CC
PH
S
1,673 0 0 0
1 0 0 0
1 0 0 0
1.96 0 0.23 121.3
7,050,315 0 1 12,000,000
0.48 0 1 0.77
100% 0% 0% 100%
464 2543 1068 821
1 1 1 1
1 1 1 1
Charging base capacity (kW)
Charging scaling factor
Storage base capacity (kWh)
Storage scaling factor
Storage cost recovery at end of life (%)
Discharging base capacity (kW)
Discharging scaling factor
Discharging ($/kW-AC-out)
Tech name
Capital costs
Charging ($/kW-AC-in)
Effective storage ($/kWh-AC-out)
Capital costs on system level ($/kWh, $/kW)
Side by side systems
NREL | 24
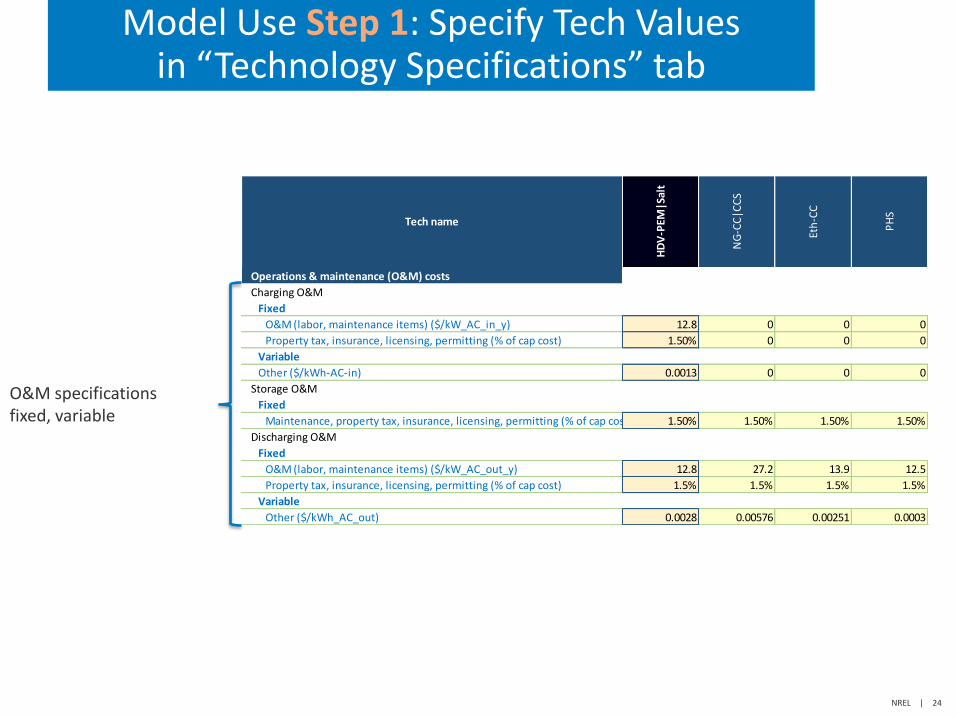
Model Use Step 1: Specify Tech Valuesin “Technology Specifications” tab
HD
V-P
EM|S
alt
NG
-CC
|CC
S
Eth
-CC
PH
S
12.8 0 0 0
1.50% 0 0 0
0.0013 0 0 0
1.50% 1.50% 1.50% 1.50%
12.8 27.2 13.9 12.5
1.5% 1.5% 1.5% 1.5%
0.0028 0.00576 0.00251 0.0003
Charging O&M
Storage O&M
Discharging O&M
Variable
Tech name
Other ($/kWh_AC_out)
Fixed
O&M (labor, maintenance items) ($/kW_AC_out_y)
Property tax, insurance, licensing, permitting (% of cap cost)
Operations & maintenance (O&M) costs
Fixed
Maintenance, property tax, insurance, licensing, permitting (% of cap cost)
Other ($/kWh-AC-in)
O&M (labor, maintenance items) ($/kW_AC_in_y)
Property tax, insurance, licensing, permitting (% of cap cost)
Fixed
Variable
O&M specifications fixed, variable
NREL | 25
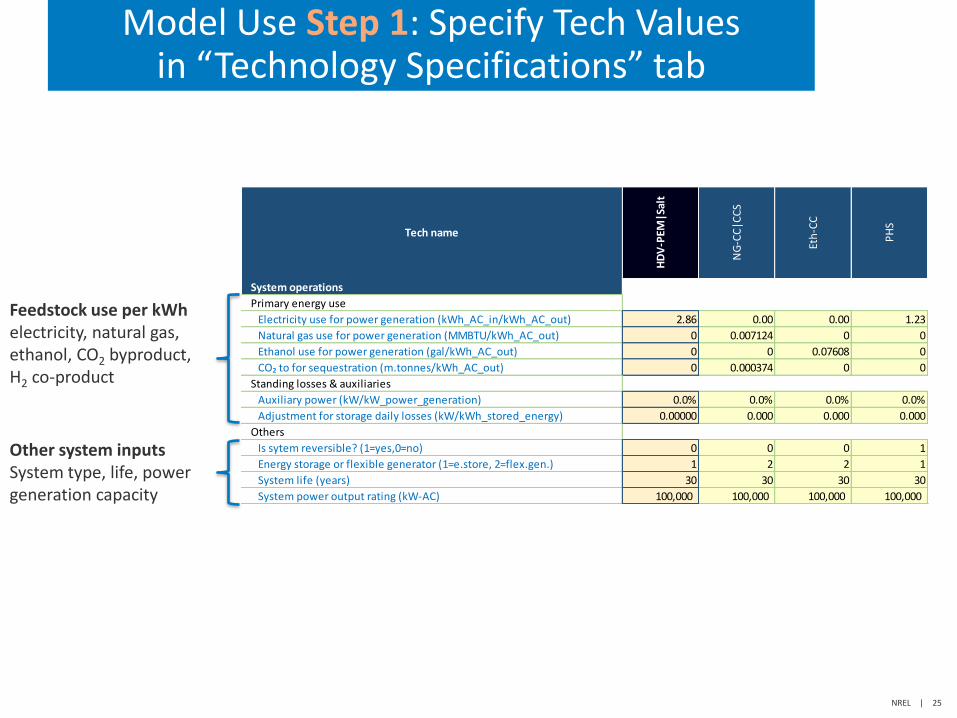
Model Use Step 1: Specify Tech Valuesin “Technology Specifications” tab
HD
V-P
EM|S
alt
NG
-CC
|CC
S
Eth
-CC
PH
S
2.86 0.00 0.00 1.23
0 0.007124 0 0
0 0 0.07608 0
0 0.000374 0 0
0.0% 0.0% 0.0% 0.0%
0.00000 0.000 0.000 0.000
0 0 0 1
1 2 2 1
30 30 30 30
100,000 100,000 100,000 100,000
Standing losses & auxiliaries
Others
Primary energy use
System operations
Tech name
Is sytem reversible? (1=yes,0=no)
Energy storage or flexible generator (1=e.store, 2=flex.gen.)
System life (years)
System power output rating (kW-AC)
Electricity use for power generation (kWh_AC_in/kWh_AC_out)
Natural gas use for power generation (MMBTU/kWh_AC_out)
Ethanol use for power generation (gal/kWh_AC_out)
CO₂ to for sequestration (m.tonnes/kWh_AC_out)
Auxiliary power (kW/kW_power_generation)
Adjustment for storage daily losses (kW/kWh_stored_energy)
Feedstock use per kWhelectricity, natural gas, ethanol, CO2 byproduct, H2 co-product
Other system inputsSystem type, life, power generation capacity
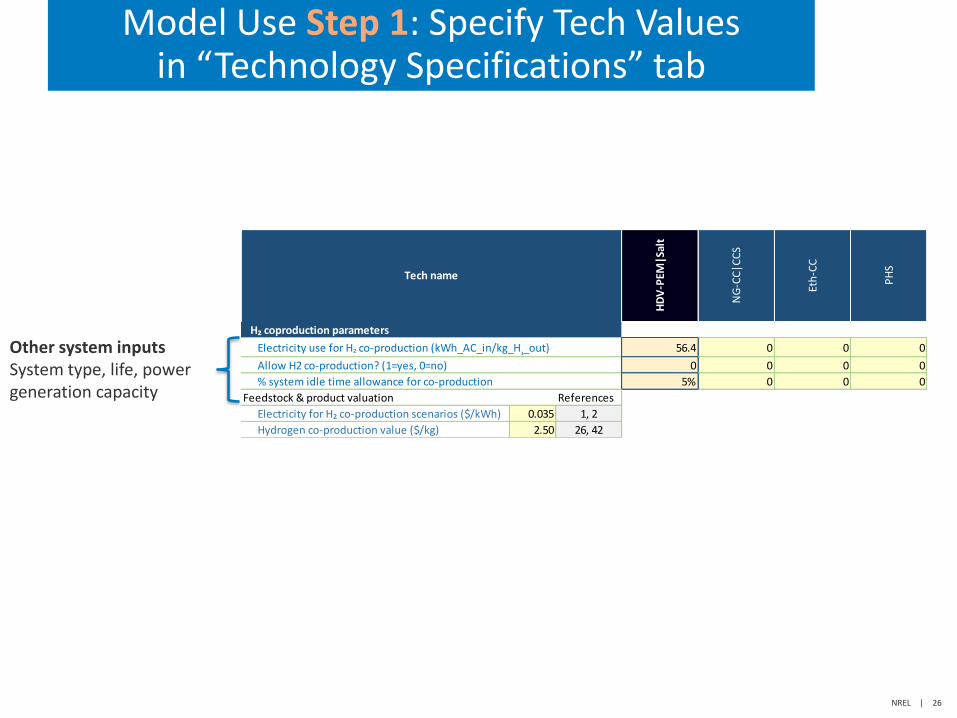
NREL | 26
Model Use Step 1: Specify Tech Valuesin “Technology Specifications” tab
HD
V-P
EM|S
alt
NG
-CC
|CC
S
Eth
-CC
PH
S
56.4 0 0 0
0 0 0 0
5% 0 0 0
Feedstock & product valuation References
Electricity for H₂ co-production scenarios ($/kWh) 0.035 1, 2
Hydrogen co-production value ($/kg) 2.50 26, 42
Tech name
% system idle time allowance for co-production
Electricity use for H₂ co-production (kWh_AC_in/kg_H₂_out)
H₂ coproduction parameters
Allow H2 co-production? (1=yes, 0=no)
Other system inputsSystem type, life, power generation capacity
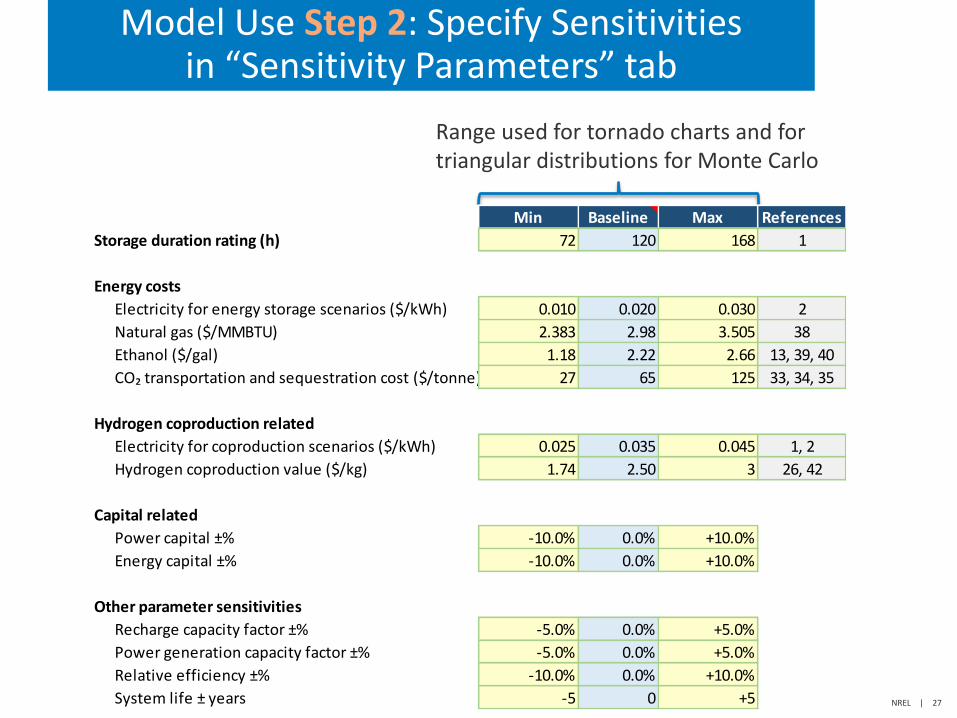
NREL | 27
Model Use Step 2: Specify Sensitivitiesin “Sensitivity Parameters” tab
Range used for tornado charts and for triangular distributions for Monte Carlo
Min Baseline Max References
Storage duration rating (h) 72 120 168 1
Energy costs
Electricity for energy storage scenarios ($/kWh) 0.010 0.020 0.030 2
Natural gas ($/MMBTU) 2.383 2.98 3.505 38
Ethanol ($/gal) 1.18 2.22 2.66 13, 39, 40
CO₂ transportation and sequestration cost ($/tonne) 27 65 125 33, 34, 35
Hydrogen coproduction related
Electricity for coproduction scenarios ($/kWh) 0.025 0.035 0.045 1, 2
Hydrogen coproduction value ($/kg) 1.74 2.50 3 26, 42
Capital related
Power capital ±% -10.0% 0.0% +10.0%
Energy capital ±% -10.0% 0.0% +10.0%
Other parameter sensitivities
Recharge capacity factor ±% -5.0% 0.0% +5.0%
Power generation capacity factor ±% -5.0% 0.0% +5.0%
Relative efficiency ±% -10.0% 0.0% +10.0%
System life ± years -5 0 +5
NREL | 28
Select system to plot
HDV-PEM|Salt
LCOE @ Baseline Scenario
$365/MWh
Update Tornado & Duration Plots: Run time ~2min
Net Debt Financing Expense
Net Equity Financing Expense
Capital Gains Taxes Payable
Income Taxes Payable
Discharging O&M
Storage O&M
Charging O&M
Discharging Cap
Storage Cap
Charging Cap
Electricity
Monetized Tax Losses
Sale Of Non-Depreciable Assets
-100
-50
0
50
100
150
200
250
300
350
400
8 24 40 56 72 88 104 120 136 152 168
LCO
E ($
/MW
h)
Duration rating (h)
Cost Break-Down: HDV-PEM|Salt
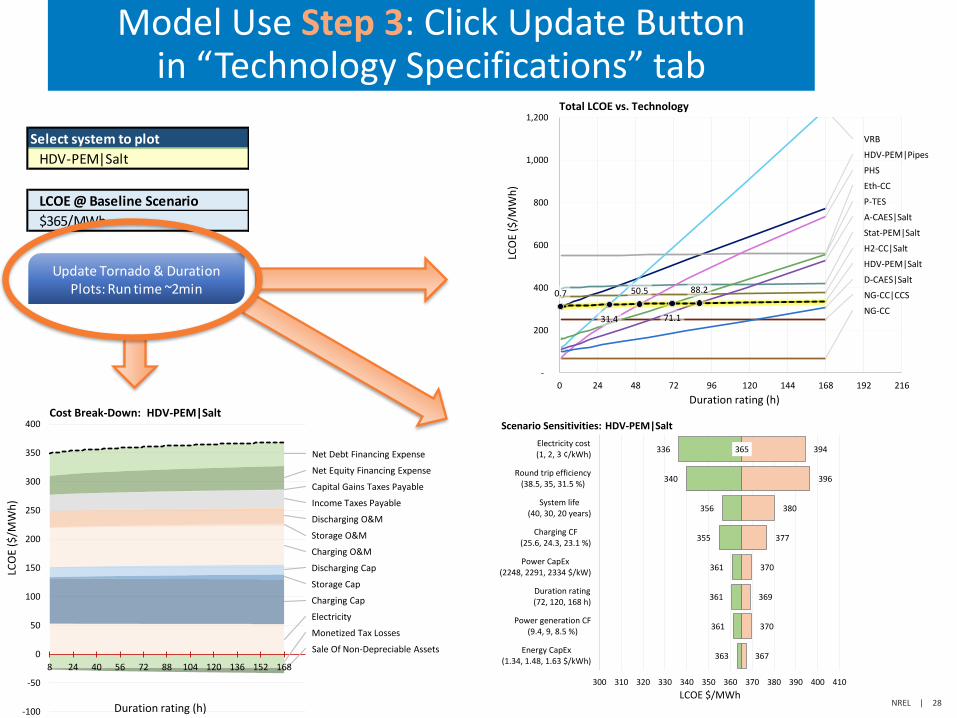
Model Use Step 3: Click Update Buttonin “Technology Specifications” tab
365336
340
356
355
361
361
361
363
394
396
380
377
370
369
370
367
300 310 320 330 340 350 360 370 380 390 400 410
Electricity cost(1, 2, 3 ¢/kWh)
Round trip efficiency(38.5, 35, 31.5 %)
System life(40, 30, 20 years)
Charging CF(25.6, 24.3, 23.1 %)
Power CapEx(2248, 2291, 2334 $/kW)
Duration rating(72, 120, 168 h)
Power generation CF(9.4, 9, 8.5 %)
Energy CapEx(1.34, 1.48, 1.63 $/kWh)
HDV-PEM|Salt
LCOE $/MWh
Scenario Sensitivities:
HDV-PEM|Salt
HDV-PEM|Pipes
Stat-PEM|Salt
H2-CC|Salt
NG-CC
NG-CC|CCS
Eth-CC
PHS
A-CAES|Salt
D-CAES|Salt
VRB
P-TES
31.4 71.1
0.7 50.5 88.2
-
200
400
600
800
1,000
1,200
0 24 48 72 96 120 144 168 192 216
Duration rating (h)
LCO
E ($
/MW
h)
Total LCOE vs. Technology
NREL | 29
Select system to plot
HDV-PEM|Salt
LCOE @ Baseline Scenario
$365/MWh
Update Tornado & Duration Plots: Run time ~2min
Net Debt Financing Expense
Net Equity Financing Expense
Capital Gains Taxes Payable
Income Taxes Payable
Discharging O&M
Storage O&M
Charging O&M
Discharging Cap
Storage Cap
Charging Cap
Electricity
Monetized Tax Losses
Sale Of Non-Depreciable Assets
-100
-50
0
50
100
150
200
250
300
350
400
8 24 40 56 72 88 104 120 136 152 168
LCO
E ($
/MW
h)
Duration rating (h)
Cost Break-Down: HDV-PEM|Salt
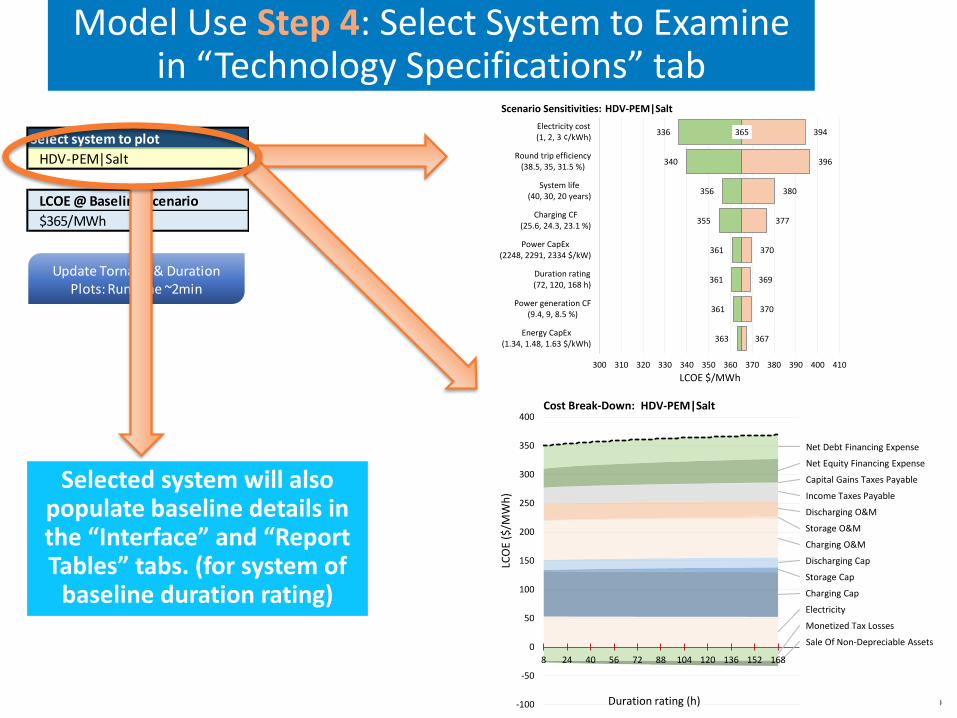
Model Use Step 4: Select System to Examinein “Technology Specifications” tab
365336
340
356
355
361
361
361
363
394
396
380
377
370
369
370
367
300 310 320 330 340 350 360 370 380 390 400 410
Electricity cost(1, 2, 3 ¢/kWh)
Round trip efficiency(38.5, 35, 31.5 %)
System life(40, 30, 20 years)
Charging CF(25.6, 24.3, 23.1 %)
Power CapEx(2248, 2291, 2334 $/kW)
Duration rating(72, 120, 168 h)
Power generation CF(9.4, 9, 8.5 %)
Energy CapEx(1.34, 1.48, 1.63 $/kWh)
HDV-PEM|Salt
LCOE $/MWh
Scenario Sensitivities:
Selected system will also populate baseline details in the “Interface” and “Report Tables” tabs. (for system of
baseline duration rating)
NREL | 30
HDV-PEM|Salt
HDV-PEM|Pipes
Stat-PEM|Salt
H2-CC|Salt
NG-CC
NG-CC|CCS
Eth-CC
PHS
A-CAES|Salt
D-CAES|Salt
VRB
P-TES
0 100 200 300 400 500 600 700 800 900 1000
LCOE $/MWh
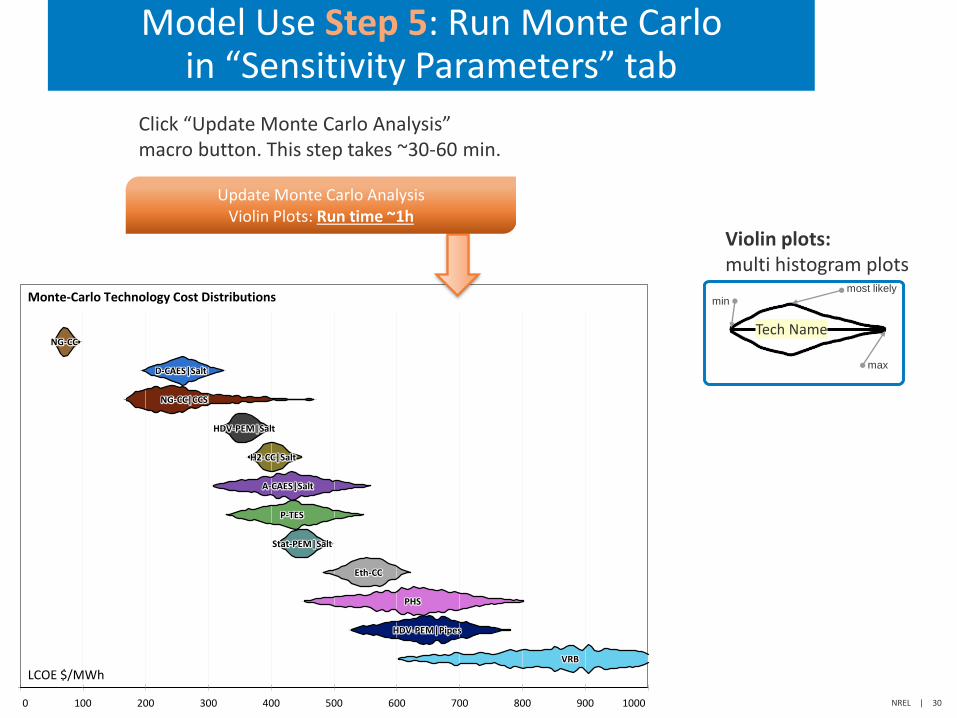
Monte-Carlo Technology Cost Distributions
Model Use Step 5: Run Monte Carloin “Sensitivity Parameters” tab
Click “Update Monte Carlo Analysis” macro button. This step takes ~30-60 min.
Update Monte Carlo AnalysisViolin Plots: Run time ~1h
most likely
min
max
Tech Name
Violin plots:multi histogram plots
NREL | 31
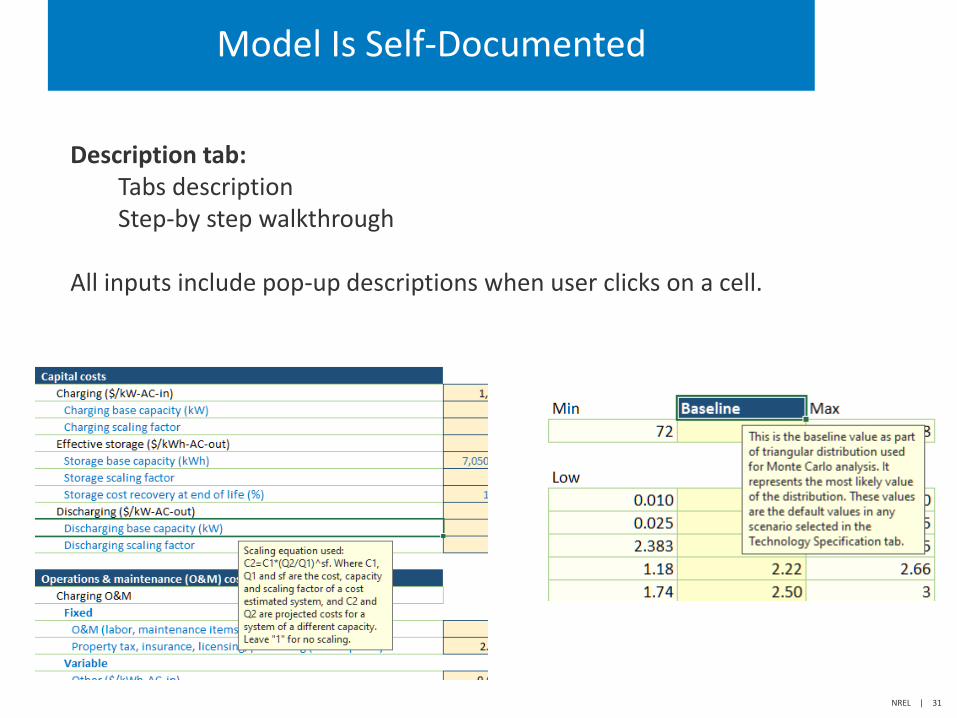
Model Is Self-Documented
Description tab: Tabs descriptionStep-by step walkthrough
All inputs include pop-up descriptions when user clicks on a cell.
NREL | 32
Model Demonstration: Adding H2 Coproduction
NREL | 33
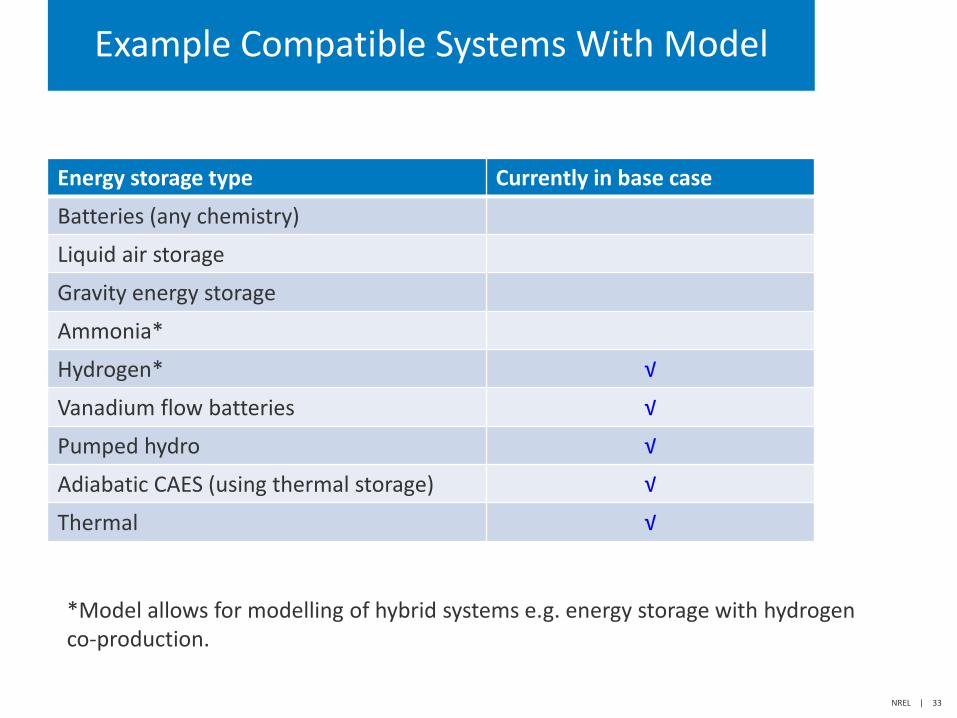
Example Compatible Systems With Model
Energy storage type Currently in base case
Batteries (any chemistry)
Liquid air storage
Gravity energy storage
Ammonia*
Hydrogen* √
Vanadium flow batteries √
Pumped hydro √
Adiabatic CAES (using thermal storage) √
Thermal √
*Model allows for modelling of hybrid systems e.g. energy storage with hydrogen co-production.
NREL | 34
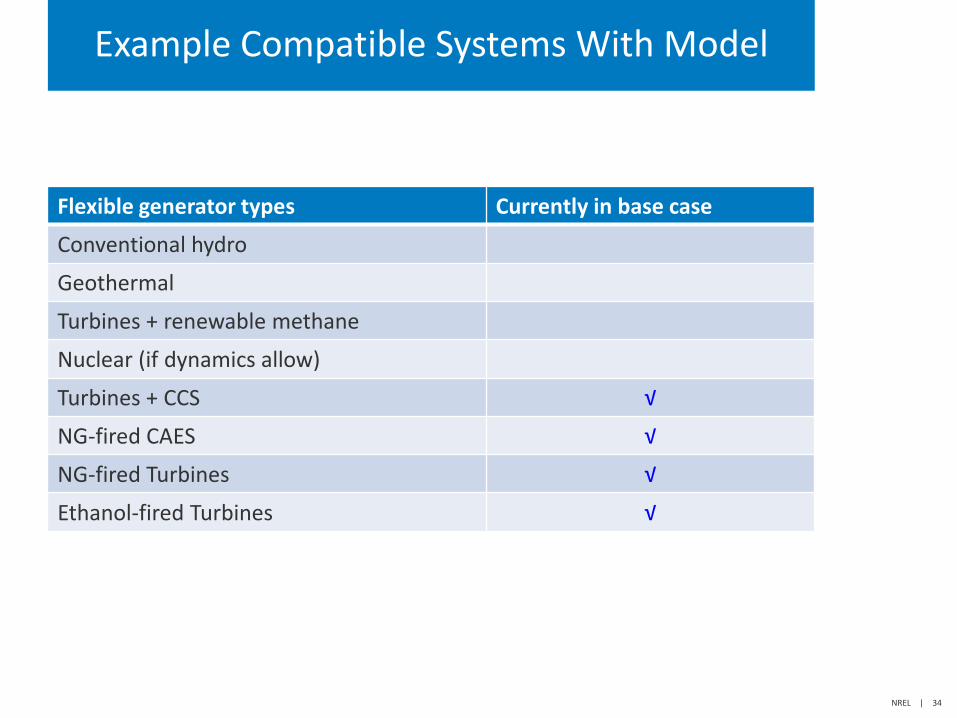
Example Compatible Systems With Model
Flexible generator types Currently in base case
Conventional hydro
Geothermal
Turbines + renewable methane
Nuclear (if dynamics allow)
Turbines + CCS √
NG-fired CAES √
NG-fired Turbines √
Ethanol-fired Turbines √
www.nrel.gov
Thank You
This work was authored by the National Renewable Energy Laboratory, operated by Alliance for Sustainable Energy, LLC, for the U.S. Department of Energy (DOE) under Contract No. DE-AC36-08GO28308. Funding provided by U.S. Department of Energy Office of Energy Efficiency and Renewable Energy Fuel Cell Technologies Office. The views expressed in the article do not necessarily represent the views of the DOE or the U.S. Government. The U.S. Government retains and the publisher, by accepting the article for publication, acknowledges that the U.S. Government retains a nonexclusive, paid-up, irrevocable, worldwide license to publish or reproduce the published form of this work, or allow others to do so, for U.S. Government purposes.
Model link: https://www.nrel.gov/storage/storefast.html

36OFFICE OF ENERGY EFFICIENCY & RENEWABLE ENERGY HYDROGEN AND FUEL CELL TECHNOLOGIES OFFICEU.S. DEPARTMENT OF ENERGY
The #H2IQ HourQ&A
Please type your questions into the Q&A Box

37OFFICE OF ENERGY EFFICIENCY & RENEWABLE ENERGY HYDROGEN AND FUEL CELL TECHNOLOGIES OFFICEU.S. DEPARTMENT OF ENERGY
The #H2IQ Hour
Thank you for your participation!
Learn more:
energy.gov/fuelcellshydrogen.energy.gov


![I like [ hour / our ] team the best. hour our](https://img.pdfslide.us/doc/110x75/56816195550346895dd13b78/i-like-hour-our-team-the-best-hour-our-56cb9fe95689d.jpg)