Embed Size (px)
Citation preview
THE GUILFORD
SCHOOL READINESS
REPORT CARD
A Snapshot of the Status of
Young Children in the County
and the Community’s Progress
in Preparing Them for School
Spring | Summer
Guilford Education Alliance

THE GUILFORD
SCHOOL READINESS
REPORT CARD
A Snapshot of the Status of Young Children in the County and
the Community’s Progress in Preparing Them for School
Guilford Education Alliance
Spring | Summer
TH
E G
UIL
FO
RD
SC
HO
OL
RE
AD
INE
SS
RE
PO
RT
CA
RD
20
11
4
PURPOSE
The purpose of the School Readiness Report Card is
to provide data on the health and well being of young
children in Guilford County, and to assess the
community’s strengths and challenges in preparing
our children for school. The intent of the Report Card
is to help policy makers, community leaders, service
providers, and concerned citizens identify areas in
need of intervention, develop or improve prevention
programs and services, reduce barriers in access to
needed services, and monitor progress and trends
over time. The indicators used in the Report Cards
draw primarily on administrative data routinely
collected by the service community on system
performance (e.g. number of children receiving
specific services), and individual-level information on
child development. The report also draws on findings
from regional and national surveys that collect
information on the attitudes, characteristics or
behaviors of a sample to make conclusions about
a larger group of people. The content of the report
focuses on Guilford County although state indicators
are presented for comparison.
The 2011 Report Card builds on the first report
published in 2007, but focuses on data for the
2009/2010 school year and places additional
emphasis on early literacy as a foundation for later
school success. Copies of the 2007 Report Card are
available at: http://www.guilfordeducationalliance.
org/resources/documents/2007/2007-School-
Readiness-Report-Card.pdf.
CONTEXT OF THE REPORT
The Report Card is being written at a time of social
and policy change that is creating both challenges and
opportunities for those focused on providing school
readiness support to young children and their families
in our county. How the community responds to these
changes has important implications for families with
young children, the transition to school, academic
achievement, and later success. These changes are
outlined below.
1 . FAMILY POVERTY. In 2009 Guilford County
was home to close to 114,000 children aged 17 years
and under, about one-third of whom were under 6
years old. As in other parts of the state, Guilford
County has been affected by the recession and
many families have experienced drops in income
and financial instability. For example, in 2009 the
proportion of children in poverty was 22.1% (up from
20.5% in 2007). A new trend is an increase in the
proportion of grandparents with primary care-giving
responsibility for their grandchildreni. According
to the Census, 56.6% of grandparents in Guilford
County had varying levels of responsibility for their
grandchildren, and 6.8% lived with a grandchildii.
The costs associated with caring for grandchildren
(and sometimes adult children) can place a burden
on grandparents on a fixed income and with few
prospects of re-entering the workforce. As in other
parts of the country, rates of poverty were highest
for female householder families (21%), families
with children under 18 years old (21%), and racial
and ethnic minorities (Native American at 46.6%,
Hispanics at 27.3%, African American at 25.1%)iii iv.
TH
E G
UIL
FO
RD
SC
HO
OL
RE
AD
INE
SS
RE
PO
RT
CA
RD
20
11
5
2. FAMILY AND CHILD DIVERSITY. Guilford County has a racially and ethnically diverse
population, and children in Guilford County Schools
(K-12) represent 142 ethnic and cultural backgrounds
and speak 150 dialects or languagesv. Much of
the change in the racial and ethnic diversity of our
schools has occurred in the last decade and is due to
an increase in the number of children of immigrant
newcomers. Unlike other regions of the country,
southern states do not have a history of immigration
and are challenged in responding to this new reality.
Although immigrants have diverse backgrounds and
trajectories (e.g. educational attainment, country of
origin, reasons for coming, languages spoken, and
pre-immigration experience), children in immigrant
families are more likely to experience poverty
than their native-born and non-minority peers.
Furthermore, immigrants and their children face the
additional challenge of learning a new language and
culture, and adapting to new norms about adult-child
and family school (or institutional) interactions.vi vii
Effective school readiness efforts must be responsive
to the social, cultural, and linguistic backgrounds of
families and children.
3. BUDGET SHORTFALLS. State policymakers
play an important role in allocating funding for school
readiness efforts. More at Four and Smart Start are
two State funded early care and education programs
that provide quality services to children and have
been shown to improve test scores and reduce the
achievement gap between low-and middle-income
children.viii However, budget cuts introduced in the
last three years are challenging the system. In 2009-
2010 the North Carolina Public School biennial budget
was cut by 12.6% and in 2010/2011 it was cut by an
additional 2.73%.ix In June 2011 the North Carolina
General Assembly approved a budget that cut funding
for the More at Four and Smart Start programs by 20%.
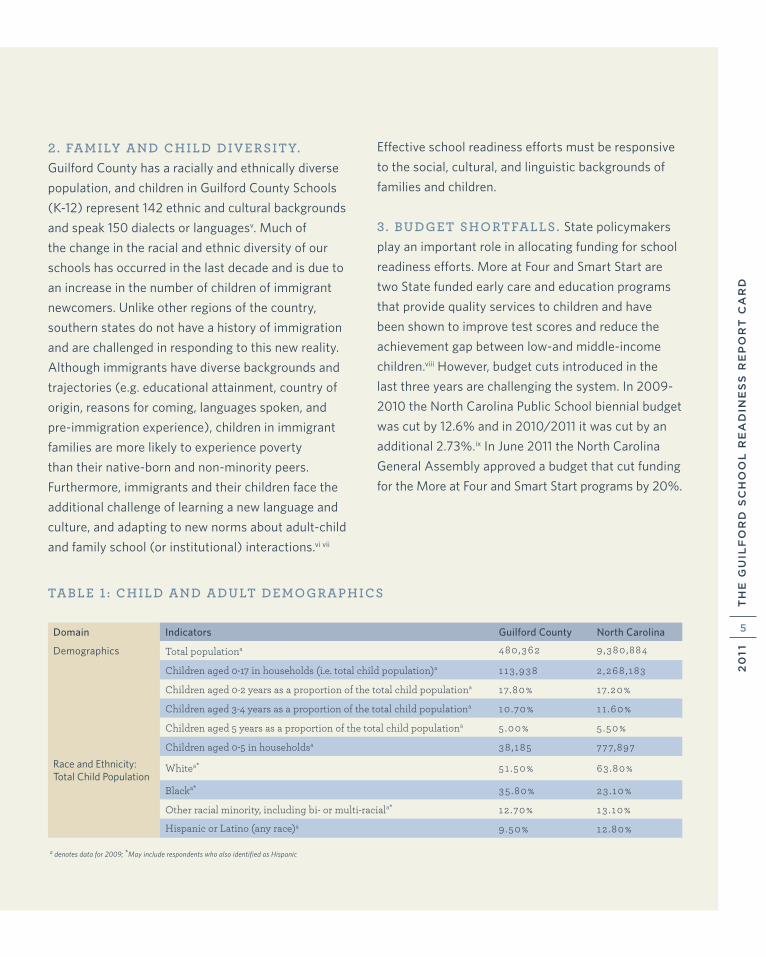
TABLE 1 : CHILD AND ADULT DEMOGRAPHICS
Domain Indicators Guilford County North Carolina
Total populationa 480 ,362 9 ,380 ,884
Children aged 0-17 in households (i.e. total child population)a 113 ,938 2 ,268 , 183
Children aged 0-2 years as a proportion of the total child populationa 17.80% 17.20%
Children aged 3-4 years as a proportion of the total child populationa 10 .70% 11 .60%
Children aged 5 years as a proportion of the total child populationa 5 .00% 5 .50%
Children aged 0-5 in householdsa 38 , 185 777,897
Whitea* 51 .50% 63 .80%
Blacka* 35 .80% 23 .10%
Other racial minority, including bi- or multi-raciala* 12 .70% 13 . 10%
Hispanic or Latino (any race)a 9 .50% 12 .80%
a denotes data for 2009; *May include respondents who also identified as Hispanic
Race and Ethnicity: Total Child Population
Demographics
TH
E G
UIL
FO
RD
SC
HO
OL
RE
AD
INE
SS
RE
PO
RT
CA
RD
20
11
6
SCHOOL READINESS EQUATION
School entry is a major transition for children aged
4- to 5-years old, and to be successful, children
must be equipped to deal with the demands of the
school environment. Children’s ability to meet these
demands and succeed in school depends to some
extent on their own characteristics and abilities,
but also depends on their preparation at home,
their child-care experiences, and their exposure to
broader opportunities that encourage exploration
and learning.x In other words, preparation for school
begins at birth, and research shows that investments
in children during the early years have long-term
effects on child health, social and
emotional development, and school
success.xi However not all children
start school ready to succeed.
Children from low-income families
are more likely than their middle-
income peers to start school
with lower language proficiency
and lags in social-emotional
development (e.g. lowered
capacity to control behavior)
that interfere with learning.
Achievement gaps that
become apparent in
kindergarten tend to
widen over time.xii xiii
Research shows that efforts to improve school
readiness should focus both on children and their
environments of life (namely, families, communities,
and schools). Consistent with this view, the Report
Card uses an equation developed by the School
Readiness Indicators Initiative and a set of variables
identified by a committee of early childhood
professionals led by the North Carolina Division
of Public Health and the North Carolina Pediatrics
Society. Guilford Education Alliance used these
indicators as the basis for the first School Readiness
Report Card in 2007:
READY FAMILIES: ability of families to
provide developmental opportunities for
children.
+ READY COMMUNITIES: range and
quality of resources and supports available to
families with young children.
+ READY SCHOOLS: critical
elements of schools that influence
child development and school
success.
= READY CHILDREN: acquisition of basic skills
and characteristics that
influence school success.
TH
E G
UIL
FO
RD
SC
HO
OL
RE
AD
INE
SS
RE
PO
RT
CA
RD
20
11
7
READY FAMILIES
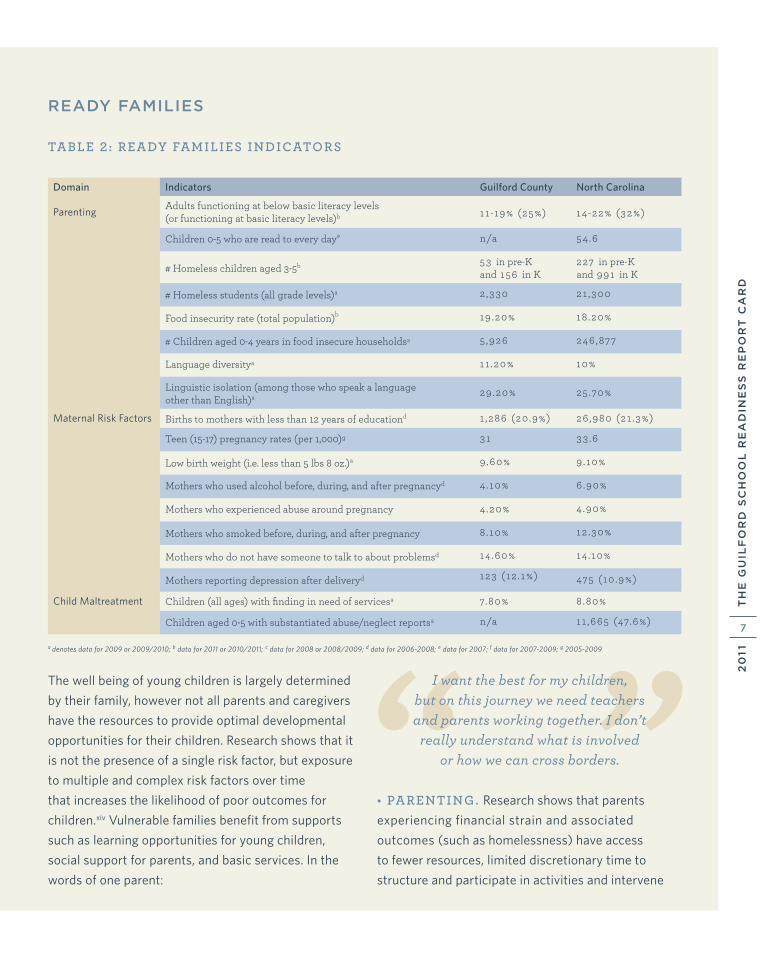
TABLE 2: READY FAMILIES INDICATORS
“ ”The well being of young children is largely determined
by their family, however not all parents and caregivers
have the resources to provide optimal developmental
opportunities for their children. Research shows that it
is not the presence of a single risk factor, but exposure
to multiple and complex risk factors over time
that increases the likelihood of poor outcomes for
children.xiv Vulnerable families benefit from supports
such as learning opportunities for young children,
social support for parents, and basic services. In the
words of one parent:
I want the best for my children, but on this journey we need teachers and parents working together. I don’t
really understand what is involved or how we can cross borders.
• PARENTING. Research shows that parents
experiencing financial strain and associated
outcomes (such as homelessness) have access
to fewer resources, limited discretionary time to
structure and participate in activities and intervene
Domain Indicators Guilford County North Carolina
ParentingAdults functioning at below basic literacy levels (or functioning at basic literacy levels)b 11 -19% (25%) 14-22% (32%)
Children 0-5 who are read to every daye n/a 54 .6
# Homeless children aged 3-5b 53 in pre-K and 156 in K
227 in pre-K and 991 in K
# Homeless students (all grade levels)a 2 ,330 21 ,300
Food insecurity rate (total population)b 19 .20% 18 .20%
# Children aged 0-4 years in food insecure householdsa 5 ,926 246 ,877
Language diversitya 11 .20% 10%
Linguistic isolation (among those who speak a language other than English)a 29 .20% 25 .70%
Maternal Risk Factors Births to mothers with less than 12 years of educationd 1 ,286 (20 .9%) 26 ,980 (21 .3%)
Teen (15-17) pregnancy rates (per 1,000)g 31 33 .6
Low birth weight (i.e. less than 5 lbs 8 oz.)a 9 .60% 9 .10%
Mothers who used alcohol before, during, and after pregnancyd 4 . 10% 6 .90%
Mothers who experienced abuse around pregnancy 4 .20% 4 .90%
Mothers who smoked before, during, and after pregnancy 8 .10% 12 .30%
Mothers who do not have someone to talk to about problemsd 14 .60% 14 . 10%
Mothers reporting depression after deliveryd 123 (12 . 1%) 475 ( 10 .9%)
Child Maltreatment Children (all ages) with finding in need of servicesa 7.80% 8 .80%
Children aged 0-5 with substantiated abuse/neglect reportsa n/a 11 ,665 (47.6%)
a denotes data for 2009 or 2009/2010; b data for 2011 or 2010/2011; c data for 2008 or 2008/2009; d data for 2006-2008; e data for 2007; f data for 2007-2009; g 2005-2009
TH
E G
UIL
FO
RD
SC
HO
OL
RE
AD
INE
SS
RE
PO
RT
CA
RD
20
11
8
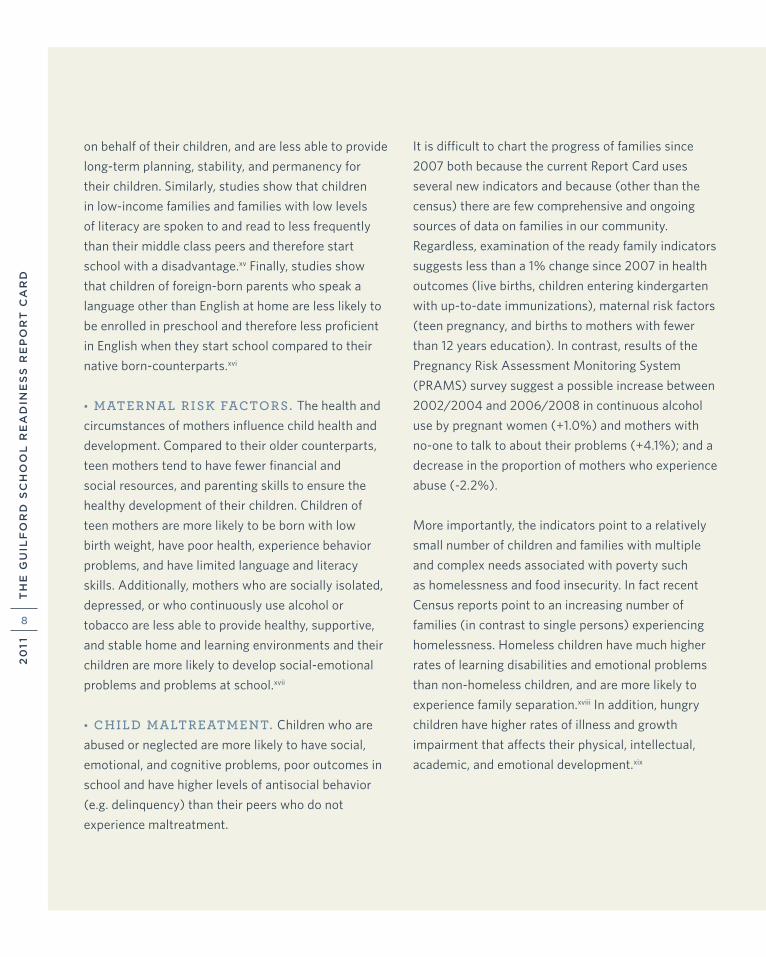
on behalf of their children, and are less able to provide
long-term planning, stability, and permanency for
their children. Similarly, studies show that children
in low-income families and families with low levels
of literacy are spoken to and read to less frequently
than their middle class peers and therefore start
school with a disadvantage.xv Finally, studies show
that children of foreign-born parents who speak a
language other than English at home are less likely to
be enrolled in preschool and therefore less proficient
in English when they start school compared to their
native born-counterparts.xvi
• MATERNAL RISK FACTORS. The health and
circumstances of mothers influence child health and
development. Compared to their older counterparts,
teen mothers tend to have fewer financial and
social resources, and parenting skills to ensure the
healthy development of their children. Children of
teen mothers are more likely to be born with low
birth weight, have poor health, experience behavior
problems, and have limited language and literacy
skills. Additionally, mothers who are socially isolated,
depressed, or who continuously use alcohol or
tobacco are less able to provide healthy, supportive,
and stable home and learning environments and their
children are more likely to develop social-emotional
problems and problems at school.xvii
• CHILD MALTREATMENT. Children who are
abused or neglected are more likely to have social,
emotional, and cognitive problems, poor outcomes in
school and have higher levels of antisocial behavior
(e.g. delinquency) than their peers who do not
experience maltreatment.
It is difficult to chart the progress of families since
2007 both because the current Report Card uses
several new indicators and because (other than the
census) there are few comprehensive and ongoing
sources of data on families in our community.
Regardless, examination of the ready family indicators
suggests less than a 1% change since 2007 in health
outcomes (live births, children entering kindergarten
with up-to-date immunizations), maternal risk factors
(teen pregnancy, and births to mothers with fewer
than 12 years education). In contrast, results of the
Pregnancy Risk Assessment Monitoring System
(PRAMS) survey suggest a possible increase between
2002/2004 and 2006/2008 in continuous alcohol
use by pregnant women (+1.0%) and mothers with
no-one to talk to about their problems (+4.1%); and a
decrease in the proportion of mothers who experience
abuse (-2.2%).
More importantly, the indicators point to a relatively
small number of children and families with multiple
and complex needs associated with poverty such
as homelessness and food insecurity. In fact recent
Census reports point to an increasing number of
families (in contrast to single persons) experiencing
homelessness. Homeless children have much higher
rates of learning disabilities and emotional problems
than non-homeless children, and are more likely to
experience family separation.xviii In addition, hungry
children have higher rates of illness and growth
impairment that affects their physical, intellectual,
academic, and emotional development.xix
TH
E G
UIL
FO
RD
SC
HO
OL
RE
AD
INE
SS
RE
PO
RT
CA
RD
20
11
9
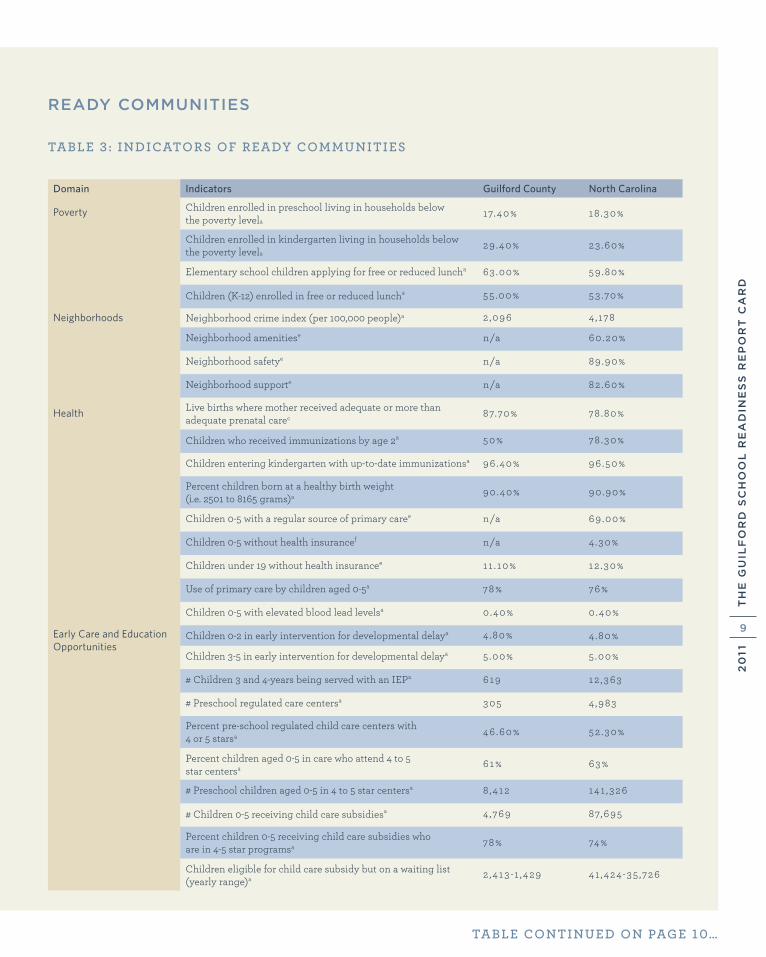
READY COMMUNITIES
TABLE 3 : INDICATORS OF READY COMMUNITIES
Domain Indicators Guilford County North Carolina
Poverty Children enrolled in preschool living in households below the poverty levela
17.40% 18 .30%
Children enrolled in kindergarten living in households below the poverty levela
29 .40% 23 .60%
Elementary school children applying for free or reduced luncha 63 .00% 59 .80%
Children (K-12) enrolled in free or reduced luncha 55 .00% 53 .70%
Neighborhoods Neighborhood crime index (per 100,000 people)a 2 ,096 4 ,178
Neighborhood amenitiese n/a 60 .20%
Neighborhood safetye n/a 89 .90%
Neighborhood supporte n/a 82 .60%
Health Live births where mother received adequate or more than adequate prenatal carec 87.70% 78 .80%
Children who received immunizations by age 2a 50% 78 .30%
Children entering kindergarten with up-to-date immunizationsa 96 .40% 96 .50%
Percent children born at a healthy birth weight (i.e. 2501 to 8165 grams)a 90 .40% 90 .90%
Children 0-5 with a regular source of primary caree n/a 69 .00%
Children 0-5 without health insurancef n/a 4 .30%
Children under 19 without health insurancee 11 . 10% 12 .30%
Use of primary care by children aged 0-5a 78% 76%
Children 0-5 with elevated blood lead levelsa 0 .40% 0 .40%
Children 0-2 in early intervention for developmental delaya 4 .80% 4 .80%
Children 3-5 in early intervention for developmental delaya 5 .00% 5 .00%
# Children 3 and 4-years being served with an IEPa 619 12 ,363
# Preschool regulated care centersa 305 4 ,983
Percent pre-school regulated child care centers with 4 or 5 starsa 46 .60% 52 .30%
Percent children aged 0-5 in care who attend 4 to 5 star centersa 61% 63%
# Preschool children aged 0-5 in 4 to 5 star centersa 8 ,412 141 ,326
# Children 0-5 receiving child care subsidiesa 4 ,769 87,695
Percent children 0-5 receiving child care subsidies whoare in 4-5 star programsa 78% 74%
Children eligible for child care subsidy but on a waiting list (yearly range)a 2 ,413 -1 ,429 41 ,424-35 ,726
TABLE CONTINUED ON PAGE 10…
Early Care and Education Opportunities
TH
E G
UIL
FO
RD
SC
HO
OL
RE
AD
INE
SS
RE
PO
RT
CA
RD
20
11
10
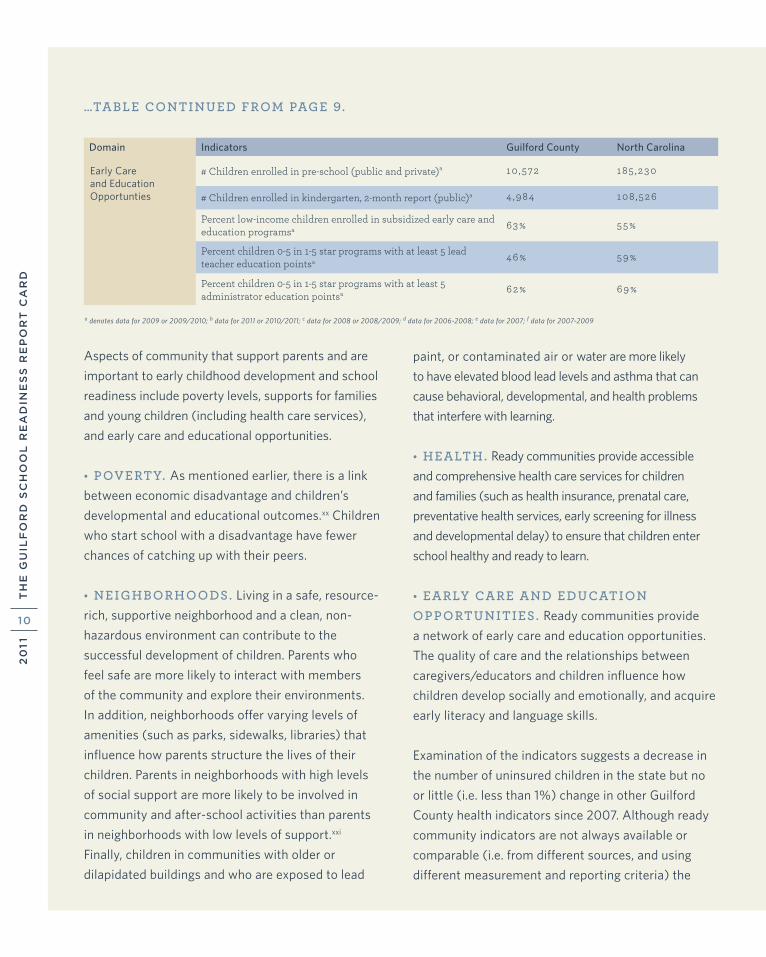
Aspects of community that support parents and are
important to early childhood development and school
readiness include poverty levels, supports for families
and young children (including health care services),
and early care and educational opportunities.
• POVERTY. As mentioned earlier, there is a link
between economic disadvantage and children’s
developmental and educational outcomes.xx Children
who start school with a disadvantage have fewer
chances of catching up with their peers.
• NEIGHBORHOODS. Living in a safe, resource-
rich, supportive neighborhood and a clean, non-
hazardous environment can contribute to the
successful development of children. Parents who
feel safe are more likely to interact with members
of the community and explore their environments.
In addition, neighborhoods offer varying levels of
amenities (such as parks, sidewalks, libraries) that
influence how parents structure the lives of their
children. Parents in neighborhoods with high levels
of social support are more likely to be involved in
community and after-school activities than parents
in neighborhoods with low levels of support.xxi
Finally, children in communities with older or
dilapidated buildings and who are exposed to lead
paint, or contaminated air or water are more likely
to have elevated blood lead levels and asthma that can
cause behavioral, developmental, and health problems
that interfere with learning.
• HEALTH. Ready communities provide accessible
and comprehensive health care services for children
and families (such as health insurance, prenatal care,
preventative health services, early screening for illness
and developmental delay) to ensure that children enter
school healthy and ready to learn.
• EARLY CARE AND EDUCATION OPPORTUNITIES. Ready communities provide
a network of early care and education opportunities.
The quality of care and the relationships between
caregivers/educators and children influence how
children develop socially and emotionally, and acquire
early literacy and language skills.
Examination of the indicators suggests a decrease in
the number of uninsured children in the state but no
or little (i.e. less than 1%) change in other Guilford
County health indicators since 2007. Although ready
community indicators are not always available or
comparable (i.e. from different sources, and using
different measurement and reporting criteria) the
Domain Indicators Guilford County North Carolina
# Children enrolled in pre-school (public and private)a 10 ,572 185 ,230
# Children enrolled in kindergarten, 2-month report (public)a 4 ,984 108 ,526
Percent low-income children enrolled in subsidized early care and education programsa 63% 55%
Percent children 0-5 in 1-5 star programs with at least 5 lead teacher education pointsa 46% 59%
Percent children 0-5 in 1-5 star programs with at least 5 administrator education pointsa 62% 69%
…TABLE CONTINUED FROM PAGE 9.
a denotes data for 2009 or 2009/2010; b data for 2011 or 2010/2011; c data for 2008 or 2008/2009; d data for 2006-2008; e data for 2007; f data for 2007-2009
Early Care and Education Opportunties
TH
E G
UIL
FO
RD
SC
HO
OL
RE
AD
INE
SS
RE
PO
RT
CA
RD
20
11
1 1
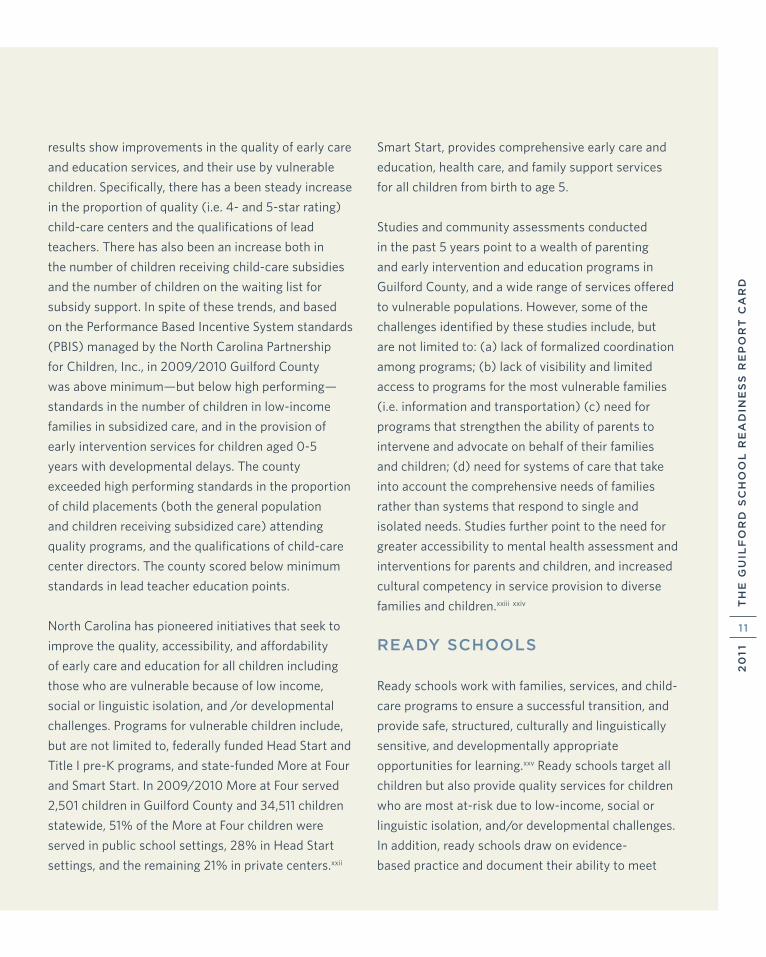
results show improvements in the quality of early care
and education services, and their use by vulnerable
children. Specifically, there has a been steady increase
in the proportion of quality (i.e. 4- and 5-star rating)
child-care centers and the qualifications of lead
teachers. There has also been an increase both in
the number of children receiving child-care subsidies
and the number of children on the waiting list for
subsidy support. In spite of these trends, and based
on the Performance Based Incentive System standards
(PBIS) managed by the North Carolina Partnership
for Children, Inc., in 2009/2010 Guilford County
was above minimum—but below high performing—
standards in the number of children in low-income
families in subsidized care, and in the provision of
early intervention services for children aged 0-5
years with developmental delays. The county
exceeded high performing standards in the proportion
of child placements (both the general population
and children receiving subsidized care) attending
quality programs, and the qualifications of child-care
center directors. The county scored below minimum
standards in lead teacher education points.
North Carolina has pioneered initiatives that seek to
improve the quality, accessibility, and affordability
of early care and education for all children including
those who are vulnerable because of low income,
social or linguistic isolation, and /or developmental
challenges. Programs for vulnerable children include,
but are not limited to, federally funded Head Start and
Title I pre-K programs, and state-funded More at Four
and Smart Start. In 2009/2010 More at Four served
2,501 children in Guilford County and 34,511 children
statewide, 51% of the More at Four children were
served in public school settings, 28% in Head Start
settings, and the remaining 21% in private centers.xxii
Smart Start, provides comprehensive early care and
education, health care, and family support services
for all children from birth to age 5.
Studies and community assessments conducted
in the past 5 years point to a wealth of parenting
and early intervention and education programs in
Guilford County, and a wide range of services offered
to vulnerable populations. However, some of the
challenges identified by these studies include, but
are not limited to: (a) lack of formalized coordination
among programs; (b) lack of visibility and limited
access to programs for the most vulnerable families
(i.e. information and transportation) (c) need for
programs that strengthen the ability of parents to
intervene and advocate on behalf of their families
and children; (d) need for systems of care that take
into account the comprehensive needs of families
rather than systems that respond to single and
isolated needs. Studies further point to the need for
greater accessibility to mental health assessment and
interventions for parents and children, and increased
cultural competency in service provision to diverse
families and children.xxiii xxiv
READY SCHOOLS
Ready schools work with families, services, and child-
care programs to ensure a successful transition, and
provide safe, structured, culturally and linguistically
sensitive, and developmentally appropriate
opportunities for learning.xxv Ready schools target all
children but also provide quality services for children
who are most at-risk due to low-income, social or
linguistic isolation, and/or developmental challenges.
In addition, ready schools draw on evidence-
based practice and document their ability to meet
TH
E G
UIL
FO
RD
SC
HO
OL
RE
AD
INE
SS
RE
PO
RT
CA
RD
20
11
12
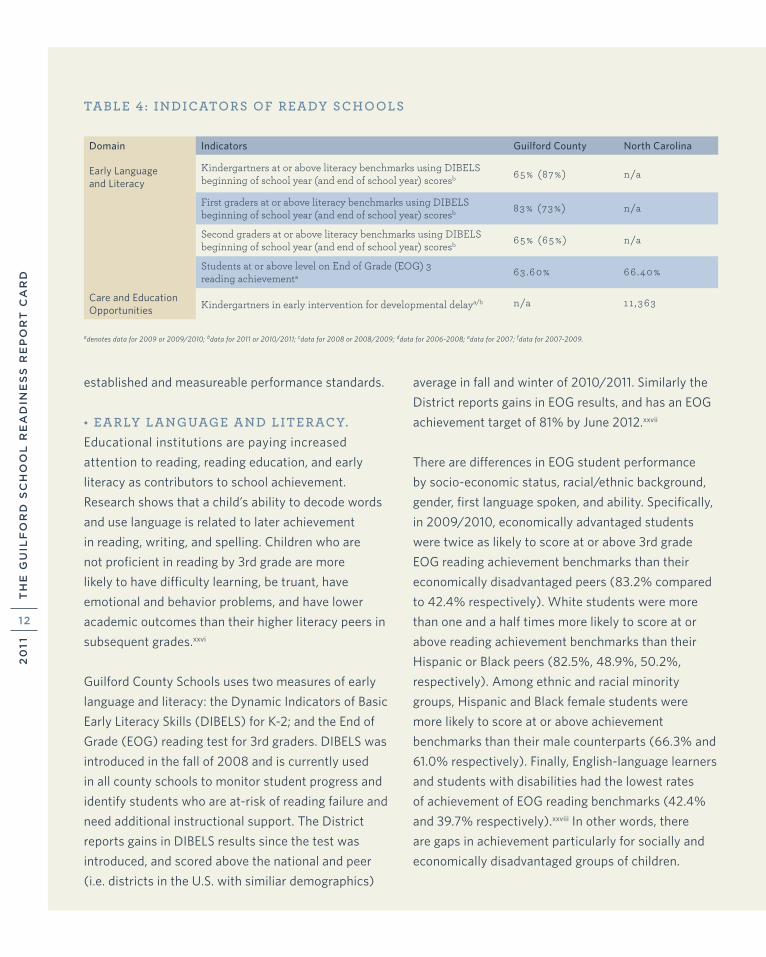
established and measureable performance standards.
• EARLY LANGUAGE AND LITERACY. Educational institutions are paying increased
attention to reading, reading education, and early
literacy as contributors to school achievement.
Research shows that a child’s ability to decode words
and use language is related to later achievement
in reading, writing, and spelling. Children who are
not proficient in reading by 3rd grade are more
likely to have difficulty learning, be truant, have
emotional and behavior problems, and have lower
academic outcomes than their higher literacy peers in
subsequent grades.xxvi
Guilford County Schools uses two measures of early
language and literacy: the Dynamic Indicators of Basic
Early Literacy Skills (DIBELS) for K-2; and the End of
Grade (EOG) reading test for 3rd graders. DIBELS was
introduced in the fall of 2008 and is currently used
in all county schools to monitor student progress and
identify students who are at-risk of reading failure and
need additional instructional support. The District
reports gains in DIBELS results since the test was
introduced, and scored above the national and peer
(i.e. districts in the U.S. with similiar demographics)
average in fall and winter of 2010/2011. Similarly the
District reports gains in EOG results, and has an EOG
achievement target of 81% by June 2012.xxvii
There are differences in EOG student performance
by socio-economic status, racial/ethnic background,
gender, first language spoken, and ability. Specifically,
in 2009/2010, economically advantaged students
were twice as likely to score at or above 3rd grade
EOG reading achievement benchmarks than their
economically disadvantaged peers (83.2% compared
to 42.4% respectively). White students were more
than one and a half times more likely to score at or
above reading achievement benchmarks than their
Hispanic or Black peers (82.5%, 48.9%, 50.2%,
respectively). Among ethnic and racial minority
groups, Hispanic and Black female students were
more likely to score at or above achievement
benchmarks than their male counterparts (66.3% and
61.0% respectively). Finally, English-language learners
and students with disabilities had the lowest rates
of achievement of EOG reading benchmarks (42.4%
and 39.7% respectively).xxviii In other words, there
are gaps in achievement particularly for socially and
economically disadvantaged groups of children.
Domain Indicators Guilford County North Carolina
Early Language and Literacy
Kindergartners at or above literacy benchmarks using DIBELS beginning of school year (and end of school year) scoresb 65% (87%) n/a
First graders at or above literacy benchmarks using DIBELS beginning of school year (and end of school year) scoresb 83% (73%) n/a
Second graders at or above literacy benchmarks using DIBELSbeginning of school year (and end of school year) scoresb 65% (65%) n/a
Students at or above level on End of Grade (EOG) 3 reading achievementa 63 .60% 66 .40%
Care and Education Opportunities Kindergartners in early intervention for developmental delaya/b n/a 11 ,363
adenotes data for 2009 or 2009/2010; bdata for 2011 or 2010/2011; cdata for 2008 or 2008/2009; ddata for 2006-2008; edata for 2007; fdata for 2007-2009.
TABLE 4 : INDICATORS OF READY SCHOOLS

TH
E G
UIL
FO
RD
SC
HO
OL
RE
AD
INE
SS
RE
PO
RT
CA
RD
20
11
13
READY CHILDREN
TABLE 5 : INDICATORS OF READY CHILDREN
Research shows that school readiness is best measured
along two broad domains that are central to child
development: (1) health and physical well being,
and (2) developmental status (fine and gross motor
development, social and emotional development,
communication and language development, cognition
and general knowledge, and approaches to learning).
Children who perform poorly in the early years are less
likely to succeed in later grades.
Since 2006/2007 North Carolina State Law (NC
GS 130A-440) requires that all children entering
kindergarten submit a fully completed Kindergarten
Health Assessment (KHA) as part of their application.
The purpose of the KHA is to identify health and
developmental concerns that could interfere with a child’s
performance in school. Medical professionals complete
the form with input from a caregiver up to 12 months
before and/or 30 days after school entry. The KHA was
piloted in Guilford County in 2006/2007 and is now
implemented throughout the state of North Carolina.
Results from the 2007 KHA were not reported because
of a low rate of participation during the pilot stage.
However, participation and completion rates have
increased since then. During 2009/2010 4,615 KHAs
were collected. Of this total 75 were excluded from
the analysis because they were duplicates, and an
additional 46 forms were excluded because they lacked
a health assessment. There was wide variation in the
rate of completion of the remaining 4,494 forms. The
demographic section had the lowest rate of completion
(55.6%), while the physical examination section
had the highest rate of completion (97.4%). The two
most common reasons for non-completion of the
developmental health, vision, and hearing sections were
the parent or physician skipped the question without
explaining why, or the physician was unable to complete
the screen either because the child was uncooperative
or crying, or because the caregiver did not provide the
information required. In a small number of cases (26) the
developmental screen, which requires parent input, was
not completed because of language barriers.
Domain Indicators Guilford County North Carolina
Health and Physical Well-Being Body mass index (children who are overweight)a 14 .60% 15 .40%
Adequate or corrected visiona 94% n/a
Adequate or corrected hearinga 95 .40% n/a
% Kindergarten children with untreated tooth decayc 14% in 2008/2009
17% in 2008/2009
Child Development Developmentally appropriate gross motor skillsa 99 . 10% n/a
Developmentally appropriate fine motor skillsa 96 .60% n/a
Developmentally appropriate socio-emotional skillsa 98 .40% n/a
Developmentally appropriate problem-solving skillsa 97.60% n/a
Developmentally appropriate language development and communication skillsa
96 .40% n/a
a denotes data for 2009 or 2009/2010; b data for 2011 or 2010/2011; c data for 2008 or 2008/2009; d data for 2006-2008; e data for 2007; f data for 2007-2009

TH
E G
UIL
FO
RD
SC
HO
OL
RE
AD
INE
SS
RE
PO
RT
CA
RD
20
11
14
ADDITIONAL RESULTS FROM THE KHA’S
• HEALTH INSURANCE. The majority of children
had private insurance (49.6%), Medicaid (45%), or
some other coverage (1.5%). The remaining 3.9% of
children had no health insurance, which is slightly
below the state average reported for children aged
0-5 in Table 3.
• PERTINENT (OR CHRONIC) ILLNESS. The most commonly reported conditions were
allergies, asthma, speech and language issues, and
problems with attention or learning (8.5%, 8.1%,
4.0%, and 1.6% respectively).
• DEVELOPMENTAL SCREEN. The Ages
and Stages Questionnaire (ASQ) and the Parents’
Evaluation of Developmental Status (PEDS) were the
most commonly used developmental screening tools
(60% and 38.2%, respectively). In less than 3% of
forms the physician did not identify the tool used,
sometimes indicating it was an informal assessment.
The most commonly identified concerns were fine
motor skills (2.7%), language or communication
(2.5%), problem solving (1.8%), socio-emotional
development (1.0%), and gross motor skills (0.6%).
One hundred and ninety-six children (or 4.4%) had a
concern identified through the KHA. An additional 56
(or 1.2%) of children were referred to a specialist.
• VISION AND HEARING SCREEN. The audiometry was the most common hearing screen
used (88.8%) and although the majority of children
passed, 2.4% needed to be screened again and 2.0%
were referred to an audiologist. In the case of vision,
4.7% of children were referred to an eye doctor and
1.2% had an already diagnosed vision condition.
• PHYSICAL HEALTH. About 83% of children had
a body mass index within the normal range, whereas
8.4% were overweight (lower than the PBIS report),
7.1% were at-risk for being overweight, and 1.4% of
children were underweight. The most common physical
health concerns were skin (2.8%), dental (2.0%), head,
ears, nose and throat (1.7%), and cardiac (0.8%).
RECOMMENDATIONS/OPPORTUNITIES FOR SYSTEM CHANGE
READY FAMILIES
• Development of additional supports for families
with young children in their communities of life
(e.g. babysitting or respite care, out-of-home
opportunities for parents to interact both with their
children and other parents, and opportunities for
parents to improve their literacy skills).
• Ongoing education opportunities for parents with
young children.
• Continued expansion of universal newborn nurse
visitation program to include mothers with children
who are at early risk of developmental delay.
• Developmental and health assessments and services
for children and families that help parents support
their children’s social and emotional development.

TH
E G
UIL
FO
RD
SC
HO
OL
RE
AD
INE
SS
RE
PO
RT
CA
RD
20
11
15
READY COMMUNITIES
• Creation of a county-wide commitment from non-
profits, faith communities, early care and education
programs, and businesses to ensure that all children
read at grade level by grade three as measured on
end-of-grade assessment.
• Increased collaboration among birth to 3, pre-K,
and K-3 programs to create a continuum of support
and share responsibility for language and literacy
development (school readiness).
• Continued collaboration among early care and
education programs such as Head Start, Smart
Start, and NC Pre-K in order to serve more children
with needs and share resources among families and
professional staff.
• Development of a child/parent early care
and education kindergarten Grade 3
continuum, so that children and
families continue to be supported
after entry into school.
• Increased support to families with
young children so that parents
can obtain living wage jobs and
benefits to care for their children.
Examples include: employer-
based high quality early
care and education sites;
additional child care subsidy
resources for high quality
early care and education
placements; increased
opportunities within
communities for
parents to complete their high school education
(e.g. obtain a GED) and increase their marketability.
• Reduction in barriers in access to services including,
but not limited to, transportation and greater
opportunities for families to have knowledge about
available programs and resources that can support
their becoming effective parents and their children
being ready for school.
• Additional services for children with disabilities and
children with multiple and complex needs that if
addressed early in the child’s life will not escalate
into more serious concerns.
• Additional services for children with needs that
can be addressed early to prevent more serious
concerns in early grades of school specifically
early language assessments and intervention to
prevent later reading problems.
READY SCHOOLS
• Research that examines the
process of first and second-
language development/acquisition
and instructional strategies that
build on the language strengths
of young English-language
learners.
• Training for early childhood
staff so that they are cross-
culturally competent and
able to build meaningful
relationships with families
of diverse linguistic and
cultural backgrounds.

TH
E G
UIL
FO
RD
SC
HO
OL
RE
AD
INE
SS
RE
PO
RT
CA
RD
20
11
16
• Beyond the PBIS (Performance Based Information
System used by Smart Start/Partnership for Children)
and school system data management and tracking
systems, development of early literacy benchmarks
against which to assess and measure the community’s
progress towards school readiness.
• Ensure that Kindergarten Health Assessment (KHA)
forms are fully completed by medical providers/
parents and that schools do not accept incomplete
forms. Full utilization of information reported on
the KHA so that appropriate referrals/follow-up are
made for each child entering kindergarten. Utilize the
KHA as a communication tool among the physician,
the parent(s) and the school to enable appropriate
interventions to meet the identified concerns about
the child.
READY CHILDREN
• Ensure that every young child living in Guilford
County has the opportunity to attend a high quality
early care and education child development program
for at least one year prior to entry into kindergarten.
• Ensure that every child living in Guilford County
has a medical home providing consistent and
appropriate medical screening and intervention
services with particular focus on social/emotional
development and language acquisition.
DATA SOURCES
TABLE 1 : CHILD AND ADULT DEMOGRAPHICS
• Total population. US Census Bureau. Quick facts. http://quickfacts.
census.gov/qfd/states/37/37081.html
• All child population indicators: US Census Bureau. American
Community Survey. B09001 population under 18 by age. 2009,
1-year estimates.
Race and Ethnicity
• Total child population, race and ethnicity. US Census Bureau.
American Community Survey. S0901 Child characteristics—2009
projections for state-level data. Total child population. S0901 2005-
2009 data set for county-level data. Children under 18 by age.
TABLE 2: READY FAMILIES PARENTING
• Adults functioning at below basic literacy levels (and functioning
at basic literacy levels). Special information request from Reading
Connections. The numbers reported are estimates from the
National Assessment of Adult Literacy (NAAL). Adults with
below basic literacy skills cannot read or write in English, and
cannot perform basic math operations. Adults with basic literacy
levels function at a 5th to 8th grade level, can perform daily
literacy activities, but do not have the skills to perform more
complex, abstract, or analytic activities by themselves.
• Children 0-5 who are read to every day. 2007 National Survey of
Children’s Health http://www.nschdata.org
• Homeless children aged 3-5. County data from Guilford County
Schools, Homeless and Transitional Service. Count of pre-
kindergartners identified between through May of the 2010/2011
academic year. Count of kindergartners identified through
January of the 2010/2011 academic year. State data from the
SERVE Center at UNCG, NC Homeless Education Program. State
and County data are not necessarily comparable.
• Homeless students (all grade levels). Special data request from
the SERVE Center at UNCG, NC Homeless Education Program.
• Food insecurity rate (total population). Feeding America. Map
the Meal Gap. http://feedingamerica.org/hunger-in-america/
hunger-studies/map-the-meal-gap.aspx

TH
E G
UIL
FO
RD
SC
HO
OL
RE
AD
INE
SS
RE
PO
RT
CA
RD
20
11
17
• Children aged 0-4 years in food insecure households. State
level information on low-income children in federally funded
maternal and child health programs including WIC, Food
Stamps, and TANF. http://www.nutritionnc.com/pdfPregPed/
PedNSS/2009/StateTableInfantsandChildrenUnder5Years.
pdf. County level information: http://www.
nutritionnc.com/pdfPregPed/PedNSS/2009/
CountyTableInfantsandChildrenUnder5YearsofAge.pdf
• Language diversity. US Census Bureau. American community
survey. B16002 Household language by linguistic isolation
(2009). The percent families who speak a language other than
English at home.
• Linguistic isolation. US Census Bureau. American community
survey. B16002 Household language by linguistic isolation
(2009). The percent families who speak a language other than
English at home and have difficulty communicating in English.
Maternal Risk Factors
• Births to mothers with less than 12 years of education. NC Center
for Health Statistics. PRAMS survey. http://www.schs.state.
nc.us/SCHS/data/births/getbirthdata.cfm
• Teen (15-17) pregnancy rates. NC Center for Health Statistics.
Pregnancy rates for 2005-2009. http://www.schs.state.nc.us/
SCHS/data/databook/CD9A%20preg%20rates%20by%20race.
html
• Low birth weight. NC State Center for Health Statistics. 2009
Live birth data. http://www.schs.state.nc.us/SCHS/data/births/
bd.cfm
• Mothers who used alcohol before, during, and after pregnancy.
NC Center for Health Statistics. PRAMS survey. http:www.schs.
state.nc.us/SCHS/data/preconception/prams/2006to2008/
State/drk531_a.html for the state and http:www.schs.state.nc.us/
SCHS/data/preconception/prams/2006to2008/Northwest/
drk531_a.html for the northwest region. Counties in the region
include: Avery, Burke, Caldwell, Watauga, Ashe, Alleghany,
Wilkes, Alexander, Catawba, Iredell, Surry, Yadkin, Davie, Rowan,
Davidson, Forsyth, Stokes, Rockingham, Guilford, and Randolph.
• Mothers who experienced abuse around pregnancy. NC Center
for Health Statistics. PRAMS survey. http:www.schs.state.nc.us/
SCHS/data/preconception/prams/2006to2008/State/PAPG.
html for the state and preconception/prams/2006to2008/
Northwest/PAPG.html for the northwest region. Counties in the
region include: Avery, Burke, Caldwell, Watauga, Ashe, Alleghany,
Wilkes, Alexander, Catawba, Iredell, Surry, Yadkin, Davie, Rowan,
Davidson, Forsyth, Stokes, Rockingham, Guilford, and Randolph.
• Mothers who smoked before, during, and after pregnancy. NC
Center for Health Statistics. PRAMS survey. http:www.schs.state.
nc.us/SCHS/data/preconception/prams/2006to2008/State/
HPPP_TLK.html for the state and http:www.schs.state.nc.us/
SCHS/data/preconception/prams/2006to2008/Northwest/
HPPP_TLK.html for the northwest region. Counties in the region
include: Avery, Burke, Caldwell, Watauga, Ashe, Alleghany,
Wilkes, Alexander, Catawba, Iredell, Surry, Yadkin, Davie, Rowan,
Davidson, Forsyth, Stokes, Rockingham, Guilford, and Randolph.
• Mothers who do not have someone to talk to about problems. NC
Center for Health Statistics. PRAMS survey. http:www.schs.state.
nc.us/SCHS/data/preconception/prams/2006to2008/State/
HPPP_TLK.html for the state and http:www.schs.state.nc.us/
SCHS/data/preconception/prams/2006to2008/Northwest/
HPPP_TLK.html for the northwest region. Counties in the region
include: Avery, Burke, Caldwell, Watauga, Ashe, Alleghany,
Wilkes, Alexander, Catawba, Iredell, Surry, Yadkin, Davie, Rowan,
Davidson, Forsyth, Stokes, Rockingham, Guilford, and Randolph.
• Mothers reporting depression after delivery. NC Center for
Health Statistics. PRAMS survey. http:www.schs.state.nc.us/
SCHS/data/preconception/prams/2006to2008/State/
WH_PPDPR.html for the state and http:www.schs.state.nc.us/
SCHS/data/preconception/prams/2006to2008/Northwest/
WH_PPDPR.html for the northwest region. Counties in the region
include: Avery, Burke, Caldwell, Watauga, Ashe, Alleghany,
Wilkes, Alexander, Catawba, Iredell, Surry, Yadkin, Davie, Rowan,
Davidson, Forsyth, Stokes, Rockingham, Guilford, and Randolph.
TH
E G
UIL
FO
RD
SC
HO
OL
RE
AD
INE
SS
RE
PO
RT
CA
RD
20
11
18
Child Maltreatment
• Children (all ages) with finding in need of services. Duncan, D.
F., Kum, H. C., Flair, K. A., Stewart, C. J. and Huang, S. P. (2009)
Management Assistance for Child Welfare, Work First, and
Food and Nutrition Services. http://www.ssw.unc.edu/ma/ FY
2009//2010
• Children aged 0-5 with substantiated abuse/neglect reports.
National Child Abuse and Neglect Experiences Data System
(NCANDS). Note that reporting method has changed since
2007 SRRC.
TABLE 3 : READY COMMUNITIES POVERTY
• Children enrolled in preschool living in households below
the poverty level. US Census Bureau. American Community
Survey. B14006 Poverty Status in the past 12 months by school
enrollment by level of school. 2009, 1-year estimates. The 2009
poverty level for a 2-parent household with two children was
$21,756.
• Children enrolled in kindergarten living in households below
the poverty level. US Census Bureau. American Community
Survey. B14006 Poverty Status in the past 12 months by school
enrollment by level of school. 2009, 1-year estimates. The 2009
poverty level for a 2-parent household with two children was
$21,756.
• Elementary school children applying for free or reduced lunch.
NC Department of Public Instruction. Child Nutrition Services.
Free and Reduced Application data by site. All year to date data:
2009-2010. http://www.ncpublicschools.org/fbs/resources/
data/ Children in families with incomes below 185% of the
poverty level (approximately $40,250 for a family of four) were
eligible for free or reduced lunch in 2009/2010.
• Children (K-12) enrolled in free or reduced lunch. Kids Count.
Http://datacenter.kidscount.org/data/bystate/stateprofile
Neighborhoods
• Neighborhood crime index. North Carolina Department of Justice
(2009). Crime in NC. 2009 Annual summary report of uniform
crime. Note that index is a composite measure of seven offenses:
murder, rape, robbery, aggravated assault, burglary, larceny, and
motor vehicle theft.
• Neighborhood amenities. 2007 National Survey of Children’s
Health http://www.nschdata.org. Percent children aged 0 -5
who live in neighborhoods which have 3 or 4 of the following
amenities: sidewalks, parks, recreation centers, and/or libraries.
• Neighborhood safety. 2007 National Survey of Children’s
Health http://www.nschdata.org. Percent children aged 0 - 5
whose parents feel they are usually safe in their communities or
neighborhoods.
• Neighborhood support. 2007 National Survey of Children’s
Health http://www.nschdata.org. Percent children aged 0 - 5 who
live in neighborhoods in which people help each other, look out
for each other’s children, and can count on their neighbors.
Health
• Live births where mother received adequate or more than
adequate prenatal care. 2008 March of Dimes http://www.
marchofdimes.com/peristats
• Children who received immunizations by age 2. NC Immunization
Branch, special data request. Note that state and county data
are not directly comparable because county data are from the NC
Immunization Branch and state data are from the 2009 National
Immunization Survey.
• Children entering kindergarten with up-to-date immunizations.
NC Immunizations Branch, special data request.
• Percent children born at a healthy birth weight. NC State Center
for Health Statistics. Birth data. http://www.schs.state.nc.us/
SCHS/data/births/getbirthdata.cfm
• Children 0-5 with a regular source of primary care. 2007 National
Survey of Children’s Health http://www.childhealthdata.org
• Children 0 -5 without health insurance. 2007-2009 CHAMP
report, Table 14: Type of Health Coverage by Child’s Age. Note
that county-level information is not reported because of small
sample.
• Children under 19 without health insurance. US Census Bureau.
2007 Health Insurance Coverage Status (Uninsured Only) in
TH
E G
UIL
FO
RD
SC
HO
OL
RE
AD
INE
SS
RE
PO
RT
CA
RD
20
11
19
North Carolina for Age (Under 19 years), Income (All income
levels) and Sex (both Sexes).
• Use of primary care by children aged 0-5. Guilford County
Partnership for Children. Performance Based Incentive System
(PBIS) variable H20 reported by the NC Partnership for Children,
Inc. Report on Medicaid enrolled children who have participated
in Health Check.
• Children 0-5 with elevated blood lead levels. Guilford County
Partnership for Children. PBIS H70. Elevated blood lead levels.
Early Care and Education Opportunities
• Children 0-2 and children 3-5 in early intervention for
developmental delay. Guilford County Partnership for Children.
PBIS variable H10 Early intervention for children who are at risk
for special needs.
• Children 3 and 4-years being served with an IEP. Guilford County
Schools, Exceptional Children Services special data request for
both county and state data. December 01, 2010 count. Note that
state count includes 5 year olds in Pre-K.
• Preschool regulated child care centers. NC DHHS, Division
of Child Development. Child Care Analysis Detail. http://
ncchildcare.dhhs.state.nc.us/pdf_forms/statistical_detail_report_
december__2009.pdf for county data. NC DHHS, Division of
Child Development. http://ncchildcare.dhhs.state.nc.us/general/
child_care_statistical_report.asp. December 2009 for state data.
• Percent pre-school regulated child care centers with 4 or 5
stars. NC DHHS, Division of Child Development. Child Care
Analysis Detail. http://ncchildcare.dhhs.state.nc.us/pdf_forms/
statistical_detail_report_december__2009.pdf for county data.
NC DHHS, Division of Child Development. NC DHHS, Division of
Child Development. http://ncchildcare.dhhs.state.nc.us/general/
child_care_statistical_report.asp. December 2009 for state data.
• Percent children aged 0-5 in care who attend 4 to 5 star centers.
Guilford County Partnership for Children. PBIS variable PLA40.
Child Placements.
• Preschool children aged 0-5 in 4 to 5 star centers. NC DHHS,
Division of Child Development. Child Care Analysis Detail. http://
ncchildcare.dhhs.state.nc.us/pdf_forms/statistical_detail_report_
december__2009.pdf for county data. NC DHHS, Division of
Child Development. NC DHHS, Division of Child Development.
http://ncchildcare.dhhs.state.nc.us/general/child_care_
statistical_report.asp. December 2009 for state data.
• Children 0-5 receiving child care subsidies. NC Division of Child
Development. County and State subsidy fact sheets. http://
ncchildcare.dhhs.state.nc.us/pdf_forms/subsidy_county_fact_
sheets_09_10.pdf for the county and http://ncchildcare.dhhs.
state.nc.us/pdf_forms/subsidy_statewide_facts_sheet_09_10.pdf
for the state.
• Percent children 0-5 receiving child care subsidies who are in 4-5
star programs. Guilford County Partnerships for Children. PBIS
variable PLA50
• Children eligible for child care subsidy but on a waiting list.
Special data request to NC Division of Social Services, Guilford
County Child Day Care Program for county data. NC Division of
Child Development. ncchildcare.dhhs.state.nc.us/pdf_forms/
may_2010_statistical_report.pdf for state data.
• Children aged 0-5 enrolled in preschool. NC DHHS, Division
of Child Development. Child Care Analysis Detail. http://
ncchildcare.dhhs.state.nc.us/pdf_forms/statistical_detail_report_
december__2009.pdf for county data. NC DHHS, Division of
Child Development NC DHHS, Division of Child Development.
http://ncchildcare.dhhs.state.nc.us/general/child_care_
statistical_report.asp (December 2009) for state data.
• Children enrolled in kindergarten, 2-month report. State Board of
Education. Department of Public Instruction. Student Accounting.
Principal’s Monthly Report (PMR). http://www.ncpublicschools.
org/fbs/accounting/data/
• Percent low-income children enrolled in subsidized early care and
education programs. Guilford County Partnership for Children.
PBIS Variable PLA30
• Percent children 0-5 in 1-5 star programs with at least 5 lead
teacher education points. PBIS variable EDU10.
• Percent children 0-5 in 1-5 star programs with at least 5
administrator education points. PBIS variable EDU20.

TH
E G
UIL
FO
RD
SC
HO
OL
RE
AD
INE
SS
RE
PO
RT
CA
RD
20
11
20
TABLE 4 : READY SCHOOLS
Early Language and Literacy
• Kindergartners at or above literacy benchmarks. Special data
request, Guilford County Schools. 2010/2011 Dynamic Indicators
of Basic Early Literacy Skills (DIBELS) data that measures five
domains of early literacy: phonemic awareness, alphabet prin-
ciple, accuracy and fluency, vocabulary, and comprehension.
• First graders at or above literacy benchmarks. Special data
request, Guilford County Schools. 2010/2011 Dynamic Indicators
of Basic Early Literacy Skills (DIBELS) data that measures
five domains of early literacy: phonemic awareness, alphabet
principle, accuracy and fluency, vocabulary, and comprehension.
• Students at or above level on End of Grade (EOG) 3 reading
achievement. State Board of Education. Department of
Public Instruction. 2009-2010 academic year. http://accrpt.
ncpublicschools.org/app/2010/disag/
• Kindergartners in early intervention for developmental delay.
NC Department of Public Instruction, NC 619 Exceptional
Children Preschool Program special data request.
TABLE 5 : READY CHILDREN
Health and Physical Well-Being
• Body mass index. Guilford County Partnership for Children. PBIS
variable H60.
• Adequate or corrected vision and adequate or corrected hearing.
Guilford County Kindergarten Health Assessment. 2009/2010
academic year.
• Kindergarten children with untreated tooth decay. NC Dept of
Health and Human Services, Division of Public Health. 2008-
2009 report. http://www.ncdhhs.gov/dph/oralhealth/library/
includes/AssessmentData/County-State%20Assessment%20
Comparison%2008-09.pdf
Child Development
• All child development indicators. Guilford County Kindergarten
Health Assessment. 2009/2010 academic year.
ENDNOTES
i Johnson, J. H., & Kasarda, J. D. (2011). Six disruptive demographic
trends: What census 2010 will reveal. Chapel Hill, Frank Hawkins
Kenan Institute of Private Enterprise. Retrieved March 1, 2011, from
http://www.kenan-flagler.unc.edu/ki/reports/Census2010Trends/
ii U.S. Census (2009). American Community Survey 2009, 1-year
estimates: Children characteristics.
iii U.S. Census (2009). American Community Survey 2005-2009,
5-year estimates. Poverty status in the last 12 months of related
children under 18 years by family type by age of related children.
iv U.S. Census (2009). American Community Survey 2005-2009,
5-year estimates. Selected characteristics of people at specified
levels of poverty in the past 12 months.
v Guilford County Schools (2011). Diversity. Retrieved May 2, 2011
from http://schoolcenter.gcsnc.com/education/school/school.
php?sectionid=36182&
vi Pianta, R. C. (2010). Going to school in the United States: The
shifting ecology of transition. In S. L. Kagan & R. Tarrant (Eds.),
Transitions for young children (pp. 33-44). Baltimore: Paul H.
Brooks.
vii Mather, M. (2009). Reports on America: Children in immigrant
families chart new path. Washington, DC: Population Reference
Bureau.
viii New Study Highlights Benefits of Early Childhood Programs.
Public School Forum of N.C. Vol 13, Issue 35. March 25, 2011.
ix Breaking an improving system (2011). North Carolina State
Board of Education. Retrieved June 11, 2011 from http://www.
ncpublicschools.org/stateboard/
x Blair, C., Knipe, H. Cummings, E., Baker, D. P., Gamson, D., Eslinger,
P., & Thorne, S. L. (2007). A developmental neuroscience approach
to the study of school readiness. In R. C. Pianta, M. J. Cox, K. L.
Snow (Eds.), School readiness and the transition to kindergarten in
the era of accountability (pp. 149-174). Baltimore: Paul H. Brooks.
xi Getting ready: Findings from the National School Readiness
Indicators Initiative, a 17 state partnership. Providence, RI: Rhode
Island KIDS COUNT. Retrieved February 17, 2011 from http://www.
rikidscount.org
xii Brooks-Gunn, J., Rouse, C. E., McLanahan, S. (2007). Racial and

TH
E G
UIL
FO
RD
SC
HO
OL
RE
AD
INE
SS
RE
PO
RT
CA
RD
20
11
21
ethnic gaps in school readiness. In R. C. Pianta, M. J. Cox, K. L. Snow
(Eds.), School readiness and the transition to kindergarten in the
era of accountability (pp. 283-306). Baltimore: Paul H. Brooks.
xiii Duncan, G., & Brooks-Gunn, J. (1997). Consequences of growing
up poor. New York: Russell Sage.
xiv Sameroff, A. J., Seifer, R., Baldwin, A. & Baldwin, C. (1993).
Stability of intelligence from preschool to adolescence: The
influence of social and family risk factors. Child Development, 64,
80-97.
xv Kupcha-Szrom, J. (2011). A window to the world: Early language
and literacy development. Washington, DC: Zero to Three.
Retrieved March 28. 2011 from http://main.zerotothree.org/site/
Search?query=a+window+to+the+world&inc=10
xvi Magnuson, K., Lahaie, C., & Waldfogel, J. (2006) Preschool
and School Readiness of Children of Immigrants. Social Science
Quarterly, 87, 1241–62.
xvii Cummings, M. & Davies, P. (1994). Maternal depression and
child development. Journal of Child Psychology and Psychiatry, 35,
73-112.
xviii Voices. Choices. Greensboro’s Human Services Study (2010).
Retrieved February 22, 2011 from http://www.unitedwaygso.org/
volunteer/documents/VCFULLFINALReport.pdf
xix The almanac of hunger and poverty in America: Feeding
America’s comprehensive guide to national and state facts on
hunger and poverty (2010). Feeding America. Retrieved May 19,
2011 from http://hungeralmanac.issuelab.org/research/listing/
almanac_of_hunger_and_poverty_in_america_2010_about_
feeding_america
xx Brooks-Gunn, J., Klebanov, P. K., & Duncan, G.J. (1996). Ethnic
differences in children’s intelligence test scores: Role of economic
deprivation, home environment, and maternal characteristics. Child
Development, 67, 396-408.
xxi Wilkenfeld, B., Moore, K. A,, Lippman, L. (2008). Neighborhood
support and children’s connectedness. Washington, DC: Child
Trends. Retrieved May 16, 2011 from http://www.childtrends.org/
Files/Child_Trends-2008_02_05_ConnectednessFS.pdf
xxii NC Department of Public Instruction (2011). Office of Early
Learning, special data request.
xxiii Payne, C., & Rollins, A. (2009). Ready Together. Center for
Youth, Family and Community Partnerships. Available at http://
www.uncg.edu/csr/pdfs/RT_executive_summary.pdf
xxiv Buford, A. & Payne, C., (2010). NC Launch Environmental Scan.
Center for Youth, Family, and Community Partnerships. Working
document.
xxv Pianta, R. C. (2007). Early education in transition. In R. C. Pianta,
M. J. Cox, K. L. Snow (Eds), School readiness and the transition to
kindergarten in the era of accountability (pp. 3-10). Baltimore:
Paul H. Brooks.
xxvi Discussion guide: Ensuring success for young
children: Early childhood literacy (2008). Association of
Small Foundations. Retrieved April 6, 2011 from http://
www.aecf.org/media/Pubs/Topics/Education/Other/
EnsuringSuccessforYoungChildrenLiteracy/Ensuring_Success_
Early_Literacy.pdf
xxvii Guilford County Schools (2011). Guilford County Schools
strategic plan 2012. Retrieved April 4, 2011 from http://www1.
gcsnc.com/superintendent/plan/sp.htm
xxviii Department of Public Instruction (2011). Reports of
disaggregated state, school system (LEA) and school performance
data for 2008-2010. Retrieved June 9, 2011 from http://accrpt.
ncpublicschools.org/app/2010/disag/

TH
E G
UIL
FO
RD
SC
HO
OL
RE
AD
INE
SS
RE
PO
RT
CA
RD
20
11
22
THE GUILFORD EDUCATION ALLIANCE
The Guilford School Readiness Report Card (Report Card) is an initiative of the Guilford Education Alliance (GEA).
Guilford Education Alliance works to make support of quality public education the TOP priority of the larger
community. Founded in 2004 by the Community Foundation of Greater Greensboro, the High Point Community
Foundation, and the Cemala Foundation, Guilford Education Alliance’s scope of work includes early childhood through
high school career / college graduation. For more information on GEA go to:
http://www.guilfordeducationalliance.org/
CONTACT INFORMATION:
902 Bonner Drive, Jamestown, NC 27282
Tel: 336-841-4332
Fax: 336-841-3696
Email: [email protected]
ACKNOWLEDGEMENTS:
Financial support for the Report Card is from the Lincoln Financial
Foundation, and the report was prepared by the Center for Youth, Family, and
Community Partnerships at the University of North Carolina at Greensboro.
During the spring of 2011 GEA reconvened the School Readiness Report Card
Ad Hoc Committee first to revise indicators and identify additional data sources for the report, and then to review
findings and make recommendations. GEA thanks the organizations listed below, in alphabetical order, for their
invaluable contribution to the development of the report:
Center for Youth, Family, and Community Partnerships at UNCG
Guilford Child Development
Guilford Child Health
Guilford County Partnership for Children
Guilford County Schools
North Carolina A&T State University
United Way of Greater Greensboro
United Way of Greater High Point
Finally we thank the many people who pointed us to resources, provided data and information,
and talked to us about their work preparing young children for school.


902 Bonner Drive, Jamestown, NC 27282
Tel: 336-841-4332 / Fax: 336-841-3696
www.guilfordeducationalliance.org