Embed Size (px)
Citation preview

The guide for hard-to-findinformation on benefit products,services and industry data

Caremark is a leading provider of fully integrated pharmacy benefit management services, specialty pharmacy services, anddisease management programs to more than 2,000 health plansponsors nationally. We provide health management solutions
that improve health outcomes while enabling benefit plan sponsorsand plan members to maximize their healthcare investment.
If you would like additional copies of the 2005 Benefits Barometer,or prefer someone from Caremark to contact you,
please call 800.927.3727 or email us at [email protected].
The 2005 Benefits Barometer was produced by Caremark Inc. with the cooperation of
Thomson Financial Services, New York, NY.

The 2005 Benefits Barometer draws onnumerous sources for data providingreaders with a profile of current
employee benefit plan designs as well as valu-able benchmarking information.
This year’s publication includes moreentries and draws from more resources thanever before. The following sources are mostfrequently cited for the Benefits Barometer:
• Caremark–Drug trend information, costprojections and other data relating to pharma-cy benefit management was provided byCaremark, Scottsdale, AZ. For more informa-tion, call 800.927.3727.
• The Bureau of Labor Statistics’ NationalCompensation Survey - Compensation CostTrends. This study generates quarterly index-es measuring fluctuations in labor costs andannual data. Visit www.bls.gov for statistics.
• The EBN-Hay Survey on BenefitsManagement, which this year included nearly700 benefit executives who are readers of EBN.The complete online survey findings are avail-able for purchase at www.BenefitNews.com.
• Hewitt Associates. Findings from sourcessuch as the Hewitt Health Value Initiative, adatabase representing more than 2,000 healthplans in 139 U.S. markets, including 300 majoremployers and 18.23 million health plan par-ticipants was used. More information is avail-able at www.hewitt.com.
• The Kaiser Family Foundation and HealthResearch and Educational Trust (HRET)Employer Health Benefits Survey of 2004. Thissurvey reports findings from more than 1,925randomly selected public and private employ-ers. For more information, contact the HenryJ. Kaiser Family Foundation at www.kff.org.
• The MetLife Study of Employee BenefitsTrends of 2003. The national study of employ-ee benefits trends surveyed both employeesand employers during the third quarter of2003. Visit www.metlife.com to learn moreabout what this survey revealed.
• Mercer. The 2003 Coping with theEconomy Survey, with 242 organizationsresponding, reflected trends in the retirementand health care industries. Contact MercerHuman Resource Consulting at www.mercerhr.com.
• U.S. Centers for Medicare & MedicaidServices (CMS), Office of the Actuary,National Health Expenditures. Both historicaland projected statistics measure spending forhealth care in the U.S. by type of service deliv-ered and source of funding for those services.Go to www.cms.hhs.gov to learn more.
A research resource for benefit professionals featuring statistical
snapshots of benefit plan costs,plan designs and the benefits
management function
BenefitsBarometer

4
Employment cost indexChanges in wages and salaries and in benefit costs, private industry, 1994-2004
12-month percent changes in employment cost index, not seasonally adjusted
Compensation June June June June June Component 2000 2001 2002 2003 2004Civilian workers
Compensation costs 4.4 3.9 4.0 3.7 3.9 Wages and salaries 4.0 3.7 3.5 2.7 2.5 Benefit costs 5.3 4.5 5.0 6.3 7.2Private industry
Compensation costs 4.6 4.0 4.0 3.5 4.0 Wages and salaries 4.1 3.8 3.6 2.6 2.6 Benefit costs 5.7 4.8 5.1 6.1 7.3State and local government
Compensation costs 3.5 3.6 3.6 4.1 3.4 Wages and salaries 3.7 3.7 3.2 3.1 1.9 Benefit costs 3.1 3.4 4.6 6.8 6.6
20042003200220012000199919981997199619951994
Wages and salaries
+2.6
Benefits +6.8
Source: Bureau of Labor Statistics, 2004
Source: Bureau of Labor Statistics, 2004
1%
2%
3%
4%
5%
6%
7%
8%
Source: Bureau of Labor Statistics, 2004
Employer costs for employee compensation, June 2004Compensation Civilian State and local Privatecomponent workers government industry
Wages and salaries 70.9% 68.9% 71.4%
Benefits 29.1 31.1 28.6
➤ Paid leave 6.6 7.7 6.4
➤ Supplemental pay 2.4 .9 2.7
➤ Insurance 7.7 10.3 7.1
• Health benefits 7.3 9.9 6.6
➤ Retirement & savings 4.1 6.2 3.5
• Defined benefit 2.5 5.5 1.7
• Defined contribution 1.6 .7 1.8
➤ Legally required 8.1 5.9 8.7
➤ Other benefits .2 .2 .2
BENEFIT COST HIGHLIGHTS
Total Health Care Spending in 2002:Where did the money go?
Other Spending = Long-term care, administrative & other expenditures.Source: Federal Trade Commission & Dept. of Justice Report: Improving Health Care: A Dose of Competition, July 2004.
Physician & Clinical Services: 22%Hospital Care: 31%
Other Spending: 36%
Prescription Drugs: 11%
0
$150
$200
$250
2000 2001 2002 2003 2004
$135
$222
Health premiums soarAverage monthly employee contribution to cover
a family in an employer-sponsored health plan
Source: Kaiser/HRET Survey of Employer-Sponsored Health Benefits: 2000-2004; Exh. 6.1.
5
Source: Hewitt Health Value Incentive, 2004
Source: Hewitt Health Value Incentive, 2004
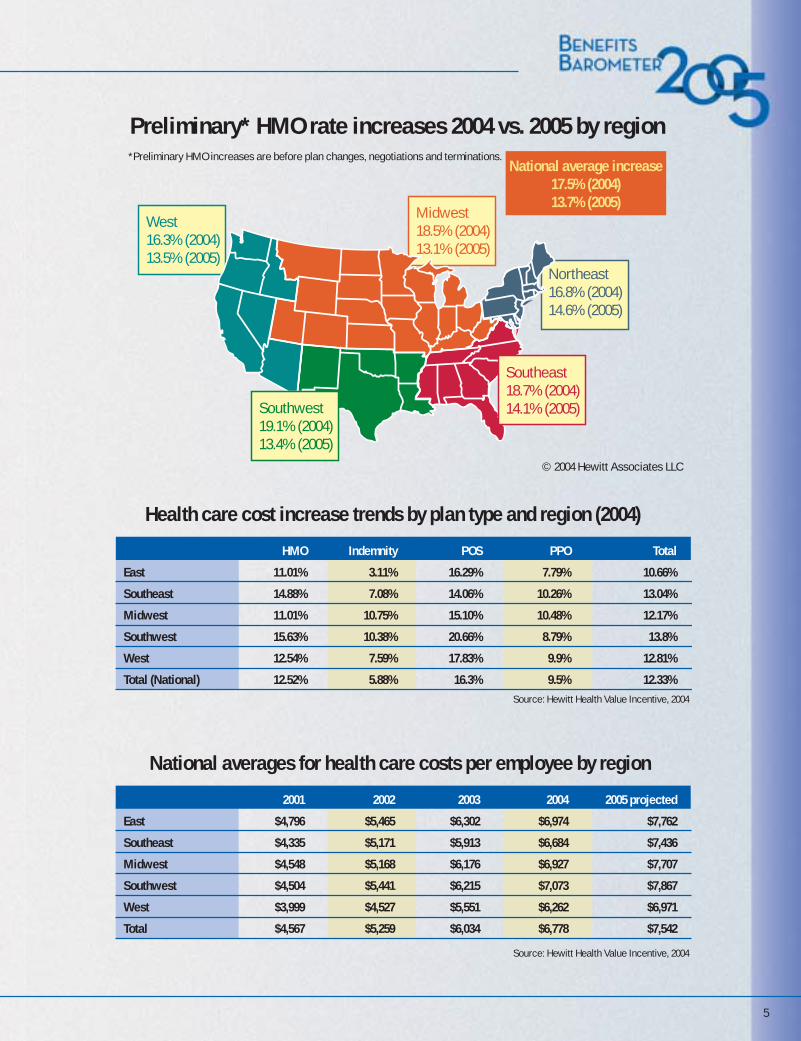
Health care cost increase trends by plan type and region (2004) HMO Indemnity POS PPO Total
East 11.01% 3.11% 16.29% 7.79% 10.66%
Southeast 14.88% 7.08% 14.06% 10.26% 13.04%
Midwest 11.01% 10.75% 15.10% 10.48% 12.17%
Southwest 15.63% 10.38% 20.66% 8.79% 13.8%
West 12.54% 7.59% 17.83% 9.9% 12.81%
Total (National) 12.52% 5.88% 16.3% 9.5% 12.33%
National averages for health care costs per employee by region 2001 2002 2003 2004 2005 projected
East $4,796 $5,465 $6,302 $6,974 $7,762
Southeast $4,335 $5,171 $5,913 $6,684 $7,436
Midwest $4,548 $5,168 $6,176 $6,927 $7,707
Southwest $4,504 $5,441 $6,215 $7,073 $7,867
West $3,999 $4,527 $5,551 $6,262 $6,971
Total $4,567 $5,259 $6,034 $6,778 $7,542
Northeast16.8% (2004)14.6% (2005)
National average increase17.5% (2004)13.7% (2005)
West 16.3% (2004)13.5% (2005)
Midwest 18.5% (2004)13.1% (2005)
Preliminary* HMO rate increases 2004 vs. 2005 by region *Preliminary HMO increases are before plan changes, negotiations and terminations.
Southwest 19.1% (2004)13.4% (2005)
Southeast18.7% (2004)14.1% (2005)
© 2004 Hewitt Associates LLC

6
Note: 2002 - 2006 data are projections; total drug spend includes uninsured expenditures.
Drug spend Percentage change
Drug spend continues to increase, but trend is slowing
Source: U.S. Centers for Medicare & Medicaid Services (CMS), Office of the Actuary, 2004
2001 2002 2003* 2004* 2005* 2007* 2009* 2011* 2013*
0% to 5% 13%
0
100
200
300
400
500
600
5%
10%
15%
20%
$ in
bill
ions
$140.8 $162.4 $184.1 $207.9 $233.6
15.9% 15.3%13.4% 12.9%
12.4%
$292.4 $360.1 $435.2 $519.8
11.7%10.7%
9.7% 9.2%
Ten-year look at drug spend as a proportion of health care costs
By what percentage did you project your health coverage
costs to increase from 2003 to 2004?
Note: 2004-2013 data are projectionsSource: U.S. Centers for Medicare & Medicaid Services (CMS),
Office of the Actuary, 2004
Source: 2004 EBN-Hay Survey on Benefits Management
3%
6%
9%
12%
15%
15.5% in 2013
13.6% in 2008
11.6% in 2004
5.8% in 1994
8.5% in 1999
1994 1996 1998 2000 2002 2004E 2006E 2008E 2010E 2012E 2013E
20% or more 8%
16% to 19% 10%
10% to 15% 46%
6% to 9% 23%
By what percentage did your pharmaceutical costs
increase from 2003 to 2004?
16% to 19%
15%
20% or more
8%
Source: 2004 EBN-Hay Survey on Benefits Management
0% to 5%
15%
6% to 9%
24%
10% to 15%
38%
0
1
2
3
4
5
6
7
8
Mas
s...8
%
Food
...6%
Mai
l/Onl
ine.
..5%
Clin
ic/O
ther
...5%
Chai
n...5
%
Ind.
..3%
Whether Ever Purchased Prescription Medication froma Foreign Country to Save Money Among Pharmacy Customers - By Type of Pharmacy Used Most Often
Among pharmacy customers, Mass merchant customers were the most likely (8%) to have purchased prescription medications from a foreign country to save money, independent customers (3%) were the least likely.
Source: 2004 Wilson Health Information, LLC.
BENEFIT COST HIGHLIGHTS

7
Drug plan cost-sharing
Source: Caremark Analytics & Outcomes, Book of Business Data©2004 Caremark Inc. All Rights Reserved.
Source: 2004 EBN-Hay Survey on Benefits Management
2003 retail and pharmacy sales $203.1 billion
What changes did you make in your pharmacy benefit plan for 2004 or
are you considering for 2005?
Supermarket12.3%
Source: National Association of Chain Drug Stores,2003 Community Pharmacy Results
Traditionalchainpharmacies42.0%
Mail order17.2%
Independentpharmacies
18.8%
Mass merchant9.6%
Increased co-pays 54%
Increased number of co-pay tiers 12%
Mandatory mail order for maintenance medication 8%
Mandatory generic where available 11%
Open formulary (where nonformulary brand has a higher co-pay than formulary brand) 13%
Closed formulary (where nonformulary brand drugs are reimbursed only with special approval) 2%
In 2003 and 2004, plans increased participant cost share.
Percent of participants covered
Source: 2004 EBN-Hay Survey on Benefits Management
How many employee co-payment tiers does your pharmacy benefit
have (excluding mail order)?None 2%One 1%Two 17%Three 74%Four or more 4%NA 2%
0% 10% 20% 30% 40% 50% 60% 70%
3- tier co-pay
52%
60%
63%
51%
53%
54%
21%
26%
31%
23%
19%
19%
11%
13%
15%
6%
12%
14%
Dispense as written penalty
Co-insurance
Retail refill restriction
Deductible
Maximum out-of-pocket
2002
2003
2004

8
Copay Coinsurance BothNeither Copay or Coinsurance – whichever
Four-Tier Three-Tier Two-TierPayment is the same regardless of type of drugOther/Don't know
Average copays for generic drugs, preferred drugs, nonpreferred and four-tier drugs
Generic
84% 3%3%10% 1%
84% 2%4%9% 1%
84% 2%5%8% 2%
17% 3%50% 31%
Preferred
Nonpreferred
Four-Tier
2000
27% 22%49% 2%
41% 1%41% 18%
55% 1%30% 13%
63% 2%23% 13%
65%3% 1%20% 10%
2001
2002
2003
2004
Distribution of covered workers with the following types of cost sharing for prescription drugs,
by drug type, 2004
Source: Kaiser/HRET Survey of Employer-Sponsored Health Benefits: 2004
Distribution of covered workers facing different cost-sharing
formulas for prescription drug benefits
Note: Tests found no statistically different distribution from the previous year shown at p<.05. No test was conducted between 2003 and 2004 due to the addition of a new category.
Source: Kaiser/HRET Survey of Employer-Sponsored Health Benefits: 2004
* Estimate is statistically different from previous year at p<.05.^ Four-tier drug copay information was not obtanied prior to 2004.
Generic drugs
Preferred drugs
Nonpreferred drugs
Four-Tier drugs
2000
2001
2002
2003
2004
Source: Kaiser/HRET Survey of Employer-Sponsored Health Benefits: 2000, 2001, 2002, 2003, 2004
$0 $10 $20 $30 $40 $50
$7 $8*$9*$9*$10* $13$15*$17*$19*$21* $17$20$25*$29*$33* >>>>$48
BENEFIT COST HIGHLIGHTS

9
0%
3%
6%
9%
12%
15%
Increases in health insurance premiums compared to other indicators
Health insurance premiumsWorkers’ earningsOverall inflation
* Estimate is statistically different from the previous year shown at p<0.05.† Estimate is statistically different from the previous year shown at p<0.1.Note: Data on premium increases reflect the cost of health insurance premiums for a family of four.
Source: KFF/HRET Survey of Employer-Sponsored Health Benefits: 1999-2004; KPMG Survey of Employer-SponsoredHealth Benefits: 1993, 1996; The Health Insurance Association of America (HIAA): 1988, 1989, 1990; Bureau of Labor
Statistics, Consumer Price Index (U.S. City Average of Annual Inflation (April to April), 1988-2004; Bureau of LaborStatistics, Seasonally Adjusted Data from the Current Employment Statistics Survey (April to April), 1988-2004
Source: Kaiser/HRET Survey of Employer-Sponsored Health Benefits: 2004
1988 1990 1992 1994 1996 1998 2000 2002 2004
18%
12.0%
18.0%
14.0%
8.5%
0.8%
5.3%*
8.2%*10.9%*
12.9%*13.9%†
11.2%*
2.3%
2.2%
14%
10%
6%
2%
Premium increases, by plan type and funding arrangement, 2004*
11.4% 11.1% 10.0% 12.5% 12.4% 11.1% 10.3% 11.2% 13.1% 9.1%
* Tests found no statistically different estimates between fully insured and self-funded plans at p<.05.Note: Data on premium increases reflect the total cost of health insurance premiums for a family of four.
All Plans Conventional HMO PPO POS
Fully insured Self-funded
* Estimate is statistically different from All Firms at p<.05.
Source: Kaiser/HRET Survey of Employer-Sponsored Health Benefits: 2004.
Percentage change in premiums for covered workers, by firm size, 2004
All Small Firms (3-199 workers)
(3-24 workers)
(25-49 workers)
(50-199 workers)
All Large Firms
(200 or more workers)
Midsize (200-999 workers)
Large (1,000-4,999 workers)
Jumbo (5,000+ workers)
All Firms
Average annual premiums for covered workers, by plan type, 2004
Single Family
Single Family
Single Family
Single Family
Single Family
Conventional
HMO
PPO
POS
All Plans
* Estimate of total premium is statistically different from All Plans by coverage type at p<.05.Note: Family coverage is defined as health coverage for a family of four.
Worker contribution Employer contribution
$468$2,382
$552$2,674
$573$2,691
$542$2,618
$558$2,661
$3,352 $7,220
$2,906 $6,830
$3,235 $7,526
$3,085 $7,195
$3,137 $7,289
$3,820
$3,458*
$9,602
$9,504*
$10,217*$3,808*
$3,627
$3,695$9,950
$9,813
Source: Kaiser/HRET Survey of Employer-Sponsored Health Benefits: 2004.
11.5%
13.6%
12.4%
9.1%*
11.1%
10.3%
10.7%
11.6%
11.2

10
Top concerns of benefits executivesVery or Somewhat Important 2004 2003Health plan costs 93% 97%Recruiting/retention 77% 75%Skills training 65% 64%Retirement planning education 49% 46%Benefits technology 47% 52%Voluntary/supplemental benefits 23% 27%
Benefits to help work/life balance
Employee decision support tools
Cost shifting to employees
Retirement planning
Wider array of voluntary benefits
401(k) investment education
Common platform for administration
Internet access for all employees
General financial planning
Employee self service on net
Outsourcing benefits administration
Build or expand benefits Web site
Source: 2004 EBN-Hay Survey on Benefits Management
Source: The MetLife Study of Employee Benefits Trends, 2003 Source: The MetLife Study of Employee Benefits Trends, 2003
100%80%0% 20% 40% 60%
43%39%
29%23%
26%21%
25%28%
22%20%
21%28%
20%22%
18%12%
14%13%
10%13%
8%11%
5%12%
Employer pays all
Employer pays some
Employee pays all
(Among those with products through workplace)
Auto
Medical
Banking services
Dental
Home/Renter insurance
Basic term life
AD&D
Disability
Vision care
Mortgage
Dependent term life
Financial plan
Optional/Supplemental life
Travel/Accident
Critical illness
Long term care
Group legal
Estate planning
Pet
Concierge
2003
2002
Most important employeebenefits strategies
Consumer product ownership –by source of workplace funding
HEALTH PLANS

11
Ten-year view of annual percentage change in national spending for selected health services
Percentage of large firms (200 or more workers) that report they were likely to make the following changes in 2004
Increase the amount employees pay for health insurance
Increase the amount employees pay for prescription drugs
Increase the amount employees pay for deductibles
Increase the amount employees pay for office visit copays or coinsurance
Introduce tiered cost sharing for doctor visits and hospital stays Restrict employee eligibility for coverage
Drop coverage entirely
Very likely Somewhat likely Not too likely Not at all likely Don't know
8.2 8.4
1992 1993 1994 1995 1996 1997 1998 1999 2000 2001 2002
7.4
5.9 6.1 6.3
3.94.6
6.6
3.4
4.8
11.2
3.44.0
10.5
3.5
5.0
12.8
3.0
6.6
15.2
3.9
5.55.0
7.2
16.4
7.58.6
15.9
9.5
7.7
15.3
19.7
0%
5%
10%
15%
20%
Source: Kaiser Family Foundation, Trends and Indicators in the Changing Health Care Marketplace, 2004 Update,from Centers for Medicare and Medicaid Services, 2002 National Health Care Expenditures
Hospital care
Physician and clinical services
Prescription drugs
Source: Kaiser/HRET Survey of Employer Sponsored Health Benefits: 2004
52% 31% 9% 7% 1%
18% 37% 32% 12% 1%
14% 38% 32% 16% 1%
14% 38% 33% 14% 1%
2% 24% 39% 34% 2%
2% 7% 37% 53%
1% 4% 94% 1%

12
0%
20%
40%
60%
80%
100%
The largest percentage of your employees are covered in what type of medical plan (including being in several different plans of the same type)?Preferred Provider Organization 63% Traditional indemnity/fee-for-service 3% Point-of-Service 10% HMO 23% Health Reimbursement Account (company-paid) with high-deductible plan 1% Consumer-driven option, where the company contributes a specified amount per employee for medical coverage and the employee chooses from various plans 1%
Percentage of employers providing a choice of health plans, by firm size, 2004
Firms offering high-deductible health plans to employees
All Firms All Small Firms Midsize Firms* Large Firms* Jumbo Firms* (3-199 workers) (200-999 workers) (1,000-4,999 workers) (5,000+ workers)
All Firms2004 2005-20062003 2004 2005-20062003 2004 2005-20062003 2004 2005-20062003 2004 2005-2006†2003
All Small Firms(3-199 workers)
Midsize Firms(200-999 workers)
Large Firms(1,000-4,999 workers)
Jumbo Firms(5,000+ workers)
4%12%
84%
3%11%
86%
24%
33%
43%
50%
26%24%
72%
16%12%
One plan Two plans Three or more plans
Source: 2004 EBN-Hay Survey on Benefits Management
Growth in consumer-driven health plans
Consumer-driven health available currently or within 2005
Source: Milliman Group Health Insurance Survey, 2004
Offer a CDH plan
2003 survey 2004 survey
Offer a high-deductible
plan
Offer a tiered provider
network
0% 20% 40% 60% 80% 100%
29%
89%
48%
96%
17%
42%
*Distribution is statistically different from All Firms at p<.05. Source: Kaiser/HRET Survey of Employer-Sponsored Health Benefits, 2004
*Estimate is statistically different from previous year shown at p<.05. †Column total is statistically different from All Firms at p<.05.Source: Kaiser/HRET Survey of Employer-Sponsored Health Benefits: 2000, 2001, 2002, 2003, 2004.
Somewhat likely to offer Very likely to offer
0%
10%
20%
30%
40%
50%
5%10%
21%
6% 5%10%
20%
6% 5% 7%
28%
7% 5%9%*
25%
11%17% 20%
28%
22%
HEALTH PLANS

13
Average annual deductibles for covered workers, by plan type
* Estimate is statistically different from the previous year shown at p<.05. ^ Information was not obtained for HMO plans prior to 2003, or for POS plans in 1988 and 1993.Note: Average deductibles include covered workers who do not have a deductible or report a $0 deductible. For example, 30% of covered workers in PPO plans do not have a deductible for preferred providers. Among single workers enrolled in a PPO plan who do have a deductible greater than $0, the average annual preferred provider deductible is $410 and the average nonpreferred provider deductible is $595.
$0
$100
$200
$300
$400
$500
$600
$170 $175 $251* $275 $287 $289 $340 $466* $561* $558 ^ $70 $54 $113* $210 ^ $352 $409* $442 $575
PPO Preferred PPO Non-Preferred POS Preferred POS Non-Preferred Provider Provider Provider Provider
1993
Source: Kaiser/HRET Survey of Employer-Sponsored Health Benefits: 2000, 2002, 2003, 2004; KPMG Survey of Employer-Sponsored Health Benefits: 1993;The Health Insurance Association of America (HIAA): 1988
Employers offering retiree health coverage, by plan type
48%
29%27%
19%
7%14%
20% 16% 14% 14% 10%POS
27%30%
30% 33%27% 27%
HMO
35%43% 46%
54%58%
PPO
40%35%
31%28%
23% 21% 20%
Offer coverage to Medicare-eligible
15%11% 7% 5%
4%
2004200320011999199719951993
2004200320011999199719951993
Percent of all covered employees
Based on employers with 500 or more employees
TIP
41%46%
38%35%
29% 28% 28%
Offer coverage to pre-Medicare-eligible
.1% CDHP
Source: Mercer's National Survey of Employer-Sponsored Health Plans, 2004
National employee health plan enrollment
Source: Mercer's National Survey of Employer-Sponsored Health Plans, 2004
0%
10%
20%
30%
40%
50%
60%
20%
10%
30%
40%
50%
2000 2002 2003 2004

14
Examples of CarePatterns®, Caremark’s Disease Management Program Outcomes
Caremark is the first and only PBM to achieve Full Patient and Practitioner Accreditation from NCQA for asthma, CHF, coronary artery disease and diabetes disease management programs. (Effective 9/02-9/05)
BENEFITS MANAGEMENT
The CarePatterns Health Management Programs cover over 3 million lives nationally, and the first to receive both physicianand participant based NCQA accreditation. Outcomes are monitored and reported on clinical, quality and economic indicatorsfor each population. The Asthma program summarizes the improvement in key clinical measure achieved.
Source: Caremark Inc. All Rights Reserved.
The CarePatterns Health Management Programs cover over 3 million lives nationally, and the first to receive both physicianand participant based NCQA accreditation. Outcomes are monitored and reported on clinical, quality and economic indicatorsfor each population. The Diabetes program summarizes the improvement in key clinical measure achieved.
Source: Caremark Inc. All Rights Reserved.

15
Specialty Pharmaceuticals
Source: Nov. 2004. ©2005 Caremark Inc. All Rights Reserved.
Source: JP Morgan Industry Update, “Specialty Pharmacy: Conduit of Growth for Biotechnology,” March 14, 2003.
©2005 Caremark Inc. All Rights Reserved.
Source: IMS Health, JP Morgan Industry Update, “Specialty Pharmacy: Conduit of Growth for Biotechnology,” March 14, 2003, Bear Stearns Health Care Distribution, “Specialty Pharmacy Services: Among the Fastest-Growing Areas of Health Care,” November 2003, Caremark Estimates. ©2005 Caremark Inc. All Rights Reserved.
Source: “Top 10 Areas of Research,” R&D Directions,Oct. 2004, Vol. 10, No.9, p.36.
©2005 Caremark Inc. All Rights Reserved.
Rank Area Number of Drugs in Development*1 Cancer 5742 Infections 1903 Pain/Inflammation 1774 Cardiovascular Disorders 1385 Psychological Disorders 1086 Respiratory Disorders 1077 Diabetes 938 Gastrointestinal Disorders 929 Blood Disorders 8210 Dermatological Disorders 72*Includes compounds in preclinical development, Phase I, Phase II, Phase III, and awaiting FDA approval.
16
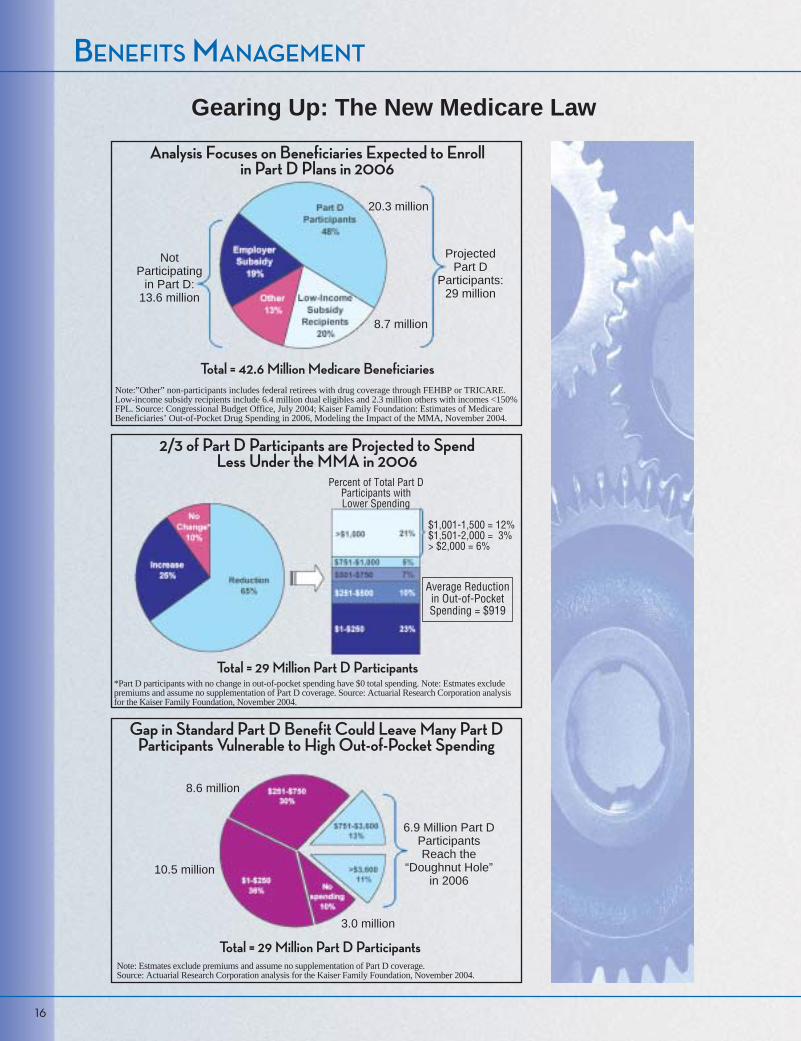
Gearing Up: The New Medicare Law
BENEFITS MANAGEMENT
Note:”Other” non-participants includes federal retirees with drug coverage through FEHBP or TRICARE.Low-income subsidy recipients include 6.4 million dual eligibles and 2.3 million others with incomes <150%FPL. Source: Congressional Budget Office, July 2004; Kaiser Family Foundation: Estimates of MedicareBeneficiaries’ Out-of-Pocket Drug Spending in 2006, Modeling the Impact of the MMA, November 2004.
*Part D participants with no change in out-of-pocket spending have $0 total spending. Note: Estmates excludepremiums and assume no supplementation of Part D coverage. Source: Actuarial Research Corporation analysisfor the Kaiser Family Foundation, November 2004.
Note: Estmates exclude premiums and assume no supplementation of Part D coverage. Source: Actuarial Research Corporation analysis for the Kaiser Family Foundation, November 2004.
Analysis Focuses on Beneficiaries Expected to Enrollin Part D Plans in 2006
2/3 of Part D Participants are Projected to SpendLess Under the MMA in 2006
Gap in Standard Part D Benefit Could Leave Many Part DParticipants Vulnerable to High Out-of-Pocket Spending
NotParticipating
in Part D:13.6 million
ProjectedPart D
Participants:29 million
20.3 million
8.7 million
Total = 42.6 Million Medicare Beneficiaries
Percent of Total Part DParticipants withLower Spending
$1,001-1,500 = 12%$1,501-2,000 = 3%> $2,000 = 6%
Average Reductionin Out-of-PocketSpending = $919
Total = 29 Million Part D Participants
Total = 29 Million Part D Participants
6.9 Million Part DParticipantsReach the
“Doughnut Hole”in 2006
8.6 million
10.5 million
3.0 million
17
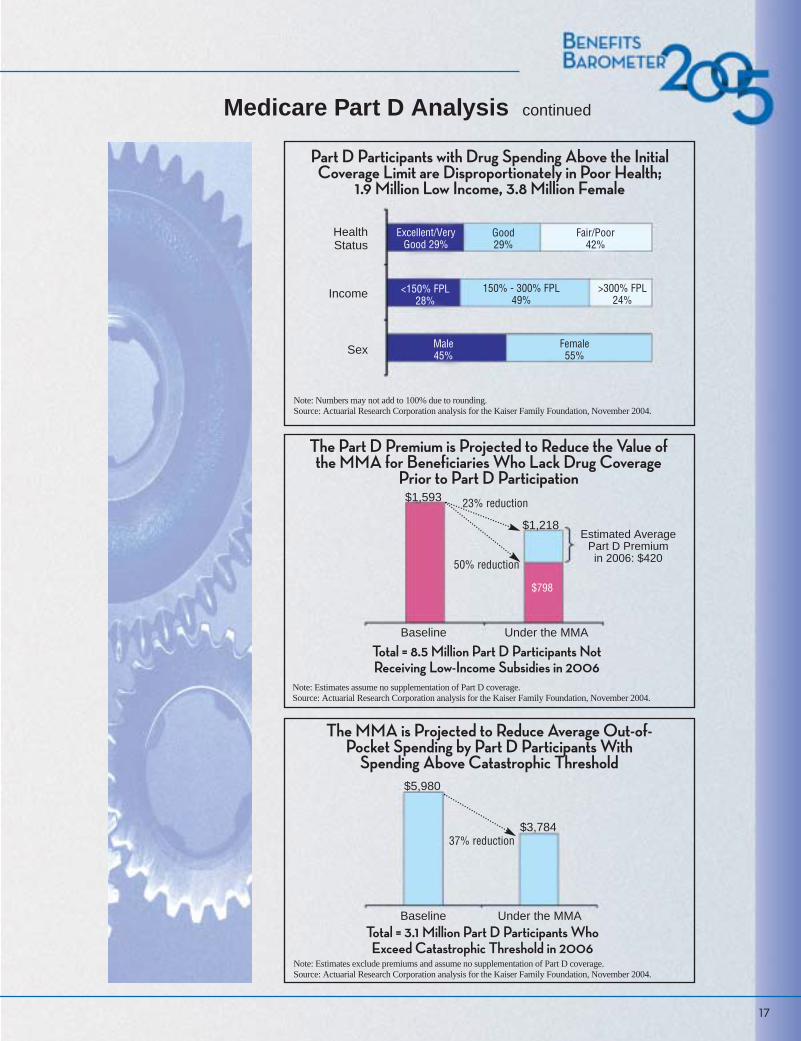
Medicare Part D Analysis continued
Part D Participants with Drug Spending Above the InitialCoverage Limit are Disproportionately in Poor Health;
1.9 Million Low Income, 3.8 Million Female
Note: Numbers may not add to 100% due to rounding.Source: Actuarial Research Corporation analysis for the Kaiser Family Foundation, November 2004.
HealthStatus
Income
Sex
The Part D Premium is Projected to Reduce the Value of the MMA for Beneficiaries Who Lack Drug Coverage
Prior to Part D Participation
Note: Estimates assume no supplementation of Part D coverage.Source: Actuarial Research Corporation analysis for the Kaiser Family Foundation, November 2004.
Total = 8.5 Million Part D Participants Not Receiving Low-Income Subsidies in 2006
Baseline Under the MMA
$1,593
$1,218Estimated Average
Part D Premium in 2006: $420
23% reduction
50% reduction
The MMA is Projected to Reduce Average Out-of-Pocket Spending by Part D Participants With
Spending Above Catastrophic Threshold$5,980
$3,784
Baseline Under the MMA
Note: Estimates exclude premiums and assume no supplementation of Part D coverage.Source: Actuarial Research Corporation analysis for the Kaiser Family Foundation, November 2004.
Total = 3.1 Million Part D Participants Who Exceed Catastrophic Threshold in 2006
37% reduction
Excellent/VeryGood 29%
<150% FPL28%
Male45%
Good29%
150% - 300% FPL49%
Female55%
Fair/Poor42%
>300% FPL24%
$798

18
Source: 2004 EBN/Hay Survey on Benefits Management
In the next year, which of the following benefits will you INTRODUCE for the first time, INCREASE the value of, MAINTAIN at the current level, DECREASE the value of (i.e., by increasing cost sharing, deductibles, etc.) or DROP? Note: N/A indicates a particular benefit is not offered nor will it be introduced.
INTRO INCR MNTN DECR DROP N/A
HEALTH PLANS:
Traditional indemnity plan 1% 1% 13% 2% 2% 81% Preferred Provider Network (PPO) 2% 5% 71% 11% 1% 12% HMO 2% 1% 35% 8% 2% 51% Point-of-Service 2% 2% 20% 3% 1% 71% Health Reimbursement Account with high-deductible plan option 16% 3% 4% 0% 0% 77% Consumer-driven voucher option 5% 1% 2% 0% 0% 90% Health Care Consumerism (Educating employees concerning
importance to them of containing costs and how to do it) 29% 31% 13% 0% 0% 28% Disease Management (Management of chronic disease where patient self-care can improve health) 23% 21% 22% 0% 0% 34% Health benefits for retirees 1% 1% 22% 5% 0% 71% Pharmacy 1% 4% 74% 15% 0% 7%
RETIREMENT PLANS:
Defined benefit (DB) plan 1% 1% 21% 2% 0% 74% Hybrid DB Plan (cash balance, etc.) 0% 0% 5% 0% 0% 92% Savings plans - 401(k)/403(b)/457 1% 9% 81% 2% 0% 8% Profit sharing plan 2% 3% 31% 1% 1% 61% ESOP 1% 1% 10% 1% 0% 87% Money purchase plan 0% 0% 4% 0% 0% 94% Broad-based stock option plan 1% 0% 5% 1% 0% 91% Stock purchase plan 1% 1% 12% 0% 0% 84%
OTHER BENEFITS:
Financial education/advice 9% 12% 31% 1% 0% 47% Full flex/cafeteria plan 3% 3% 39% 1% 0% 54% Flexible spending accounts 6% 7% 67% 1% 0% 19% Disability -- STD 3% 3% 80% 2% 0% 14% Disability -- LTD 2% 3% 87% 2% 0% 8% AD&D 2% 2% 88% 2% 0% 7% Voluntary whole/universal life 3% 3% 47% 1% 0% 46% Voluntary long-term care 12% 3% 25% 1% 0% 60% Mental health care 1% 2% 75% 2% 0% 21% EAP & substance abuse 5% 4% 70% 1% 0% 21% Child care (facility and/or cash subsidy) 0% 1% 8% 1% 0% 89% Child care referral services 1% 1% 22% 1% 0% 75% Eldercare 1% 1% 13% 0% 0% 84% Dental 2% 4% 88% 4% 0% 4% Vision 5% 4% 68% 2% 0% 22% Hearing 1% 1% 38% 0% 0% 61% Wellness 10% 19% 44% 2% 0% 26% Group legal 4% 1% 19% 1% 0% 75% Relocation assistance 1% 1% 40% 1% 0% 56% Transportation/parking assistance 1% 2% 26% 1% 0% 69% Paid time off plan 2% 5% 67% 2% 0% 24% Flexible hours 2% 5% 59% 1% 0% 34% Dependent care days 0% 1% 18% 1% 0% 80% Life insurance living benefits 0% 1% 36% 1% 0% 62% Employee self-service technology 13% 18% 16% 1% 0% 51% Work at home policy 2% 2% 36% 1% 0% 59% Domestic partner health coverage 5% 2% 22% 1% 0% 70% Casual dress day 1% 2% 77% 1% 0% 20% Convenience (concierge) services 2% 2% 10% 1% 0% 85% Training 4% 28% 57% 2% 0% 9%
BENEFITS MANAGEMENT

2211 Sanders RoadNorthbrook, IL 60062
800.927.3727www.caremark.com
©2005 Caremark. All Rights Reserved.
Reprinted from Benefit Source Book 2005. One State Street Plaza, 25th Floor, New York, NY 10004
20564-0904