Embed Size (px)
Citation preview
2014-15 School Accountability Report Card for The Guidance Charter School Page 1 of 16
The Guidance Charter School
School Accountability Report Card
Reported Using Data from the 2014-15 School Year
Published During 2015-16
By February 1 of each year, every school in California is required by state law to publish a School Accountability Report Card (SARC). The SARC contains information about the condition and performance of each California public school. Under the Local Control Funding Formula (LCFF) all local educational agencies (LEAs) are required to prepare a Local Control Accountability Plan (LCAP), which describes how they intend to meet annual school-specific goals for all pupils, with specific activities to address state and local priorities. Additionally, data reported in an LCAP is to be consistent with data reported in the SARC. • For more information about SARC requirements, see the California Department of Education (CDE) SARC Web page at
http://www.cde.ca.gov/ta/ac/sa/. • For more information about the LCFF or LCAP, see the CDE LCFF Web page at http://www.cde.ca.gov/fg/aa/lc/. • For additional information about the school, parents/guardians and community members should contact the school principal or
the district office. DataQuest DataQuest is an online data tool located on the CDE DataQuest Web page at http://dq.cde.ca.gov/dataquest/ that contains additional information about this school and comparisons of the school to the district, the county, and the state. Specifically, DataQuest is a dynamic system that provides reports for accountability (e.g., test data, enrollment, high school graduates, dropouts, course enrollments, staffing, and data regarding English learners. Internet Access Internet access is available at public libraries and other locations that are publicly accessible (e.g., the California State Library). Access to the Internet at libraries and public locations is generally provided on a first-come, first-served basis. Other use restrictions may include the hours of operation, the length of time that a workstation may be used (depending on availability), the types of software programs available on a workstation, and the ability to print documents.
About This School Contact Information (Most Recent Year)
School Contact Information
School Name------- The Guidance Charter School
Street------- 1125-B East Palmdale Blvd. k-6 campus
City, State, Zip------- Palmdale, CA 93550
Phone Number------- 661-272-1701
Principal------- Dr. Peter Palacio k-6, Mrs. Stephanie Najar 7-12
E-mail Address------- [email protected]
Web Site-------
Grades Served K-12
CDS Code 19-64857-6119580

2014-15 School Accountability Report Card for The Guidance Charter School Page 2 of 16
District Contact Information
District Name------- The Guidance Charter School k-6 campus
Phone Number------- 661-272-1701
Superintendent------- Kamal Al Khatib
E-mail Address------- [email protected]
Web Site------- www.thegcs.org
School Description and Mission Statement (Most Recent Year)
The Guidance Charter School will empower every student in K-12 with essential skills and knowledge, inspire lifelong learning, and develop responsible citizens in a school with both classroom-based and independent study options. This will be attained by equipping the students with three kinds of literacy necessary in the 21st century: ability to read, write, speak and calculate with clarity and precision; the ability to master the use of information technology tools in acquiring knowledge through worldwide data mines; and the ability to participate passionately and responsibly in the life of the community. Student Enrollment by Grade Level (School Year 2014-15)
Grade Number of
Level Students
Kindergarten 36
Grade 1 41
Grade 2 40
Grade 3 49
Grade 4 46
Grade 5 49
Grade 6 47
Grade 7 101
Grade 8 96
Grade 9 49
Grade 10 45
Grade 11 27
Grade 12 19
Total Enrollment 645

2014-15 School Accountability Report Card for The Guidance Charter School Page 3 of 16
Student Enrollment by Group (School Year 2014-15)
Student Percent of
Group Total Enrollment
Black or African American 18.1
American Indian or Alaska Native 0.3
Asian 1.4
Filipino 0.8
Hispanic or Latino 70.5
Native Hawaiian or Pacific Islander 0.2
White 7.1
Two or More Races 1.4
Socioeconomically Disadvantaged 81.7
English Learners 22.2
Students with Disabilities 7.1
Foster Youth 0.8
A. Conditions of Learning
State Priority: Basic The SARC provides the following information relevant to the Basic State Priority (Priority 1): • Degree to which teachers are appropriately assigned and fully credentialed in the subject area and for the pupils they are
teaching; • Pupils have access to standards-aligned instructional materials; and • School facilities are maintained in good repair. Teacher Credentials
Teachers School District
2013-14 2014-15 2015-16 2015-16
With Full Credential 29 31
Without Full Credential 8 9
Teaching Outside Subject Area of Competence (with full credential) 0
Teacher Misassignments and Vacant Teacher Positions
Indicator 2013-14 2014-15 2015-16
Misassignments of Teachers of English Learners 0
Total Teacher Misassignments * 0
Vacant Teacher Positions 0 Note: “Misassignments” refers to the number of positions filled by teachers who lack legal authorization to teach that grade level, subject area, student group, etc. * Total Teacher Misassignments includes the number of Misassignments of Teachers of English Learners.

2014-15 School Accountability Report Card for The Guidance Charter School Page 4 of 16
Core Academic Classes Taught by Highly Qualified Teachers (School Year 2014-15)
Location of Classes Percent of Classes In Core Academic Subjects
Taught by Highly Qualified Teachers Not Taught by Highly Qualified Teachers
This School 100.0 0.0
All Schools in District 76.4 23.6
High-Poverty Schools in District 76.4 23.6
Low-Poverty Schools in District 0.0 0.0 Note: High-poverty schools are defined as those schools with student eligibility of approximately 40 percent or more in the free and reduced price meals program. Low-poverty schools are those with student eligibility of approximately 39 percent or less in the free and reduced price meals program. Quality, Currency, Availability of Textbooks and Instructional Materials (School Year 2015-16) Year and month in which data were collected: September 2015
Core Curriculum Area Textbooks and Instructional Materials/
Year of Adoption
From Most Recent
Adoption?
Percent of Students Lacking Own
Assigned Copy
Reading/Language Arts Houghton Mifflin Harcourt Core Curriculum Language Arts. Differentiated Instruction Anthology Texts and Workbooks. Classroom basal reading book sets, focus wall posters, sound cards, English Language Leaner teacher intervention guides, teacher and student on-line resource cd-dvd
Yes 0
Mathematics Math K-5: Engage New York Math 2015
Math 6 – 8: Houghton Mifflin Math Big Ideas 2015
Yes 0
Science Houghton Mifflin Harcourt Core Curriculum Science Differentiated Instruction Textbooks/workbooks. Tubs with materials needed for science experiments
posters and realia items. Online teacher-student resource cd-dvd
Yes 0
History-Social Science Social Studies Core Curriculum Differentiated Instruction Music cd-dvd
Student textbooks and Workbooks Class library reading books. Online teacher -student resouce
Yes 0
Foreign Language Arabic k-6 Arabic, Spanish and French 7-12 campus Yes 0
Health Houghton Mifflin Harcourt Curriculum differentiated instruction textbook and support materials.
0
Visual and Performing Arts K-6 students have been exposed to classical music, ballet, choreography, stage production via the Lancaster Performing Arts Theater. This performing group has come to visit the campus so students can appreciate the performing arts. These performances and activities are core curriculum adoption. 7-12 campus has Media classes, graphic arts, drama and drum line.
Yes 0
Science Laboratory Equipment (grades 9-12)
3 fully stocked and functioning laboratories. One part-time lab. tech. supports the teacher and students with weekly laboratory in all sciences.
0

2014-15 School Accountability Report Card for The Guidance Charter School Page 5 of 16
School Facility Conditions and Planned Improvements (Most Recent Year)
K-6 campus, school custodian completes a monthly safety checklist that is logged on a routine basis and verified by Principal. Custodian clears campus of any debris on a daily basis. Custodian disenfects and vacuums classrooms on a daily basis. 7-12 campus has two custodians, that regularly report needed repairs or maintenance needs to the Principal. The 7-12 Principal creates work orders through our system and to the supporting District. Outside vendors are often used to complete repairs and projects by means of a bid process involving three or more bids to obtain the best service and price for the project. School Facility Good Repair Status (Most Recent Year)
School Facility Good Repair Status (Most Recent Year) Year and month in which data were collected: January 2015
System Inspected Repair Status Repair Needed and
Action Taken or Planned Good Fair Poor
Systems: Gas Leaks, Mechanical/HVAC, Sewer
X
Interior: Interior Surfaces X Tiles floors regrouted
Cleanliness: Overall Cleanliness, Pest/ Vermin Infestation
X Health Department Inspection Conducted
Electrical: Electrical X Cafeteria electrical outage has been repaired, swamp coolers were added to K-1 classes.
Restrooms/Fountains: Restrooms, Sinks/ Fountains
X Drinking fountains were all replaced with brand new fountains.
Safety: Fire Safety, Hazardous Materials X
Structural: Structural Damage, Roofs X Roof tiles and leaks in front office were repaired
External: Playground/School Grounds, Windows/ Doors/Gates/Fences
X Door handles have been repaired and/or replaced
Overall Facility Rating (Most Recent Year)
Year and month in which data were collected: January 2015
Overall Rating Exemplary Good Fair Poor
X
B. Pupil Outcomes
State Priority: Pupil Achievement The SARC provides the following information relevant to the State priority: Pupil Achievement (Priority 4): • Statewide assessments (i.e., California Assessment of Student Performance and Progress [CAASPP], Science California Standards
Tests); and • The percentage of pupils who have successfully completed courses that satisfy the requirements for entrance to the University
of California and the California State University, or career technical education sequences or programs of study

2014-15 School Accountability Report Card for The Guidance Charter School Page 6 of 16
California Assessment of Student Performance and Progress Results for All Students (School Year 2014-15)
Subject
Percent of Students Meeting or Exceeding the State Standards (grades 3-8 and 11)
School District State
English Language Arts/Literacy 21 30 44
Mathematics 9 19 33 Note: Percentages are not calculated when the number of students tested is ten or less, either because the number of students in this category is too small for statistical accuracy or to protect student privacy.
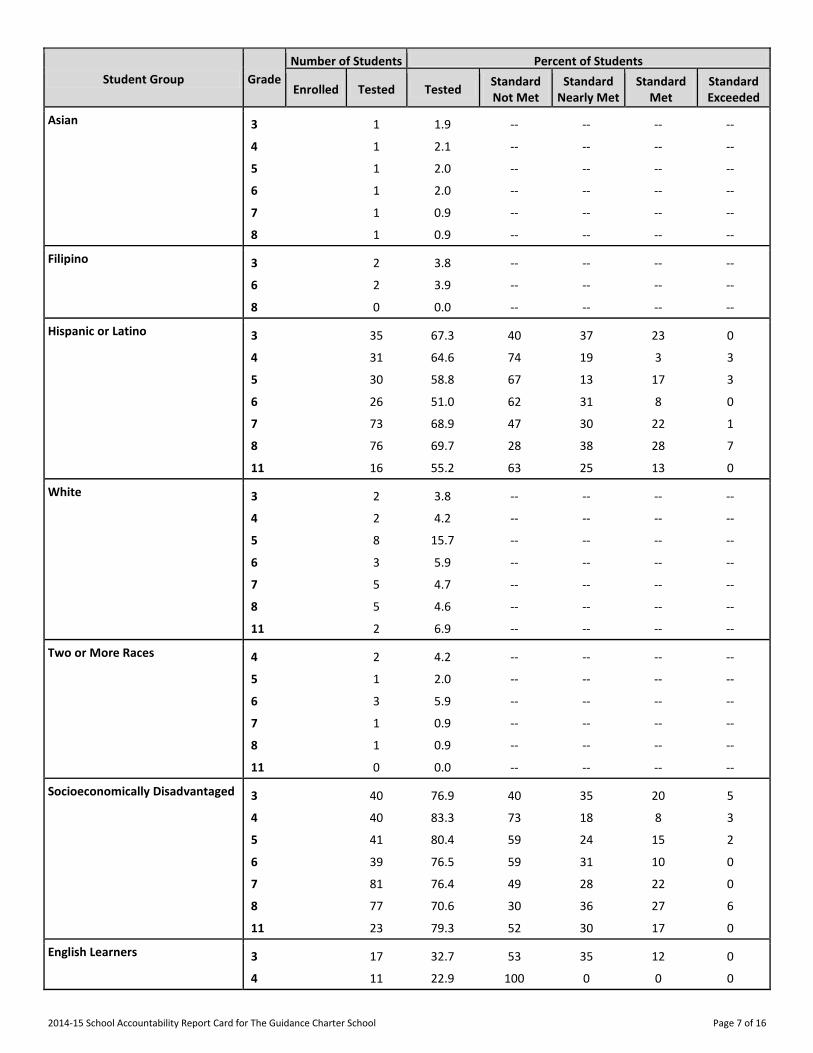
CAASPP Assessment Results - English Language Arts (ELA) Disaggregated by Student Groups, Grades Three through Eight and Eleven (School Year 2014-15)
Student Group Grade
Number of Students Percent of Students
Enrolled Tested Tested Standard Not Met
Standard Nearly Met
Standard Met
Standard Exceeded
All Students 3 52 49 94.2 39 39 18 4
4 48 47 97.9 72 19 6 2
5 51 48 94.1 58 23 15 4
6 51 47 92.2 57 30 11 0
7 106 92 86.8 48 29 21 2
8 109 98 89.9 35 35 24 6
11 29 25 86.2 52 32 16 0
Male 3 18 34.6 44 39 11 6
4 30 62.5 63 23 10 3
5 28 54.9 68 14 14 4
6 23 45.1 61 35 0 0
7 35 33.0 57 26 17 0
8 46 42.2 39 37 22 2
11 12 41.4 42 33 25 0
Female 3 31 59.6 35 39 23 3
4 17 35.4 88 12 0 0
5 20 39.2 45 35 15 5
6 24 47.1 54 25 21 0
7 57 53.8 42 32 23 4
8 52 47.7 31 33 27 10
11 13 44.8 62 31 8 0
Black or African American 3 9 17.3 -- -- -- --
4 11 22.9 73 18 9 0
5 8 15.7 -- -- -- --
6 12 23.5 75 17 8 0
7 12 11.3 67 25 8 0
8 15 13.8 67 20 7 7
11 6 20.7 -- -- -- --
American Indian or Alaska Native 7 0 0.0 -- -- -- --
11 1 3.4 -- -- -- --
2014-15 School Accountability Report Card for The Guidance Charter School Page 7 of 16
Student Group Grade
Number of Students Percent of Students
Enrolled Tested Tested Standard Not Met
Standard Nearly Met
Standard Met
Standard Exceeded
Asian 3 1 1.9 -- -- -- --
4 1 2.1 -- -- -- --
5 1 2.0 -- -- -- --
6 1 2.0 -- -- -- --
7 1 0.9 -- -- -- --
8 1 0.9 -- -- -- --
Filipino 3 2 3.8 -- -- -- --
6 2 3.9 -- -- -- --
8 0 0.0 -- -- -- --
Hispanic or Latino 3 35 67.3 40 37 23 0
4 31 64.6 74 19 3 3
5 30 58.8 67 13 17 3
6 26 51.0 62 31 8 0
7 73 68.9 47 30 22 1
8 76 69.7 28 38 28 7
11 16 55.2 63 25 13 0
White 3 2 3.8 -- -- -- --
4 2 4.2 -- -- -- --
5 8 15.7 -- -- -- --
6 3 5.9 -- -- -- --
7 5 4.7 -- -- -- --
8 5 4.6 -- -- -- --
11 2 6.9 -- -- -- --
Two or More Races 4 2 4.2 -- -- -- --
5 1 2.0 -- -- -- --
6 3 5.9 -- -- -- --
7 1 0.9 -- -- -- --
8 1 0.9 -- -- -- --
11 0 0.0 -- -- -- --
Socioeconomically Disadvantaged 3 40 76.9 40 35 20 5
4 40 83.3 73 18 8 3
5 41 80.4 59 24 15 2
6 39 76.5 59 31 10 0
7 81 76.4 49 28 22 0
8 77 70.6 30 36 27 6
11 23 79.3 52 30 17 0
English Learners 3 17 32.7 53 35 12 0
4 11 22.9 100 0 0 0
2014-15 School Accountability Report Card for The Guidance Charter School Page 8 of 16
Student Group Grade
Number of Students Percent of Students
Enrolled Tested Tested Standard Not Met
Standard Nearly Met
Standard Met
Standard Exceeded
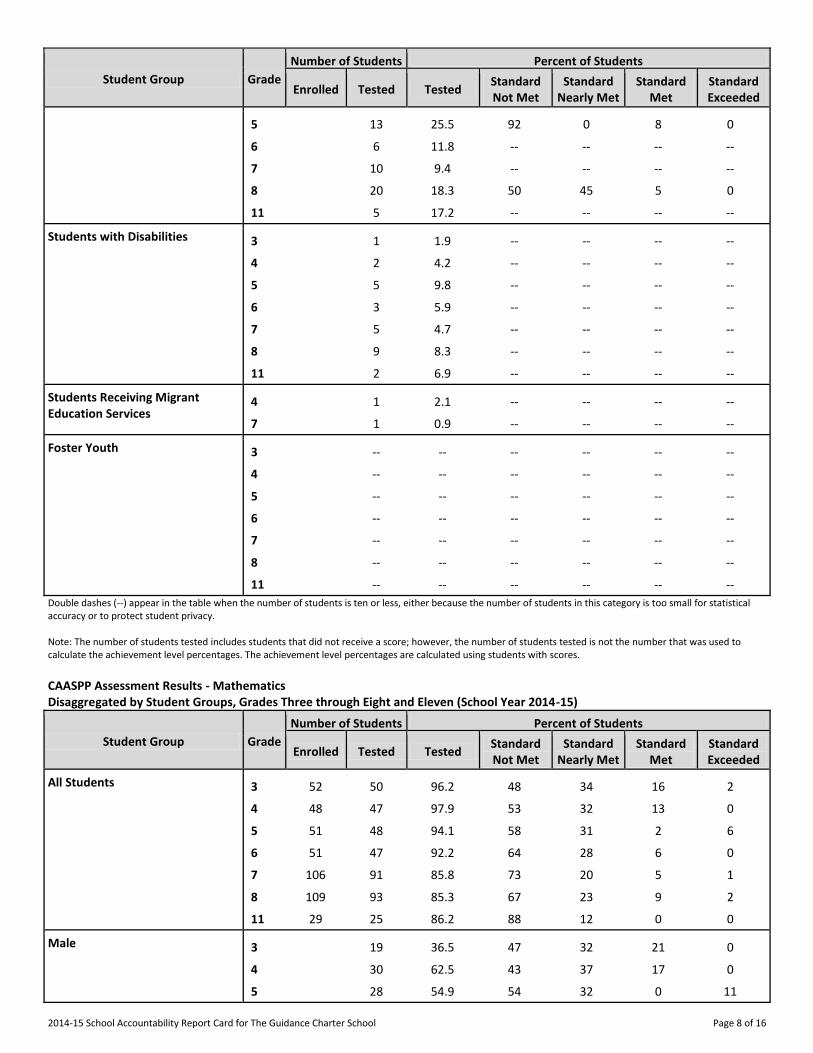
5 13 25.5 92 0 8 0
6 6 11.8 -- -- -- --
7 10 9.4 -- -- -- --
8 20 18.3 50 45 5 0
11 5 17.2 -- -- -- --
Students with Disabilities 3 1 1.9 -- -- -- --
4 2 4.2 -- -- -- --
5 5 9.8 -- -- -- --
6 3 5.9 -- -- -- --
7 5 4.7 -- -- -- --
8 9 8.3 -- -- -- --
11 2 6.9 -- -- -- --
Students Receiving Migrant Education Services
4 1 2.1 -- -- -- --
7 1 0.9 -- -- -- --
Foster Youth 3 -- -- -- -- -- --
4 -- -- -- -- -- --
5 -- -- -- -- -- --
6 -- -- -- -- -- --
7 -- -- -- -- -- --
8 -- -- -- -- -- --
11 -- -- -- -- -- --
Double dashes (--) appear in the table when the number of students is ten or less, either because the number of students in this category is too small for statistical accuracy or to protect student privacy. Note: The number of students tested includes students that did not receive a score; however, the number of students tested is not the number that was used to calculate the achievement level percentages. The achievement level percentages are calculated using students with scores.
CAASPP Assessment Results - Mathematics Disaggregated by Student Groups, Grades Three through Eight and Eleven (School Year 2014-15)
Student Group Grade
Number of Students Percent of Students
Enrolled Tested Tested Standard Not Met
Standard Nearly Met
Standard Met
Standard Exceeded
All Students 3 52 50 96.2 48 34 16 2
4 48 47 97.9 53 32 13 0
5 51 48 94.1 58 31 2 6
6 51 47 92.2 64 28 6 0
7 106 91 85.8 73 20 5 1
8 109 93 85.3 67 23 9 2
11 29 25 86.2 88 12 0 0
Male 3 19 36.5 47 32 21 0
4 30 62.5 43 37 17 0
5 28 54.9 54 32 0 11
2014-15 School Accountability Report Card for The Guidance Charter School Page 9 of 16
Student Group Grade
Number of Students Percent of Students
Enrolled Tested Tested Standard Not Met
Standard Nearly Met
Standard Met
Standard Exceeded
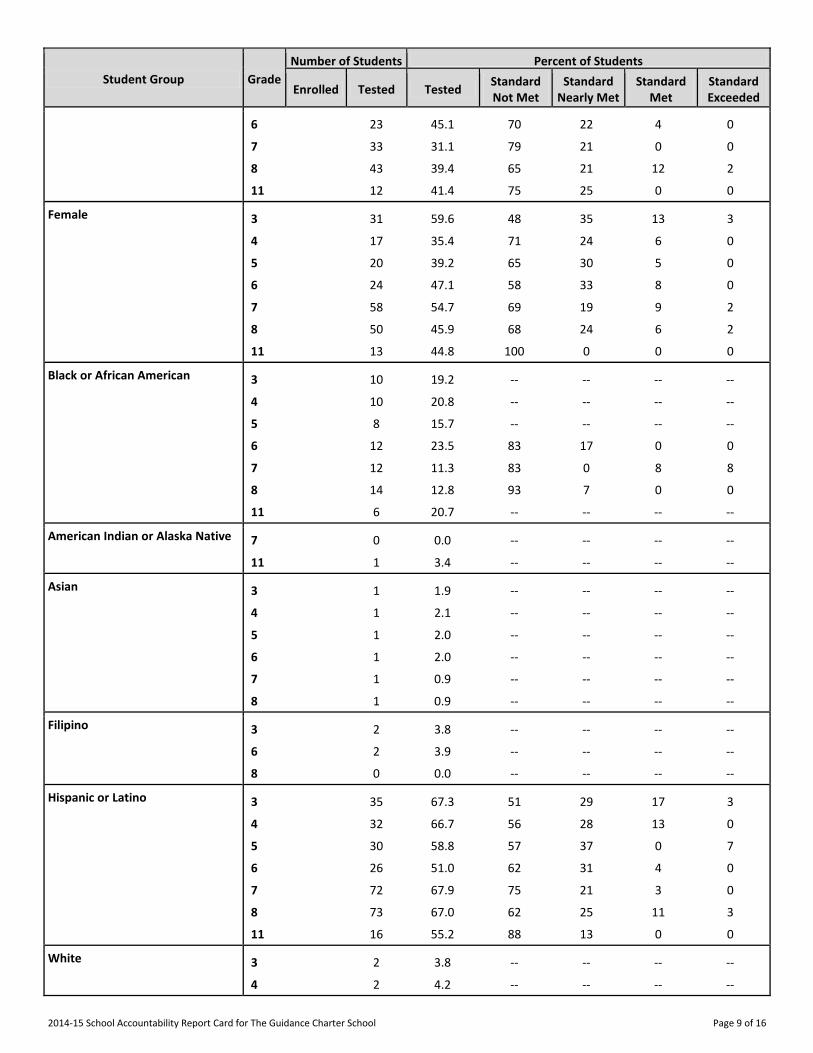
6 23 45.1 70 22 4 0
7 33 31.1 79 21 0 0
8 43 39.4 65 21 12 2
11 12 41.4 75 25 0 0
Female 3 31 59.6 48 35 13 3
4 17 35.4 71 24 6 0
5 20 39.2 65 30 5 0
6 24 47.1 58 33 8 0
7 58 54.7 69 19 9 2
8 50 45.9 68 24 6 2
11 13 44.8 100 0 0 0
Black or African American 3 10 19.2 -- -- -- --
4 10 20.8 -- -- -- --
5 8 15.7 -- -- -- --
6 12 23.5 83 17 0 0
7 12 11.3 83 0 8 8
8 14 12.8 93 7 0 0
11 6 20.7 -- -- -- --
American Indian or Alaska Native 7 0 0.0 -- -- -- --
11 1 3.4 -- -- -- --
Asian 3 1 1.9 -- -- -- --
4 1 2.1 -- -- -- --
5 1 2.0 -- -- -- --
6 1 2.0 -- -- -- --
7 1 0.9 -- -- -- --
8 1 0.9 -- -- -- --
Filipino 3 2 3.8 -- -- -- --
6 2 3.9 -- -- -- --
8 0 0.0 -- -- -- --
Hispanic or Latino 3 35 67.3 51 29 17 3
4 32 66.7 56 28 13 0
5 30 58.8 57 37 0 7
6 26 51.0 62 31 4 0
7 72 67.9 75 21 3 0
8 73 67.0 62 25 11 3
11 16 55.2 88 13 0 0
White 3 2 3.8 -- -- -- --
4 2 4.2 -- -- -- --

2014-15 School Accountability Report Card for The Guidance Charter School Page 10 of 16
Student Group Grade
Number of Students Percent of Students
Enrolled Tested Tested Standard Not Met
Standard Nearly Met
Standard Met
Standard Exceeded
5 8 15.7 -- -- -- --
6 3 5.9 -- -- -- --
7 5 4.7 -- -- -- --
8 4 3.7 -- -- -- --
11 2 6.9 -- -- -- --
Two or More Races 4 2 4.2 -- -- -- --
5 1 2.0 -- -- -- --
6 3 5.9 -- -- -- --
7 1 0.9 -- -- -- --
8 1 0.9 -- -- -- --
11 0 0.0 -- -- -- --
Socioeconomically Disadvantaged 3 41 78.8 44 37 17 2
4 41 85.4 49 34 15 0
5 41 80.4 59 32 0 7
6 39 76.5 64 28 5 0
7 80 75.5 75 18 5 1
8 75 68.8 65 23 11 1
11 23 79.3 91 9 0 0
English Learners 3 17 32.7 76 18 6 0
4 11 22.9 73 18 9 0
5 13 25.5 77 23 0 0
6 6 11.8 -- -- -- --
7 11 10.4 91 0 0 0
8 19 17.4 79 21 0 0
11 5 17.2 -- -- -- --
Students with Disabilities 3 1 1.9 -- -- -- --
4 2 4.2 -- -- -- --
5 5 9.8 -- -- -- --
6 3 5.9 -- -- -- --
7 5 4.7 -- -- -- --
8 9 8.3 -- -- -- --
11 2 6.9 -- -- -- --
Students Receiving Migrant Education Services
4 1 2.1 -- -- -- --
7 1 0.9 -- -- -- --
Foster Youth 3 -- -- -- -- -- --
4 -- -- -- -- -- --
5 -- -- -- -- -- --
6 -- -- -- -- -- --
2014-15 School Accountability Report Card for The Guidance Charter School Page 11 of 16
Student Group Grade
Number of Students Percent of Students
Enrolled Tested Tested Standard Not Met
Standard Nearly Met
Standard Met
Standard Exceeded
7 -- -- -- -- -- --
8 -- -- -- -- -- --
11 -- -- -- -- -- --
Double dashes (--) appear in the table when the number of students is ten or less, either because the number of students in this category is too small for statistical accuracy or to protect student privacy. Note: The number of students tested includes students that did not receive a score; however, the number of students tested is not the number that was used to calculate the achievement level percentages. The achievement level percentages are calculated using students with scores.
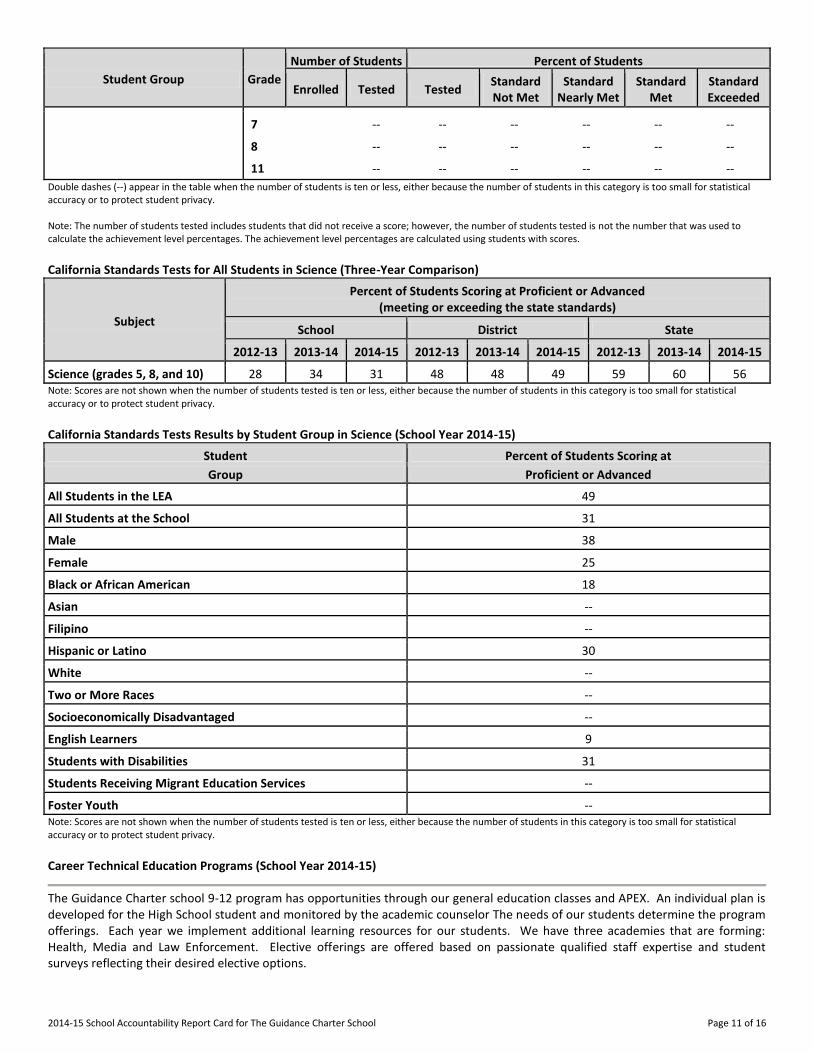
California Standards Tests for All Students in Science (Three-Year Comparison)
Subject
Percent of Students Scoring at Proficient or Advanced (meeting or exceeding the state standards)
School District State
2012-13 2013-14 2014-15 2012-13 2013-14 2014-15 2012-13 2013-14 2014-15
Science (grades 5, 8, and 10) 28 34 31 48 48 49 59 60 56 Note: Scores are not shown when the number of students tested is ten or less, either because the number of students in this category is too small for statistical accuracy or to protect student privacy.
California Standards Tests Results by Student Group in Science (School Year 2014-15)
Student Percent of Students Scoring at
Group Proficient or Advanced
All Students in the LEA 49
All Students at the School 31
Male 38
Female 25
Black or African American 18
Asian --
Filipino --
Hispanic or Latino 30
White --
Two or More Races --
Socioeconomically Disadvantaged --
English Learners 9
Students with Disabilities 31
Students Receiving Migrant Education Services --
Foster Youth -- Note: Scores are not shown when the number of students tested is ten or less, either because the number of students in this category is too small for statistical accuracy or to protect student privacy.
Career Technical Education Programs (School Year 2014-15)
The Guidance Charter school 9-12 program has opportunities through our general education classes and APEX. An individual plan is developed for the High School student and monitored by the academic counselor The needs of our students determine the program offerings. Each year we implement additional learning resources for our students. We have three academies that are forming: Health, Media and Law Enforcement. Elective offerings are offered based on passionate qualified staff expertise and student surveys reflecting their desired elective options.

2014-15 School Accountability Report Card for The Guidance Charter School Page 12 of 16
Career Technical Education Participation (School Year 2014-15)
Measure CTE Program Participation
Number of pupils participating in CTE 12
% of pupils completing a CTE program and earning a high school diploma N/D
% of CTE courses sequenced or articulated between the school and institutions of postsecondary education 4
Courses for University of California and/or California State University Admission
UC/CSU Course Measure Percent
2014-15 Students Enrolled in Courses Required for UC/CSU Admission 24.96
2013-14 Graduates Who Completed All Courses Required for UC/CSU Admission 100
State Priority: Other Pupil Outcomes The SARC provides the following information relevant to the Other Pupil Outcomes State Priority (Priority 8): • Pupil outcomes in the subject areas of English, mathematics, and physical education. California High School Exit Examination Results for Grade Ten Students (Three-Year Comparison)
Subject
Percent of Students Scoring at Proficient or Advanced
School District State
2012-13 2013-14 2014-15 2012-13 2013-14 2014-15 2012-13 2013-14 2014-15
English-Language Arts 28 20 22 39 42 57 56 58
Mathematics 28 21 12 38 34 60 62 59 Note: Percentages are not calculated when the number of students tested is ten or less, either because the number of students in this category is too small for statistical accuracy or to protect student privacy.
California High School Exit Examination Grade Ten Results by Student Group (School Year 2014-15)
Group
English-Language Arts Mathematics
Percent Not Proficient
Percent Proficient
Percent Advanced
Percent Not Proficient
Percent Proficient
Percent Advanced
All Students in the LEA 58 22 20 66 25 9
All Students at the School 80 11 9 79 21
Male 74 16 11 67 33
Female 84 8 8 88 12
Hispanic or Latino 74 13 13 77 23
Socioeconomically Disadvantaged 77 14 9 79 21 Note: Percentages are not calculated when the number of students tested is ten or less, either because the number of students in this category is too small for statistical accuracy or to protect student privacy.
California Physical Fitness Test Results (School Year 2014-15)
Grade Level
Percent of Students Meeting Fitness Standards
Four of Six Standards Five of Six Standards Six of Six Standards
---5--- 16.70 39.60 22.90
---7--- 28.20 14.10 22.40 Note: Percentages are not calculated when the number of students tested is ten or less, either because the number of students in this category is too small for statistical accuracy or to protect student privacy.

2014-15 School Accountability Report Card for The Guidance Charter School Page 13 of 16
C. Engagement
State Priority: Parental Involvement The SARC provides the following information relevant to the Parental Involvement State Priority (Priority 3): • Efforts the school district makes to seek parent input in making decisions for the school district and each schoolsite. Opportunities for Parental Involvement (Most Recent Year)
At the K-6 campus,parents are invited and encouraged to volunteer in the classroom and to help out in the office. We also invite and encourage them to chaperon our field trips and donate needed items for their child's class. We have parents involved in our PTAC who help out in many instances with all of our activities, field trips, fun Friday's, Fundraising, and special events. We have parents that help make calls for donations, and who bring in donations themselves. Our PTAC is very active and continuously recruits new parents. There are no fees for our parents to volunteer and participate in our PTAC. We have many differnt events and activities going on all year that we recruit and invite parents to help out with. Ms. Erica Devenport is the contact person at our school for the PTAC and activities. Ms. Davenport can be reached at 661-272-1701 or by email at [email protected]. At the 7-12 campus we have monthly PTAC meetings and we encourage our parents to visit and assist us with student activities. Parents who volunteer are often offered positions on our campus in various areas. Parents who want to volunteer should come to a PTAC meeting and get involved at the 7-12 campus.
State Priority: Pupil Engagement The SARC provides the following information relevant to the Pupil Engagement State Priority (Priority 5): • High school dropout rates; and • High school graduation rates. Dropout Rate and Graduation Rate (Four-Year Cohort Rate)
Indicator School District State
2011-12 2012-13 2013-14 2011-12 2012-13 2013-14 2011-12 2012-13 2013-14
Dropout Rate 0.00 40.00 13.10 11.40 11.50
Graduation Rate .00 60.00 78.87 80.44 80.95
Completion of High School Graduation Requirements (Graduating Class of 2014)
Group Graduating Class of 2014
School District State
All Students 50 26.2 84.6
Black or African American 27.38 76
American Indian or Alaska Native 18.18 78.07
Asian 92.62
Filipino 96.49
Hispanic or Latino 60 23.48 81.28
Native Hawaiian/Pacific Islander 83.58
White 36.49 89.93
Two or More Races 82.8
Socioeconomically Disadvantaged 27.17 61.28
English Learners 16.48 50.76
Students with Disabilities 40 24.63 81.36
Foster Youth -- -- --
2014-15 School Accountability Report Card for The Guidance Charter School Page 14 of 16
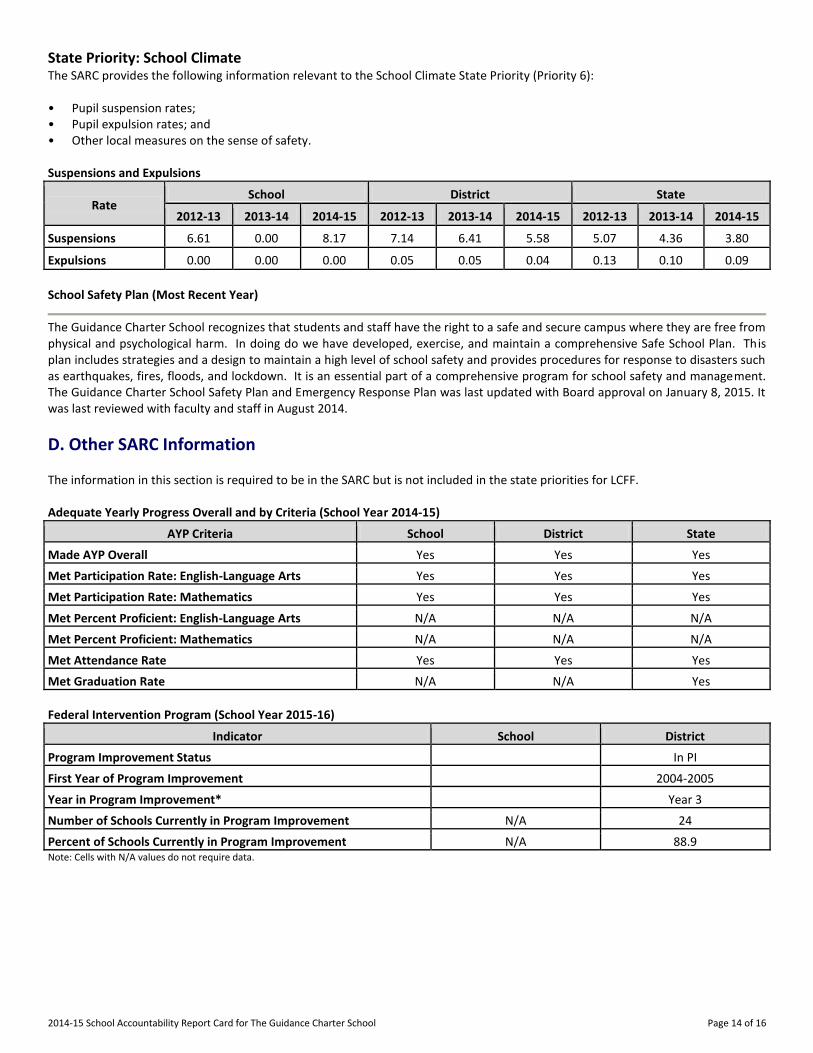
State Priority: School Climate The SARC provides the following information relevant to the School Climate State Priority (Priority 6): • Pupil suspension rates; • Pupil expulsion rates; and • Other local measures on the sense of safety. Suspensions and Expulsions
Rate School District State
2012-13 2013-14 2014-15 2012-13 2013-14 2014-15 2012-13 2013-14 2014-15
Suspensions------- 6.61 0.00 8.17 7.14 6.41 5.58 5.07 4.36 3.80
Expulsions------- 0.00 0.00 0.00 0.05 0.05 0.04 0.13 0.10 0.09
School Safety Plan (Most Recent Year)
The Guidance Charter School recognizes that students and staff have the right to a safe and secure campus where they are free from physical and psychological harm. In doing do we have developed, exercise, and maintain a comprehensive Safe School Plan. This plan includes strategies and a design to maintain a high level of school safety and provides procedures for response to disasters such as earthquakes, fires, floods, and lockdown. It is an essential part of a comprehensive program for school safety and management. The Guidance Charter School Safety Plan and Emergency Response Plan was last updated with Board approval on January 8, 2015. It was last reviewed with faculty and staff in August 2014.
D. Other SARC Information
The information in this section is required to be in the SARC but is not included in the state priorities for LCFF. Adequate Yearly Progress Overall and by Criteria (School Year 2014-15)
AYP Criteria School District State
Made AYP Overall Yes Yes Yes
Met Participation Rate: English-Language Arts Yes Yes Yes
Met Participation Rate: Mathematics Yes Yes Yes
Met Percent Proficient: English-Language Arts N/A N/A N/A
Met Percent Proficient: Mathematics N/A N/A N/A
Met Attendance Rate Yes Yes Yes
Met Graduation Rate N/A N/A Yes
Federal Intervention Program (School Year 2015-16)
Indicator School District
Program Improvement Status In PI
First Year of Program Improvement 2004-2005
Year in Program Improvement* Year 3
Number of Schools Currently in Program Improvement N/A 24
Percent of Schools Currently in Program Improvement N/A 88.9 Note: Cells with N/A values do not require data.

2014-15 School Accountability Report Card for The Guidance Charter School Page 15 of 16
Average Class Size and Class Size Distribution (Elementary)
Grade Level
2012-13 2013-14 2014-15
Avg. Class Size
Number of Classes Avg. Class Size
Number of Classes Avg. Class Size
Number of Classes
1-20 21-32 33+ 1-20 21-32 33+ 1-20 21-32 33+
K
19 2 18 2 18 2
1
17 2 18 2 17 1
2
19 2 19 2 19 2
3
21 1 1 21 1 1 23 2
4
23 2 24 2
5
25 1 22 1 1 43 1
6
24 1 19 1 23 2
Other
22 2 Note: Number of classes indicates how many classes fall into each size category (a range of total students per class).
Average Class Size and Class Size Distribution (Secondary)
Subject
2012-13 2013-14 2014-15
Avg. Class Size
Number of Classrooms Avg. Class Size
Number of Classrooms Avg. Class Size
Number of Classrooms
1-22 23-32 33+ 1-22 23-32 33+ 1-22 23-32 33+
English------- ----------
18 10 5
Mathematics ----------
28 2 1 1 14 6
Science------- ----------
23 3 1 18 9 5
Social Science ----------
6 4 18 12 2 Note: Number of classes indicates how many classrooms fall into each size category (a range of total students per classroom). At the secondary school level, this information is reported by subject area rather than grade level. Academic Counselors and Other Support Staff (School Year 2014-15)
Title Number of FTE
Assigned to School Average Number of Students per
Academic Counselor
Academic Counselor------- 1 725
Counselor (Social/Behavioral or Career Development) 0 N/A
Library Media Teacher (Librarian) 0 N/A
Library Media Services Staff (Paraprofessional) 0 N/A
Psychologist------- .5 N/A
Social Worker------- 0 N/A
Nurse------- .5 N/A
Speech/Language/Hearing Specialist .5 N/A
Resource Specialist------- 1 N/A
Other------- 2 N/A Note: Cells with N/A values do not require data. One Full Time Equivalent (FTE) equals one staff member working full time; one FTE could also represent two staff members who each work 50 percent of full time.
2014-15 School Accountability Report Card for The Guidance Charter School Page 16 of 16
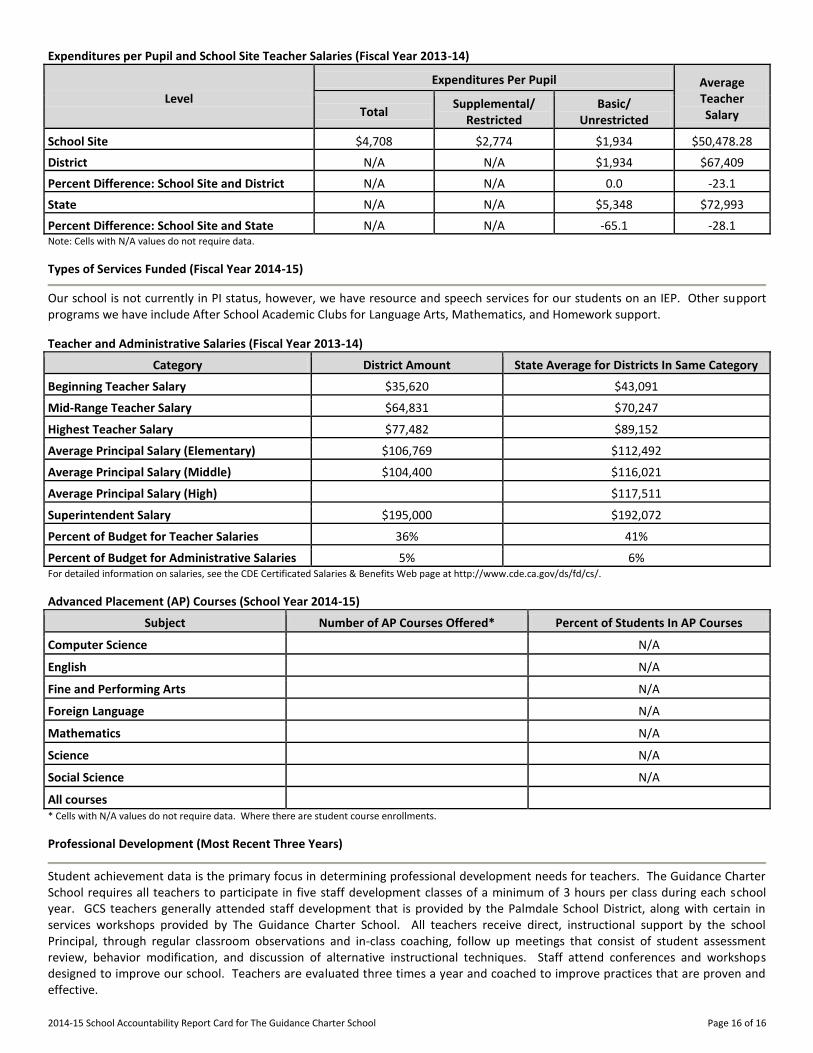
Expenditures per Pupil and School Site Teacher Salaries (Fiscal Year 2013-14)
Level
Expenditures Per Pupil Average Teacher Salary Total
Supplemental/ Restricted
Basic/ Unrestricted
School Site------- $4,708 $2,774 $1,934 $50,478.28
District------- N/A N/A $1,934 $67,409
Percent Difference: School Site and District N/A N/A 0.0 -23.1
State------- N/A N/A $5,348 $72,993
Percent Difference: School Site and State N/A N/A -65.1 -28.1 Note: Cells with N/A values do not require data.
Types of Services Funded (Fiscal Year 2014-15)
Our school is not currently in PI status, however, we have resource and speech services for our students on an IEP. Other support programs we have include After School Academic Clubs for Language Arts, Mathematics, and Homework support.
Teacher and Administrative Salaries (Fiscal Year 2013-14)
Category District Amount State Average for Districts In Same Category
Beginning Teacher Salary $35,620 $43,091
Mid-Range Teacher Salary $64,831 $70,247
Highest Teacher Salary $77,482 $89,152
Average Principal Salary (Elementary) $106,769 $112,492
Average Principal Salary (Middle) $104,400 $116,021
Average Principal Salary (High) $117,511
Superintendent Salary $195,000 $192,072
Percent of Budget for Teacher Salaries 36% 41%
Percent of Budget for Administrative Salaries 5% 6% For detailed information on salaries, see the CDE Certificated Salaries & Benefits Web page at http://www.cde.ca.gov/ds/fd/cs/.
Advanced Placement (AP) Courses (School Year 2014-15)
Subject Number of AP Courses Offered* Percent of Students In AP Courses
Computer Science N/A
English------- N/A
Fine and Performing Arts N/A
Foreign Language N/A
Mathematics N/A
Science------- N/A
Social Science N/A
All courses * Cells with N/A values do not require data. Where there are student course enrollments.
Professional Development (Most Recent Three Years)
Student achievement data is the primary focus in determining professional development needs for teachers. The Guidance Charter School requires all teachers to participate in five staff development classes of a minimum of 3 hours per class during each school year. GCS teachers generally attended staff development that is provided by the Palmdale School District, along with certain in services workshops provided by The Guidance Charter School. All teachers receive direct, instructional support by the school Principal, through regular classroom observations and in-class coaching, follow up meetings that consist of student assessment review, behavior modification, and discussion of alternative instructional techniques. Staff attend conferences and workshops designed to improve our school. Teachers are evaluated three times a year and coached to improve practices that are proven and effective.