Embed Size (px)
Citation preview

THE GROWING IMPORTANCE OF SOCIAL
SKILLS IN THE LABOR MARKET*
DAVID J. DEMING
May 24, 2017
Abstract
The labor market increasingly rewards social skills. Between 1980 and 2012, jobs re-
quiring high levels of social interaction grew by nearly 12 percentage points as a share
of the U.S. labor force. Math-intensive but less social jobs - including many STEM occu-
pations - shrank by 3.3 percentage points over the same period. Employment and wage
growth was particularly strong for jobs requiring high levels of both math skill and so-
cial skill. To understand these patterns, I develop a model of team production where
workers “trade tasks” to exploit their comparative advantage. In the model, social skills
reduce coordination costs, allowing workers to specialize and work together more effi-
ciently. The model generates predictions about sorting and the relative returns to skill
across occupations, which I investigate using data from the NLSY79 and the NLSY97.
Using a comparable set of skill measures and covariates across survey waves, I find that
the labor market return to social skills was much greater in the 2000s than in the mid
1980s and 1990s. JEL Codes: I20, I24, J01, J23, J24, J31
*[email protected]. Thanks to Pol Antras, David Autor, Avi Feller, Lawrence Katz, Sandy Jencks,Richard Murnane, and Lowell Taylor for reading early drafts of this paper and for providing insightful feed-back. Thanks to Felipe Barrera-Osorio, Amitabh Chandra, Asim Khwaja, Alan Manning, Guy Michaels, LukeMiratrix, Karthik Muralidharan, Devah Pager, Todd Rogers, Doug Staiger, Catherine Weinberger, Marty Westand seminar participants at PSE, LSE, CESifo, Yale, Columbia, Harvard, MIT, Michigan State, Northwest-ern, UBC, Simon Fraser, Cornell, University of Chicago and the NBER Education and Personnel meetings forhelpful comments. Special thanks to David Autor and Brendan Price for sharing their data and programs,and to Madeleine Gelblum for excellent research assistance throughout the writing of this paper. Olivia Chi,Lauren Reisig and Stephen Yen also provided superb research assistance. Extra special thanks to Lisa Kahnand Chris Walters for “trading tasks” with me. All errors are my own.
1

“We can never survey our own sentiments and motives, we can never form any judgmentconcerning them; unless we remove ourselves, as it were, from our own natural station, andendeavour to view them as at a certain distance from us. But we can do this in no other waythan by endeavouring to view them with the eyes of other people, or as other people are likelyto view them.” - Adam Smith, The Theory of Moral Sentiments (1759)
I. Introduction
A vast literature in economics explains increasing returns to skill as a product of the com-
plementarity between technology and high-skilled labor, or skill-biased technological change
(SBTC) (e.g. Katz & Murphy 1992; Bound & Johnson 1992; Juhn et al. 1993; Acemoglu &
Autor 2011). Beginning in the 1990s, the labor market “hollowed out” as computers sub-
stituted for labor in middle-skill routine tasks and complemented high-skilled labor, a phe-
nomenon referred to as job polarization (Autor et al. 2003, 2006; Michaels et al. 2014; Goos
et al. 2014).
However, while job polarization implies rising demand for skilled labor, there has been
little or no employment growth in high-paying jobs since 2000, and this slow growth pre-
dates the Great Recession (Acemoglu & Autor 2011; Beaudry et al. 2014, 2016). Beaudry
et al. (2016) show evidence of slow growth in cognitive skill-intensive occupations in the U.S.
labor market during the 2000s, and Castex & Dechter (2014) find smaller returns to cogni-
tive test scores in the 2000s compared to the 1980s. These findings are especially puzzling
in light of the rising heterogeneity in worker-specific pay premiums found in studies that
use matched employer-employee data (Card et al. 2013, 2016). If technological change is
skill-biased, why have the returns to cognitive skill not increased over the last decade?
One possible explanation is that weak growth in high-skilled jobs is caused by a slow-
down in technological progress. Beaudry et al. (2016) argue that the slowdown in demand for
cognitive skill can be explained as a boom-and-bust cycle caused by the progress of informa-
tion technology (IT) from adoption to maturation, and Gordon (2012) shows that innovation
and U.S. productivity growth slowed down markedly in the early 2000s.
On the other hand, Brynjolfsson & McAfee (2014) discuss advances in computing power
that are rapidly expanding the set of tasks that machines can perform. Many of the tasks
that they and others highlight - from automated financial management and tax preparation
to legal e-discovery to cancer diagnosis and treatment - are performed by highly skilled
workers (Levy & Murnane 2012; Brynjolfsson & McAfee 2014; Remus & Levy 2015). Thus
another possibility is that computer capital is substituting for labor higher up in the skill
distribution, redefining what it means for work to be “routine” (Autor 2014; Lu 2015).
2

Figure 1 investigates this possibility by showing relative employment growth between
2000 and 2012 for the set of high-skilled, “cognitive” occupations that are the focus of
Beaudry et al. (2016).1 The upper panel of Figure 1 focuses on science, technology, en-
gineering and mathematics (STEM) jobs, while the lower panel shows all other cognitive
occupations.
Figure 1 shows clearly that the relative decline in high-skilled employment over the last
decade is driven by STEM jobs. STEM jobs shrank by a total of 0.12 percentage points
as a share of the U.S. labor force between 2000 and 2012, after growing by 1.33 percent-
age points over the previous two decades. By comparison, all other cognitive occupations
grew by 2.87 percentage points between 2000 and 2012, which surpasses the growth rate of
1.99 percentage points in the previous decade. Most importantly, the fastest growing cog-
nitive occupations - managers, teachers, nurses and therapists, physicians, lawyers, even
economists - all require significant interpersonal interaction.
In this paper, I show that high-paying jobs increasingly require social skills. Technolog-
ical change provides one possible explanation. The skills and tasks that cannot be substi-
tuted away by automation are generally complemented by it, and social interaction has -
at least so far - proven difficult to automate (Autor 2015). Our ability to read and react to
others is based on tacit knowledge, and computers are still very poor substitutes for tasks
where programmers don’t know “the rules” (Autor 2015). Human interaction requires a ca-
pacity that psychologists call theory of mind - the ability to attribute mental states to others
based on their behavior, or more colloquially to “put oneself into another’s shoes” (Premack
& Woodruff 1978; Baron-Cohen 2000; Camerer et al. 2005).
I begin by presenting a simple model of team production between workers. Workers
perform a variety of tasks on the job, and variation in productivity generates comparative
advantage that can be exploited through specialization and “task trade”. I model cognitive
skills as the mean of a worker’s productivity distribution and social skills as a reduction
in trading costs. Workers with higher social skills can specialize and “trade tasks” with
other workers more efficiently. This takes on the structure of a Ricardian trade model, with
workers as countries and social skills as inverse “iceberg” trade costs as in Dornbusch et al.(1977) and Eaton & Kortum (2002).2
1Following Beaudry et al. (2016), Figure 1 displays employment growth for what the U.S. Census refers toas managerial, professional and technical occupation categories. Autor & Dorn (2013) create a consistent setof occupation codes for the 1980-2000 Censuses and the 2005-2008 ACS - I follow their scheme and update itthrough the 2010 Census and the 2011-2013 ACS - see the Data Appendix for details. Following Beaudry et al.(2016), “cognitive” occupations include all occupation codes in the Data Appendix between 1 and 235. I groupoccupation codes into larger categories in some cases for ease of presentation (e.g. engineers, managers).
2Acemoglu & Autor (2011) develop a Ricardian model of the labor market with three skill groups, a singleskill index, and comparative advantage for higher-skilled workers in relatively more complex tasks. I follow
3

The model generates several predictions, which I investigate using data from the Na-
tional Longitudinal Survey of Youth 1979 (NLSY79). I first demonstrate that there is a
positive return to social skills in the labor market and that cognitive skill and social skill
are complements in a Mincerian wage equation. This follows recent evidence from Wein-
berger (2014), who finds growing complementarity over time between cognitive skills and
social skills using different data sources. Complementarity emerges naturally in the model,
because the value of lower trade costs increases in aworker’s average productivity (i.e. cog-
nitive skill).3 Importantly, I do not find complementarity between cognitive skill and widely-
used measures of “non-cognitive” skills (e.g. Heckman et al. 2006).
The model provides a key link between social skills and routineness through the variance
of productivity over workplace tasks. Some high-skilled occupations (such as a computer
programmer, or engineer) require the repeated execution of explicit rules, while others are
less structured and require a diverse range of tasks (such as manager, or consultant). I
model this as an increase in the variance of productivity over the tasks that workers perform
on the job. Higher variance in productivity broadens the scope for gains from “task trade”
and thus increases the return to social skills.
While I cannot directly measure the variance of workplace tasks, I use two empirical
analogs. First, I compare the returns to social skills across occupations that vary in their
routineness, as measured by data from the Occupational Information Network (O*NET).
I find that workers with higher social skills self-select into nonroutine occupations, and
that this sorting leads to within-worker wage gains that are increasing in social skills.4
These empirical patterns are consistent with the predictions of the model. Notably, I find no
evidence of greater returns to social skills in math-intensive occupations.
Next, I draw on a large literature in organizational economics which shows that all oc-
cupations are becoming less routine over time. Information and communication technology
(ICT) has shifted job design away from rigid categorization and toward increased job ro-
tation and worker “multi-tasking” (Bresnahan 1999; Lindbeck & Snower 2000; Caroli &
Van Reenen 2001; Bloom & Van Reenen 2011). Case studies of ICT implementation show
a long literature that treats teamwork as a tradeoff between the benefits of increased productivity throughspecialization and the costs of coordination (Becker & Murphy 1992; Bolton & Dewatripont 1994; Lazear1999; Garicano 2000; Garicano & Rossi-Hansberg 2006)
3A related literature studies job assignment when workers have multiple skills (Heckman & Scheinkman1987; Yamaguchi 2012; Lindenlaub 2014; Lise & Postel-Vinay 2014). Models of this type would treat socialskill as another addition to the skill vector, with Roy-type selection and linear (or log-linear) wage returnsrather than the specific pattern of complementarity between cognitive skill and social skill.
4Krueger & Schkade (2008) show that gregarious workers sort into jobs that involve more social interaction.They interpret this as a compensating differential, suggesting that workers have preferences for interactivework. However, if skill in social interaction had no value in the labor market but interactive jobs were preferredby workers, compensating differentials imply that interactive jobs should pay less all else equal.
4

that computerization leads to the reallocation of skilled workers into flexible, team-based
settings that facilitate adaptive responses and group problem-solving (e.g. Autor et al. 2002;
Bresnahan et al. 2002; Bartel et al. 2007). This literature shows a clear link between the
computerization of the labor market and the decline of routine work. Yet the link between
the increased variability of workplace tasks, team production and social skills has not pre-
viously been explored.
I investigate the growing importance of social skills in two ways. First, I present evidence
of increasing relative demand for social skills in the U.S. labor market. Between 1980 and
2012, social skill-intensive occupations grew by 11.8 percentage points as a share of all jobs
in the U.S. economy. Wages also grew more rapidly for social skill-intensive occupations
over this period. I find that employment and wage growth has been particularly strong in
occupations with high math and social skill requirements. In contrast, employment has
declined in occupations with high math but low social skill requirements, including many of
the STEM jobs shown in Figure 1. Contemporaneous trends in the labor market over this
period such as offshoring, trade and shifts toward the service sector can partially - but not
completely - explain these patterns.5
Second, I test directly for the growing importance of social skills by comparing the re-
turns to skills in the NLSY79 and the National Longitudinal Survey of Youth 1997 (NLSY97)
surveys. Comparing cohorts between the ages of 25 and 33 who entered the labor market
in the mid 1980s versus the mid 2000s, I find that social skills are a significantly more
important predictor of full-time employment and wages in the NLSY97 cohort. Cognitive
skills, social skills and other covariates are similarly defined across survey waves, and the
results are robust to accounting for other contemporaneous trends such as increasing edu-
cational attainment and female labor force participation. Finally, I show that the within-
worker wage gain from sorting into a social skill-intensive occupation is much greater in the
NLSY97 cohort.
I am aware of few other papers that study social skills. In Borghans et al. (2014), there
are “people” jobs and “non-people” jobs and the same for skills, with workers sorting into jobs
based on skills and relative wages. Kambourov et al. (2013) develop a model where high lev-
5Autor & Dorn (2013) explain the rise of low-wage service occupations as computers replacin routine pro-duction tasks rather than service tasks (which are more difficult to automate). However, this does not explaingrowth of social skill-intensive jobs at the top of the wage distribution. Autor et al. (2015) compare the impactof import competition from China to technological change and find that the impact of trade is concentrated inmanufacturing and larger among less-skilled workers. Oldenski (2012) shows that production requiring com-plex within-firm communication is more likely to occur in a multinational’s home country. Karabarbounis &Neiman (2014) show that the share of corporate value-added paid to labor has declined, even in labor-intensivecountries such as China and India, suggesting that offshoring alone is unlikely to explain the decline of routineemployment and the growth in social skill-intensive jobs.
5

els of “relationship skill” (as measured by a worker’s occupation) are associated with stable
marriage and employment outcomes. McCann et al. (2014) develop a multi-sector matching
model with teams of workers who specialize in production tasks and a manager who spe-
cializes completely in communication tasks. In contrast, there are no communication tasks
in my model, nor are there formal teams.6 This is consistent with case studies of modern
teamwork, where workers are organized into temporary, fluid and self-managed groups to
perform customized sets of tasks (e.g. Lindbeck & Snower 2000; Hackman 2002; Bartel et al.2007; Edmondson 2012).
While the model considers teamwork in production, one can view many customer-oriented
occupations - consulting, health care, teaching, legal services - as requiring joint production
between worker and customer. Katz (2014) discusses growing demand for artisanal workers
who can provide a creative, personal touch and customize production to the needs of clients.
Social skills in production will be important for customer service occupations to the extent
that the final product is uncertain and crafted specifically for the needs of the client.
Are social skills distinct from cognitive skills, or are they simply another measure of
the same underlying ability? When surveyed, employers routinely list teamwork, collabora-
tion and oral communication skills as among the most valuable yet hard-to-find qualities of
workers (e.g. Casner-Lotto & Barrington 2006; Jerald 2009). In 2015, employers surveyed
by the National Association of Colleges and Employers (NACE) listed “ability to work in a
team” as the most desirable attribute of new college graduates, ahead of problem-solving
and analytical/quantitative skills (NACE 2015). Tests of emotional and social intelligence
have beendeveloped and validated by psychologists (Salovey & Mayer 1990; Mayer et al.1999; Baron-Cohen et al. 2001; Goleman 2006). Woolley et al. (2010) show that a test de-
signed to measure social intelligence predicts team productivity even after controlling for
the average intelligence of team members.7
A growing body of work in economics documents the labor market return to “noncogni-
tive” skills, including social skills and leadership skills (Kuhn & Weinberger 2005; Heckman
et al. 2006; Lindqvist & Vestman 2011; Borghans et al. 2014). This paper builds on the sem-
inal observation of Heckman (1995) that since measured cognitive ability (i.e. g) explains
6In McCann et al. (2014), workers who specialize in communication become managers of a team, and thecommunication skills of the other workers on the team are irrelevant. Models with communication or “people”tasks face the challenge of specifying exactly what is being produced. Are workers who spend an entire day inmeetings communication task specialists? The model here treats communication as a friction. Workers whospend more time in meetings - conditional on total output - have lower social skill.
7Woolley et al. (2010) randomly assign individuals to groups and then ask the groups to perform a varietyof tasks. Group performance is positively correlated with the “average social sensitivity” of group members asmeasured by a test called “Reading the Mind in the Eyes”. This test was originally developed to assist in thediagnosis of Autism and Asperger Syndrome, but has since been demonstrated as psychometrically valid andable to detect subtle differences in individual social sensitivity (e.g. Baron-Cohen et al. 2001).
6

only a small fraction of the variation in earnings, productivity is likely influenced by multi-
ple dimensions of skill. Subsequent work, summarized in Heckman & Kautz (2012), finds
that “noncognitive” or “soft” skills explain important variation in adult outcomes. This pa-
per should be viewed as an attempt to extend and formalize the definition of one particular
dimension of “soft” skills - the ability to work with others.
The remainder of the paper proceeds as follows. Section 2 presents the model and de-
velops specific empirical predictions. Section 3 describes the data. Section 4 explores the
predictions concerning the returns to social skill across occupations using the NLSY79. Sec-
tion 5 studies the growing importance of social skills over time, using both Census/ACS data
and a comparison of the returns to skills in the NLSY79 and NLSY97. Section 6 concludes.
All appendix material - including supplementary tables and figures, a more detailed data
description, and proofs for the model - can be found in the online appendix to the paper.
II. Model
In a standard human capital model, worker skill takes a simple factor-augmenting form,
where the output of worker j is increasing in some measure of skill (such as cognitive ability
or education) A j times L j, the quantity of labor supplied:
yj = A jL j(1)
Recent work has enriched the standard model by drawing a distinction between skills
and job tasks (e.g. Autor et al. 2003; Acemoglu & Autor 2011; Autor & Handel 2013). In
the spirit of this “task framework”, consider the following modification of the human capital
model:
yj (i)= A jα j (i) l j (i)(2)
where yj (i) specifies the production function for task i as worker j’s cognitive skill A j (still
taking the factor-augmenting form) times a task-specific productivity parameter α j (i) times
labor supplied to task i.Any job can be separated into an infinite number of discrete tasks that must be per-
formed jointly to produce some final good Y . Following Acemoglu & Autor (2011), I assume
that workers perform a continuum of tasks indexed over the unit interval according to a
Cobb-Douglas technology:
Y j = exp[ˆ 1
0lnyj(i)di].(3)
7

For simplicity, I assume that each worker supplies one unit of labor inelastically:
ˆ 1
0l j(i)di = L j = 1.(4)
Equation (2) allows two workers with the same cognitive skill level A j to vary in their
productivity over individual tasks. This suggests that workers can specialize in the produc-
tion of tasks in which they have a comparative advantage.
To think about how the productivity gains from specialization can be realized, I develop
a model in the spirit of Ricardo (1891). In Ricardo (1891), countries specialize in the pro-
duction of goods and trade with each other for mutual benefit. In this model, workers can
increase their total output Y j by producing tasks in which they have comparative advan-
tage and then trading for mutual benefit, just as countries trade goods in Ricardo’s classic
formulation. Thus I conceive of teamwork as “trading tasks”.
Applying the Ricardian framework to task trade between workers yields two important
benefits. First, it provides an explanation for why social skills matter that is grounded
in economic theory. I argue that social skills are valuable because they reduce the cost of
“trading tasks” with other workers.
Specifically, let Si,n ∈ (0,1) be a depreciation factor that is applied proportionately to
any trade in tasks between workers - Si,n = Si ∗Sn for i 6= n. Moreover let Si,i = 1, ∀i so
workers can trade costlessly with themselves. Workers with higher social skill pay a lower
coordination cost to trade with other workers. This allows them to earn higher wages by
specializing in their most productive tasks and trading their output with others.8 Workers
with high cognitive skill A j but low social skill S j have high average productivity, but will
perform “too many” tasks themselves rather than working in a team.
The second important feature of the model is that it generates intuitive predictions about
when social skills will matter. The return to social skills and the benefits of task trade will be
increasing in the variance of productivity over tasks (the α j ’s), because higher productivity
dispersion increases the scope for gains from trade. To see this, consider the limiting case
where α j (i) takes the same value for all tasks i. In this case, equation (2) collapses to (1)
8In Becker & Murphy (1992), the benefits of specialization are balanced against the costs of coordinatingincreasingly specialized workers. In their analysis, coordination costs are features of the economy or of partic-ular sectors. Here I treat coordination costs as attributes of individual workers. The definition of social skillsin this paper is closely related to the formulation of “iceberg” trade costs between countries as in Dornbuschet al. (1977) and Eaton & Kortum (2002). The main difference is that iceberg trade costs are defined at thecountry-pair level (i.e. Sni) and do not necessarily have a common worker (country) component. This is a par-ticular definition of social skill, and it does not rule out other ways that sociability might affect productivityand wages (i.e. taste discrimination by firms, differential rates of on-the-job learning or information acqui-sition). One convenient interpretation of S is that it represents the probability that a worker will correctlycommunicate her productivity schedule to another worker.
8

and becomes the standard human capital model. With zero variance in productivity over
tasks, cognitive skill A j is the sole determinant of relative productivity and there are no
gains from trade.
If a worker has very low social skills, she will produce the same combination of tasks
regardless of her comparative advantage relative to others. On the other hand, the task mix
of a worker with high social skills will be quite sensitive to changes in the relative produc-
tivities of her co-workers. Thus another sensible interpretation of S j is that it represents
flexibility.
Here I develop the case with bilateral task trade between two workers. This two-worker
model is isomorphic to the two-country Ricardian trade model of Dornbusch et al. (1977).
Thus I keep the presentation brief and refer the reader to the Appendix for proofs and more
detailed exposition.9 With only two workers, two dimensions of skill and one final good, the
model developed below is highly stylized. However, it yields a set of intuitive predictions
that help guide the empirical work below.
II..A Setup
Consider a competitive market where Y is the unique final good - produced according to
(3) - and labor is the only factor of production. Identical firms hire pairs of workers and
pay market wages that are equal to output Y j times an exogenous output price P∗. Thus
workers maximize output Y j, subject to the labor supply constraint in (4). Firms maximize
profits, defined as total revenue [P∗ (Y1 +Y2)] minus the wages paid to workers (w1 +w2).
Since the order of tasks over the unit interval is arbitary, it is convenient to index tasks
in order of decreasing comparative advantage for worker 1 (i.e. α1(0)α2(0) > ·· · > α1(i)
α2(i) > ·· · > α1(1)α2(1) ).
Define the comparative advantage schedule over tasks as:
γ(i)≡ A1α1(i)A2α2(i)
,(5)
with γ′(i)< 0 by assumption.
For concreteness, I assume that the comparative advantage schedule takes the form:
γ(i)= Aexp(θ(1−2i)),(6)
with A = A1/A2. This functional form for γ(i) can be derived from an underlying process
where worker productivity in task i is drawn from a log-normal distribution with a mean
9An earlier draft of this paper developed a Ricardian model with multiple workers which closely followedEaton & Kortum (2002). Adding multiple workers yields identical predictions and has a very similar structure,but requires a strong distributional assumption and comes with much added complexity.
9
that is increasing in cognitive skill A j, and a variance that is increasing in θ.10
A j indexes worker j’s mean productivity across tasks, while θ indexes the variance of
task productivities and the steepness of the comparative advantage schedule. When θ = 0,
workers with higher cognitive skill are more productive in all tasks by the same ratio A. In
that case, there is no comparative advantage and thus no possibility for gains from trade.
Thus this model nests the standard human capital model as a special case when θ = 0. As θ
increases, productivity over individual tasks is more dispersed.
II..B Equilibrium with Costless Trade
Each worker maximizes output by obtaining tasks from the lowest-cost producer, including
herself. Workers trade tasks with each other at “prices” defined by efficiency units of labor,
with a budget equal to each worker’s labor supply constraint in (4). The worker-specific price
of task i as:
p j(i)=w j
A jα j(i),(7)
where w j is the endogenously determined wage paid to worker j for a unit of labor. The equi-
librium price for each task is the lower of the two offered prices: p (i∗)=min {[p1 (i) , p2 (i)]}.Since γ′(i)< 0 and there is a continuum of tasks, it is clear that in equilibrium there will be
a marginal task i∗ such that
ω= γ(i∗)(8)
where ω = w1/w2. Worker 1 will perform all tasks in the interval [0, i∗] and worker 2 will
perform all tasks in the interval [i∗,1].
The equilibrium wage w j is also determined by the demand for tasks, which comes out
of the production function for the final good Y in equation (3). In equilibrium, the price-
adjusted quantity of output for the marginal task i∗ must be the same for both workers.
This, combined with the fact that the Cobb-Douglas production function implies that the
same share of output is paid to each task, yields the following equilibrium condition for the
demand for tasks:
ω= i∗
1− i∗(9)
10Specifically, imagine that worker j’s productivity is task t is a random variable with a log-normal distribu-tion: a j(t)∼ lnN (µ j,σ2). Then the ratio of worker 1 to worker 2’s productivity in task t, G(t)≡ a1(t)/a2(t), alsotakes on a log-normal distribution: G(t) ∼ lnN (µG ,σ2
G), with µG = µ1 −µ2 and σ2G = 2σ2. It can be shown that
the quantile function for G(t) evaluated at (1− i) corresponds closely to the chosen functional form for γ(i),with A ≈ exp(µ1 −µ2) and θ ≈ 2σ. See Section 1.3 of the Model Appendix for details.
10

Equilibrium is found by setting the downward-sloping comparative advantage condition
in equation (8) equal to the upward-sloping labor demand condition in equation (9), which
yields a unique marginal task as a function of worker skills and the variance of productivity
θ.11
The relative wage ω is clearly increasing in the task threshold - for example, if A1 = A2,
then i∗ = 12 and ω= 1. Equilibrium wages for worker 1 are given by:
w1 = P∗A i∗1 (A2ω)1−i∗exp[
ˆ i∗
0lnα1(i)di+
ˆ 1
i∗lnα2(i)di](10)
The expression for worker 2 is very similar. Thus wages are increasing in a worker’s own
skill A j as well as the skill of her co-worker. Moreover, the gains from trade are also priced
into absolute wages and are increasing in θ.12
II..C Equilibrium with Social Skills
With only two workers, we can define S∗ = S1 ∗S2 as the (symmetric) cost of trading tasks
between the two workers, with self-trade normalized to one as above. Thus worker 1 will
produce her own tasks rather than trading if:
p1(i) < pS2 (i)
w1
A1α1(i)< w2
S∗A2α2(i)
ω < γ(i)S∗ .(11)
Likewise, worker 2 will produce her own tasks if ω > S∗γ(i). Thus in equilibrium there
will be two task thresholds, defined by:
γ(iH) = S∗ω(12)
γ(iL) = ω
S∗ .(13)
Since γ′(i)< 0, it is clear that iH > i∗ > iL when S∗ < 1.
Tasks in the interval [0, iL] will be produced exclusively by worker 1, tasks in the interval
11The marginal task is equal to i∗ = A1A1+A2exp(θ(2i∗−1))
12The gains from trade can be expressed as∆Y = Y T
Y A , the ratio of worker output under trade to worker output
under autarky. This is equal to exp(´ 1
i∗ ln[γ(i∗)γ(i)
]di
)= exp(θ[i∗−1]2) for worker 1 and exp
(´ i∗0 ln
[γ(i)γ(i∗)
]di
)=
exp(θi∗2) for worker 2.
11

[iH ,1] will be produced exclusively by worker 2, and tasks in the interval [iL, iH] will be non-
traded (produced by both workers for their own use).
As S∗ → 1, iL and iH converge to a single value i∗. For any values iL ≤ 0 and iH ≥ 1,
workers will maximize output by producing all tasks themselves (i.e. autarky).
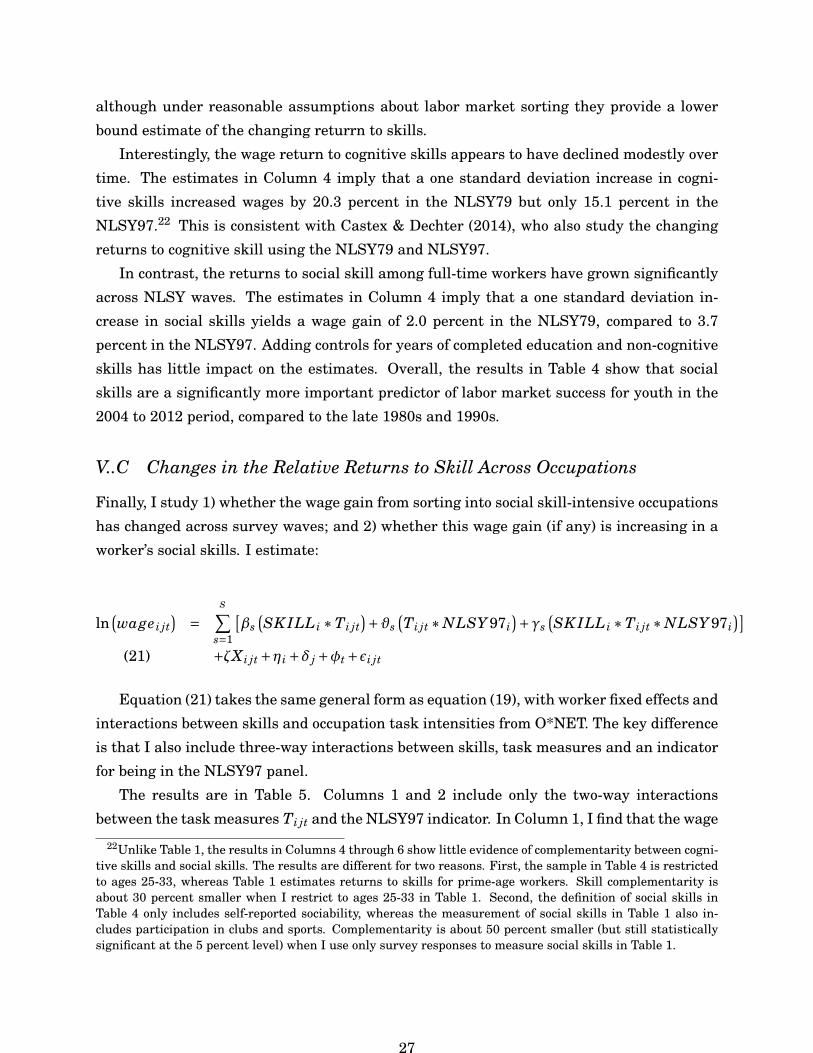
Figures 2A and 2B provides a visual illustration of the equilibrium task thresholds under
two different values of θ. Figure 2A shows the case where θ is lower and the comparative
advantage schedule is flatter, while Figure 2B shows the impact of increasing θ and making
the comparative advantage schedule steeper.
Figures 2A and 2B show that - all else equal - the size of the nontraded zone [iL, iH] is
decreasing in θ. This can also be demonstrated by solving equations (12) and (13) for ω,
which yields:
iH − iL =− lnS∗
θ(14)
Equation (14) shows that the size of the range of nontraded tasks (inversely) scales the
gains from trade. When trade is costless (i.e. S∗ = 1), iL = iH . On the other hand, equation
(14) also shows that there are many values of S∗ and θ for which autarky is preferable (i.e.
whenever iH − iL > 1).
As in the case of costless trade, equilibrium can be obtained by solving for the intersec-
tion between the two comparative advantage schedules in (12) and (13) and the demand for
tasks, which is given simply by:
ω= iL
1− iH .(15)
Combining (12), (13) and (15) gives two functions with two unknowns (iH and iL) and
three parameters (A, S∗ and θ). Plotting these two implicit functions in the (iL, iH) space
shows that their intersection defines the unique equilibrium values of iH and iL.
Finally, equilibrium wages for workers 1 and 2 are given by:
w1 = P∗A iH
1 (S∗A2ω)1−iHexp[ˆ iH
0lnα1(i)di+
ˆ 1
iHlnα2(i)di](16)
w2 = P∗A1−iL
2 (S∗A1ω−1)iL
exp[ˆ iL
0lnα1(i)di+
ˆ 1
iLlnα2(i)di](17)
12
II..D Interpreting θ
The variance parameter θ admits at least two interpretations. The first concerns the task
content of occupations. What kinds of jobs are characterized by greater productivity dis-
persion over tasks? One can interpret θ as a measure of predictability. Some jobs require
workers to perform the same set of tasks repeatedly, while others are unpredictable or re-
quire a wide range of tasks depending on the situation.
While existing data do not allow me to directly measure the variance of tasks for a par-
ticular occupation, the closest analog is routineness. Autor et al. (2003) define a task as
“routine” if it can be accomplished by following explicit programmed rules. Relatedly, Bres-
nahan (1999) argues that computers change the workplace by “organizing, routinizing and
regularizing tasks that people- and paper-based systems did more intuitively but more hap-
hazardly”. The idea behind both of these statements is that there is a well-established,
correct way to perform some tasks. For example, tasks such as complex mathematical calcu-
lations require high levels of cognitive skill but are also routine according to this definition.
Thus one interpretation of θ is that it indexes the share of tasks for which there is no
single best approach. As θ increases, a lower share of tasks are routine. Thus the return to
social skills should be decreasing in the routineness of an occupation. I examine this predic-
tion in Section 4 by estimating variation in the returns to social skill across occupations at
a particular point in time.
A second interpretation is that θ is a general production technology parameter that ap-
plies to all occupations, but is changing over time. Autor et al. (2003) show that the U.S. has
experienced relative employment declines in routine-intensive occupations since the 1970s,
and Goos et al. (2014) document this same pattern over a number of Western European
countries.
One empirical limitation of this line of work is that it only measures shifts in the distri-
bution of employment across occupations, not within them. Yet it is likely that all occupa-
tions are becoming less routine. Indeed the driving causal force in Autor et al. (2003) is an
exogenous decline in the price of computer capital, a phenomenon that presumably affects
all occupations to some degree. Case studies that accompany quantitative work on SBTC
focus on how occupations such as bank tellers and machinists have changed in response to
computerization (Autor et al. 2002; Bresnahan et al. 2002; Bartel et al. 2007).
In the model, any general increase in the variance of job tasks θ will lead to an increase
in the return to social skills. Thus increases in the variability of workplace tasks should
accompany increases in team production. The organizational economics literature strongly
supports this conclusion. Studies of the impact of information and communication technol-
13
ogy (ICT) suggest that job design has shifted away from unbundling of discrete tasks and
toward increased job rotation and worker “multi-tasking” (e.g. Bresnahan 1999; Lindbeck
& Snower 2000; Bloom & Van Reenen 2011).
A key theme in studies of ICT and organizational change is the reallocation of skilled
workers into flexible, team-based settings that facilitate group problem-solving (e.g. Caroli
& Van Reenen 2001; Autor et al. 2002; Bresnahan et al. 2002; Bartel et al. 2007). Dessein
& Santos (2006) develop a model where organizations optimally choose the extent to which
employees are allowed to use discretion in response to local information - whether to follow
a rigid script or to be “adaptive”. They show that when the business environment is more
uncertain - which could be interpreted as a measure of θ - organizations endogenously allow
for more ex post coordination among employees.
This literature suggests that the variance of job tasks has increased greatly over time,
even within occupations. Thus if we interpret θ as a measure of nonroutineness, the return
to social skills should have grown over time for workers in all occupations. Additionally, we
should be able to observe increases over time in the importance of jobs that require social
interaction.
II..E Empirical Predictions
The model generates severable predictions, which I summarize here. The first four predic-
tions concern variation in the returns to social skill across workers and occupations at a
particular point in time:
1. There is a positive labor market return to both cognitive skill and social skill. This is
evident from the expressions for equilibrium wages in (16) and (17). I examine this
prediction using data from the National Longitudinal Survey of Youth 1979 (NLSY79),
which contains direct measures of worker skills.
2. Cognitive skill and social skill are complements. This is true because the second
derivatives of w1 and w2 with respect to A and S∗ are positive.13 Intuitively, so-
cial skills are relatively more valuable when a worker is more productive overall, be-
cause she has more of value to “trade” with her fellow worker. I examine this predic-
tion by interacting measures of cognitive skill and social skill from the NLSY79 in a
13For simplicity, assume workers have equal cognitive skill, i.e. A1 = A2 = A and thus A = ω = 1. Thenworker 1’s production is Y S
1 = A(S∗)1−iHexp(´ iH
0 ln[α1(i)]di+´ 1iH ln[α2(i)]di). The second derivative with re-
spect to A and S∗ isd2Y S
1dAdS∗ = (1− iH)(S∗)−iH
exp(´ iH
0 ln[α1(i)]di + ´ 1iH ln[α2(i)]di) , which is always positive.
Note that the special case of equal ability matches the empirical work in section 4, which explicitly conditionson cognitive skill. See Section 3.5 of the Model Appendix for a proof.
14

Mincerian earnings regression, with a positive interaction indicating complementar-
ity. Weinberger (2014) finds evidence for growing complementarity between cognitive
skills and social skills across two cohorts of young men. The model provides a theoret-
ical foundation for those results. This prediction contrasts with existing models of job
assignment where workers have multiple skills. Such models typically feature match-
ing of workers to firms according to Roy-type selection, and skills are assumed to be
additively separable for tractability (e.g. Heckman & Scheinkman 1987; Lindenlaub
2014; Lise & Postel-Vinay 2014). While one could certainly write down a model which
simply asserts that cognitive skill and social skill are complements, the model above
develops complementarity from first principles.
3. Workers with higher social skill sort into non-routine occupations. This follows because
S∗ and θ are complements - i.e. the second derivative of wages with respect to S∗ and
θ is positive.14 Thus an increase in θ will yield a relatively greater gain for work-
ers with higher social skills, leading to a greater incentive (among both workers and
firms) for high S workers to sort into non-routine occupations. To see this, consider
a simple extension of the model where there are two occupations (1 and 2) that differ
in the variance of productivity, θ1 > θ2. All workers earn higher wages in higher θ oc-
cupations, and thus in the absence of labor market frictions all workers will sort into
occupation 1.15 However, if jobs in 1 are limited, workers with higher social skills will
obtain them first because they earn relatively higher wages in occupation 1 due to com-
plementarity between S∗ and θ.16 The NLSY79 includes multiple observations of the
same worker, which allows me to estimate changes in the returns to skill when work-
ers switch occupations. I estimate models with worker fixed effects and interactions
between skills and the task content of occupations.
4. Workers earn more when they switch into non-routine occupations, and their relativewage gain is increasing in social skill. This follows from the logic of prediction 3
14The second derivative of wages with respect to θ and S∗ is positive because S∗ and θ are complementsin the gains from trade. See Section 3.6 of the Model Appendix for a formal proof of this proposition. Sinceproduction under task trade is equal to production under autarky times the gains from trade, and since wagesare equal to output times the exogenous output price P∗, S∗ and θ are complements in output (and thus inwages) when S∗ and θ are complements in the gains from trade.
15Section 3.7 of the Model Appendix (equations (78) and (84)) shows that dYdθ > 0 for all workers when A = 1.
16Section 3.7 of the Model Appendix provides a formal proof of this proposition by assuming that there aretwo occupations characterized by different values of θ (θ1 > θ2). The setup of the model is the same as above,except that each firm hires two workers into a single occupation - i.e. firms are either type 1 or type 2. Workersmaximize wages and can switch occupations. I show that in the simplified case where all workers have equalcognitive ability, the set of two workers with the highest combined S∗ will always sort into θ1. Since wages areincreasing in S∗ and increasing in θ, and since S∗ and θ are complements, workers with higher social skillswill earn relatively higher wages in high θ occupations.
15

above. While the prediction for occupational sorting on social skills is clear, the im-
pact of sorting on wages is less clear, for two reasons. First, in the absence of frictions,
occupational sorting implies that wages will adjust until the marginal worker is in-
different between occupations. Second, the wage equations in (16) and (17) show a
clear spillover of one worker’s skill to the other worker’s wages. Thus wage returns
cannot be identified without information about labor market frictions and about the
skills of the other workers. My solution is to study whether within-worker sorting
into non-routine occupations increases wages. While the magnitude of the coefficient
will not have an economic interpretation because of the issues raised above, a positive
sign is consistent with the predictions of the model.17 Moreover, because S and θ are
complements, any wage gain from switching into a less routine occupation should be
increasing in the worker’s social skills.
In addition, the model yields two predictions about changes in the return to social skills over
time:
1. Growth in the relative importance of jobs requiring social skills. The decline of rou-
tine employment is widely known (e.g. Autor et al. 2003). However, I show that jobs
requiring social skills have also experienced relative employment and wage growth in
the U.S. over the last several decades. Indeed, these are largely the same types of jobs.
I show that there is a strong negative correlation between measures of an occupation’s
routineness and its social skill intensity. Thus the decline of routine employment can
also be understood as growth in social-skill intensive employment. Importantly, this
is not due to growth of higher-skill jobs more generally - in fact, employment and wage
growth for high math, low social jobs (including many STEM ocucpations) has been
relatively slow.
2. Increasing returns to social skills over time. I explore this prediction by comparing the
returns to social skills across the 1979 and 1997 waves of the NLSY. This compares
youth entering the labor market in the 1980s and early 1990s to their counterparts
in the early 2000s. I construct comparable age cohorts and include an identical set
of covariates, which allows me to estimate changes in the returns to skills over time
holding other factors constant. I also study whether the wage returns from sorting
into social skill-intensive occupations have increased with time.17An alternative hypothesis - advanced by Krueger & Schkade (2008) - is that gregarious workers have a
preference for social interaction, and thus will accept a lower wage to work in a non-routine occupation.
16

III. Data
III..A O*NET and Census/ACS Data
I study changes in the the task content of work using data from the Occupational Informa-
tion Network (O*NET). O*NET is a survey administered by the U.S. Department of Labor to
a random sample of U.S. workers in each occupation. The O*NET survey began in 1998 and
is updated periodically. I use the 1998 O*NET to most accurately reflect the task content
of occupations in earlier years, although results with later versions of O*NET are generally
similar.
The O*NET survey asks many different questions about the abilities, skills, knowledge
and work activities required in an occupation. The questions are rated on an ordinal scale,
with specific examples that illustrate the value of each number to help workers answer the
question accurately. Because the scale values have no natural cardinal meaning, I follow
Autor et al. (2003) and convert average scores by occupation on O*NET questions to a 0-10
scale that reflects their weighted percentile rank in the 1980 distribution of task inputs.
Autor & Dorn (2013) create a balanced and consistent panel of occupation codes that
cover the 1980-2000 Censuses and the 2005 American Community Survey (ACS). I extend
their approach with the ACS data through 2012, updating the occupation crosswalk to re-
flect changes made in 2010 and making a few minor edits for consistency - see the Data
Appendix for details.
I focus on changes in three key indicators of task content. First, I measure an occupa-
tion’s routine task intensity as the average of the following two questions - 1) “how auto-
mated is the job?” and 2) “how important is repeating the same physical activities (e.g. key
entry) or mental activities (e.g. checking entries in a ledger) over and over, without stopping,
to performing this job?”18 Second, I closely follow Autor et al. (2003) and define nonroutine
analytical (math) task intensity as the average of three O*NET variables that capture an
occupation’s mathematical reasoning requirements.19 Third, I define an occupation’s social
skill intensity as the average of the four items in the O*NET module on “social skills” - 1)
18This definition of routineness differs from the task measures used by Autor et al. (2003), who use the1977 Dictionary of Occupational Titles (DOT) measures “set limits, tolerances or standards” (STS) and “fingerdexterity” (FINGER). They call these task measures “routine cognitive” and “routine manual” respectively.Autor & Dorn (2013) and other subsequent work combine these two measures into an index of routine taskintensity (RTI). Occupations that are at least 50 percentiles higher on the RTI measure compared to myO*NET-based measure include telecom and line installers, masons, tilers and carpet installers, pharmacists,and dental assistants. Occupations that rank as much more routine according to the O*NET measure includetaxi drivers and chauffeurs, bus drivers, garbage collectors and computer scientists.
19The three O*NET variables are 1) the extent to which an occupation requires mathematical reasoning; 2)whether the occupation requires using mathematics to solve problems; and 3) whether the occupation requiresknowledge of mathematics. See the Data Appendix for details.
17

coordination; 2) negotiation; 3) persuasion; and 4) social perceptiveness.20
The measures of routiness and social skill intensity are strongly negatively correlated.
Appendix Table A1 shows that the occupation-level correlation between routine task in-
tensity and social skill task intensity is -0.68. This strong negative correlation drops only
slightly (-0.56) after adding controls for ten other widely used O*NET task measures. This
suggests that a strong predictor of whether or not an occupation is routine is whether it
requires social skills.
O*NET is the successor of the Dictionary of Occupational Titles (DOT), which was used
by Autor et al. (2003) and many others to study the changing task content of work. Appendix
Figure A2 shows that the two data sources yield similar results for analogous task measures.
I use the O*NET in this paper because it is a more recent data source that is updated
regularly, and because it contains many more measures of the task content of work than the
DOT.
III..B NLSY79
My main data source for worker skills and wages is the 1979 National Longitudinal Survey
of Youth (NLSY79). The NLSY79 is a nationally representative sample of youth ages 14
to 22 in 1979. The survey was conducted yearly from 1979 to 1993 and then biannually
from 1994 through 2012, and includes detailed measures of pre-market skills, schooling
experience, employment and wages. My main outcome is the real log hourly wage (indexed
to 2013 dollars), excluding respondents under the age of 23 or who are enrolled in school.
Following Altonji et al. (2012), I trim values of the real hourly wage that are below 3 and
above 200. The results are robust to alternative outcomes and sample restrictions such as
using log annual earnings or conditioning on 20 or more weeks of full-time work.
I use respondents’ standardized scores on the Armed Forces Qualifying Test (AFQT) to
proxy for cognitive skill, following many other studies (e.g. Neal & Johnson 1996; Altonji
et al. 2012). Altonji et al. (2012) construct a mapping of the AFQT score across NLSY waves
that is designed to account for differences in age-at-test, test format and other idiosyncra-
cies. I take the raw scores from Altonji et al. (2012) and normalize them to have mean zero
and standard deviation one.
Several psychometrically valid and field-tested measures of social skills exist, but none
20O*NET gives the following definitions for the four items designed to measure social skills: 1) Coordination- “adjusting actions in relation to others’ actions”; 2) Negotiation - “bringing others together and trying toreconcile differences”; 3) Persuasion - “persuading others to change their minds or behavior”; 4) Social Percep-tiveness - “being aware of others’ reactions and understanding why they react as they do”. Appendix FigureA1 demonstrates that my preferred measure of social skills is strongly correlated with other similar O*NETvariables that capture coordination, interaction and team production. See the Data Appendix for details.
18
are used by the NLSY or other panel surveys of adult workers. As an alternative, I construct
a pre-market measure of social skills using the following four variables:
1. Self-reported sociability in 1981 (extremely shy, somewhat shy, somewhat outgoing,
extremely outgoing)
2. Self-reported sociability in 1981 at age 6 (retrospective)
3. The number of clubs in which the respondent participated in high school
4. Participation in high school sports (yes/no)
I normalize each variable to have a mean of zero and a standard deviation of one. I then
take the average across all 4 variables and re-standardize so that cognitive skills and social
skills have the same distribution. The results are not sensitive to other reasonable choices,
such as dropping any one of the four measures or constructing a composite using principal
component analysis.
The first three questions measure behavioral extraversion and prosocial orientation -
both of which have been shown in meta-analyses to be positively correlated with measures
of social and emotional intelligence (Lawrence et al. 2004; Declerck & Bogaert 2008; Mayer
et al. 2008). Participation in team sports in high school has been associated with leadership,
prosocial orientation and teamwork ability, and has been shown to positively predict labor
market outcomes in adulthood (Barron et al. 2000; Kuhn & Weinberger 2005; Weinberger
2014). The measures of participation in sports and clubs used here are very similar to those
used in Weinberger (2014).
A key concern is that this measure of social skills may simply be a proxy for unmea-
sured cognitive or “non-cognitive” skills. The correlation between AFQT and social skills is
about 0.26 in the analysis sample, which is consistent with the modest positive correlations
(between 0.25 and 0.35) found between IQ and social and emotional intelligence across a
variety of meta-analyses and independent studies (Mayer et al. 2008; Baker et al. 2014).
To account for possible bias from unmeasured ability differences, I control for completed
years of education in addition to AFQT in some specifications. I also construct a measure of
“non-cognitive” skills using the normalized average of the Rotter Locus of Control and the
Rosenberg Self-Esteem Scale - which are also used by Heckman et al. (2006). This “non-
cognitive” skill measure is modestly positively correlated with both AFQT (0.30) and the
social skills composite (0.20). To the extent that my measure of social skills is an imperfect
or even poor proxy for the underlying construct, the results may understate its relative
importance.
19

The NLSY79 includes information on each respondent’s occupation, which I match to
the O*NET and DOT codes using the Census occupation crosswalks developed by Autor &
Dorn (2013). The NLSY also includes Census industry codes, and I control for industry fixed
effects in some specifications.
Mean self-reported sociability is 2.32 at age 6 and 2.88 as an adult, so on average re-
spondents viewed themselves as less sociable in childhood than as adults. About 39 percent
of respondents participated in athletics in high school, and the mean number of clubs was
just above 1. Kuhn & Weinberger (2005) and Weinberger (2014) study the returns to lead-
ership skills among a sample of white males who begin as high school seniors, leading to
college-going rates that are about three times higher than in the NLSY79. Compared to
those samples, the NLSY79 respondents are more disadvantaged and more representative
of the U.S. population.
III..C NLSY97
I investigate the growing importance of social skills by comparing the return to skills in the
NLSY79 to the NLSY97. The NLSY97 is a nationally representative panel survey of youth
age 12-16 in 1997 that follows a nearly identical structure to the NLSY79. My measure of
social skills in the NLSY97 is two questions that capture the extraversion factor from the
commonly-used Big 5 personality inventory (e.g. Goldberg 1993). Following the procedures
above, I normalize these two questions, take the average and then re-normalize them. The
NLSY97 does not ask questions about clubs or participation in high school sports. Like the
NLSY79, the NLSY97 also includes information on non-cognitive skills (the Big 5 factor
conscientiousness), as well as education, occupation and industry.
When estimating changes in the return to skills over time in Section 5.2, I modify the
construction of the social skills measure from the NLSY79 so that it only uses the first two
items on sociability. This maximizes the comparability of the two measures of social skills
across NLSY waves. Finally, when comparing NLSY waves I restrict the sample to ages
25-33 to exploit the overlap in ages across surveys. This means I am comparing the returns
to social skills for youth of similar ages during the late 1980s and early 1990s, compared to
the more recent 2004-2012 period.
20

IV. NLSY79 Results
IV..A Labor Market Returns to Skills and Complementarity
The first two predictions of the model are that there will be a positive return to skills in
the labor market, and that cognitive skill and social skill are complements. I regress log
hourly wages on both measures of skill and their interaction, controlling for a variety of
other covariates:21
ln(wage i jt
)=α+β1COG i +β2SS i +β3COG i ∗SSi +γX i jt +δ j +ζt +εi jt(18)
The results are in Table 1. The baseline model includes controls for race-by-gender indica-
tors, indicators for region and urbanicity, and age (indexed by j) and year (indexed by t) fixed
effects. Each observation is a person-year, and I cluster standard errors at the individual
level.
Column 1 shows that the return to social skills is positive and statistically significant.
A one standard deviation increase in social skills increases real hourly wages by 10.7 per-
cent. Column 2 adds the AFQT, my measure of cognitive skill. A one standard deviation
increase in cognitive skill increase hourly wages by 20.6 percent. The addition of cognitive
skill lowers the coefficient on social skills to 5.5 percent but it remains highly statistically
significant.
Column 3 tests for complementarity by adding the interaction of cognitive skills and
social skills, following the results in Weinberger (2014). The interaction is positive, large
(0.019) and statistically significant at the less than one percent level. Column 4 adds con-
trols for non-cognitive skills. Non-cognitive skills are highly predictive of wages (0.048,
p<0.001), but their inclusion barely changes the coefficients on cognitive skill and social
skill, suggesting that each measure contains independent information about productivity.
Column 5 adds controls for years of completed education. Controlling for education reduces
the coefficient on all the skill measures, yet they remain statistically significant predictors
of wages.
One concern is that cognitive skill and social skill are noisy measures of the same un-
derlying ability. In that case, the estimated complementarity between cognitive skills and
social skills reflects measurement error. I test this in Column 6 by adding an interaction21The formal model is written in levels. However, taking logs in equations (16) and (17) would lead to
a regression with the natural log of wages as the outcome and additive separability of cognitive skills andsocial skills. This implies that cognitive skills and social skills are complements in levels, but not in logs.However, I present main results using log wages to follow standard practice in the literature. Table 1 showsresults for log wages, while Appendix Table A2 presents analogous results with hourly wages in levels. I findcomplementarity in both specifications, although it is stronger in levels than in logs.
21

between cognitive skill and non-cognitive skill. If wages are determined by a single ability
that is measured by all three skills with error, all of the interaction terms will be positive.
Yet Column 6 shows that the interaction between cognitive skills and non-cognitive skills is
not statistically significant. Moreover, it drops to zero after adding controls for education,
even as the coefficient on the cognitive skill and social skill interaction remains statistically
significant (Column 7). Complementarity holds only for cognitive skills and social skills.
Appendix Tables A3 and A4 show that the labor market return to social skills is positive
and statistically significant for all race, gender and education subgroups, in both logs and
levels respectively. I find some evidence of greater returns to skills and greater skill comple-
mentarity among respondents who have at least some college education, which is consistent
again with Weinberger (2014).
IV..B Occupational Sorting on Skills
I next examine the third prediction of the model - workers with higher levels of social skill
will sort into non-routine and social skill-intensive occupations. I estimate regressions like
equation (18) above but with the task content of occupations (measured using O*NET) as
the dependent variable. The baseline model is identical to equation (18), and I control for
the covariates in Table 1 plus years of completed education and industry fixed effects.
The results are in Table 2. Column 1 shows that a one standard deviation increase in
social skills decreases the routine task intensity of a worker’s occupation by 1.88 percentiles,
and the coefficient is highly statistically significant. I also find a negative coefficient on
cognitive skills and the interaction between cognitive skills and social skills. Column 2
adds controls for math task intensity as well as three other related O*NET cognitive task
measures. This causes the sign on cognitive skills to flip but has little impact on the other
coefficients. Conditional on overall cognitive task intensity, workers in routine occupations
have higher cognitive skills (0.161, p<0.001) and significantly lower social skills (-0.149,
p<0.001). Combined with the negative coefficient on the interaction, these results imply
that workers with high cognitive skills and low social skills sort into routine occupations.
Columns 3 and 4 estimate parallel specifications but with the social skill intensity of a
worker’s occupation as the outcome. The results are generally similar but opposite in sign.
Overall, the results in Table 2 confirm the prediction that workers with higher social skills
sort into non-routine and social skill-intensive occupations. This suggests that estimates of
the return to skills within occupations should be interpreted with caution.
22

IV..C Returns to Skills by Occupation Task Intensity
Table 2 shows clearly that workers sort into occupations where their skills are more re-
warded. This makes it difficult to estimate the returns to worker skills controlling for oc-
cupation. However, if we are willing to assume that labor market frictions prevent perfect
sorting of workers to occupations, we can estimate how the return to skills changes when
the same worker switches occupations. Labor market frictions may be particularly impor-
tant early in one’s career, when skills are imperfectly observed by employers (e.g. Altonji
et al. 2001).
The model predicts that workers will earn more when they switch into non-routine and
social skill-intensive occupations, and that the wage gain from switching will be increasing
in social skill. I explore these predictions by estimating:
ln(wage i jt
) = β1COG i ∗Ti jt +β2SSi ∗Ti jt +β3COG i ∗SSi ∗Ti jt
+γX i jt +ηi +δ j +ζt +εi jt(19)
where Ti jt indexes the task content of a worker’s occupation (with the main effect in-
cluded in the X i jt vector), ηi is a worker fixed effect and the rest of the terms are defined as
above. Note that with worker fixed effects only the interactions between skills and Ti jt are
identified, not the returns to skills themselves.
The results are in Table 3. The baseline specification in Column 1 shows that workers
earn significantly higher wages when they sort into routine occupations. However I do find
that the wage return from sorting into non-routine occupations is increasing in social skills,
which is consistent with the predictions of the model. Column 2 replaces routine with social
skill task intensity. Workers who switch into a job that is 10 percentiles higher in the
O*NET measure of social skill intensity earn about 3.9 percent higher wages. Moreover, the
worker’s wage gain is significantly increasing her social skills. For example, the estimates
imply a wage gain of 3.9 percent for a worker of average social skills but 8.9 percent when
the worker has social skills that are one standard deviation above the mean.
Column 3 includes both the routine and social skill measures together. This causes
the interactions between skills and routine task intensity to fade to near zero, while the
coefficients on the social skill interactions remain statistically significant and even increase
slightly. Thus the social skill O*NET task measure is a better predictor of the returns to
social skills when both measures are included together. The results in Table 3 are robust to
including industry fixed effects as well as other specific job attributes such as union status or
whether a position involves supervising workers. Additionally, in results not reported I find
23

that interactions between skills and math task intensity are not statistically significant.
This shows that relatively higher returns to skill in social skill-intensive occupations are
not simply a proxy for job complexity or overall skill requirements.
While Krueger & Schkade (2008) do not estimate within-worker wage changes, their
compensating differentials explanation implies that workers are willing to accept a wage
penalty for a job with more social interaction. However, the wage gains from switching into
a social skill-intensive occupation show in Table 3 are not consistent with a compensating
differentials story. Instead, the results support the predictions of the model, which suggest
that higher social skills are more beneficial in occupations where there is more potential
gain from “task trade”.
V. The Growing Importance of Social Skills
V..A Employment and Wage Growth in Social Skill-Intensive Occupations
I begin by presenting trends in employment and wage growth in the U.S. between 1980 and
2012. Figure 3 replicates Figure I of Autor et al. (2003) for the 1980-2012 period using the
three O*NET task measures described above. By construction, each task variable has a
mean of 50 centiles in 1980. Thus subsequent movement should be interpreted as changes
in the employment-weighted mean of each task relative to its importance in 1980. The data
are aggregated to the industry-education-sex level, which implicitly controls for changes in
task inputs that are due to changes in the industry and skill mix of the U.S. economy over
time. There is no adding-up constraint for tasks in a given year, and so changes over time
can also reflect changes in total labor supply.
Like Autor & Price (2013), I find that the labor input of routine tasks has continued
to decline, and that nonroutine analytical (math) task inputs stopped growing and even
declined modestly after 2000. However, social skill task inputs grew by 24 percent from
1980 to 2012, compared to only about 11 percent for nonroutine analytical tasks. Moreover,
while nonroutine analytical task inputs have declined since 2000, social skills task inputs
held steady (growing by about 2 percent) through the 2000s. Not surprisingly, the decline in
routine tasks mirrors the growing importance of social skills between 1980 and 2012.
Since the math and social skill task measures are highly correlated, growth in the impor-
tance of social skills could simply reflect general skill upgrading. I address this by dividing
occupations into four mutually exclusive categories based on whether they are above or be-
low the median percentile in both math and social skill task intensity. I then compute the
share of all labor supply-weighted employment in each category and year.
24

Figure 4 plots the growth of employment shares - relative to a 1980 baseline - in each
category. Jobs with high math and high social skill intensity grew by about 7.2 percentage
points as a share of the U.S. labor force between 1980 and 2012. Low math, high social
skill jobs grew by about 4.6 percentage points, for a total increase of 11.8 percentage points
in the employment share of social skill-intensive occupations since 1980. In contrast, the
employment share of jobs with high math but low social skill intensity shrank by about 3.3
percentage points over the same period. This includes many of the STEM jobs shown in
Figure 1. The basic pattern in Figure 4 is robust to choosing cutoffs other than the 50th
percentile for each type of task.
One possible explanation for the slow growth of high math, low social skill jobs is that
employers cannot find workers to fill technical and math-intensive positions. In that case,
we would expect relatively greater wage growth for these occupations. Figure 5 plots the
change since 1980 in real hourly wages for occupations in each of the four categories. I find
that wages for high math, low social skill jobs grew by only about 5.9 percent between 1980
and 2012, compared to about 26 percent for high math, high social skill occupations.
Appendix Figures A3 and A4 show that employment and wage growth for social skill-
intensive occupations has occurred throughout the skill distribution and is not concentrated
in particularly low- or high-paying jobs.
Appendix Tables A5 and A6 estimate employment and wage growth for jobs requiring
different bundles of tasks in a multivariate framework. The results generally support the
growing importance of social skills after controlling for changes in sex, education and indus-
try mix. I find particularly strong employment growth for jobs that are high in both math
and social skills. This pattern has accelerated since 2000. Finally, I note that the strong
growth of social skill-intensive jobs is robust to excluding all managerial, health care and
education occupations from the sample, although these jobs are important drivers of the
overall trend.
Overall, the evidence from aggregate labor market data suggests that jobs requiring
social skills have experience strong relative employment and wage growth since 1980.
V..B Increasing Returns to Social Skill Across NLSY Waves
Here I present direct evidence on the growing importance of social skills by studying changes
in the returns to skills across the 1979 and 1997 waves of the NLSY. The cognitive skill and
social skill measures are designed to be closely comparable across waves. As a reminder,
I restrict the age range to 25-33 and use an alternative definition of social skills for this
analysis to maximize comparability across waves - see Section 3 for details. I estimate:
25

yi jt =α+S∑
s=1
[βsSK ILL i +γs (SK ILL i ∗NLSY 97i)
]+ζX i jt +δ j +ζt +εi jt(20)
The skill vector includes cognitive skills, social skills and their interaction, as well as
non-cognitive skills in some specifications. The interaction between skills and an indicator
for being in the NLSY97 sample allows me to directly test the hypothesis that the returns
to skills have changed over time. The X i jt vector includes a standard set of demographic
controls, age and year fixed effects, and an indicator variable for whether the respondent is
in the NLSY97 sample. In order to study changing selection into the labor force, I allow yi jt
to be either an indicator for full-time employment or the log real hourly wage (conditional
on employment).
The results are in Table 4. Columns 1 through 3 show results for full-time employment.
Column 1 shows that a one standard deviation increase in cognitive skills increases the
probability of full-time employment by 6.8 percentage points, relative to a baseline mean
of about 85 percent. However, the interaction with the NLSY97 sample indicator is not
statistically significant, suggesting that the returns to cognitive skill in terms of full-time
work have not changed very much across survey waves.
In contrast, the association between social skills and the probability of full-time work has
increased more than fourfold. A one standard deviation increase in social skills is associated
with an increase in the probability of full-time employment of only about 0.7 percentage
points (p=0.006) in the NLSY79 sample, compared to 3.0 percentage points in the NLSY97
sample (p<0.001).
The NLSY97 sample was in the 25-33 age range between 2004 and 2012, which matches
up closely to the labor market trends shown in Section 5.1. In results not shown, I find
that the difference in returns to skills across NLSY waves is slightly larger for males, which
suggests that differences in female labor force participation across the last few decades are
not directly driving the results.
Column 2 adds controls for years of completed education, which reduces the impact of
skills overall but has almost no impact on the change in returns to skills over time. Column
3 adds controls for non-cognitive skills. Interestingly, I find that the impact of a one standard
deviation gain in non-cognitive skills on the probability of full-time work has increased
from 0.8 to 2.1 percentage points. However, the coefficients on social skills are qualitatively
unchanged.
Columns 4 through 6 study changes in the impact of skills on wages, among workers
who are employed full-time. The large change in the impact of skills on full-time work
in Columns 1 through 3 suggests that these results should be interpreted with caution,
26
although under reasonable assumptions about labor market sorting they provide a lower
bound estimate of the changing returrn to skills.
Interestingly, the wage return to cognitive skills appears to have declined modestly over
time. The estimates in Column 4 imply that a one standard deviation increase in cogni-
tive skills increased wages by 20.3 percent in the NLSY79 but only 15.1 percent in the
NLSY97.22 This is consistent with Castex & Dechter (2014), who also study the changing
returns to cognitive skill using the NLSY79 and NLSY97.
In contrast, the returns to social skill among full-time workers have grown significantly
across NLSY waves. The estimates in Column 4 imply that a one standard deviation in-
crease in social skills yields a wage gain of 2.0 percent in the NLSY79, compared to 3.7
percent in the NLSY97. Adding controls for years of completed education and non-cognitive
skills has little impact on the estimates. Overall, the results in Table 4 show that social
skills are a significantly more important predictor of labor market success for youth in the
2004 to 2012 period, compared to the late 1980s and 1990s.
V..C Changes in the Relative Returns to Skill Across Occupations
Finally, I study 1) whether the wage gain from sorting into social skill-intensive occupations
has changed across survey waves; and 2) whether this wage gain (if any) is increasing in a
worker’s social skills. I estimate:
ln(wage i jt
) =S∑
s=1
[βs
(SK ILL i ∗Ti jt
)+ϑs(Ti jt ∗NLSY 97i
)+γs(SK ILL i ∗Ti jt ∗NLSY 97i
)]+ζX i jt +ηi +δ j +φt +εi jt(21)
Equation (21) takes the same general form as equation (19), with worker fixed effects and
interactions between skills and occupation task intensities from O*NET. The key difference
is that I also include three-way interactions between skills, task measures and an indicator
for being in the NLSY97 panel.
The results are in Table 5. Columns 1 and 2 include only the two-way interactions
between the task measures Ti jt and the NLSY97 indicator. In Column 1, I find that the wage
22Unlike Table 1, the results in Columns 4 through 6 show little evidence of complementarity between cogni-tive skills and social skills. The results are different for two reasons. First, the sample in Table 4 is restrictedto ages 25-33, whereas Table 1 estimates returns to skills for prime-age workers. Skill complementarity isabout 30 percent smaller when I restrict to ages 25-33 in Table 1. Second, the definition of social skills inTable 4 only includes self-reported sociability, whereas the measurement of social skills in Table 1 also in-cludes participation in clubs and sports. Complementarity is about 50 percent smaller (but still statisticallysignificant at the 5 percent level) when I use only survey responses to measure social skills in Table 1.
27

gain for a worker who switches into a more social skill-intensive occupation is significantly
greater in more recent years. The within-worker wage return to a 10 percentile increase
in skill intensity is equal to zero in the NLSY79 wave, compared to about 2.1 percent in
the NLSY97 wave.23 Column 2 adds the math task measure plus an interaction with the
NLSY97 indicator. In contrast to the results for social skills, the wage return to math-
intensive occupations declined from about 1.7 percent to 0.8 percent between the 1979 and
1997 NLSY cohorts. Thus the evidence in Table 5 suggests that the wage gain from sorting
into social skill-intensive jobs has increased over time.
Columns 3 and 4 add the three-way interactions with skills shown in equation (22). I
add summary tests of statistical significance across multiple coefficients on skills at the
bottom of Table 5. The complementarity between social skills and jobs requiring social
interaction has increased in the NLSY97 sample. The coefficient on the triple interaction in
Column 3 is positive but not statistically significant, and the sum of the coefficients barely
fails to reject at the 10 percent level (p=0.108). Column 4 adds interactions between skills,
the NLSY97 indicator, and math task intensity. To conserve space, I do not show these
coefficients. However, adding math task intensity makes the triple interaction between
social skills, social skill task intensity and the NLSY97 indicator larger and more precise,
and it is now statistically significant at the 10 percent level (0.0069, p=0.071). In contrast,
the triple interaction with math task intensity (not shown) is negative and not statistically
different from zero.
In sum, comparing the returns to skills and the impact of job changes across survey
waves suggests that social skills have become more important over time, and that growth
in the return to social skills has been greater for workers who sort into social skill-intensive
occupations.
VI. Conclusion
This paper presents evidence of growing demand for social skills over the last several decades.
What explains the growing importance of social skills in the labor market? One reason is
that computers are still very poor at simulating human interaction. Reading the minds of
others and reacting is an unconscious process, and skill in social settings has evolved in
humans over thousands of years. Human interaction in the workplace involves team pro-
23Note that this estimate differs from the worker fixed effects models in Table 3, because those are estimatedusing a much larger age range. This suggests that the wage gain from switching to a social skill-intensiveoccupation was greater for older workers in the NLSY79 survey. Unfortunately, the panel design of the NLSYdoes not allow me to distinguish between age effects and cohort effects (i.e. whether the larger return for olderworkers is because the return to social skills increased over time or whether the return is constant but largerfor later-career workers.)
28

duction, with workers playing off of each other’s strengths and adapting flexibly to changing
circumstances. Such nonroutine interaction is at the heart of the human advantage over
machines.
I formalize the importance of social skills with a model of team production in the work-
place. Because workers naturally vary in their ability to perform the great variety of work-
place tasks, teamwork increases productivity through comparative advantage. I model so-
cial skills as reducing the worker-specific cost of coordination, or “trading tasks” with others.
Workers with high social skills can trade tasks at a lower cost, enabling them to work with
others more efficiently.
The model generates intuitive predictions about sorting and the relative returns to skills
across occupations, which I investigate using two panel surveys - the NLSY79 and NLSY97
- that contain comparable measures of worker skills and repeated observations of occupa-
tional choice and wages. I find that the wage return to social skills is positive even after
conditioning on cognitive skill, non-cognitive skill, and a wide variety of other covariates,
and that cognitive skill and social skill are complements. I also find that workers with
higher social skills are more likely to work in social skill-intensive occupations, and that
they earn a relatively higher wage return when they sort into these occupations.
I show evidence of strong relative employment and wage growth for social skill-intensive
occupations between 1980 and 2012. Jobs that require high levels of cognitive skill andsocial skill have fared particularly well, while high math, low social skill jobs (including
many STEM occupations) have fared especially poorly. I also study changes in the returns to
social skill between the NLSY79 and NLSY97, using nearly identical measures of skills and
other covariates across survey waves. I find that social skills were a much stronger predictor
of employment and wages for young adults age 25 to 33 in the mid 2000s, compared to the
1980s and 1990s. In contrast, the importance of cognitive skills has declined modestly.
This paper argues for the importance of social skills, yet it is silent about where social
skills come from and whether they can be affected by education or public policy. A robust
finding in the literature on early childhood interventions is that long-run impacts on adult
outcomes can persist can even when short-run impacts on test scores “fade out” (e.g. Deming
2009; Chetty et al. 2011).
It is possible that increases in social skills are a key mechanism for long-run impacts
of early childhood interventions. Heckman et al. (2013) find that the long-run impacts of
the Perry Preschool project on employment, earnings and criminal activity were mediated
primarily by program-induced increases in social skills. The Perry Preschool curriculum
placed special emphasis on developing children’s skills in cooperation, resolution of interper-
sonal conflicts and self-control. Recent longitudinal studies have found strong correlations
29

between a measure of socio-emotional skills in kindergarten and important young adult out-
comes such as employment, earnings, health and criminal activity (Dodge et al. 2014; Jones
et al. 2015).
If social skills are learned early in life, not expressed in academic outcomes such as
reading and math achievement, but important for adult outcomes such as employment and
earnings, this would generate the “fade out” pattern that is commonly observed for early life
interventions. Indeed, preschool classrooms focus much more on the development of social
and emotional skills than elementary school classrooms, which emphasize “hard” academic
skills such as literacy and mathematics. Still, these conclusions are clearly speculative,
and the impact of social skill development on adult labor market outcomes is an important
question for future work.
HARVARD UNIVERSITY AND NBER
30

References
Acemoglu, Daron, & Autor, David. 2011. Skills, tasks and technologies: Implications for
employment and earnings. Handbook of labor economics, 4, 1043–1171.
Altonji, Joseph G, Pierret, Charles R, et al. 2001. Employer Learning and Statistical Dis-
crimination. The Quarterly Journal of Economics, 116(1), 313–350.
Altonji, Joseph G, Bharadwaj, Prashant, & Lange, Fabian. 2012. Changes in the Character-
istics of American Youth: Implications for Adult Outcomes. Journal of Labor Economics,
30(4), 783–828.
Autor, David. 2014. Polanyi’s paradox and the shape of employment growth. National Bu-
reau of Economic Research.
Autor, David, & Handel, Michael J. 2013. Putting tasks to the test: Human capital, job
tasks, and wages. Journal of labor Economics, 31(2 Part 2), S59–S96.
Autor, David, Levy, Frank, & Murnane, Richard J. 2003. THE SKILL CONTENT OF RE-
CENT TECHNOLOGICAL CHANGE: AN EMPIRICAL EXPLORATION. Quarterly Jour-nal of Economics, 118(4).
Autor, David, Dorn, David, & Hanson, Gordon. 2015. Untangling Trade and Technology:
Evidence from Local Labour Markets. Economic Journal, 621–646.
Autor, David H. 2015. Why are there still so many jobs? the history and future of workplace
automation. The Journal of Economic Perspectives, 29(3), 3–30.
Autor, David H, & Dorn, David. 2013. The growth of low-skill service jobs and the polariza-
tion of the US labor market. The American Economic Review, 103(5), 1553–1597.
Autor, David H, Levy, Frank, & Murnane, Richard J. 2002. Upstairs, downstairs: Computers
and skills on two floors of a large bank. Industrial & Labor Relations Review, 55(3), 432–
447.
Autor, David H, Katz, Lawrence F, & Kearney, Melissa S. 2006. The Polarization of the US
Labor Market. The American Economic Review, 189–194.
Autor, DH, & Price, Brendan. 2013. The changing task composition of the US labor market:An update of Autor, Levy, and Murnane (2003).
31

Baker, Crystal A, Peterson, Eric, Pulos, Steven, & Kirkland, Rena A. 2014. Eyes and IQ: a
meta-analysis of the relationship between intelligence and Reading the Mind in the Eyes.
Intelligence, 44, 78–92.
Baron-Cohen, Simon. 2000. Theory of mind and autism: A fifteen year review.
Baron-Cohen, Simon, Wheelwright, Sally, Hill, Jacqueline, Raste, Yogini, & Plumb, Ian.
2001. The Reading the Mind in the Eyes test revised version: A study with normal adults,
and adults with Asperger syndrome or high-functioning autism. Journal of child psychol-ogy and psychiatry, 42(2), 241–251.
Barron, John M, Ewing, Bradley T, & Waddell, Glen R. 2000. The effects of high school
athletic participation on education and labor market outcomes. Review of Economics andStatistics, 82(3), 409–421.
Bartel, Ann, Ichniowski, Casey, & Shaw, Kathryn. 2007. How Does Information Technology
Affect Productivity? Plant-Level Comparisons of Product Innovation, Process Improve-
ment, and Worker Skills. The Quarterly Journal of Economics, 122(4), 1721–1758.
Beaudry, Paul, Green, David A, & Sand, Benjamin M. 2014. The declining fortunes of the
young since 2000. The American Economic Review, 104(5), 381–386.
Beaudry, Paul, Green, David A, & Sand, Benjamin M. 2016. The great reversal in the
demand for skill and cognitive tasks. Journal of Labor Economics, 34(S1), S199–S247.
Becker, Gary S., & Murphy, Kevin M. 1992. The Division of Labor, Coordination Costs, and
Knowledge. The Quarterly Journal of Economics, 107(4), 1137–1160.
Bloom, Nicholas, & Van Reenen, John. 2011. Human resource management and productiv-
ity. Handbook of labor economics, 4, 1697–1767.
Bolton, Patrick, & Dewatripont, Mathias. 1994. The firm as a communication network. TheQuarterly Journal of Economics, 809–839.
Borghans, Lex, Ter Weel, Bas, & Weinberg, Bruce A. 2014. People skills and the labor-
market outcomes of underrepresented groups. Industrial & Labor Relations Review,
67(2), 287–334.
Bound, John, & Johnson, George E. 1992. Changes in the Structure of Wages in the 1980’s:
An Evaluation of Alternative Explanations. American Economic Review, 82(3), 371–92.
32

Bresnahan, Timothy. 1999. Computerisation and Wage Dispersion: An Analytical Reinter-
pretation. Economic Journal, 109(456), F390–415.
Bresnahan, Timothy F, Brynjolfsson, Erik, & Hitt, Lorin M. 2002. Information Technol-
ogy, Workplace Organization, and the Demand for Skilled Labor: Firm-Level Evidence.
Quarterly Journal of Economics, 339–376.
Brynjolfsson, Erik, & McAfee, Andrew. 2014. The second machine age: work, progress, andprosperity in a time of brilliant technologies. WW Norton & Company.
Camerer, Colin, Loewenstein, George, & Prelec, Drazen. 2005. Neuroeconomics: How neu-
roscience can inform economics. Journal of economic Literature, 9–64.
Card, David, Heining, Jörg, & Kline, Patrick. 2013. Workplace Heterogeneity and the Rise of
West German Wage Inequality*. The Quarterly Journal of Economics, 128(3), 967–1015.
Card, David, Cardoso, Ana Rute, & Kline, Patrick. 2016. Bargaining, sorting, and the gender
wage gap: Quantifying the impact of firms on the relative pay of women. The QuarterlyJournal of Economics, 131(2), 633–686.
Caroli, Eve, & Van Reenen, John. 2001. Skill-biased organizational change? Evidence from
a panel of British and French establishments. Quarterly journal of economics, 1449–1492.
Casner-Lotto, Jill, & Barrington, Linda. 2006. Are They Really Ready to Work? Employ-ers’ Perspectives on the Basic Knowledge and Applied Skills of New Entrants to the 21stCentury US Workforce. ERIC.
Castex, Gonzalo, & Dechter, Evgenia Kogan. 2014. The Changing Roles of Education and
Ability in Wage Determination. Journal of Labor Economics, 32(4), 685–710.
Chetty, Raj, Friedman, John N, Hilger, Nathaniel, Saez, Emmanuel, Schanzenbach, Di-
ane Whitmore, & Yagan, Danny. 2011. How Does Your Kindergarten Classroom Affect
Your Earnings? Evidence from Project Star*. The Quarterly journal of economics, 126(4),
1593–1660.
Declerck, Carolyn H, & Bogaert, Sandy. 2008. Social value orientation: related to empathy
and the ability to read the mind in the eyes. The Journal of social psychology, 148(6),
711–726.
Deming, David. 2009. Early childhood intervention and life-cycle skill development: Evi-
dence from Head Start. American Economic Journal: Applied Economics, 111–134.
33

Dessein, Wouter, & Santos, Tano. 2006. Adaptive organizations. Journal of Political Econ-omy, 114(5), 956–995.
Dodge, Kenneth A, Bierman, Karen L, Coie, John D, Greenberg, Mark T, Lochman, John E,
McMahon, Robert J, & Pinderhughes, Ellen E. 2014. Impact of early intervention on
psychopathology, crime, and well-being at age 25. American journal of psychiatry, 172(1),
59–70.
Dornbusch, Rudiger, Fischer, Stanley, & Samuelson, Paul Anthony. 1977. Comparative ad-
vantage, trade, and payments in a Ricardian model with a continuum of goods. The Amer-ican Economic Review, 823–839.
Eaton, Jonathan, & Kortum, Samuel. 2002. Technology, geography, and trade. Economet-rica, 70(5), 1741–1779.
Edmondson, Amy C. 2012. Teaming: How organizations learn, innovate, and compete in theknowledge economy. John Wiley & Sons.
Garicano, Luis. 2000. Hierarchies and the Organization of Knowledge in Production. Jour-nal of political economy, 108(5), 874–904.
Garicano, Luis, & Rossi-Hansberg, Esteban. 2006. Organization and Inequality in a Knowl-
edge Economy*. The Quarterly journal of economics, 121(4), 1383–1435.
Goldberg, Lewis R. 1993. The structure of phenotypic personality traits. American psychol-ogist, 48(1), 26.
Goleman, Daniel. 2006. Emotional intelligence. Bantam.
Goos, Maarten, Manning, Alan, & Salomons, Anna. 2014. Explaining job polarization:
Routine-biased technological change and offshoring. The American Economic Review,
104(8), 2509–2526.
Gordon, Robert J. 2012. Is US economic growth over? Faltering innovation confronts the sixheadwinds. Tech. rept. National Bureau of Economic Research.
Hackman, J Richard. 2002. Leading teams: Setting the stage for great performances. Har-
vard Business Press.
Heckman, James, & Scheinkman, Jose. 1987. The importance of bundling in a Gorman-
Lancaster model of earnings. The Review of Economic Studies, 54(2), 243–255.
34

Heckman, James, Pinto, Rodrigo, & Savelyev, Peter. 2013. Understanding the Mechanisms
Through Which an Influential Early Childhood Program Boosted Adult Outcomes. TheAmerican Economic Review, 103(6), 1–35.
Heckman, James J. 1995. Lessons from the bell curve. Journal of Political Economy, 1091–
1120.
Heckman, James J, & Kautz, Tim. 2012. Hard evidence on soft skills. Labour economics,
19(4), 451–464.
Heckman, James J, Stixrud, Jora, & Urzua, Sergio. 2006. The Effects of Cognitive and
Noncognitive Abilities on Labor Market Outcomes and Social Behavior. Journal of LaborEconomics, 24(3), 411–482.
Jerald, Craig D. 2009. Defining a 21st century education. Center for Public education.
Jones, Damon E, Greenberg, Mark, & Crowley, Max. 2015. Early Social-Emotional Func-
tioning and Public Health: The Relationship Between Kindergarten Social Competence
and Future Wellness. American journal of public health, e1–e8.
Juhn, Chinhui, Murphy, Kevin M, & Pierce, Brooks. 1993. Wage inequality and the rise in
returns to skill. Journal of political Economy, 410–442.
Kambourov, Gueorgui, Siow, Aloysius, & Turner, Laura. 2013. Relationship Skills in the
Labor and Marriage Markets.
Karabarbounis, Loukas, & Neiman, Brent. 2014. The Global Decline of the Labor Share.
The Quarterly Journal of Economics, 129(1), 61–103.
Katz, Lawrence F. 2014. Get a liberal arts B.A., not a business B.A., for the coming artisaneconomy.
Katz, Lawrence F, & Murphy, Kevin M. 1992. Changes in relative wages, 1963–1987: supply
and demand factors. The quarterly journal of economics, 107(1), 35–78.
Krueger, Alan B, & Schkade, David. 2008. Sorting in the Labor Market Do Gregarious
Workers Flock to Interactive Jobs? Journal of Human Resources, 43(4), 859–883.
Kuhn, Peter, & Weinberger, Catherine. 2005. Leadership skills and wages. Journal of LaborEconomics, 23(3), 395–436.
Lawrence, EJ, Shaw, P, Baker, D, Baron-Cohen, S, & David, AS. 2004. Measuring empathy:
reliability and validity of the Empathy Quotient. Psychological medicine, 34(05), 911–920.
35

Lazear, Edward P. 1999. Globalisation and the market for team-mates. The Economic Jour-nal, 109(454), 15–40.
Levy, Frank, & Murnane, Richard J. 2012. The new division of labor: How computers arecreating the next job market. Princeton University Press.
Lindbeck, Assar, & Snower, Dennis J. 2000. Multitask learning and the reorganization of
work: from tayloristic to holistic organization. Journal of labor economics, 18(3), 353–376.
Lindenlaub, Ilse. 2014. Sorting Multidimensional Types: Theory and Application.
Lindqvist, Erik, & Vestman, Roine. 2011. The Labor Market Returns to Cognitive and
Noncognitive Ability: Evidence from the Swedish Enlistment. American Economic Jour-nal: Applied Economics, 101–128.
Lise, Jeremy, & Postel-Vinay, Fabien. 2014. Multidimensional Skills, Sorting, and HumanCapital Accumulation. Tech. rept. Mimeo.
Lu, Qian. 2015. The End of Polarization? Technological Change and Employment in the US
Labor Market.
Mayer, John D, Caruso, David R, & Salovey, Peter. 1999. Emotional intelligence meets
traditional standards for an intelligence. Intelligence, 27(4), 267–298.
Mayer, John D, Roberts, Richard D, & Barsade, Sigal G. 2008. Human abilities: Emotional
intelligence. Annu. Rev. Psychol., 59, 507–536.
McCann, Robert J, Shi, Xianwen, Siow, Aloysius, & Wolthoff, Ronald. 2014. Becker Meets
Ricardo: Multisector Matching with Communication and Cognitive Skills.
Michaels, Guy, Natraj, Ashwini, & Van Reenen, John. 2014. Has ICT polarized skill de-
mand? Evidence from eleven countries over twenty-five years. Review of Economics andStatistics, 96(1), 60–77.
NACE. 2015. 2015 Job Outlook. Bethlehem, Pennsylvania, November.
Neal, Derek A, & Johnson, William R. 1996. The Role of Premarket Factors in Black-White
Wage Differences. The Journal of Political Economy, 104(5), 869–895.
Oldenski, Lindsay. 2012. Export versus FDI and the Communication of Complex Informa-
tion. Journal of International Economics, 87(2), 312–322.
36

Premack, David, & Woodruff, Guy. 1978. Does the chimpanzee have a theory of mind?
Behavioral and brain sciences, 1(04), 515–526.
Remus, Dana, & Levy, Frank S. 2015. Can robots be lawyers? computers, lawyers, and the
practice of law.
Ricardo, David. 1891. Principles of political economy and taxation. G. Bell and sons.
Salovey, Peter, & Mayer, John D. 1990. Emotional intelligence. Imagination, cognition andpersonality, 9(3), 185–211.
Weinberger, Catherine J. 2014. The increasing complementarity between cognitive and so-
cial skills. Review of Economics and Statistics, 96(4), 849–861.
Woolley, Anita Williams, Chabris, Christopher F, Pentland, Alex, Hashmi, Nada, & Malone,
Thomas W. 2010. Evidence for a collective intelligence factor in the performance of human
groups. science, 330(6004), 686–688.
Yamaguchi, Shintaro. 2012. Tasks and heterogeneous human capital. Journal of LaborEconomics, 30(1), 1–53.
37

FIGURE I
Each row presents 100 times the change in employment share between 2000 and 2012 for the indicated occupation. Consistent occupation codes for 1980-2012 are updated from Autor and Dorn (2013) and Autor and Price (2013) and consolidated to conserve space – see the Data Appendix for details.
-.2 0 .2 .4 .6
Engineers (All)
Drafters And Surveyors
Engineering And Science Technicians
Architects
Physical Scientists
Biological Scientists
Pilots/Air Traffic Control
Math/Stats/Actuaries
Medical Scientists
Operations Researchers
Comp. Sci./Programming/Tech Support
STEM Occupations
-.2 0 .2 .4 .6
Writers, Editors & ReportersMarketing, Advertising & Pr
Arts & Entertainment, AthletesSocial Scientists And Urban Planners
DentistsDental Hygienists
PharmacistsLegal Assistants & Paralegals
Physicians' AssistantsOther Business Support
Lawyers & JudgesCollege Instructors
PhysiciansSocial Workers, Counselors & Clergy
Economists & Survey ResearchersAccounting And Finance
Health TherapistsHealth Technicians
NursesManagers (All)
Teachers (K-12)
All Other Managerial or Professional Occupations
Source: 2000 Census and 2011-2013 ACS
100 x Change in Employment Share
Change in Relative Employment for Cognitive Occupations, 2000-2012

FIGURE II.A
Figure 2A illustrates the equilibrium task thresholds and from the Model in Section 2 of the paper when ∗ , 1 and ∗ 1
– see the text for details.
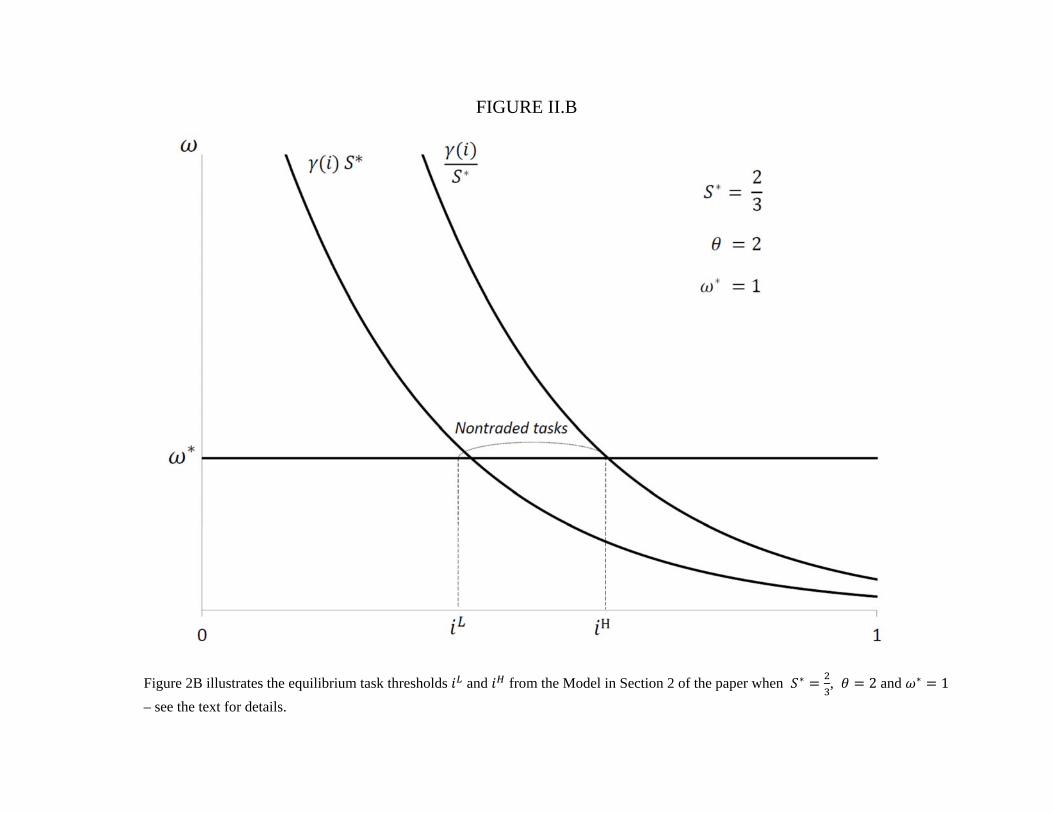
FIGURE II.B
Figure 2B illustrates the equilibrium task thresholds and from the Model in Section 2 of the paper when ∗ , 2 and ∗ 1
– see the text for details.

FIGURE III
Figure 3 is constructed to parallel Figure I of Autor, Levy and Murnane (2003). O*NET 1998 task measures by occupation are paired with data from the IPUMS 1980-2000 Censuses and the 2005-2013 American Community Survey samples. Consistent occupation codes for 1980-2012 are from Autor and Dorn (2013) and Autor and Price (2013). Data are aggregated to industry-education-sex cells by year, and each cell is assigned a value corresponding to its rank in the 1980 distribution of task input. Plotted values depict the employment-weighted mean of each assigned percentile in the indicated year. See the text and Appendix for details on the construction of O*NET task measures.
35
45
55
65
Mea
n T
ask
Inp
ut in
Pe
rce
ntile
s of
198
0 D
istr
ibu
tion
1980 1990 2000 2010
Nonroutine Analytical Social Skills Routine
Occupational Task Intensity based on 1998 O*NETSources: 1980-2000 Census, 2005-2013 ACS
Update of Autor, Levy, and Murnane (2003) Figure 1Worker Tasks in the U.S. Economy, 1980-2012

FIGURE IV
Each line plots 100 times the change in employment share – relative to a 1980 baseline - between 1990 and 2012 for occupations that are above and/or below the 50th percentile in nonroutine analytical and social skill task intensity as measured by the 1998 O*NET. Consistent occupation codes for 1980-2012 are updated from Autor and Dorn (2013) and Autor and Price (2013). See the text and Appendix for details on the construction of O*NET task measures and for examples of occupations in each of the four categories.
-.05
0.0
5
1980 1990 2000 2010
High Social, High Math High Social, Low Math
Low Social, High Math Low Social, Low Math
Occupational Task Intensities based on 1998 O*NETSources: 1980-2000 Census, 2005-2013 ACS
1980 to 2012Cumulative Changes in Employment Share by Occupation Task Intensity

FIGURE V
Each line plots the percent change in mean hourly wages – relative to a 1980 baseline and in constant 2012 dollars - between 1990 and 2012 for occupations that are above and/or below the 50th percentile in nonroutine analytical and social skill task intensity as measured by the 1998 O*NET. Consistent occupation codes for 1980-2012 are updated from Autor and Dorn (2013) and Autor and Price (2013). See the text and Appendix for details on the construction of O*NET task measures and for examples of occupations in each of the categories.
-.1
0.1
.2.3
1980 1990 2000 2010
High Social, High Math High Social, Low Math
Low Social, High Math Low Social, Low Math
Occupational Task Intensities based on 1998 O*NETSources: 1980-2000 Census, 2005-2013 ACS
1980 to 2012Cumulative Change in Real Hourly Wages by Occupation Task Intensity

TABLE I LABOR MARKET RETURNS TO COGNITIVE SKILLS AND SOCIAL SKILLS IN THE NLSY79
Outcome is Log Hourly Wage (in 2012 dollars) (1) (2) (3) (4) (5) (6) (7) Cognitive Skills (AQT, standardized) 0.206*** 0.206*** 0.189*** 0.126*** 0.190*** 0.126***
[0.007] [0.007] [0.007] [0.008] [0.007] [0.008] Social Skills (standardized) 0.107*** 0.055*** 0.049*** 0.043*** 0.029*** 0.044*** 0.029***
[0.006] [0.006] [0.006] [0.006] [0.006] [0.006] [0.006] Cognitive * Social 0.019*** 0.019*** 0.011* 0.017*** 0.010*
[0.006] [0.006] [0.006] [0.006] [0.006] Non‐cognitive Skills (standardized) 0.048*** 0.040*** 0.046*** 0.040***
[0.006] [0.006] [0.006] [0.006] Cognitive * Noncognitive 0.008 0.001
[0.006] [0.006] Demographics and Age / Year Fixed Effects X X X X X X Years of completed education X X R‐squared 0.300 0.343 0.344 0.347 0.359 0.347 0.359 Observations 126,251 126,251 126,251 126,191 126,191 126,191 126,191
Notes: Each column reports results from an estimate of equation (18) in the paper, with real log hourly wages as the outcome and person‐year as the unit of observation. The data source is the National Longitudinal Survey of Youth 1979 cohort (NLSY79). Cognitive skills are measured by each NLSY79 respondent's score on the Armed Forces Qualifying Test (AFQT), and are normalized to have a mean of zero and a standard deviation of one. I use the AFQT score crosswalk developed by Altonji, Bharadwaj and Lange (2012). Social skills is a standardized composite of four variables ‐ 1) sociability in childhood; 2) sociability in adulthood; 3) participation in high school clubs; and 4) participation in team sports ‐ see the text for details on construction of the social skills measure. My measure of "non‐cognitive" skills is the normalized average of the Rotter and Rosenberg scores in the NLSY. The regression also controls for race‐by‐gender indicator variables, age, year, census region, and urbanicity fixed effects ‐ plus additional controls as indicated. Standard errors are in brackets and clustered at the individual level. *** p<0.01, ** p<0.05, * p<0.10

TABLE II OCCUPATIONAL SORTING ON SKILLS IN THE NLSY79
Routine Social Skills Outcomes are O*NET Task Measures (1) (2) (3) (4)
Cognitive Skills (AQT, standardized) ‐0.055* 0.161*** 0.345*** ‐0.044**
[0.030] [0.032] [0.028] [0.019] Social Skills (standardized) ‐0.188*** ‐0.149*** 0.208*** 0.119***
[0.022] [0.024] [0.020] [0.014] Cognitive * Social ‐0.058*** ‐0.054** 0.014 0.013
[0.021] [0.023] [0.019] [0.014]
Demogs, Age / Year, Education Fixed Effects X X X X Controls for O*NET Cognitive Tasks X X Observations 133,599 133,599 133,599 133,599 R‐squared 0.204 0.237 0.305 0.668
Notes: Each column reports results from an estimate of equation (18) in the paper, with the indicated 1998 O*NET task intensity of an occupation as the outcome and person‐year as the unit of observation. The task measures are percentiles that range from 0 to 10 and are weighted by labor supply to conform to the 1980 occupation distribution. The additional O*NET cognitive task measures are Nonroutine Analytical, Number Facility, Inductive/Deductive Reasoning, and Analyze/Use Information. See the text and Appendix for details on the construction of each O*NET task measure. The data source is the National Longitudinal Survey of Youth 1979 cohort (NLSY79). Cognitive skills are measured by each NLSY79 respondent's score on the Armed Forces Qualifying Test (AFQT), and are normalized to have a mean of zero and a standard deviation of one. I use the AFQT score crosswalk developed by Altonji, Bharadwaj and Lange (2012). Social skills is a standardized composite of four variables ‐ 1) sociability in childhood; 2) sociability in adulthood; 3) participation in high school clubs; and 4) participation in team sports ‐ see the text for details on construction of the social skills measure. My measure of "non‐cognitive" skills is the normalized average of the Rotter and Rosenberg scores in the NLSY. The regression also controls for race‐by‐gender indicator variables, age, year, census region, and urbanicity fixed effects ‐ plus additional controls as indicated. Standard errors are in brackets and clustered at the individual level. *** p<0.01, ** p<0.05, * p<0.10

TABLE III RETURNS TO SKILLS BY OCCUPATION TASK INTENSITY IN THE NLSY79
Outcome is Log Hourly Wage (in 2012 dollars) (1) (2) (3) Routine Task Intensity 0.0136*** 0.0212***
[0.0012] [0.0014] Cognitive * Routine Task Intensity ‐0.0034*** 0.0005
[0.0013] [0.0015] Social Skills * Routine Task Intensity ‐0.0025** ‐0.0008
[0.0013] [0.0015] Cognitive * Social * Routine Task Intensity ‐0.0008 ‐0.0011
[0.0012] [0.0014] Social Skill Task Intensity 0.0039*** 0.0176***
[0.0013] [0.0016] Cognitive * Social Skill Task Intensity 0.0113*** 0.0112***
[0.0015] [0.0018] Social Skills * Social Skill Task Intensity 0.0050*** 0.0041**
[0.0015] [0.0018] Cognitive * Social * Social Skill Task Intensity 0.0021 0.0011
[0.0015] [0.0023] Worker Fixed Effects X X X Observations 126,251 126,251 126,251 Number of individuals 11,050 11,050 11,050
Notes: Each column reports results from an estimate of equation (19) in the paper, with real log hourly wages as the outcome and person‐year as the unit of observation. The data source is the National Longitudinal Survey of Youth 1979 cohort (NLSY79). Cognitive skills are measured by each NLSY79 respondent's score on the Armed Forces Qualifying Test (AFQT), and are normalized to have a mean of zero and a standard deviation of one. I use the AFQT score crosswalk developed by Altonji, Bharadwaj and Lange (2012). Social skills is a standardized composite of four variables ‐ 1) sociability in childhood; 2) sociability in adulthood; 3) participation in high school clubs; and 4) participation in team sports ‐ see the text for details on construction of the social skills measure. My measure of "non‐cognitive" skills is the normalized average of the Rotter and Rosenberg scores in the NLSY. All models control for worker fixed effects, age, year, census region, and urbanicity fixed effects ‐ plus additional controls as indicated. The interactions between cognitive/social skills and 1998 O*NET task intensities measure whether the returns to skills vary with the task content of the worker's occupation. The task measures are percentiles that range from 0 to 10 and are weighted by labor supply to conform to the 1980 occupation distribution. See the text and Appendix for details on the construction of each O*NET task measure. Standard errors are in brackets and clustered at the individual level. *** p<0.01, ** p<0.05, * p<0.10

TABLE IV LABOR MARKET RETURNS TO SKILLS IN THE NLSY79 VS. NLSY97
Full‐Time Employment Log Real Hourly Wage
(1) (2) (3) (4) (5) (6) Cognitive Skills (AQT, standardized) 0.068*** 0.042*** 0.040*** 0.203*** 0.129*** 0.116***
[0.003] [0.003] [0.003] [0.005] [0.006] [0.006] Cognitive Skills * NLSY97 0.008* 0.005 0.009* ‐0.052*** ‐0.061*** ‐0.045***
[0.004] [0.004] [0.005] [0.008] [0.008] [0.008] Social Skills (standardized) 0.007*** 0.005** 0.004* 0.020*** 0.015*** 0.011**
[0.002] [0.002] [0.002] [0.004] [0.004] [0.004] Social Skills * NLSY97 0.023*** 0.021*** 0.019*** 0.017** 0.019** 0.016**
[0.004] [0.004] [0.004] [0.008] [0.008] [0.008] Cognitive * Social ‐0.007*** ‐0.006** ‐0.007** 0.006 0.003 0.002
[0.003] [0.003] [0.003] [0.004] [0.004] [0.004] Cognitive * Social * NLSY97 ‐0.006 ‐0.006 ‐0.006 ‐0.004 ‐0.004 ‐0.002
[0.004] [0.004] [0.004] [0.008] [0.008] [0.008] Non‐cognitive Skills (standardized) 0.008** 0.041***
[0.003] [0.005] Non‐cognitive Skills * NLSY97 0.013*** 0.016*
[0.005] [0.009] Demographics and Age / Year FE X X X X X X Years of completed education X X X X R‐squared 0.081 0.096 0.097 0.309 0.333 0.337 Observations 104,613 104,252 104,206 77,845 77,631 77,599
Notes: Each column reports results from an estimate of equation (20) in the paper, with an indicator for being employed full‐time as the outcome in Columns 1 through 3, real log hourly wages as the outcome in Columns 4 through 6, and person‐year as the unit of observation. The data are a pooled sample of two cohorts of youth ‐ the National Longitudinal Survey of Youth 1979 (NLSY79) and 1997 (NLSY97) waves. I restrict the age range to 25‐33, which allows for a comparison of NLSY respondents at similar ages across survey waves. Cognitive skills are measured by each NLSY respondent's score on the Armed Forces Qualifying Test (AFQT), and are normalized to have a mean of zero and a standard deviation of one. I use the AFQT score crosswalk developed by Altonji, Bharadwaj and Lange (2012) which adjusts for differences across survey waves in age‐at‐test and test format. Social skills is a standardized composite of two variables that measure extraversion in both the NLSY79 (sociability in childhood and sociability in adulthood) and in the NLSY97 (two items from the Big 5 personality inventory that measure extraversion). The "non‐cognitive" skill measures are a normalized average of the Rotter and Rosenberg scores in the NLSY79, and two items from the NLSY97 that measure the Big 5 personality factor Conscientiousness. The regression also controls for an indicator for whether the respondent was in the NLSY97 wave, race‐by‐gender indicator variables, age, year, census region, and urbanicity fixed effects ‐ plus additional controls as indicated. Standard errors are in brackets and clustered at the individual level. *** p<0.01, ** p<0.05, * p<0.10

TABLE V RETURNS TO SKILLS BY OCCUPATION TASK INTENSITY IN THE NLSY79 VS. NLSY97
Outcome is Log Hourly Wage (in 2012 dollars) (1) (2) (3) (4) Social Skill Task Intensity 0.0004 ‐0.0096*** ‐0.0095*** ‐0.0096***
[0.0013] [0.0015] [0.0015] [0.0015] Social Skill Task Intensity * NLSY97 0.0210*** 0.0253*** 0.0217*** 0.0225***
[0.0036] [0.0041] [0.0040] [0.0040] Math Task Intensity 0.0175*** 0.0177*** 0.0177***
[0.0015] [0.0015] [0.0015] Math Task Intensity * NLSY97 ‐0.0082** ‐0.0085** ‐0.0099***
[0.0035] [0.0034] [0.0034] Cognitive Skill * Social Skill Task Intensity 0.0069*** 0.0074***
[0.0013] [0.0016] Cognitive Skill * Social Skill Task Intensity * NLSY97 0.0114*** 0.0047
[0.0036] [0.0044] Social Skill * Social Skill Task Intensity 0.00008 0.0011
[0.0013] [0.0016] Social Skill * Social Skill Task Intensity * NLSY97 0.0040 0.0069*
[0.0032] [0.0038] P (Social Skill * Social Skill Intensity in NLSY97 >0) 0.108 0.023 P (All Skills * Social Skill Intensity in NLSY97 >0) 0.000 0.001 P (All Skills in NLSY97 > All Skills in NLSY79) 0.000 Observations 77,845 77,845 77,845 77,845 Number of individuals 14,998 14,998 14,998 14,998
Notes: Each column reports results from an estimate of equation (21) in the paper, with real log hourly wages as the outcome and person‐year as the unit of observation. The data are a pooled sample of two cohorts of youth ‐ the National Longitudinal Survey of Youth 1979 (NLSY79) and 1997 (NLSY97) waves. I restrict the age range to 25‐33, which allows for a comparison of NLSY respondents at similar ages across survey waves. Cognitive skills are measured by each NLSY respondent's score on the Armed Forces Qualifying Test (AFQT), and are normalized to have a mean of zero and a standard deviation of one. I use the AFQT score crosswalk developed by Altonji, Bharadwaj and Lange (2012) which adjusts for differences across survey waves in age‐at‐test and test format. Social skills is a standardized composite of two variables that measure extraversion in both the NLSY79 (sociability in childhood and sociability in adulthood) and in the NLSY97 (two items from the Big 5 personality inventory that measure extraversion). The regression also controls for age, year, census region, and urbanicity fixed effects ‐ plus additional controls as indicated. The interactions between cognitive/social skills and 1998 O*NET task intensities measure whether the returns to skills vary with the task content of the worker's occupation. The task measures are percentiles that range from 0 to 10 and are weighted by labor supply to conform to the 1980 occupation distribution. See the text and Appendix for details on the construction of each O*NET task measure. Standard errors are in brackets and clustered at the individual level. *** p<0.01, ** p<0.05, * p<0.10