Embed Size (px)
Citation preview
This article appeared in a journal published by Elsevier. The attached copy is furnished to the author for internal non-commercial research and educational
use, including for instruction at the author’s institution and sharing with colleagues.
Other uses, including reproduction and distribution, or selling or licensing copies, or posting to personal, institutional or third party websites are
prohibited.
In most cases authors are permitted to post their version of the article (e.g. in Word or Tex form) to their personal website or institutional repository. Authors
requiring further information regarding Elsevier’s archiving and manuscript policies are encouraged to visit:
http://www.elsevier.com/copyright
Journal of Hydrology 498 (2013) 191–209
AUTHOR'S PERSONAL COPY
Contents lists available at SciVerse ScienceDirect
Journal of Hydrology
journal homepage: www.elsevier .com/ locate / jhydrol
The groundwater recharge response and hydrologic services of tropicalhumid forest ecosystems to use and reforestation: Support for the‘‘infiltration-evapotranspiration trade-off hypothesis’’
0022-1694/$ - see front matter � 2013 Elsevier B.V. All rights reserved.http://dx.doi.org/10.1016/j.jhydrol.2013.06.034
⇑ Corresponding author. Tel.: +91 80 23635555x209; fax: +91 80 23530070.E-mail address: [email protected] (J. Krishnaswamy).
Jagdish Krishnaswamy a,⇑, Michael Bonell b, Basappa Venkatesh c, Bekal K. Purandara c, K.N. Rakesh a,Sharachchandra Lele a, M.C. Kiran a, Veerabasawant Reddy d, Shrinivas Badiger a
a Ashoka Trust for Research in Ecology and the Environment (ATREE), Royal Enclave, Sriramapura, Jakkur Post, Bangalore 560 064, Indiab The Centre for Water Law, Water Policy and Science under the auspices of UNESCO, University of Dundee, Dundee DD1 4HN, Scotland, UKc Hard Rock Regional Centre, National Institute of Hydrology, Belgaum, Karnataka 590 001, Indiad TERI, WRC, H. No. 233/GH-2, Vasudha Housing Colony, Alto Santa Cruz, Bambolim, Goa 403 202, India
a r t i c l e i n f o s u m m a r y
Article history:Received 8 October 2012Received in revised form 7 June 2013Accepted 19 June 2013Available online 27 June 2013This manuscript was handled byKonstantine P. Georgakakos, Editor-in-Chief,with the assistance of Matthew Rodell,Associate Editor
Keywords:InfiltrationEvapotranspirationGroundwater rechargeWestern GhatsHydrologic servicesTropical forests
The hydrologic effects of forest use and reforestation of degraded lands in the humid tropics has impli-cations for local and regional hydrologic services but such issues have been relatively less studied whencompared to the impacts of forest conversion. In particular, the ‘‘infiltration-evapotranspiration trade-off’’hypothesis which predicts a net gain or loss to baseflow and dry-season flow under both, forest degrada-tion or reforestation depending on conditions has not been tested adequately. In the Western Ghats ofIndia, we examined the hydrologic responses and groundwater recharge and hydrologic services linkedwith three ecosystems, (1) remnant tropical evergreen forest (NF), (2) heavily-used former evergreen for-est which now has been converted to tree savanna, known as degraded forest(DF), and (3) exotic Acaciaplantations (AC, Acacia auriculiformis) on degraded former forest land. Instrumented catchments rangingfrom 7 to 23 ha representing these three land-covers (3 NF, 4 AC and 4 DF, in total 11 basins), were estab-lished and maintained between 2003 and 2005 at three sites in two geomorphological zones, Coastal andUp-Ghat (Malnaad). Four larger (1–2 km2) catchments downstream of the head-water catchments in theMalnaad with varying proportions of different land-cover and providing irrigation water for areca-nutand paddy rice were also measured for post-monsoon baseflow. Daily hydrological and climate datawas available at all the sites. In addition, 36 min data was available at the Coastal site for 41 days as partof the opening phase of the summer monsoon, June–July 2005.
Low potential and actual evapotranspiration rates during the monsoon that are similar across all land-cover ensures that the main control on the extent of groundwater recharge during the south-west mon-soon is the proportion of rainfall that is converted into quick flow rather than differences in evapotrans-piration between the different land cover types. The Flow duration curves demonstrated a higherfrequency and longer duration of low flows under NF when compared to the other more disturbed landcovers in both the Coastal and Malnaad basins. Groundwater recharge estimated using water balanceduring the wet-season in the Coastal basins under NF, AC and DF was estimated to be 50%, 46% and35% respectively and in the Malnaad it was 61%, 55% and 36% respectively. Soil Water Infiltration andMovement (SWIM) based recharge estimates also support the pattern (46% in NF; 39% in AC and 14%in DF). Furey–Gupta filter based estimates associated with the Coastal basins also suggest similar ground-water recharge values and trends across the respective land-covers: 69% in NF, 49% in AC, and 42% in DF.Soil water potential profiles using zero flux plane methods suggest that during the dry-season, naturalforests depend on deep soil moisture and groundwater. Catchments with higher proportion of forestcover upstream were observed to sustain flow longer into the dry-season. These hydrologic responsesprovide some support towards the ‘‘infiltration-evapotranspiration trade-off’’ hypothesis in which differ-ences in infiltration between land-cover rather than evapotranspiration determines the differences ingroundwater recharge, low flows and dry-season flow. Groundwater recharge is the most temporally sta-ble under natural forest, although substantial recharge occurs under all three ecosystems, which helps to
192 J. Krishnaswamy et al. / Journal of Hydrology 498 (2013) 191–209
AUTHOR'S PERSONAL COPY
sustain dry-season flow downstream in higher order streams that sustain local communities and agro-ecosystems. In addition to spatial scale effects, greater attention also needs to be given to the role ofhydrogeology within the context of the above hypothesis and its implications for hydrologic services.
� 2013 Elsevier B.V. All rights reserved.
1. Introduction
Land use and land cover change profoundly transformed terres-trial hydrological budgets and processes (Vorosmarty and Saha-gian, 2000; Stonestrom et al., 2009). Although the effects occur atmultiple spatial scales from local (small basins) to global, the scaleat which local communities and land-use managers are affected isof special concern as decision making on ecosystem services, espe-cially hydrologic services is often at this scale (<10 km2). In tropicallandscapes where land-cover and land-use change have been rapidand complex, this issue is of particular interest (Turner et al.,1994). One of the important paradigms that was dominant formuch of the 20th century in local scale terrestrial hydrology, andsupported by observed and experimental data, is the relationshipbetween accumulation of forest biomass and decrease in streamflow as a result of increased evapotranspiration, or vice versa, inthe case of loss of forest cover (Bosch and Hewlett, 1982; Brownet al., 2005). However, based on emerging evidence to the contrary,especially from the tropics, Bruijnzeel (1989, 2004) proposed the‘‘infiltration-evapotranspiration trade-off hypothesis’’. Part of thishypothesis states that under certain conditions of land-cover andland-use change in the seasonal tropics, a degraded forest’s abilityto allow sufficient infiltration may be impaired to such an extentthat the effects on delayed flow or dry-season flow would be det-rimental, even after accounting for gains from reduced evapotrans-piration. Recent work in the Andes mountains of Columbia by Roa-García et al. (2011) put forward some of the first evidence in sup-port of the Infiltration- Evapotranspiration ‘trade-off’ hypothesisbased on a comparative basin study (0.6–1.7 km2), albeit involvingvolcanic ash deposits i.e., Andisols, that are vastly different thanthe soils in the Western Ghats. Roa-García et al. (2011) noted inparticular that their stream flow frequency–duration curves (FDCs)highlighted that the basin with highest forest cover (68%) showedthe smallest reduction in flow during the dry season. Moreover thehighest low flows were maintained during the dry season from thisforest-dominated basin in contrast to a grassland dominated basin.In addition, soil moisture release curves undertaken in that studyshowed that the natural forests has a larger capacity to store andrelease soil moisture in comparison to the grassland. These writersthus concluded that the preceding two findings support the ‘‘infil-tration-evapotranspiration trade-off’’ hypothesis for tropical envi-ronments (for) soils that are subject to compaction (such ashighly grazed grasslands) have a reduced rainfall infiltration,which impairs the maintenance of baseflows.’’ (Roa-García et al.,2011, p.11).
In formerly forested regions in the humid tropics, notably inthe more densely populated regions of south and south–eastAsia such as the Western Ghats of India, major land-coverchanges have occurred at a century time scale. The latter haveincluded permanent deforestation and conversion to a varietyof agro-forestry and agro-ecosystems, regrowth as well as refor-estation. Consequently there is a particular need for decisionmakers and policy makers to have information from hydrologicalstudies that address the fundamental processes associated withsuch land cover changes. Over 100 million people depend onsurface water sources in streams and rivers that emanate fromthe Western Ghats. Further this region is a major repository ofcarbon in its forests and soils (Seen et al., 2010) and is a global
biodiversity hotspot (Das et al., 2006). In an era where variousecosystem services are being recognized and valued, it is essen-tial for ecological economists, policy and decision makers to beaware of the synergies and trade-offs between various regulatoryand provisioning services (Elmqvist et al., 2010). Thus an inves-tigation of the hydrological effects of specific land-cover changesis a high priority (DeFries and Eshleman, 2004).
1.1. Relevant previous work in the study area
In previous work, we established that the soil hydraulic proper-ties (notably field, saturated hydraulic conductivity (Bouwer,1966)), Kfs, in the tropical, humid Western Ghats can be signifi-cantly altered from land-cover change up to a century time scalefrom forest conversion or degradation. The enhanced occurrenceof infiltration-excess overland flow (IOF) was inferred (and thus re-duced vertical percolation and groundwater recharge) when com-paring selected rainfall intensity–duration–frequency with Kfs
across both various land covers and soil types. Such changes aresufficient to allow the hill slope hydrology aspects of the infiltra-tion-evapotranspiration trade-off hypothesis to be realized (Bonellet al., 2010).
Later work using experimental catchments also showed howland-cover change from native forest to heavily used forest andits subsequent reforestation have major effects on the rain-runoffprocess in the wet-season (Krishnaswamy et al., 2012). Theyshowed the highest proportions of rain converted to runoff beingassociated with the degraded forests whereas the natural forestsshowed the lowest runoff yields. Using stream hydrograph separa-tion, they also reported much higher quick flow volumes from de-graded forest and reforested, former degraded land in the form ofAcacia auriculiformes plantations when compared to the less dis-turbed natural forest. Furthermore, time series analysis showedmuch shorter rainfall-runoff time lags for the degraded forestand Acacia auriculiformes plantations when compared to naturalforest. This characteristic of a faster rainfall-runoff responsivenesssupports the notion of the frequent occurrence of IOF within theformer two, more human-impacted land covers. Pertinent to thecurrent work, the data in Krishnaswamy et al., 2012, clearly indi-cates that even assuming the maximum measured annual evapo-transpiration (AET) for humid forests globally (�1500 mm, Kumeet al., 2011), the estimated water available for recharge from natu-ral forest catchments annually after accounting for both measuredrunoff and AET was 259 mm (rainfall of 2252 mm) and 978 mm(rainfall of 4016 mm). Thus we concluded from the earlier workthat (i) a significant amount of rainfall was potentially availablefor recharge to groundwater and for downstream baseflow anddry-season flow, (ii) deeper subsurface water or groundwater ofpossible large capacity, had a significant role in the storm runoffgeneration process and (iii) the continuation of a secondary, longerrainfall-runoff time lag in the intensely, disturbed land covers indi-cated that there was a retention of ‘memory’ of the previous natu-ral forest response.
In the current study, the more detailed aspects of the wet anddry season flows and the water balances of these same catchmentswere investigated in relation to modelled evapotranspiration, andthus the provision of various estimates of recharge to groundwater.
J. Krishnaswamy et al. / Journal of Hydrology 498 (2013) 191–209 193
AUTHOR'S PERSONAL COPY
2. Objectives
We will attempt to test the ‘‘infiltration-evapotranspirationtrade-off’’ hypothesis in the humid Western Ghats by quantifyingthe groundwater recharge and low flow characteristics compo-nents within 11 experimental basins in the Upghat (Malnaad)and Coastal regions across three land covers (Natural Forest, De-graded Forest, Acacia Plantations) within Uttara Kannada. In theabsence of detailed process hydrology information, we will useseveral approaches to evaluate if there is a consistency in the inter-pretation of the results. The techniques used are as follows:
� The development of basin frequency–duration–curves (FDC).� The use of basin water balances in the wet season.� The application of the Furey–Gupta (2001) filter hydrograph
model.� An evaluation of soil water hydraulic potentials in the
absence of rainfall and thus confined to dry season only incombination with the application of the zero flux plane(ZFP) method.
� Finally, a brief assessment of the scale issue and downstreamdry-season river flow will be subsequently considered.
3. Study area
3.1. Landscape, soils, geology and hydrogeology
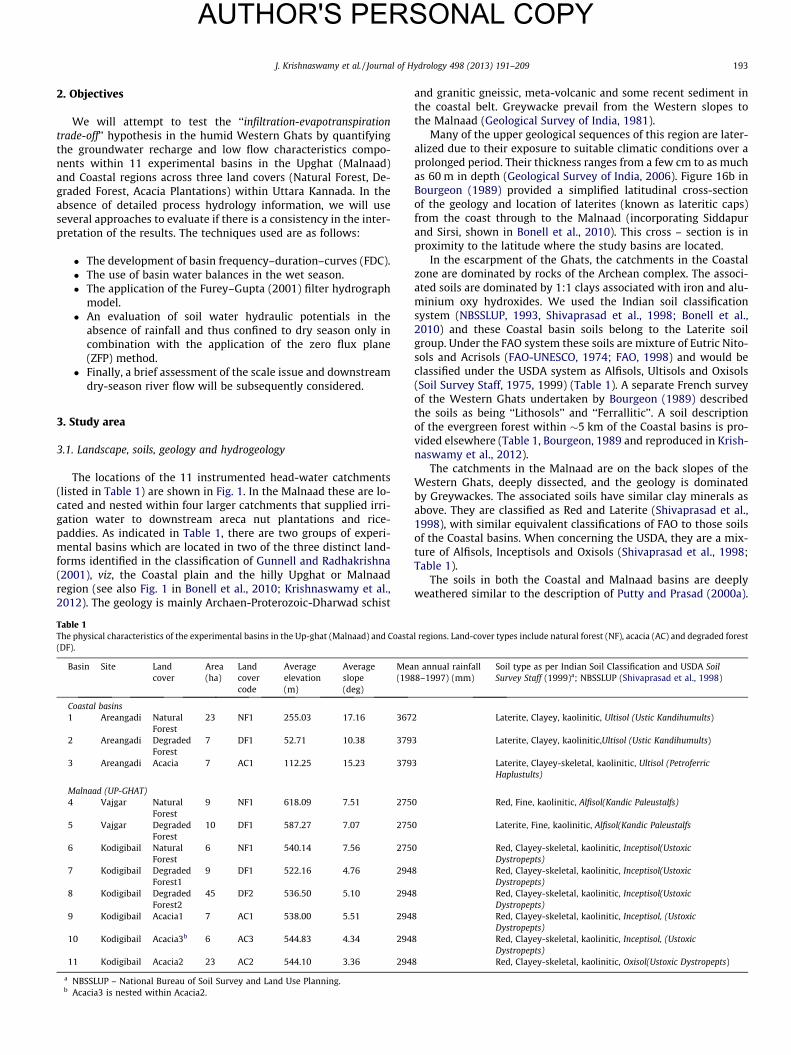
The locations of the 11 instrumented head-water catchments(listed in Table 1) are shown in Fig. 1. In the Malnaad these are lo-cated and nested within four larger catchments that supplied irri-gation water to downstream areca nut plantations and rice-paddies. As indicated in Table 1, there are two groups of experi-mental basins which are located in two of the three distinct land-forms identified in the classification of Gunnell and Radhakrishna(2001), viz, the Coastal plain and the hilly Upghat or Malnaadregion (see also Fig. 1 in Bonell et al., 2010; Krishnaswamy et al.,2012). The geology is mainly Archaen-Proterozoic-Dharwad schist
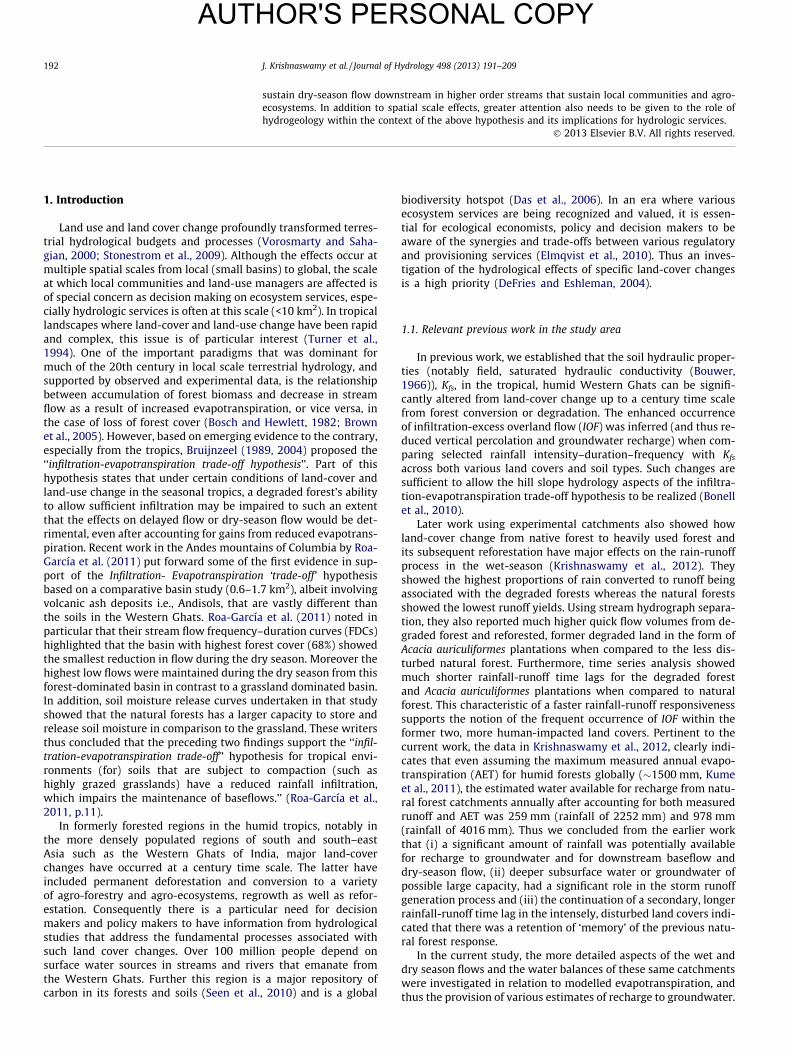
Table 1The physical characteristics of the experimental basins in the Up-ghat (Malnaad) and Coasta(DF).
Basin Site Landcover
Area(ha)
Landcovercode
Averageelevation(m)
Averageslope(deg)
Mea(198
Coastal basins1 Areangadi Natural
Forest23 NF1 255.03 17.16 367
2 Areangadi DegradedForest
7 DF1 52.71 10.38 379
3 Areangadi Acacia 7 AC1 112.25 15.23 379
Malnaad (UP-GHAT)4 Vajgar Natural
Forest9 NF1 618.09 7.51 275
5 Vajgar DegradedForest
10 DF1 587.27 7.07 275
6 Kodigibail NaturalForest
6 NF1 540.14 7.56 275
7 Kodigibail DegradedForest1
9 DF1 522.16 4.76 294
8 Kodigibail DegradedForest2
45 DF2 536.50 5.10 294
9 Kodigibail Acacia1 7 AC1 538.00 5.51 294
10 Kodigibail Acacia3b 6 AC3 544.83 4.34 294
11 Kodigibail Acacia2 23 AC2 544.10 3.36 294
a NBSSLUP – National Bureau of Soil Survey and Land Use Planning.b Acacia3 is nested within Acacia2.
and granitic gneissic, meta-volcanic and some recent sediment inthe coastal belt. Greywacke prevail from the Western slopes tothe Malnaad (Geological Survey of India, 1981).
Many of the upper geological sequences of this region are later-alized due to their exposure to suitable climatic conditions over aprolonged period. Their thickness ranges from a few cm to as muchas 60 m in depth (Geological Survey of India, 2006). Figure 16b inBourgeon (1989) provided a simplified latitudinal cross-sectionof the geology and location of laterites (known as lateritic caps)from the coast through to the Malnaad (incorporating Siddapurand Sirsi, shown in Bonell et al., 2010). This cross – section is inproximity to the latitude where the study basins are located.
In the escarpment of the Ghats, the catchments in the Coastalzone are dominated by rocks of the Archean complex. The associ-ated soils are dominated by 1:1 clays associated with iron and alu-minium oxy hydroxides. We used the Indian soil classificationsystem (NBSSLUP, 1993, Shivaprasad et al., 1998; Bonell et al.,2010) and these Coastal basin soils belong to the Laterite soilgroup. Under the FAO system these soils are mixture of Eutric Nito-sols and Acrisols (FAO-UNESCO, 1974; FAO, 1998) and would beclassified under the USDA system as Alfisols, Ultisols and Oxisols(Soil Survey Staff, 1975, 1999) (Table 1). A separate French surveyof the Western Ghats undertaken by Bourgeon (1989) describedthe soils as being ‘‘Lithosols’’ and ‘‘Ferrallitic’’. A soil descriptionof the evergreen forest within �5 km of the Coastal basins is pro-vided elsewhere (Table 1, Bourgeon, 1989 and reproduced in Krish-naswamy et al., 2012).
The catchments in the Malnaad are on the back slopes of theWestern Ghats, deeply dissected, and the geology is dominatedby Greywackes. The associated soils have similar clay minerals asabove. They are classified as Red and Laterite (Shivaprasad et al.,1998), with similar equivalent classifications of FAO to those soilsof the Coastal basins. When concerning the USDA, they are a mix-ture of Alfisols, Inceptisols and Oxisols (Shivaprasad et al., 1998;Table 1).
The soils in both the Coastal and Malnaad basins are deeplyweathered similar to the description of Putty and Prasad (2000a).
l regions. Land-cover types include natural forest (NF), acacia (AC) and degraded forest
n annual rainfall8–1997) (mm)
Soil type as per Indian Soil Classification and USDA SoilSurvey Staff (1999)a; NBSSLUP (Shivaprasad et al., 1998)
2 Laterite, Clayey, kaolinitic, Ultisol (Ustic Kandihumults)
3 Laterite, Clayey, kaolinitic,Ultisol (Ustic Kandihumults)
3 Laterite, Clayey-skeletal, kaolinitic, Ultisol (PetroferricHaplustults)
0 Red, Fine, kaolinitic, Alfisol(Kandic Paleustalfs)
0 Laterite, Fine, kaolinitic, Alfisol(Kandic Paleustalfs
0 Red, Clayey-skeletal, kaolinitic, Inceptisol(UstoxicDystropepts)
8 Red, Clayey-skeletal, kaolinitic, Inceptisol(UstoxicDystropepts)
8 Red, Clayey-skeletal, kaolinitic, Inceptisol(UstoxicDystropepts)
8 Red, Clayey-skeletal, kaolinitic, Inceptisol, (UstoxicDystropepts)
8 Red, Clayey-skeletal, kaolinitic, Inceptisol, (UstoxicDystropepts)
8 Red, Clayey-skeletal, kaolinitic, Oxisol(Ustoxic Dystropepts)
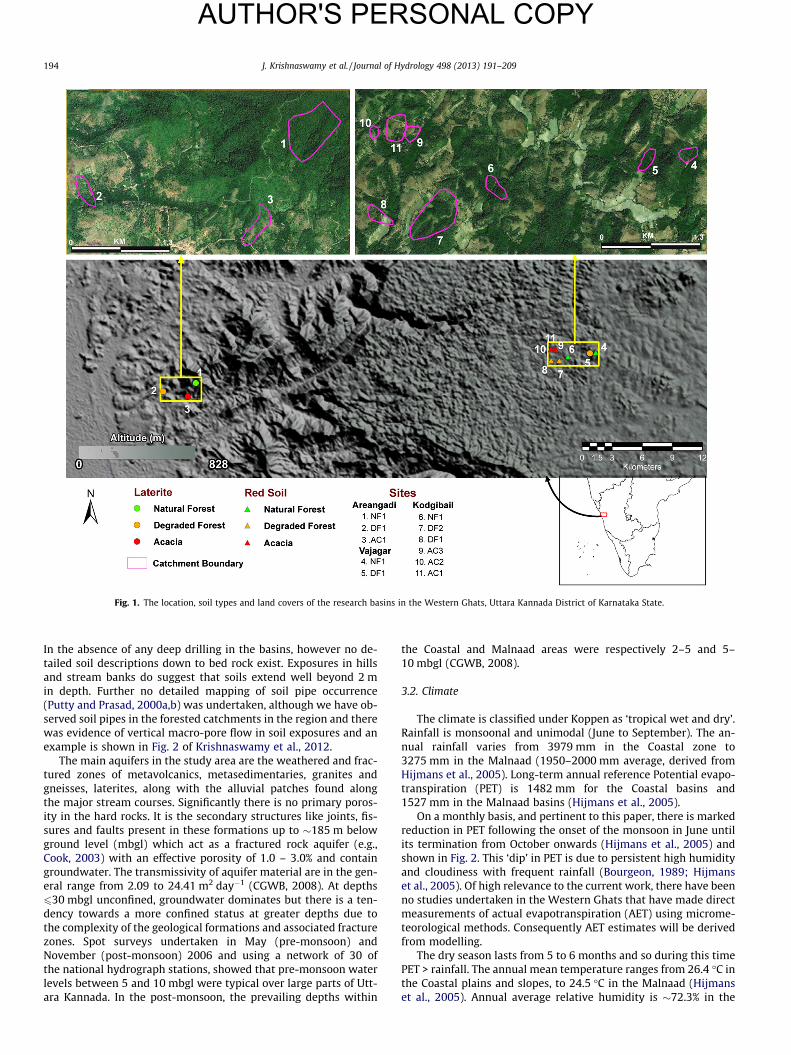
Fig. 1. The location, soil types and land covers of the research basins in the Western Ghats, Uttara Kannada District of Karnataka State.
194 J. Krishnaswamy et al. / Journal of Hydrology 498 (2013) 191–209
AUTHOR'S PERSONAL COPY
In the absence of any deep drilling in the basins, however no de-tailed soil descriptions down to bed rock exist. Exposures in hillsand stream banks do suggest that soils extend well beyond 2 min depth. Further no detailed mapping of soil pipe occurrence(Putty and Prasad, 2000a,b) was undertaken, although we have ob-served soil pipes in the forested catchments in the region and therewas evidence of vertical macro-pore flow in soil exposures and anexample is shown in Fig. 2 of Krishnaswamy et al., 2012.
The main aquifers in the study area are the weathered and frac-tured zones of metavolcanics, metasedimentaries, granites andgneisses, laterites, along with the alluvial patches found alongthe major stream courses. Significantly there is no primary poros-ity in the hard rocks. It is the secondary structures like joints, fis-sures and faults present in these formations up to �185 m belowground level (mbgl) which act as a fractured rock aquifer (e.g.,Cook, 2003) with an effective porosity of 1.0 – 3.0% and containgroundwater. The transmissivity of aquifer material are in the gen-eral range from 2.09 to 24.41 m2 day�1 (CGWB, 2008). At depths630 mbgl unconfined, groundwater dominates but there is a ten-dency towards a more confined status at greater depths due tothe complexity of the geological formations and associated fracturezones. Spot surveys undertaken in May (pre-monsoon) andNovember (post-monsoon) 2006 and using a network of 30 ofthe national hydrograph stations, showed that pre-monsoon waterlevels between 5 and 10 mbgl were typical over large parts of Utt-ara Kannada. In the post-monsoon, the prevailing depths within
the Coastal and Malnaad areas were respectively 2–5 and 5–10 mbgl (CGWB, 2008).
3.2. Climate
The climate is classified under Koppen as ‘tropical wet and dry’.Rainfall is monsoonal and unimodal (June to September). The an-nual rainfall varies from 3979 mm in the Coastal zone to3275 mm in the Malnaad (1950–2000 mm average, derived fromHijmans et al., 2005). Long-term annual reference Potential evapo-transpiration (PET) is 1482 mm for the Coastal basins and1527 mm in the Malnaad basins (Hijmans et al., 2005).
On a monthly basis, and pertinent to this paper, there is markedreduction in PET following the onset of the monsoon in June untilits termination from October onwards (Hijmans et al., 2005) andshown in Fig. 2. This ‘dip’ in PET is due to persistent high humidityand cloudiness with frequent rainfall (Bourgeon, 1989; Hijmanset al., 2005). Of high relevance to the current work, there have beenno studies undertaken in the Western Ghats that have made directmeasurements of actual evapotranspiration (AET) using microme-teorological methods. Consequently AET estimates will be derivedfrom modelling.
The dry season lasts from 5 to 6 months and so during this timePET > rainfall. The annual mean temperature ranges from 26.4 �C inthe Coastal plains and slopes, to 24.5 �C in the Malnaad (Hijmanset al., 2005). Annual average relative humidity is �72.3% in the
Fig. 2. Time series of rainfall and Potential evapotranspiration, PET for the Coastal and Malnaad (Up-Ghat) sites (after Hijmans et al., 2005).
J. Krishnaswamy et al. / Journal of Hydrology 498 (2013) 191–209 195
AUTHOR'S PERSONAL COPY
Coastal basins and 70% on the Malnaad slopes (1960–1990, Newet al., 1999).
Maximum rainfall intensities for a duration of 15 min across thestudy area range from 50 mm h�1 (1 in 1 year) to 130 mm h�1 (1 in50 year) (Bonell et al., 2010). Overall these short-term rainfallintensities are comparatively low by global standards for the hu-mid tropics (Bonell et al., 2004). On the other hand, the long dura-tion of rain events (often over several days) ensures very highprecipitation totals (Putty and Prasad, 2000a,b) and the latterwas also shown in Krishnaswamy et al. (2012).
3.3. Vegetation and land-cover/land-use
The natural and modified vegetation of the study area is highlydiverse in response to the equally complex geology, geomorphol-ogy and climate of the Western Ghats. Based on criteria such asphysiognomy, phenology and floristic composition, the vegetationof the study area is classified principally as evergreen and semi-evergreen which are two of the five major floristic types identifiedwithin several detailed studies of the region (Pascal, 1982, 1984,1986, 1988; Ramesh and Pascal, 1997; Ramesh and Swaminath,1999). Within the framework of a highly fragmented land coverand land use system (Blanchart and Julka, 1997; Menon and Bawa,1998; Pomeroy et al., 2003; Pontius and Pacheco, 2004; Seen et al.,2010), there are typically three principal stable patterns of land useand management, viz:
� Less disturbed, dense forest (referred to also as Natural Forest,NF, or Forest) which has resulted from a limited extractionregime, and is commonly associated with Reserve Forestpatches.� Dominantly tree savannas (Degraded Forest, DF, or Degraded)
that result from intense harvest of fuel wood, leaf and littermanure and grass, as well as intermittent fires (Rai, 2004; Priyaet al., 2007). These tree savannas were previously occupied bymostly evergreen and semi-evergreen forest prior to severe dis-turbance over decadal to century time scales. The specie com-
position, tree density and basal area of this land coverhowever can be highly variable between first-order basins(see Table 1).� Exotic Acacia auriculiformes plantations planted since 1980
(Acacia, AC) that are part of the ‘forestation’ programme of theKarnataka Forest Department (Rai, 1999). Typically these plan-tations have replaced grazing land, or highly degraded forestland, some of which have become barren land. The initial sur-vival of the AC plantings has been ensured through fencingand guarding. The ages of AC plantations in the study basinsranged from to 7 to 12 years at the time of the hydrological datacollection (Krishnaswamy et al., 2012). Historically, peoplewould have used and occupied the more accessible sites, whichare currently under ‘‘degraded’’ forests or are under ‘‘restora-tion’’ through establishment of tree plantations.
Detailed description of the dominant vegetation types in theexperimental basins are given elsewhere (Krishnaswamy et al.,2012). It should be noted that the Acacia plantations are not whollymonoculture but do incorporate a few other species. One of theAcacia basins (Kodigibail, Acacia 3 in Table 1) is nested within an-other (i.e. Acacia 2) and the latter basin also includes someagriculture.
In the Malnaad the head-water basins are nested within moreheterogeneous catchments that supply water to local communitiesand provide irrigation water to areca nut plantations, home gar-dens, orchards and rice paddies.
3.4. Tree root depths
Krishnaswamy et al. (2012) summarised knowledge of tree rootpatterns in the study area. Roots extend well beyond 2 m depth un-der the Natural Forest. For the young Acacia plantations most rootswere located at <1.5 m depth and are known to be more denselyconcentrated between 0.3 and 1.0 m (Kallarackal and Somen,2008). Depth of roots under the Degraded Forest were more vary-ing, but mostly <0.6 m, depth due to the more extensive low
196 J. Krishnaswamy et al. / Journal of Hydrology 498 (2013) 191–209
AUTHOR'S PERSONAL COPY
herbaceous cover (dominated by grass species) in between the sur-viving trees.
3.5. The experimental basins
Krishnaswamy et al. (2012) provided details of the experimen-tal basins. In summary, the complex mosaic of land use in thestudy area resulted in most basins having small areas (610 ha) toensure as close as possible ‘homogeneity’ in land cover for each ba-sin. Moreover the sub-soil field, saturated hydraulic conductivity,Kfs down to 1.5 m depth is comparatively permeable (in excess of10 mm h�1) when compared to other reports elsewhere in similarsoil groups (Bonell et al., 2010; Krishnaswamy et al., 2012). Thiscombination of a marked concentration of rainfall in few months,small basin areas, comparatively permeable sub-soils and a fis-sured hydrogeology results in most of the study basins havingintermittent flow regimes (i.e., no perennial flow). Streamflow ter-minates after the end of the monsoon at different times withineach basin and will be later considered in this paper and the re-charge during the monsoon at smaller scales aggregates and con-tributes to baseflow in higher order perennial streams.
4. Methods
4.1. Rainfall-runoff
Stream discharge in each of the 11 catchments (Table 1) wasmeasured using either weirs or stage-velocity-discharge methods.In addition all catchments in the Coastal zone (Areangadi, Table 1)were instrumented with staff gauge, mechanical water-levelrecorders and a self-recording rain gauge. As these three basinswere spatially close together, the same data from the one self-recording rain gauge was used. In the Malnaad group, rainfalland runoff data were collected daily supported by additional man-ual measurements of stream stage taken up to four times a day.
In summary, daily rainfall and stream discharge data for theyears 2003, 2004 and 2005 are available for the Kodigibail andVajagar catchments in the Upghat (Malnaad), and for 2004–2005
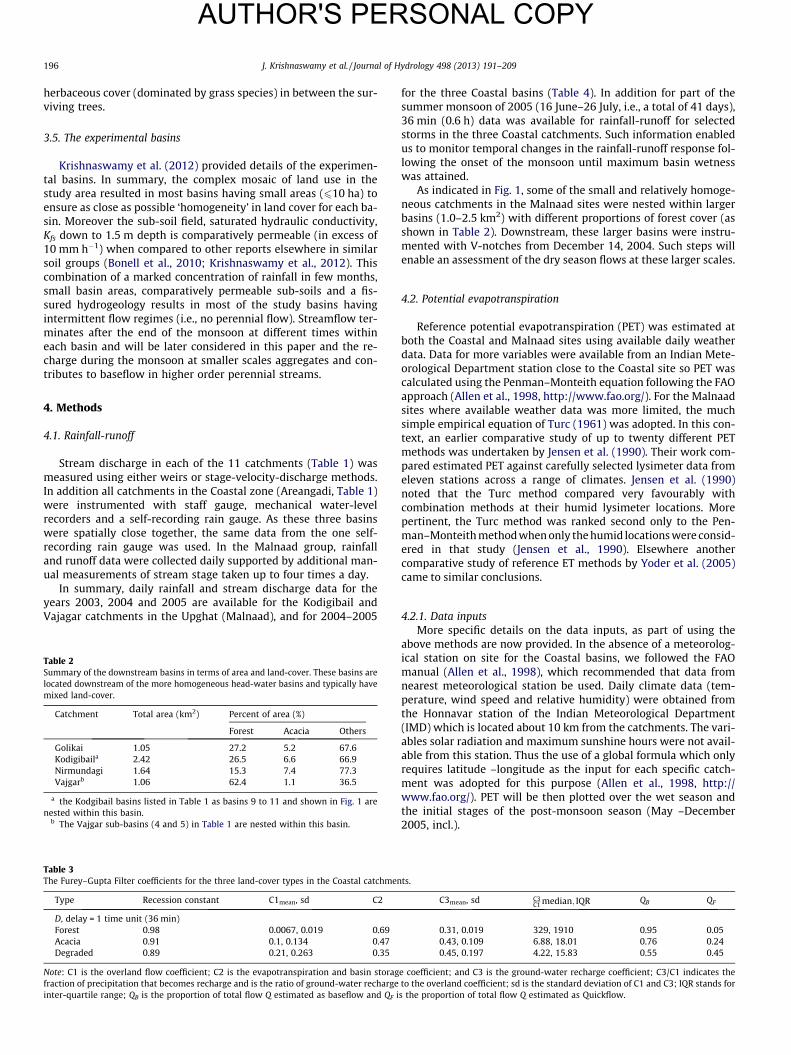
Table 2Summary of the downstream basins in terms of area and land-cover. These basins arelocated downstream of the more homogeneous head-water basins and typically havemixed land-cover.
Catchment Total area (km2) Percent of area (%)
Forest Acacia Others
Golikai 1.05 27.2 5.2 67.6Kodigibaila 2.42 26.5 6.6 66.9Nirmundagi 1.64 15.3 7.4 77.3Vajgarb 1.06 62.4 1.1 36.5
a the Kodgibail basins listed in Table 1 as basins 9 to 11 and shown in Fig. 1 arenested within this basin.
b The Vajgar sub-basins (4 and 5) in Table 1 are nested within this basin.
Table 3The Furey–Gupta Filter coefficients for the three land-cover types in the Coastal catchmen
Type Recession constant C1mean, sd C2
D, delay = 1 time unit (36 min)Forest 0.98 0.0067, 0.019 0.69Acacia 0.91 0.1, 0.134 0.47Degraded 0.89 0.21, 0.263 0.35
Note: C1 is the overland flow coefficient; C2 is the evapotranspiration and basin storagfraction of precipitation that becomes recharge and is the ratio of ground-water rechargeinter-quartile range; QB is the proportion of total flow Q estimated as baseflow and QF i
for the three Coastal basins (Table 4). In addition for part of thesummer monsoon of 2005 (16 June–26 July, i.e., a total of 41 days),36 min (0.6 h) data was available for rainfall-runoff for selectedstorms in the three Coastal catchments. Such information enabledus to monitor temporal changes in the rainfall-runoff response fol-lowing the onset of the monsoon until maximum basin wetnesswas attained.
As indicated in Fig. 1, some of the small and relatively homoge-neous catchments in the Malnaad sites were nested within largerbasins (1.0–2.5 km2) with different proportions of forest cover (asshown in Table 2). Downstream, these larger basins were instru-mented with V-notches from December 14, 2004. Such steps willenable an assessment of the dry season flows at these larger scales.
4.2. Potential evapotranspiration
Reference potential evapotranspiration (PET) was estimated atboth the Coastal and Malnaad sites using available daily weatherdata. Data for more variables were available from an Indian Mete-orological Department station close to the Coastal site so PET wascalculated using the Penman–Monteith equation following the FAOapproach (Allen et al., 1998, http://www.fao.org/). For the Malnaadsites where available weather data was more limited, the muchsimple empirical equation of Turc (1961) was adopted. In this con-text, an earlier comparative study of up to twenty different PETmethods was undertaken by Jensen et al. (1990). Their work com-pared estimated PET against carefully selected lysimeter data fromeleven stations across a range of climates. Jensen et al. (1990)noted that the Turc method compared very favourably withcombination methods at their humid lysimeter locations. Morepertinent, the Turc method was ranked second only to the Pen-man–Monteith method when only the humid locations were consid-ered in that study (Jensen et al., 1990). Elsewhere anothercomparative study of reference ET methods by Yoder et al. (2005)came to similar conclusions.
4.2.1. Data inputsMore specific details on the data inputs, as part of using the
above methods are now provided. In the absence of a meteorolog-ical station on site for the Coastal basins, we followed the FAOmanual (Allen et al., 1998), which recommended that data fromnearest meteorological station be used. Daily climate data (tem-perature, wind speed and relative humidity) were obtained fromthe Honnavar station of the Indian Meteorological Department(IMD) which is located about 10 km from the catchments. The vari-ables solar radiation and maximum sunshine hours were not avail-able from this station. Thus the use of a global formula which onlyrequires latitude –longitude as the input for each specific catch-ment was adopted for this purpose (Allen et al., 1998, http://www.fao.org/). PET will be then plotted over the wet season andthe initial stages of the post-monsoon season (May –December2005, incl.).
ts.
C3mean, sd C3C1 median; IQR QB QF
0.31, 0.019 329, 1910 0.95 0.050.43, 0.109 6.88, 18.01 0.76 0.240.45, 0.197 4.22, 15.83 0.55 0.45
e coefficient; and C3 is the ground-water recharge coefficient; C3/C1 indicates theto the overland coefficient; sd is the standard deviation of C1 and C3; IQR stands fors the proportion of total flow Q estimated as Quickflow.
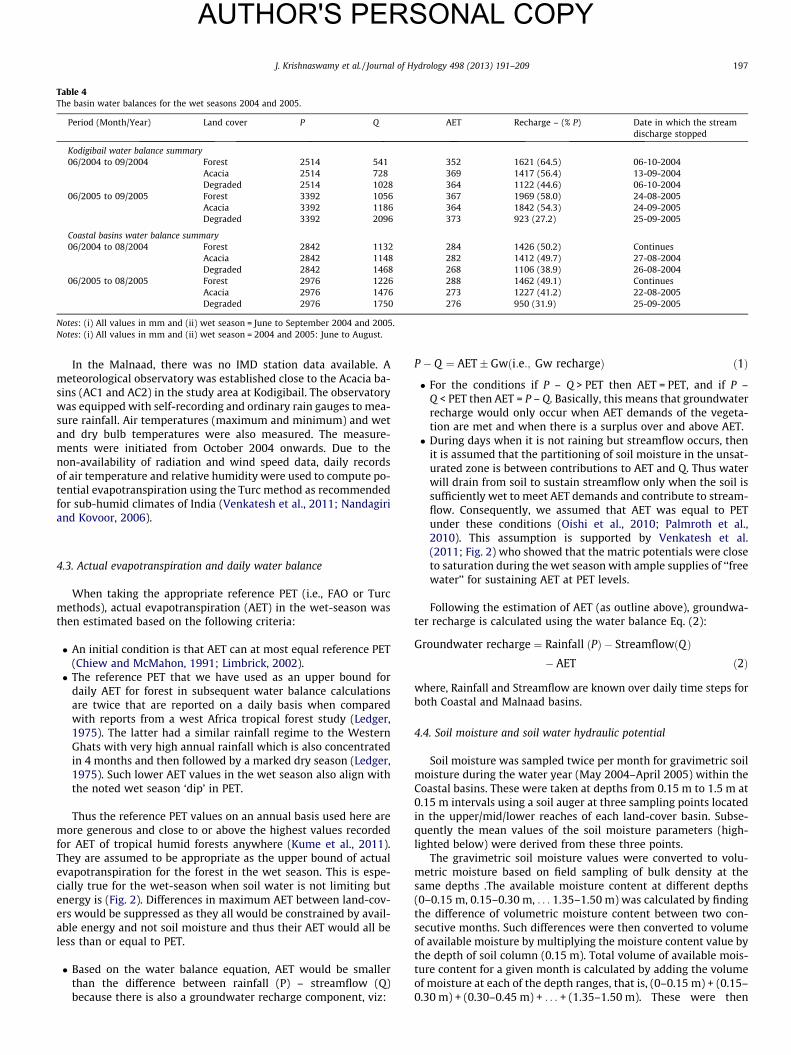
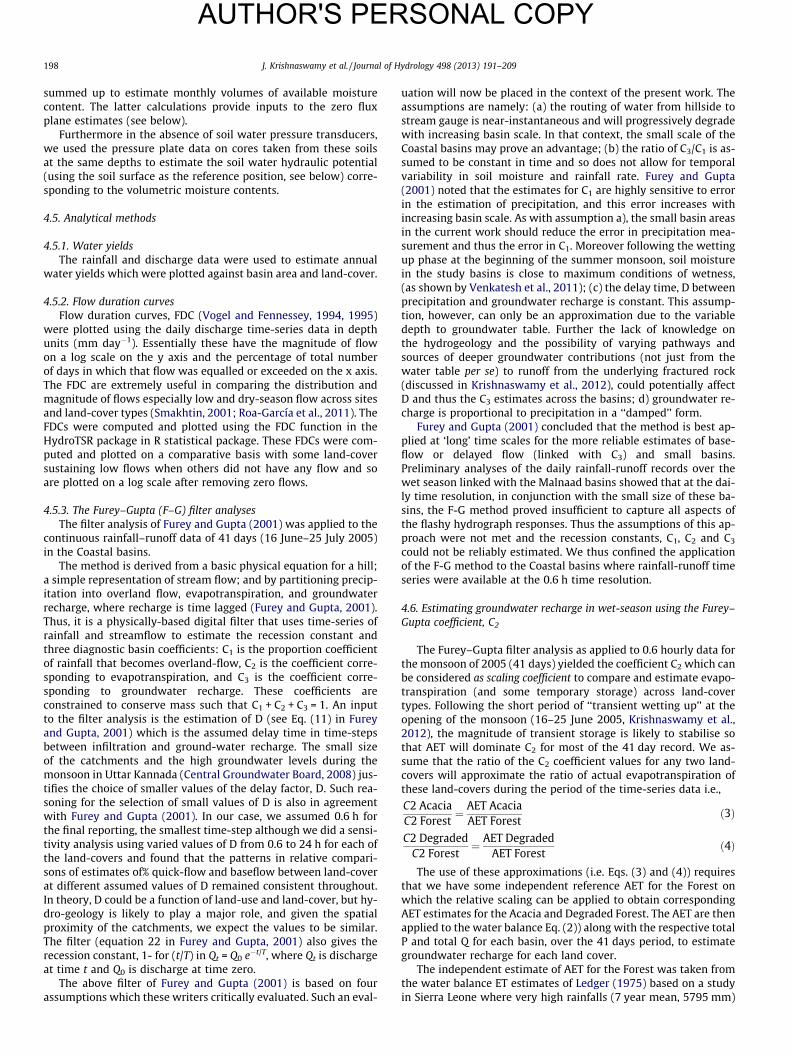
Table 4The basin water balances for the wet seasons 2004 and 2005.
Period (Month/Year) Land cover P Q AET Recharge – (% P) Date in which the streamdischarge stopped
Kodigibail water balance summary06/2004 to 09/2004 Forest 2514 541 352 1621 (64.5) 06-10-2004
Acacia 2514 728 369 1417 (56.4) 13-09-2004Degraded 2514 1028 364 1122 (44.6) 06-10-2004
06/2005 to 09/2005 Forest 3392 1056 367 1969 (58.0) 24-08-2005Acacia 3392 1186 364 1842 (54.3) 24-09-2005Degraded 3392 2096 373 923 (27.2) 25-09-2005
Coastal basins water balance summary06/2004 to 08/2004 Forest 2842 1132 284 1426 (50.2) Continues
Acacia 2842 1148 282 1412 (49.7) 27-08-2004Degraded 2842 1468 268 1106 (38.9) 26-08-2004
06/2005 to 08/2005 Forest 2976 1226 288 1462 (49.1) ContinuesAcacia 2976 1476 273 1227 (41.2) 22-08-2005Degraded 2976 1750 276 950 (31.9) 25-09-2005
Notes: (i) All values in mm and (ii) wet season = June to September 2004 and 2005.Notes: (i) All values in mm and (ii) wet season = 2004 and 2005: June to August.
J. Krishnaswamy et al. / Journal of Hydrology 498 (2013) 191–209 197
AUTHOR'S PERSONAL COPY
In the Malnaad, there was no IMD station data available. Ameteorological observatory was established close to the Acacia ba-sins (AC1 and AC2) in the study area at Kodigibail. The observatorywas equipped with self-recording and ordinary rain gauges to mea-sure rainfall. Air temperatures (maximum and minimum) and wetand dry bulb temperatures were also measured. The measure-ments were initiated from October 2004 onwards. Due to thenon-availability of radiation and wind speed data, daily recordsof air temperature and relative humidity were used to compute po-tential evapotranspiration using the Turc method as recommendedfor sub-humid climates of India (Venkatesh et al., 2011; Nandagiriand Kovoor, 2006).
4.3. Actual evapotranspiration and daily water balance
When taking the appropriate reference PET (i.e., FAO or Turcmethods), actual evapotranspiration (AET) in the wet-season wasthen estimated based on the following criteria:
� An initial condition is that AET can at most equal reference PET(Chiew and McMahon, 1991; Limbrick, 2002).� The reference PET that we have used as an upper bound for
daily AET for forest in subsequent water balance calculationsare twice that are reported on a daily basis when comparedwith reports from a west Africa tropical forest study (Ledger,1975). The latter had a similar rainfall regime to the WesternGhats with very high annual rainfall which is also concentratedin 4 months and then followed by a marked dry season (Ledger,1975). Such lower AET values in the wet season also align withthe noted wet season ‘dip’ in PET.
Thus the reference PET values on an annual basis used here aremore generous and close to or above the highest values recordedfor AET of tropical humid forests anywhere (Kume et al., 2011).They are assumed to be appropriate as the upper bound of actualevapotranspiration for the forest in the wet season. This is espe-cially true for the wet-season when soil water is not limiting butenergy is (Fig. 2). Differences in maximum AET between land-cov-ers would be suppressed as they all would be constrained by avail-able energy and not soil moisture and thus their AET would all beless than or equal to PET.
� Based on the water balance equation, AET would be smallerthan the difference between rainfall (P) – streamflow (Q)because there is also a groundwater recharge component, viz:
P � Q ¼ AET� Gwði:e:; Gw rechargeÞ ð1Þ
� For the conditions if P – Q > PET then AET = PET, and if P –Q < PET then AET = P – Q. Basically, this means that groundwaterrecharge would only occur when AET demands of the vegeta-tion are met and when there is a surplus over and above AET.� During days when it is not raining but streamflow occurs, then
it is assumed that the partitioning of soil moisture in the unsat-urated zone is between contributions to AET and Q. Thus waterwill drain from soil to sustain streamflow only when the soil issufficiently wet to meet AET demands and contribute to stream-flow. Consequently, we assumed that AET was equal to PETunder these conditions (Oishi et al., 2010; Palmroth et al.,2010). This assumption is supported by Venkatesh et al.(2011; Fig. 2) who showed that the matric potentials were closeto saturation during the wet season with ample supplies of ‘‘freewater’’ for sustaining AET at PET levels.
Following the estimation of AET (as outline above), groundwa-ter recharge is calculated using the water balance Eq. (2):
Groundwater recharge ¼ Rainfall ðPÞ � StreamflowðQÞ� AET ð2Þ
where, Rainfall and Streamflow are known over daily time steps forboth Coastal and Malnaad basins.
4.4. Soil moisture and soil water hydraulic potential
Soil moisture was sampled twice per month for gravimetric soilmoisture during the water year (May 2004–April 2005) within theCoastal basins. These were taken at depths from 0.15 m to 1.5 m at0.15 m intervals using a soil auger at three sampling points locatedin the upper/mid/lower reaches of each land-cover basin. Subse-quently the mean values of the soil moisture parameters (high-lighted below) were derived from these three points.
The gravimetric soil moisture values were converted to volu-metric moisture based on field sampling of bulk density at thesame depths .The available moisture content at different depths(0–0.15 m, 0.15–0.30 m, . . . 1.35–1.50 m) was calculated by findingthe difference of volumetric moisture content between two con-secutive months. Such differences were then converted to volumeof available moisture by multiplying the moisture content value bythe depth of soil column (0.15 m). Total volume of available mois-ture content for a given month is calculated by adding the volumeof moisture at each of the depth ranges, that is, (0–0.15 m) + (0.15–0.30 m) + (0.30–0.45 m) + . . . + (1.35–1.50 m). These were then
198 J. Krishnaswamy et al. / Journal of Hydrology 498 (2013) 191–209
AUTHOR'S PERSONAL COPY
summed up to estimate monthly volumes of available moisturecontent. The latter calculations provide inputs to the zero fluxplane estimates (see below).
Furthermore in the absence of soil water pressure transducers,we used the pressure plate data on cores taken from these soilsat the same depths to estimate the soil water hydraulic potential(using the soil surface as the reference position, see below) corre-sponding to the volumetric moisture contents.
4.5. Analytical methods
4.5.1. Water yieldsThe rainfall and discharge data were used to estimate annual
water yields which were plotted against basin area and land-cover.
4.5.2. Flow duration curvesFlow duration curves, FDC (Vogel and Fennessey, 1994, 1995)
were plotted using the daily discharge time-series data in depthunits (mm day�1). Essentially these have the magnitude of flowon a log scale on the y axis and the percentage of total numberof days in which that flow was equalled or exceeded on the x axis.The FDC are extremely useful in comparing the distribution andmagnitude of flows especially low and dry-season flow across sitesand land-cover types (Smakhtin, 2001; Roa-García et al., 2011). TheFDCs were computed and plotted using the FDC function in theHydroTSR package in R statistical package. These FDCs were com-puted and plotted on a comparative basis with some land-coversustaining low flows when others did not have any flow and soare plotted on a log scale after removing zero flows.
4.5.3. The Furey–Gupta (F–G) filter analysesThe filter analysis of Furey and Gupta (2001) was applied to the
continuous rainfall–runoff data of 41 days (16 June–25 July 2005)in the Coastal basins.
The method is derived from a basic physical equation for a hill;a simple representation of stream flow; and by partitioning precip-itation into overland flow, evapotranspiration, and groundwaterrecharge, where recharge is time lagged (Furey and Gupta, 2001).Thus, it is a physically-based digital filter that uses time-series ofrainfall and streamflow to estimate the recession constant andthree diagnostic basin coefficients: C1 is the proportion coefficientof rainfall that becomes overland-flow, C2 is the coefficient corre-sponding to evapotranspiration, and C3 is the coefficient corre-sponding to groundwater recharge. These coefficients areconstrained to conserve mass such that C1 + C2 + C3 = 1. An inputto the filter analysis is the estimation of D (see Eq. (11) in Fureyand Gupta, 2001) which is the assumed delay time in time-stepsbetween infiltration and ground-water recharge. The small sizeof the catchments and the high groundwater levels during themonsoon in Uttar Kannada (Central Groundwater Board, 2008) jus-tifies the choice of smaller values of the delay factor, D. Such rea-soning for the selection of small values of D is also in agreementwith Furey and Gupta (2001). In our case, we assumed 0.6 h forthe final reporting, the smallest time-step although we did a sensi-tivity analysis using varied values of D from 0.6 to 24 h for each ofthe land-covers and found that the patterns in relative compari-sons of estimates of% quick-flow and baseflow between land-coverat different assumed values of D remained consistent throughout.In theory, D could be a function of land-use and land-cover, but hy-dro-geology is likely to play a major role, and given the spatialproximity of the catchments, we expect the values to be similar.The filter (equation 22 in Furey and Gupta, 2001) also gives therecession constant, 1- for (t/T) in Qt = Q0 e�t/T, where Qt is dischargeat time t and Q0 is discharge at time zero.
The above filter of Furey and Gupta (2001) is based on fourassumptions which these writers critically evaluated. Such an eval-
uation will now be placed in the context of the present work. Theassumptions are namely: (a) the routing of water from hillside tostream gauge is near-instantaneous and will progressively degradewith increasing basin scale. In that context, the small scale of theCoastal basins may prove an advantage; (b) the ratio of C3/C1 is as-sumed to be constant in time and so does not allow for temporalvariability in soil moisture and rainfall rate. Furey and Gupta(2001) noted that the estimates for C1 are highly sensitive to errorin the estimation of precipitation, and this error increases withincreasing basin scale. As with assumption a), the small basin areasin the current work should reduce the error in precipitation mea-surement and thus the error in C1. Moreover following the wettingup phase at the beginning of the summer monsoon, soil moisturein the study basins is close to maximum conditions of wetness,(as shown by Venkatesh et al., 2011); (c) the delay time, D betweenprecipitation and groundwater recharge is constant. This assump-tion, however, can only be an approximation due to the variabledepth to groundwater table. Further the lack of knowledge onthe hydrogeology and the possibility of varying pathways andsources of deeper groundwater contributions (not just from thewater table per se) to runoff from the underlying fractured rock(discussed in Krishnaswamy et al., 2012), could potentially affectD and thus the C3 estimates across the basins; d) groundwater re-charge is proportional to precipitation in a ‘‘damped’’ form.
Furey and Gupta (2001) concluded that the method is best ap-plied at ‘long’ time scales for the more reliable estimates of base-flow or delayed flow (linked with C3) and small basins.Preliminary analyses of the daily rainfall-runoff records over thewet season linked with the Malnaad basins showed that at the dai-ly time resolution, in conjunction with the small size of these ba-sins, the F-G method proved insufficient to capture all aspects ofthe flashy hydrograph responses. Thus the assumptions of this ap-proach were not met and the recession constants, C1, C2 and C3
could not be reliably estimated. We thus confined the applicationof the F-G method to the Coastal basins where rainfall-runoff timeseries were available at the 0.6 h time resolution.
4.6. Estimating groundwater recharge in wet-season using the Furey–Gupta coefficient, C2
The Furey–Gupta filter analysis as applied to 0.6 hourly data forthe monsoon of 2005 (41 days) yielded the coefficient C2 which canbe considered as scaling coefficient to compare and estimate evapo-transpiration (and some temporary storage) across land-covertypes. Following the short period of ‘‘transient wetting up’’ at theopening of the monsoon (16–25 June 2005, Krishnaswamy et al.,2012), the magnitude of transient storage is likely to stabilise sothat AET will dominate C2 for most of the 41 day record. We as-sume that the ratio of the C2 coefficient values for any two land-covers will approximate the ratio of actual evapotranspiration ofthese land-covers during the period of the time-series data i.e.,
C2 AcaciaC2 Forest
¼ AET AcaciaAET Forest
ð3Þ
C2 DegradedC2 Forest
¼ AET DegradedAET Forest
ð4Þ
The use of these approximations (i.e. Eqs. (3) and (4)) requiresthat we have some independent reference AET for the Forest onwhich the relative scaling can be applied to obtain correspondingAET estimates for the Acacia and Degraded Forest. The AET are thenapplied to the water balance Eq. (2)) along with the respective totalP and total Q for each basin, over the 41 days period, to estimategroundwater recharge for each land cover.
The independent estimate of AET for the Forest was taken fromthe water balance ET estimates of Ledger (1975) based on a studyin Sierra Leone where very high rainfalls (7 year mean, 5795 mm)
J. Krishnaswamy et al. / Journal of Hydrology 498 (2013) 191–209 199
AUTHOR'S PERSONAL COPY
are concentrated in 3 months of the year (7 year mean rainfall, July– September, 4523 mm) (Bruijnzeel, per comm). As discussed (un-der Methods), such a rainfall total and its seasonal distribution areclimatically similar to the present study sites as well as the Wes-tern Ghats (as described by Gunnell, 1997). When compared withmost lowland forest ET estimates, the annual ET was found how-ever to be low and only 1011 mm for a 7 year record (Ledger,1975). As Roberts et al. (2004) noted elsewhere a typical annualestimate of �1400 mm (Bruijnzeel, 1990) for AET is close the netradiation equivalent of evaporation (1500–1550 mm; Calder,1999) for the drainage basin experiments.
The average daily ET over the wettest 3 months (July – Septem-ber, total ET, 139 mm) was low at 1.5 mm d�1 (Ledger, 1975) and itis this figure that will be used as the reference AET for Forest in equa-tions 3 and 4). It should be noted that use of this reference AET esti-mate acts as a scaling factor and is restricted to the Coastal basinswhich are very close to each other so that climate differences arenegligible. The C2 coefficient of the Furey–Gupta filter analysis isa surrogate estimate of differences in land cover characteristics(e.g., species composition, crown cover) on AET.
4.7. The SWIM model for estimating the water balance
We applied the CSIRO SWIMv2 (Soil Water Infiltration andMovement) model (Verburg, 1996; www.clw.csiro.au/products/swim/) SWIM v2.0 over a water year April 2004–May 2005 forthe Coastal basins.
SWIM is based on a numerical solution of the Richards’ equationand the advection–dispersion equation. Of relevance to this study,SWIM can be used to simulate runoff, infiltration, redistribution,plant uptake and transpiration, soil evaporation and deep drainage(Verburg, 1996). However the model deals only with a one-dimen-sional profile and assumes that there is one hydraulic conductivityfunction (based on data from Bonell et al., 2010) for each soil hori-zon so that macropore flow can only be accounted for in a limitedway. Moreover previous work (Bonell et al., 2010; Krishnaswamyet al., 2012) has reported the existence of 2-Dimensional flow(i.e., sub-surface storm flow) within the soil profile during stormsso the assumption of 1-Dimensional flow will break down at suchtimes during the wet season. Nonetheless, its application will pro-vide some useful insights into the impacts of land cover on evapo-transpiration as well as runoff and groundwater recharge whichcan then be compared with the results for other methods.
The outputs of SWIM will also be compared with the dailywater balances of the Malnaad and Coastal basins.
4.8. The zero flux plane method
The zero-flux plane (ZFP) method provides a point estimate ofplant-water use and drainage to deeper layers (e.g., Cooper,1980; Wellings and Bell, 1980; Kirsch, 1993; reviewed in Khalilet al., 2003). The method involves estimating a depth profile of to-tal hydraulic potential of soil moisture and then the identificationof a ‘‘zero flux plane’’ which separates the zones of upward anddownward movement of water in a thoroughly wetted soil withevaporation and drainage occurring simultaneously. The ZFP sepa-rates upward movement of soil water to evapotranspiration fromdownward drainage towards the deeper soil and water table inthe one-dimensional plane. Moreover the method is based on thepremise that soil water recharge plus continued downward drain-age under gravity is equal to changes in soil-moisture storage be-low the ZFP and that plant-water use above this zone is similarlyestimated. In such circumstances, it is assumed that root extractionof soil moisture for AET below the ZFP is negligible, i.e. there is onlydrainage below the ZFP (Cooper, 1980). On the basis of the descrip-tion of tree rooting patterns above, clearly the latter assumption of
the ZFP method will not always be met. This notion applies espe-cially once uptake for AET demands of freely available and shallowsoil water has been completed in the early stages of the dry season(Venkatesh et al., 2011). Subsequently deeper root extraction isthen more favoured especially when concerning the deeper-rooted,natural forest. In such circumstances the ZFP method would poten-tially over-estimate soil water drainage below the zero flux plane,and conversely under-estimate AET. The review of Khalil et al.(2003) suggested that in similar circumstances elsewhere errorsin ZFP estimates were not considered large. But the latter restson the premise that water is readily available most of the time inthe upper soil layers.
As with SWIM above, the existence of 2-dimensional lateralflow during the monsoon (Bonell et al., 2010; Krishnaswamyet al., 2012), will cause a breakdown in the assumptions of theZFP method. In addition the water table has to be deeper thanthe ZFP and the occurrence of perched water tables also duringthe wet season is another problem (Venkatesh et al., 2011; Krish-naswamy et al., 2012). Thus the application of the method is re-stricted to the dry season only when no rainfall was recorded. Themethod requires data on the soil matric potential (W) with depth(z) to locate the ZFP as well as soil–water content to measurechanges in storage. We used periodic (once a month) measure-ments of gravimetric soil moisture at various depths up to 2 mfrom the end of the wet-season in November 2005 through thedry-season until April 2006. As earlier indicated, these gravimetricdata were then converted into volumetric soil moisture using bulk-density measured at the sites. Subsequently the matric potentialswere obtained from the pressure plate data on soil cores taken atthe same depths as the gravimetric moisture data. The totalhydraulic potential (U) (i.e., total soil water potential) was thencalculated at each depth, where U = W– z, and taking the surfaceas the reference datum (z = 0). Finally the total hydraulic potential– depth relation was then plotted to identify whether a ZFP existsand if so, evapotranspiration and recharge can be estimated foreach land-cover using Eq. (1) in Khalil et al. (2003).
E ¼ RþZ zoðt1Þ
0hðt1Þdz�
Z z0ðt2Þ
0hðt2Þdzþ 1
2
Z zoðt2Þ
zoðt1Þ½hðt1Þ
þ hðt2Þ�dz ð5Þ
where E is the Evaporation over the time period t1 to t2; R the Rain-fall over the same period; t the time; z the depth measured posi-tively downward; Z the Depth at which drainage is calculated; hthe Volumetric Moisture Content and z0(t) the ZFP depth at time t.
5. Results
5.1. Summary of the meteorological data
The annual rainfall for the Coastal site during the hydrologicyear (June 2005–May 2006) was 3879 mm. The average rainfallfor the hydrologic years 2004 and 2005 during the wet season(June–August) was 2751 mm and for the early the dry season per-iod (September–December), the average was 386 mm. The averagerelative humidity for the hydrologic year 2005–2006 was 76.8%and average for the wet and dry seasons, as defined above (forthe years 2004 and 2005) were 89% and 72.2% respectively. ThePET estimated for the hydrologic year 2005–06 was 1479 mm(FAO, Penman–Monteith). The average wet season (June–August)PET for the years 2004 and 2005 was 309 mm (low for reasons sta-ted earlier) and for the early dry season period(September–Decem-ber), the PET (FAO, Penman–Monteith method) for the same yearswas 579 mm. The mean daily temperature for the year 2005–06was 27.4 �C and the maximum and minimum daily temperaturerecorded was 37.5 �C and 15.9 �C respectively.
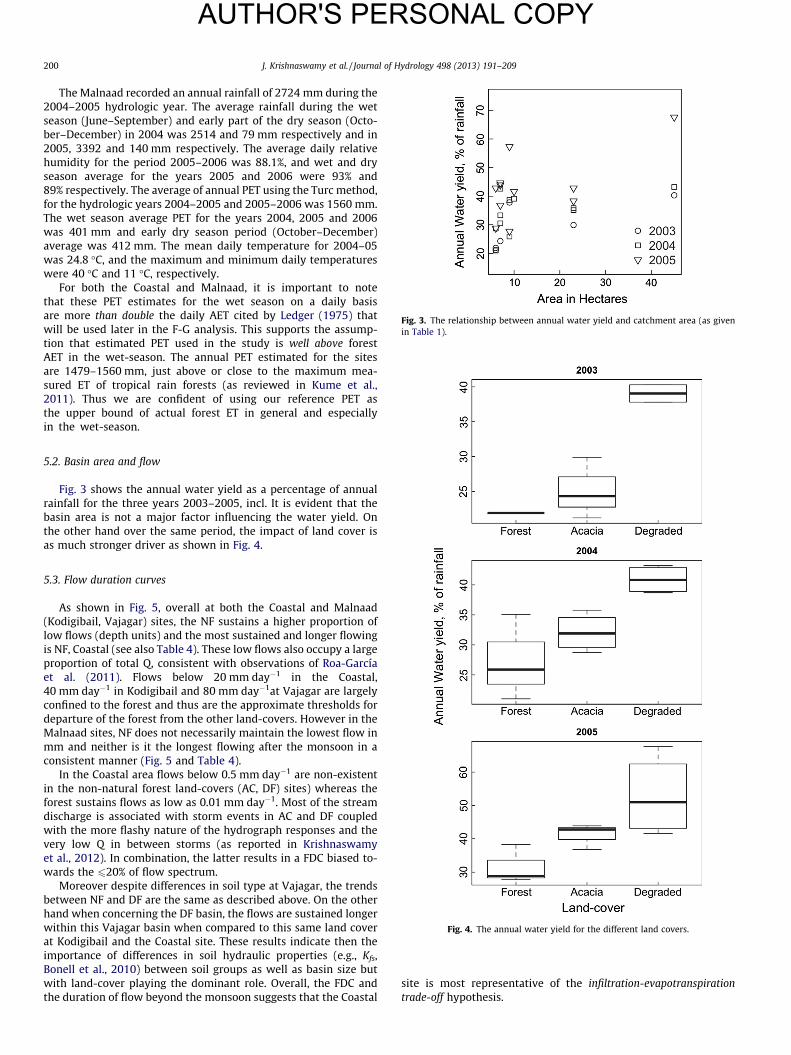
Fig. 3. The relationship between annual water yield and catchment area (as givenin Table 1).
200 J. Krishnaswamy et al. / Journal of Hydrology 498 (2013) 191–209
AUTHOR'S PERSONAL COPY
The Malnaad recorded an annual rainfall of 2724 mm during the2004–2005 hydrologic year. The average rainfall during the wetseason (June–September) and early part of the dry season (Octo-ber–December) in 2004 was 2514 and 79 mm respectively and in2005, 3392 and 140 mm respectively. The average daily relativehumidity for the period 2005–2006 was 88.1%, and wet and dryseason average for the years 2005 and 2006 were 93% and89% respectively. The average of annual PET using the Turc method,for the hydrologic years 2004–2005 and 2005–2006 was 1560 mm.The wet season average PET for the years 2004, 2005 and 2006was 401 mm and early dry season period (October–December)average was 412 mm. The mean daily temperature for 2004–05was 24.8 �C, and the maximum and minimum daily temperatureswere 40 �C and 11 �C, respectively.
For both the Coastal and Malnaad, it is important to notethat these PET estimates for the wet season on a daily basisare more than double the daily AET cited by Ledger (1975) thatwill be used later in the F-G analysis. This supports the assump-tion that estimated PET used in the study is well above forestAET in the wet-season. The annual PET estimated for the sitesare 1479–1560 mm, just above or close to the maximum mea-sured ET of tropical rain forests (as reviewed in Kume et al.,2011). Thus we are confident of using our reference PET asthe upper bound of actual forest ET in general and especiallyin the wet-season.
5.2. Basin area and flow
Fig. 3 shows the annual water yield as a percentage of annualrainfall for the three years 2003–2005, incl. It is evident that thebasin area is not a major factor influencing the water yield. Onthe other hand over the same period, the impact of land cover isas much stronger driver as shown in Fig. 4.
Fig. 4. The annual water yield for the different land covers.
5.3. Flow duration curves
As shown in Fig. 5, overall at both the Coastal and Malnaad(Kodigibail, Vajagar) sites, the NF sustains a higher proportion oflow flows (depth units) and the most sustained and longer flowingis NF, Coastal (see also Table 4). These low flows also occupy a largeproportion of total Q, consistent with observations of Roa-Garcíaet al. (2011). Flows below 20 mm day�1 in the Coastal,40 mm day�1 in Kodigibail and 80 mm day�1at Vajagar are largelyconfined to the forest and thus are the approximate thresholds fordeparture of the forest from the other land-covers. However in theMalnaad sites, NF does not necessarily maintain the lowest flow inmm and neither is it the longest flowing after the monsoon in aconsistent manner (Fig. 5 and Table 4).
In the Coastal area flows below 0.5 mm day�1 are non-existentin the non-natural forest land-covers (AC, DF) sites) whereas theforest sustains flows as low as 0.01 mm day�1. Most of the streamdischarge is associated with storm events in AC and DF coupledwith the more flashy nature of the hydrograph responses and thevery low Q in between storms (as reported in Krishnaswamyet al., 2012). In combination, the latter results in a FDC biased to-wards the 620% of flow spectrum.
Moreover despite differences in soil type at Vajagar, the trendsbetween NF and DF are the same as described above. On the otherhand when concerning the DF basin, the flows are sustained longerwithin this Vajagar basin when compared to this same land coverat Kodigibail and the Coastal site. These results indicate then theimportance of differences in soil hydraulic properties (e.g., Kfs,Bonell et al., 2010) between soil groups as well as basin size butwith land-cover playing the dominant role. Overall, the FDC andthe duration of flow beyond the monsoon suggests that the Coastal
site is most representative of the infiltration-evapotranspirationtrade-off hypothesis.
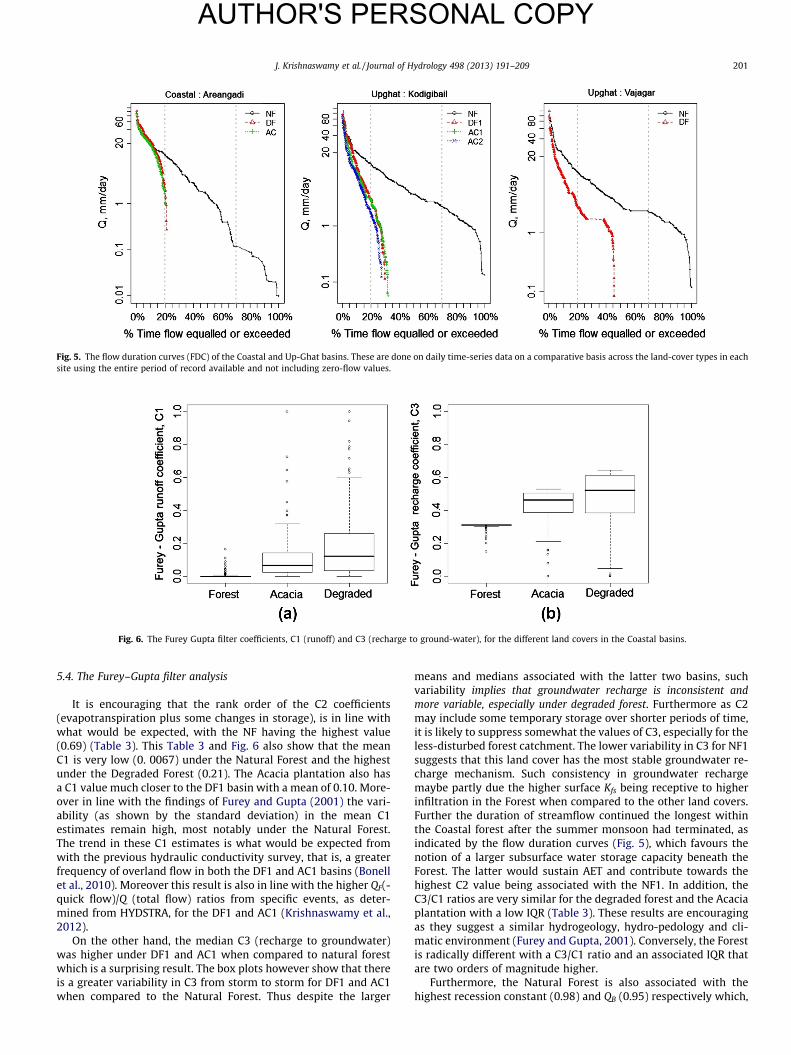
Fig. 5. The flow duration curves (FDC) of the Coastal and Up-Ghat basins. These are done on daily time-series data on a comparative basis across the land-cover types in eachsite using the entire period of record available and not including zero-flow values.
Fig. 6. The Furey Gupta filter coefficients, C1 (runoff) and C3 (recharge to ground-water), for the different land covers in the Coastal basins.
J. Krishnaswamy et al. / Journal of Hydrology 498 (2013) 191–209 201
AUTHOR'S PERSONAL COPY
5.4. The Furey–Gupta filter analysis
It is encouraging that the rank order of the C2 coefficients(evapotranspiration plus some changes in storage), is in line withwhat would be expected, with the NF having the highest value(0.69) (Table 3). This Table 3 and Fig. 6 also show that the meanC1 is very low (0. 0067) under the Natural Forest and the highestunder the Degraded Forest (0.21). The Acacia plantation also hasa C1 value much closer to the DF1 basin with a mean of 0.10. More-over in line with the findings of Furey and Gupta (2001) the vari-ability (as shown by the standard deviation) in the mean C1estimates remain high, most notably under the Natural Forest.The trend in these C1 estimates is what would be expected fromwith the previous hydraulic conductivity survey, that is, a greaterfrequency of overland flow in both the DF1 and AC1 basins (Bonellet al., 2010). Moreover this result is also in line with the higher QF(-quick flow)/Q (total flow) ratios from specific events, as deter-mined from HYDSTRA, for the DF1 and AC1 (Krishnaswamy et al.,2012).
On the other hand, the median C3 (recharge to groundwater)was higher under DF1 and AC1 when compared to natural forestwhich is a surprising result. The box plots however show that thereis a greater variability in C3 from storm to storm for DF1 and AC1when compared to the Natural Forest. Thus despite the larger
means and medians associated with the latter two basins, suchvariability implies that groundwater recharge is inconsistent andmore variable, especially under degraded forest. Furthermore as C2may include some temporary storage over shorter periods of time,it is likely to suppress somewhat the values of C3, especially for theless-disturbed forest catchment. The lower variability in C3 for NF1suggests that this land cover has the most stable groundwater re-charge mechanism. Such consistency in groundwater rechargemaybe partly due the higher surface Kfs being receptive to higherinfiltration in the Forest when compared to the other land covers.Further the duration of streamflow continued the longest withinthe Coastal forest after the summer monsoon had terminated, asindicated by the flow duration curves (Fig. 5), which favours thenotion of a larger subsurface water storage capacity beneath theForest. The latter would sustain AET and contribute towards thehighest C2 value being associated with the NF1. In addition, theC3/C1 ratios are very similar for the degraded forest and the Acaciaplantation with a low IQR (Table 3). These results are encouragingas they suggest a similar hydrogeology, hydro-pedology and cli-matic environment (Furey and Gupta, 2001). Conversely, the Forestis radically different with a C3/C1 ratio and an associated IQR thatare two orders of magnitude higher.
Furthermore, the Natural Forest is also associated with thehighest recession constant (0.98) and QB (0.95) respectively which,
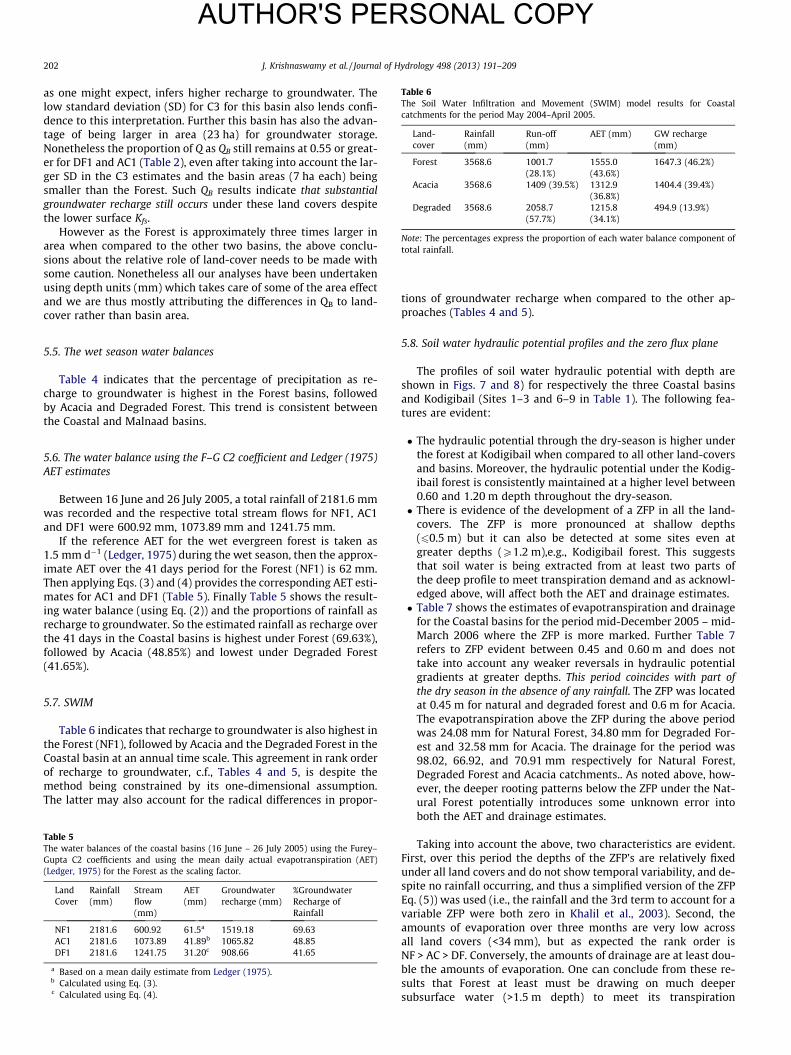
Table 6The Soil Water Infiltration and Movement (SWIM) model results for Coastalcatchments for the period May 2004–April 2005.
Land-cover
Rainfall(mm)
Run-off(mm)
AET (mm) GW recharge(mm)
Forest 3568.6 1001.7(28.1%)
1555.0(43.6%)
1647.3 (46.2%)
Acacia 3568.6 1409 (39.5%) 1312.9(36.8%)
1404.4 (39.4%)
Degraded 3568.6 2058.7(57.7%)
1215.8(34.1%)
494.9 (13.9%)
Note: The percentages express the proportion of each water balance component oftotal rainfall.
202 J. Krishnaswamy et al. / Journal of Hydrology 498 (2013) 191–209
AUTHOR'S PERSONAL COPY
as one might expect, infers higher recharge to groundwater. Thelow standard deviation (SD) for C3 for this basin also lends confi-dence to this interpretation. Further this basin has also the advan-tage of being larger in area (23 ha) for groundwater storage.Nonetheless the proportion of Q as QB still remains at 0.55 or great-er for DF1 and AC1 (Table 2), even after taking into account the lar-ger SD in the C3 estimates and the basin areas (7 ha each) beingsmaller than the Forest. Such QB results indicate that substantialgroundwater recharge still occurs under these land covers despitethe lower surface Kfs.
However as the Forest is approximately three times larger inarea when compared to the other two basins, the above conclu-sions about the relative role of land-cover needs to be made withsome caution. Nonetheless all our analyses have been undertakenusing depth units (mm) which takes care of some of the area effectand we are thus mostly attributing the differences in QB to land-cover rather than basin area.
5.5. The wet season water balances
Table 4 indicates that the percentage of precipitation as re-charge to groundwater is highest in the Forest basins, followedby Acacia and Degraded Forest. This trend is consistent betweenthe Coastal and Malnaad basins.
5.6. The water balance using the F–G C2 coefficient and Ledger (1975)AET estimates
Between 16 June and 26 July 2005, a total rainfall of 2181.6 mmwas recorded and the respective total stream flows for NF1, AC1and DF1 were 600.92 mm, 1073.89 mm and 1241.75 mm.
If the reference AET for the wet evergreen forest is taken as1.5 mm d�1 (Ledger, 1975) during the wet season, then the approx-imate AET over the 41 days period for the Forest (NF1) is 62 mm.Then applying Eqs. (3) and (4) provides the corresponding AET esti-mates for AC1 and DF1 (Table 5). Finally Table 5 shows the result-ing water balance (using Eq. (2)) and the proportions of rainfall asrecharge to groundwater. So the estimated rainfall as recharge overthe 41 days in the Coastal basins is highest under Forest (69.63%),followed by Acacia (48.85%) and lowest under Degraded Forest(41.65%).
5.7. SWIM
Table 6 indicates that recharge to groundwater is also highest inthe Forest (NF1), followed by Acacia and the Degraded Forest in theCoastal basin at an annual time scale. This agreement in rank orderof recharge to groundwater, c.f., Tables 4 and 5, is despite themethod being constrained by its one-dimensional assumption.The latter may also account for the radical differences in propor-
Table 5The water balances of the coastal basins (16 June – 26 July 2005) using the Furey–Gupta C2 coefficients and using the mean daily actual evapotranspiration (AET)(Ledger, 1975) for the Forest as the scaling factor.
LandCover
Rainfall(mm)
Streamflow(mm)
AET(mm)
Groundwaterrecharge (mm)
%GroundwaterRecharge ofRainfall
NF1 2181.6 600.92 61.5a 1519.18 69.63AC1 2181.6 1073.89 41.89b 1065.82 48.85DF1 2181.6 1241.75 31.20c 908.66 41.65
a Based on a mean daily estimate from Ledger (1975).b Calculated using Eq. (3).c Calculated using Eq. (4).
tions of groundwater recharge when compared to the other ap-proaches (Tables 4 and 5).
5.8. Soil water hydraulic potential profiles and the zero flux plane
The profiles of soil water hydraulic potential with depth areshown in Figs. 7 and 8) for respectively the three Coastal basinsand Kodigibail (Sites 1–3 and 6–9 in Table 1). The following fea-tures are evident:
� The hydraulic potential through the dry-season is higher underthe forest at Kodigibail when compared to all other land-coversand basins. Moreover, the hydraulic potential under the Kodig-ibail forest is consistently maintained at a higher level between0.60 and 1.20 m depth throughout the dry-season.� There is evidence of the development of a ZFP in all the land-
covers. The ZFP is more pronounced at shallow depths(60.5 m) but it can also be detected at some sites even atgreater depths (P1.2 m),e.g., Kodigibail forest. This suggeststhat soil water is being extracted from at least two parts ofthe deep profile to meet transpiration demand and as acknowl-edged above, will affect both the AET and drainage estimates.� Table 7 shows the estimates of evapotranspiration and drainage
for the Coastal basins for the period mid-December 2005 – mid-March 2006 where the ZFP is more marked. Further Table 7refers to ZFP evident between 0.45 and 0.60 m and does nottake into account any weaker reversals in hydraulic potentialgradients at greater depths. This period coincides with part ofthe dry season in the absence of any rainfall. The ZFP was locatedat 0.45 m for natural and degraded forest and 0.6 m for Acacia.The evapotranspiration above the ZFP during the above periodwas 24.08 mm for Natural Forest, 34.80 mm for Degraded For-est and 32.58 mm for Acacia. The drainage for the period was98.02, 66.92, and 70.91 mm respectively for Natural Forest,Degraded Forest and Acacia catchments.. As noted above, how-ever, the deeper rooting patterns below the ZFP under the Nat-ural Forest potentially introduces some unknown error intoboth the AET and drainage estimates.
Taking into account the above, two characteristics are evident.First, over this period the depths of the ZFP’s are relatively fixedunder all land covers and do not show temporal variability, and de-spite no rainfall occurring, and thus a simplified version of the ZFPEq. (5)) was used (i.e., the rainfall and the 3rd term to account for avariable ZFP were both zero in Khalil et al., 2003). Second, theamounts of evaporation over three months are very low acrossall land covers (<34 mm), but as expected the rank order isNF > AC > DF. Conversely, the amounts of drainage are at least dou-ble the amounts of evaporation. One can conclude from these re-sults that Forest at least must be drawing on much deepersubsurface water (>1.5 m depth) to meet its transpiration
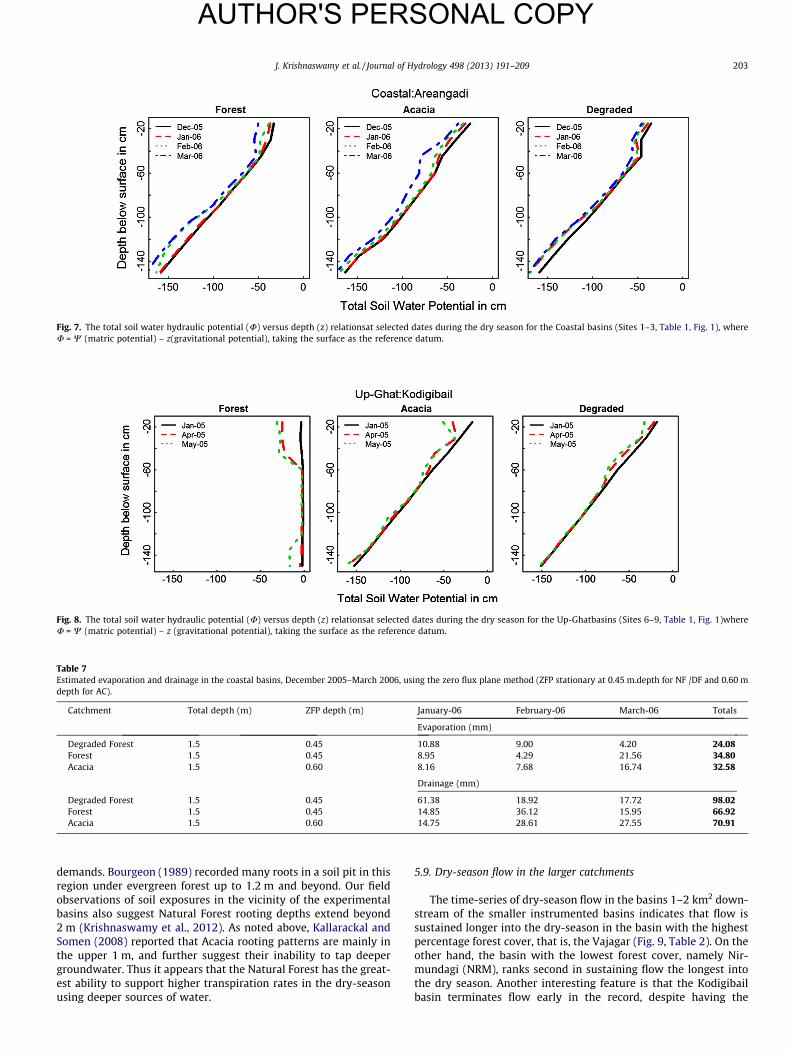
Fig. 7. The total soil water hydraulic potential (U) versus depth (z) relationsat selected dates during the dry season for the Coastal basins (Sites 1–3, Table 1, Fig. 1), whereU = W (matric potential) – z(gravitational potential), taking the surface as the reference datum.
Fig. 8. The total soil water hydraulic potential (U) versus depth (z) relationsat selected dates during the dry season for the Up-Ghatbasins (Sites 6–9, Table 1, Fig. 1)whereU = W (matric potential) – z (gravitational potential), taking the surface as the reference datum.
Table 7Estimated evaporation and drainage in the coastal basins, December 2005–March 2006, using the zero flux plane method (ZFP stationary at 0.45 m.depth for NF /DF and 0.60 mdepth for AC).
Catchment Total depth (m) ZFP depth (m) January-06 February-06 March-06 Totals
Evaporation (mm)
Degraded Forest 1.5 0.45 10.88 9.00 4.20 24.08Forest 1.5 0.45 8.95 4.29 21.56 34.80Acacia 1.5 0.60 8.16 7.68 16.74 32.58
Drainage (mm)
Degraded Forest 1.5 0.45 61.38 18.92 17.72 98.02Forest 1.5 0.45 14.85 36.12 15.95 66.92Acacia 1.5 0.60 14.75 28.61 27.55 70.91
J. Krishnaswamy et al. / Journal of Hydrology 498 (2013) 191–209 203
AUTHOR'S PERSONAL COPY
demands. Bourgeon (1989) recorded many roots in a soil pit in thisregion under evergreen forest up to 1.2 m and beyond. Our fieldobservations of soil exposures in the vicinity of the experimentalbasins also suggest Natural Forest rooting depths extend beyond2 m (Krishnaswamy et al., 2012). As noted above, Kallarackal andSomen (2008) reported that Acacia rooting patterns are mainly inthe upper 1 m, and further suggest their inability to tap deepergroundwater. Thus it appears that the Natural Forest has the great-est ability to support higher transpiration rates in the dry-seasonusing deeper sources of water.
5.9. Dry-season flow in the larger catchments
The time-series of dry-season flow in the basins 1–2 km2 down-stream of the smaller instrumented basins indicates that flow issustained longer into the dry-season in the basin with the highestpercentage forest cover, that is, the Vajagar (Fig. 9, Table 2). On theother hand, the basin with the lowest forest cover, namely Nir-mundagi (NRM), ranks second in sustaining flow the longest intothe dry season. Another interesting feature is that the Kodigibailbasin terminates flow early in the record, despite having the
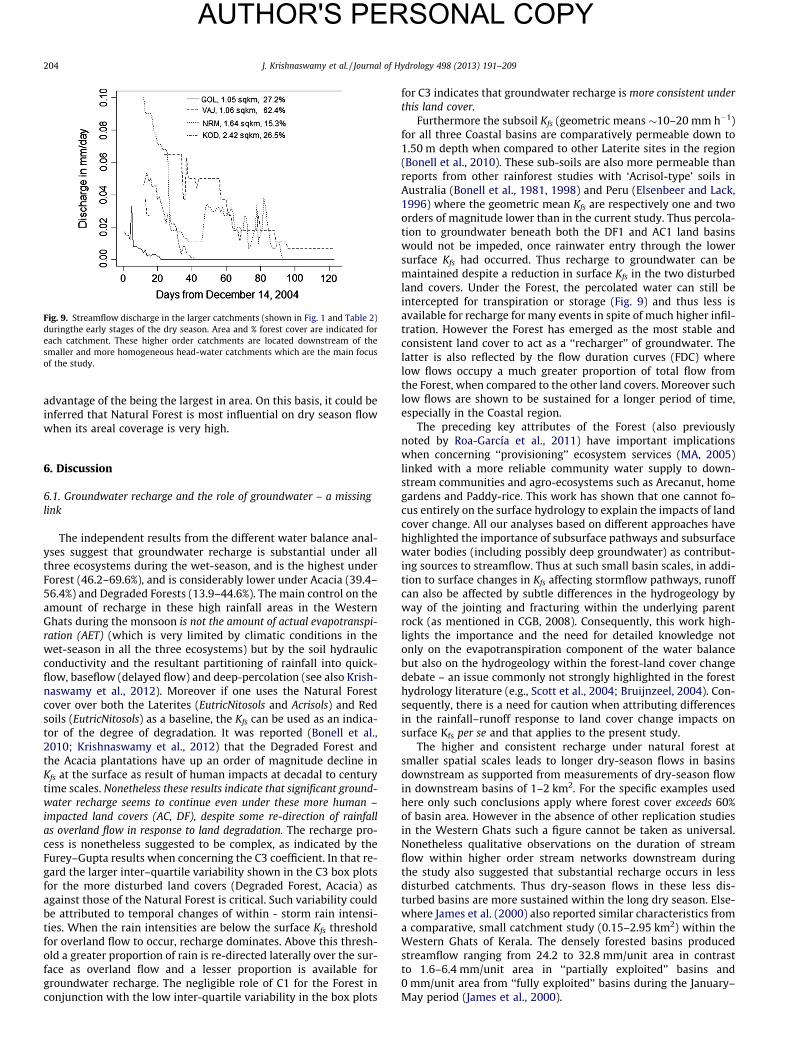
Fig. 9. Streamflow discharge in the larger catchments (shown in Fig. 1 and Table 2)duringthe early stages of the dry season. Area and % forest cover are indicated foreach catchment. These higher order catchments are located downstream of thesmaller and more homogeneous head-water catchments which are the main focusof the study.
204 J. Krishnaswamy et al. / Journal of Hydrology 498 (2013) 191–209
AUTHOR'S PERSONAL COPY
advantage of the being the largest in area. On this basis, it could beinferred that Natural Forest is most influential on dry season flowwhen its areal coverage is very high.
6. Discussion
6.1. Groundwater recharge and the role of groundwater – a missinglink
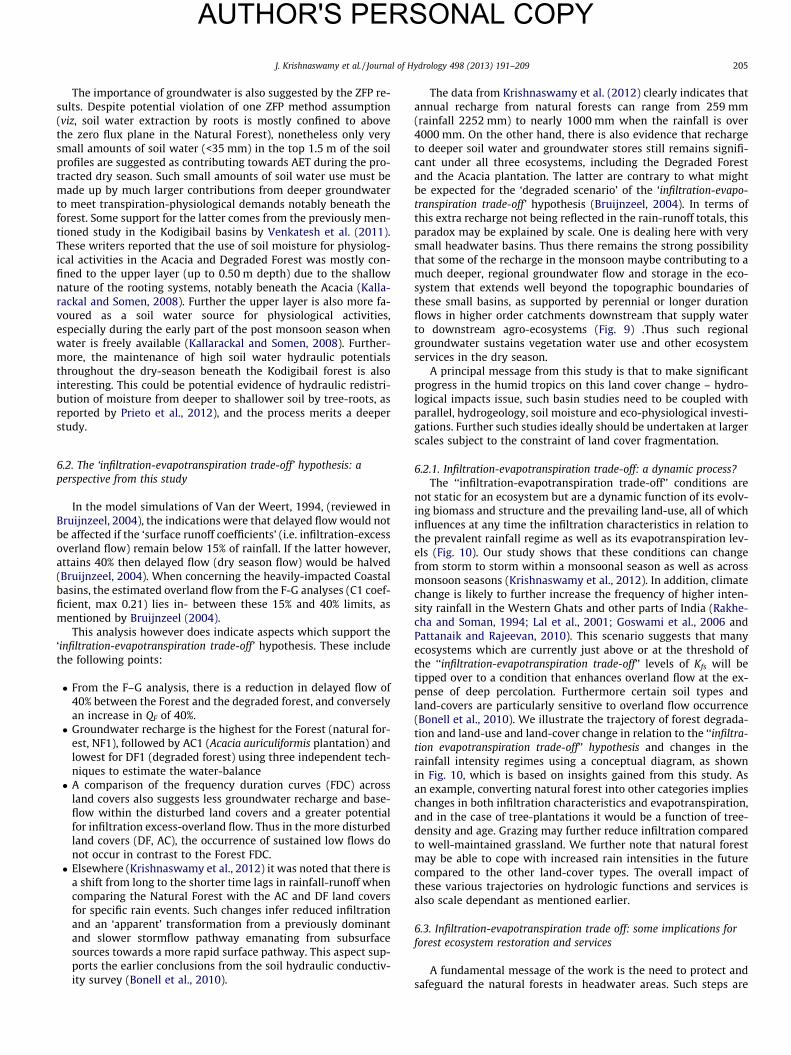
The independent results from the different water balance anal-yses suggest that groundwater recharge is substantial under allthree ecosystems during the wet-season, and is the highest underForest (46.2–69.6%), and is considerably lower under Acacia (39.4–56.4%) and Degraded Forests (13.9–44.6%). The main control on theamount of recharge in these high rainfall areas in the WesternGhats during the monsoon is not the amount of actual evapotranspi-ration (AET) (which is very limited by climatic conditions in thewet-season in all the three ecosystems) but by the soil hydraulicconductivity and the resultant partitioning of rainfall into quick-flow, baseflow (delayed flow) and deep-percolation (see also Krish-naswamy et al., 2012). Moreover if one uses the Natural Forestcover over both the Laterites (EutricNitosols and Acrisols) and Redsoils (EutricNitosols) as a baseline, the Kfs can be used as an indica-tor of the degree of degradation. It was reported (Bonell et al.,2010; Krishnaswamy et al., 2012) that the Degraded Forest andthe Acacia plantations have up an order of magnitude decline inKfs at the surface as result of human impacts at decadal to centurytime scales. Nonetheless these results indicate that significant ground-water recharge seems to continue even under these more human –impacted land covers (AC, DF), despite some re-direction of rainfallas overland flow in response to land degradation. The recharge pro-cess is nonetheless suggested to be complex, as indicated by theFurey–Gupta results when concerning the C3 coefficient. In that re-gard the larger inter–quartile variability shown in the C3 box plotsfor the more disturbed land covers (Degraded Forest, Acacia) asagainst those of the Natural Forest is critical. Such variability couldbe attributed to temporal changes of within - storm rain intensi-ties. When the rain intensities are below the surface Kfs thresholdfor overland flow to occur, recharge dominates. Above this thresh-old a greater proportion of rain is re-directed laterally over the sur-face as overland flow and a lesser proportion is available forgroundwater recharge. The negligible role of C1 for the Forest inconjunction with the low inter-quartile variability in the box plots
for C3 indicates that groundwater recharge is more consistent underthis land cover.
Furthermore the subsoil Kfs (geometric means �10–20 mm h�1)for all three Coastal basins are comparatively permeable down to1.50 m depth when compared to other Laterite sites in the region(Bonell et al., 2010). These sub-soils are also more permeable thanreports from other rainforest studies with ‘Acrisol-type’ soils inAustralia (Bonell et al., 1981, 1998) and Peru (Elsenbeer and Lack,1996) where the geometric mean Kfs are respectively one and twoorders of magnitude lower than in the current study. Thus percola-tion to groundwater beneath both the DF1 and AC1 land basinswould not be impeded, once rainwater entry through the lowersurface Kfs had occurred. Thus recharge to groundwater can bemaintained despite a reduction in surface Kfs in the two disturbedland covers. Under the Forest, the percolated water can still beintercepted for transpiration or storage (Fig. 9) and thus less isavailable for recharge for many events in spite of much higher infil-tration. However the Forest has emerged as the most stable andconsistent land cover to act as a ‘‘recharger’’ of groundwater. Thelatter is also reflected by the flow duration curves (FDC) wherelow flows occupy a much greater proportion of total flow fromthe Forest, when compared to the other land covers. Moreover suchlow flows are shown to be sustained for a longer period of time,especially in the Coastal region.
The preceding key attributes of the Forest (also previouslynoted by Roa-García et al., 2011) have important implicationswhen concerning ‘‘provisioning’’ ecosystem services (MA, 2005)linked with a more reliable community water supply to down-stream communities and agro-ecosystems such as Arecanut, homegardens and Paddy-rice. This work has shown that one cannot fo-cus entirely on the surface hydrology to explain the impacts of landcover change. All our analyses based on different approaches havehighlighted the importance of subsurface pathways and subsurfacewater bodies (including possibly deep groundwater) as contribut-ing sources to streamflow. Thus at such small basin scales, in addi-tion to surface changes in Kfs affecting stormflow pathways, runoffcan also be affected by subtle differences in the hydrogeology byway of the jointing and fracturing within the underlying parentrock (as mentioned in CGB, 2008). Consequently, this work high-lights the importance and the need for detailed knowledge notonly on the evapotranspiration component of the water balancebut also on the hydrogeology within the forest-land cover changedebate – an issue commonly not strongly highlighted in the foresthydrology literature (e.g., Scott et al., 2004; Bruijnzeel, 2004). Con-sequently, there is a need for caution when attributing differencesin the rainfall–runoff response to land cover change impacts onsurface Kfs per se and that applies to the present study.
The higher and consistent recharge under natural forest atsmaller spatial scales leads to longer dry-season flows in basinsdownstream as supported from measurements of dry-season flowin downstream basins of 1–2 km2. For the specific examples usedhere only such conclusions apply where forest cover exceeds 60%of basin area. However in the absence of other replication studiesin the Western Ghats such a figure cannot be taken as universal.Nonetheless qualitative observations on the duration of streamflow within higher order stream networks downstream duringthe study also suggested that substantial recharge occurs in lessdisturbed catchments. Thus dry-season flows in these less dis-turbed basins are more sustained within the long dry season. Else-where James et al. (2000) also reported similar characteristics froma comparative, small catchment study (0.15–2.95 km2) within theWestern Ghats of Kerala. The densely forested basins producedstreamflow ranging from 24.2 to 32.8 mm/unit area in contrastto 1.6–6.4 mm/unit area in ‘‘partially exploited’’ basins and0 mm/unit area from ‘‘fully exploited’’ basins during the January–May period (James et al., 2000).
J. Krishnaswamy et al. / Journal of Hydrology 498 (2013) 191–209 205
AUTHOR'S PERSONAL COPY
The importance of groundwater is also suggested by the ZFP re-sults. Despite potential violation of one ZFP method assumption(viz, soil water extraction by roots is mostly confined to abovethe zero flux plane in the Natural Forest), nonetheless only verysmall amounts of soil water (<35 mm) in the top 1.5 m of the soilprofiles are suggested as contributing towards AET during the pro-tracted dry season. Such small amounts of soil water use must bemade up by much larger contributions from deeper groundwaterto meet transpiration-physiological demands notably beneath theforest. Some support for the latter comes from the previously men-tioned study in the Kodigibail basins by Venkatesh et al. (2011).These writers reported that the use of soil moisture for physiolog-ical activities in the Acacia and Degraded Forest was mostly con-fined to the upper layer (up to 0.50 m depth) due to the shallownature of the rooting systems, notably beneath the Acacia (Kalla-rackal and Somen, 2008). Further the upper layer is also more fa-voured as a soil water source for physiological activities,especially during the early part of the post monsoon season whenwater is freely available (Kallarackal and Somen, 2008). Further-more, the maintenance of high soil water hydraulic potentialsthroughout the dry-season beneath the Kodigibail forest is alsointeresting. This could be potential evidence of hydraulic redistri-bution of moisture from deeper to shallower soil by tree-roots, asreported by Prieto et al., 2012), and the process merits a deeperstudy.
6.2. The ‘infiltration-evapotranspiration trade-off’ hypothesis: aperspective from this study
In the model simulations of Van der Weert, 1994, (reviewed inBruijnzeel, 2004), the indications were that delayed flow would notbe affected if the ‘surface runoff coefficients’ (i.e. infiltration-excessoverland flow) remain below 15% of rainfall. If the latter however,attains 40% then delayed flow (dry season flow) would be halved(Bruijnzeel, 2004). When concerning the heavily-impacted Coastalbasins, the estimated overland flow from the F-G analyses (C1 coef-ficient, max 0.21) lies in- between these 15% and 40% limits, asmentioned by Bruijnzeel (2004).
This analysis however does indicate aspects which support the‘infiltration-evapotranspiration trade-off’ hypothesis. These includethe following points:
� From the F–G analysis, there is a reduction in delayed flow of40% between the Forest and the degraded forest, and converselyan increase in QF of 40%.� Groundwater recharge is the highest for the Forest (natural for-
est, NF1), followed by AC1 (Acacia auriculiformis plantation) andlowest for DF1 (degraded forest) using three independent tech-niques to estimate the water-balance� A comparison of the frequency duration curves (FDC) across
land covers also suggests less groundwater recharge and base-flow within the disturbed land covers and a greater potentialfor infiltration excess-overland flow. Thus in the more disturbedland covers (DF, AC), the occurrence of sustained low flows donot occur in contrast to the Forest FDC.� Elsewhere (Krishnaswamy et al., 2012) it was noted that there is
a shift from long to the shorter time lags in rainfall-runoff whencomparing the Natural Forest with the AC and DF land coversfor specific rain events. Such changes infer reduced infiltrationand an ‘apparent’ transformation from a previously dominantand slower stormflow pathway emanating from subsurfacesources towards a more rapid surface pathway. This aspect sup-ports the earlier conclusions from the soil hydraulic conductiv-ity survey (Bonell et al., 2010).
The data from Krishnaswamy et al. (2012) clearly indicates thatannual recharge from natural forests can range from 259 mm(rainfall 2252 mm) to nearly 1000 mm when the rainfall is over4000 mm. On the other hand, there is also evidence that rechargeto deeper soil water and groundwater stores still remains signifi-cant under all three ecosystems, including the Degraded Forestand the Acacia plantation. The latter are contrary to what mightbe expected for the ‘degraded scenario’ of the ‘infiltration-evapo-transpiration trade-off’ hypothesis (Bruijnzeel, 2004). In terms ofthis extra recharge not being reflected in the rain-runoff totals, thisparadox may be explained by scale. One is dealing here with verysmall headwater basins. Thus there remains the strong possibilitythat some of the recharge in the monsoon maybe contributing to amuch deeper, regional groundwater flow and storage in the eco-system that extends well beyond the topographic boundaries ofthese small basins, as supported by perennial or longer durationflows in higher order catchments downstream that supply waterto downstream agro-ecosystems (Fig. 9) .Thus such regionalgroundwater sustains vegetation water use and other ecosystemservices in the dry season.
A principal message from this study is that to make significantprogress in the humid tropics on this land cover change – hydro-logical impacts issue, such basin studies need to be coupled withparallel, hydrogeology, soil moisture and eco-physiological investi-gations. Further such studies ideally should be undertaken at largerscales subject to the constraint of land cover fragmentation.
6.2.1. Infiltration-evapotranspiration trade-off: a dynamic process?The ‘‘infiltration-evapotranspiration trade-off’’ conditions are
not static for an ecosystem but are a dynamic function of its evolv-ing biomass and structure and the prevailing land-use, all of whichinfluences at any time the infiltration characteristics in relation tothe prevalent rainfall regime as well as its evapotranspiration lev-els (Fig. 10). Our study shows that these conditions can changefrom storm to storm within a monsoonal season as well as acrossmonsoon seasons (Krishnaswamy et al., 2012). In addition, climatechange is likely to further increase the frequency of higher inten-sity rainfall in the Western Ghats and other parts of India (Rakhe-cha and Soman, 1994; Lal et al., 2001; Goswami et al., 2006 andPattanaik and Rajeevan, 2010). This scenario suggests that manyecosystems which are currently just above or at the threshold ofthe ‘‘infiltration-evapotranspiration trade-off’’ levels of Kfs will betipped over to a condition that enhances overland flow at the ex-pense of deep percolation. Furthermore certain soil types andland-covers are particularly sensitive to overland flow occurrence(Bonell et al., 2010). We illustrate the trajectory of forest degrada-tion and land-use and land-cover change in relation to the ‘‘infiltra-tion evapotranspiration trade-off’’ hypothesis and changes in therainfall intensity regimes using a conceptual diagram, as shownin Fig. 10, which is based on insights gained from this study. Asan example, converting natural forest into other categories implieschanges in both infiltration characteristics and evapotranspiration,and in the case of tree-plantations it would be a function of tree-density and age. Grazing may further reduce infiltration comparedto well-maintained grassland. We further note that natural forestmay be able to cope with increased rain intensities in the futurecompared to the other land-cover types. The overall impact ofthese various trajectories on hydrologic functions and services isalso scale dependant as mentioned earlier.
6.3. Infiltration-evapotranspiration trade off: some implications forforest ecosystem restoration and services
A fundamental message of the work is the need to protect andsafeguard the natural forests in headwater areas. Such steps are
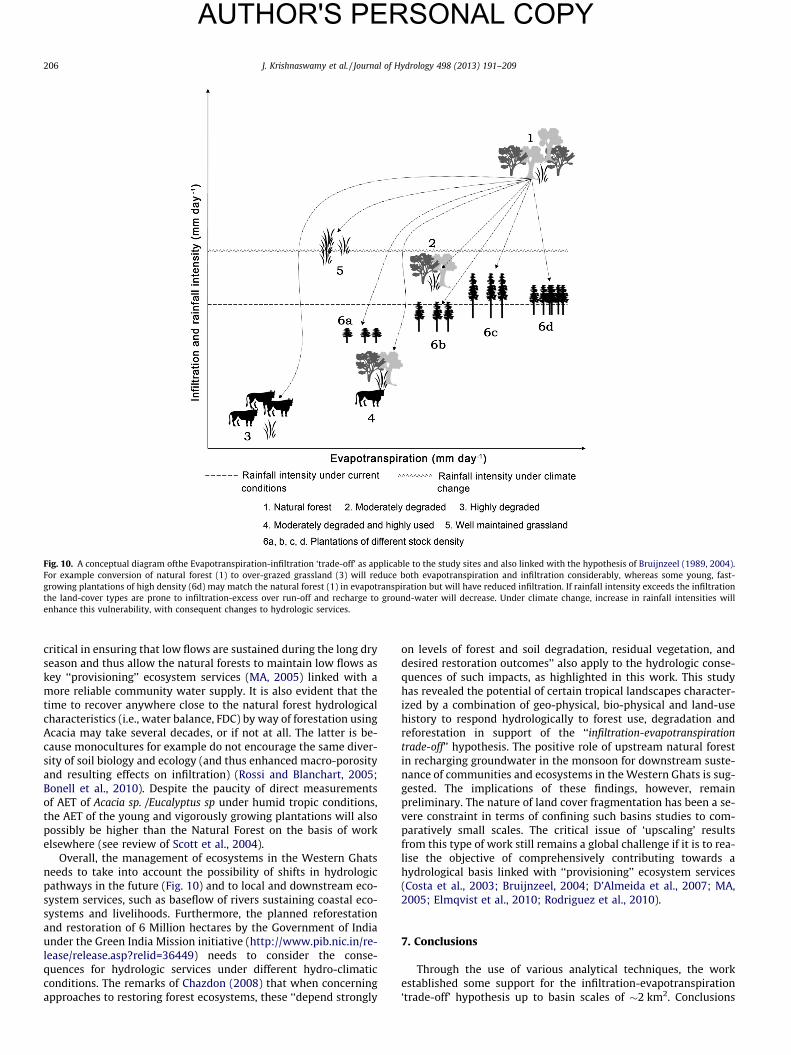
Fig. 10. A conceptual diagram ofthe Evapotranspiration-infiltration ‘trade-off’ as applicable to the study sites and also linked with the hypothesis of Bruijnzeel (1989, 2004).For example conversion of natural forest (1) to over-grazed grassland (3) will reduce both evapotranspiration and infiltration considerably, whereas some young, fast-growing plantations of high density (6d) may match the natural forest (1) in evapotranspiration but will have reduced infiltration. If rainfall intensity exceeds the infiltrationthe land-cover types are prone to infiltration-excess over run-off and recharge to ground-water will decrease. Under climate change, increase in rainfall intensities willenhance this vulnerability, with consequent changes to hydrologic services.
206 J. Krishnaswamy et al. / Journal of Hydrology 498 (2013) 191–209
AUTHOR'S PERSONAL COPY
critical in ensuring that low flows are sustained during the long dryseason and thus allow the natural forests to maintain low flows askey ‘‘provisioning’’ ecosystem services (MA, 2005) linked with amore reliable community water supply. It is also evident that thetime to recover anywhere close to the natural forest hydrologicalcharacteristics (i.e., water balance, FDC) by way of forestation usingAcacia may take several decades, or if not at all. The latter is be-cause monocultures for example do not encourage the same diver-sity of soil biology and ecology (and thus enhanced macro-porosityand resulting effects on infiltration) (Rossi and Blanchart, 2005;Bonell et al., 2010). Despite the paucity of direct measurementsof AET of Acacia sp. /Eucalyptus sp under humid tropic conditions,the AET of the young and vigorously growing plantations will alsopossibly be higher than the Natural Forest on the basis of workelsewhere (see review of Scott et al., 2004).
Overall, the management of ecosystems in the Western Ghatsneeds to take into account the possibility of shifts in hydrologicpathways in the future (Fig. 10) and to local and downstream eco-system services, such as baseflow of rivers sustaining coastal eco-systems and livelihoods. Furthermore, the planned reforestationand restoration of 6 Million hectares by the Government of Indiaunder the Green India Mission initiative (http://www.pib.nic.in/re-lease/release.asp?relid=36449) needs to consider the conse-quences for hydrologic services under different hydro-climaticconditions. The remarks of Chazdon (2008) that when concerningapproaches to restoring forest ecosystems, these ‘‘depend strongly
on levels of forest and soil degradation, residual vegetation, anddesired restoration outcomes’’ also apply to the hydrologic conse-quences of such impacts, as highlighted in this work. This studyhas revealed the potential of certain tropical landscapes character-ized by a combination of geo-physical, bio-physical and land-usehistory to respond hydrologically to forest use, degradation andreforestation in support of the ‘‘infiltration-evapotranspirationtrade-off’’ hypothesis. The positive role of upstream natural forestin recharging groundwater in the monsoon for downstream suste-nance of communities and ecosystems in the Western Ghats is sug-gested. The implications of these findings, however, remainpreliminary. The nature of land cover fragmentation has been a se-vere constraint in terms of confining such basins studies to com-paratively small scales. The critical issue of ‘upscaling’ resultsfrom this type of work still remains a global challenge if it is to rea-lise the objective of comprehensively contributing towards ahydrological basis linked with ‘‘provisioning’’ ecosystem services(Costa et al., 2003; Bruijnzeel, 2004; D’Almeida et al., 2007; MA,2005; Elmqvist et al., 2010; Rodriguez et al., 2010).
7. Conclusions
Through the use of various analytical techniques, the workestablished some support for the infiltration-evapotranspiration‘trade-off’ hypothesis up to basin scales of �2 km2. Conclusions
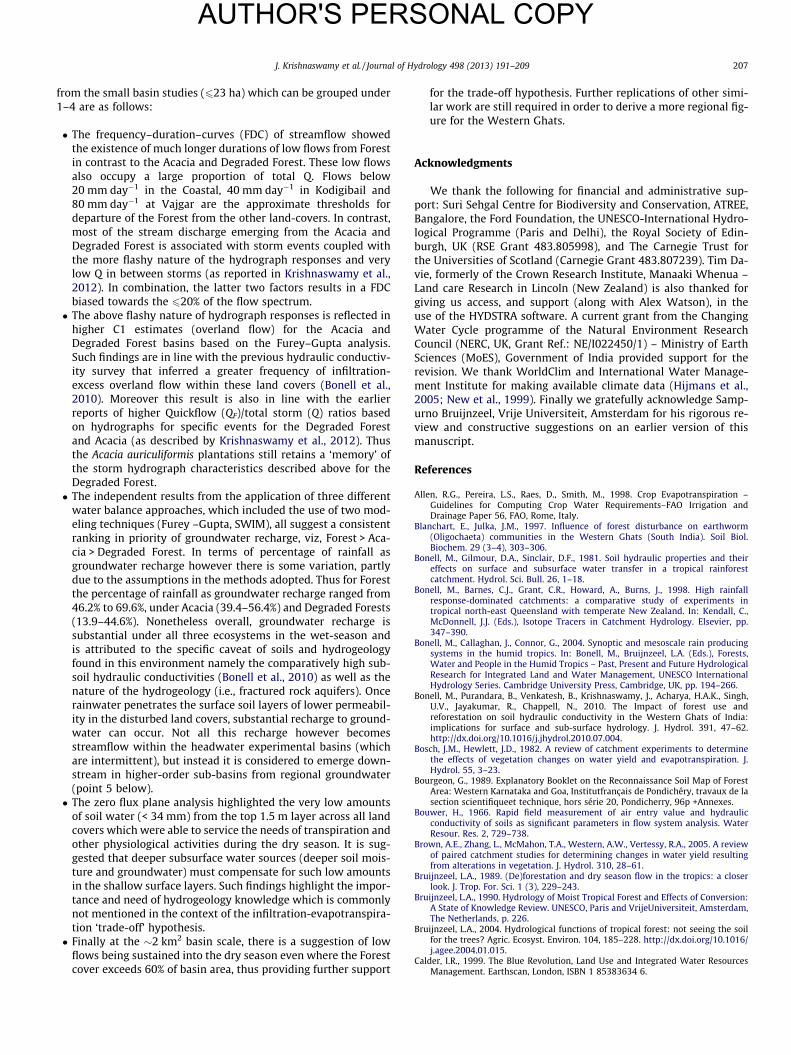
J. Krishnaswamy et al. / Journal of Hydrology 498 (2013) 191–209 207
AUTHOR'S PERSONAL COPY
from the small basin studies (623 ha) which can be grouped under1–4 are as follows:
� The frequency–duration–curves (FDC) of streamflow showedthe existence of much longer durations of low flows from Forestin contrast to the Acacia and Degraded Forest. These low flowsalso occupy a large proportion of total Q. Flows below20 mm day�1 in the Coastal, 40 mm day�1 in Kodigibail and80 mm day�1 at Vajgar are the approximate thresholds fordeparture of the Forest from the other land-covers. In contrast,most of the stream discharge emerging from the Acacia andDegraded Forest is associated with storm events coupled withthe more flashy nature of the hydrograph responses and verylow Q in between storms (as reported in Krishnaswamy et al.,2012). In combination, the latter two factors results in a FDCbiased towards the 620% of the flow spectrum.� The above flashy nature of hydrograph responses is reflected in
higher C1 estimates (overland flow) for the Acacia andDegraded Forest basins based on the Furey–Gupta analysis.Such findings are in line with the previous hydraulic conductiv-ity survey that inferred a greater frequency of infiltration-excess overland flow within these land covers (Bonell et al.,2010). Moreover this result is also in line with the earlierreports of higher Quickflow (QF)/total storm (Q) ratios basedon hydrographs for specific events for the Degraded Forestand Acacia (as described by Krishnaswamy et al., 2012). Thusthe Acacia auriculiformis plantations still retains a ‘memory’ ofthe storm hydrograph characteristics described above for theDegraded Forest.� The independent results from the application of three different
water balance approaches, which included the use of two mod-eling techniques (Furey –Gupta, SWIM), all suggest a consistentranking in priority of groundwater recharge, viz, Forest > Aca-cia > Degraded Forest. In terms of percentage of rainfall asgroundwater recharge however there is some variation, partlydue to the assumptions in the methods adopted. Thus for Forestthe percentage of rainfall as groundwater recharge ranged from46.2% to 69.6%, under Acacia (39.4–56.4%) and Degraded Forests(13.9–44.6%). Nonetheless overall, groundwater recharge issubstantial under all three ecosystems in the wet-season andis attributed to the specific caveat of soils and hydrogeologyfound in this environment namely the comparatively high sub-soil hydraulic conductivities (Bonell et al., 2010) as well as thenature of the hydrogeology (i.e., fractured rock aquifers). Oncerainwater penetrates the surface soil layers of lower permeabil-ity in the disturbed land covers, substantial recharge to ground-water can occur. Not all this recharge however becomesstreamflow within the headwater experimental basins (whichare intermittent), but instead it is considered to emerge down-stream in higher-order sub-basins from regional groundwater(point 5 below).� The zero flux plane analysis highlighted the very low amounts
of soil water (< 34 mm) from the top 1.5 m layer across all landcovers which were able to service the needs of transpiration andother physiological activities during the dry season. It is sug-gested that deeper subsurface water sources (deeper soil mois-ture and groundwater) must compensate for such low amountsin the shallow surface layers. Such findings highlight the impor-tance and need of hydrogeology knowledge which is commonlynot mentioned in the context of the infiltration-evapotranspira-tion ‘trade-off’ hypothesis.� Finally at the �2 km2 basin scale, there is a suggestion of low
flows being sustained into the dry season even where the Forestcover exceeds 60% of basin area, thus providing further support
for the trade-off hypothesis. Further replications of other simi-lar work are still required in order to derive a more regional fig-ure for the Western Ghats.
Acknowledgments
We thank the following for financial and administrative sup-port: Suri Sehgal Centre for Biodiversity and Conservation, ATREE,Bangalore, the Ford Foundation, the UNESCO-International Hydro-logical Programme (Paris and Delhi), the Royal Society of Edin-burgh, UK (RSE Grant 483.805998), and The Carnegie Trust forthe Universities of Scotland (Carnegie Grant 483.807239). Tim Da-vie, formerly of the Crown Research Institute, Manaaki Whenua –Land care Research in Lincoln (New Zealand) is also thanked forgiving us access, and support (along with Alex Watson), in theuse of the HYDSTRA software. A current grant from the ChangingWater Cycle programme of the Natural Environment ResearchCouncil (NERC, UK, Grant Ref.: NE/I022450/1) – Ministry of EarthSciences (MoES), Government of India provided support for therevision. We thank WorldClim and International Water Manage-ment Institute for making available climate data (Hijmans et al.,2005; New et al., 1999). Finally we gratefully acknowledge Samp-urno Bruijnzeel, Vrije Universiteit, Amsterdam for his rigorous re-view and constructive suggestions on an earlier version of thismanuscript.
References
Allen, R.G., Pereira, L.S., Raes, D., Smith, M., 1998. Crop Evapotranspiration –Guidelines for Computing Crop Water Requirements–FAO Irrigation andDrainage Paper 56, FAO, Rome, Italy.
Blanchart, E., Julka, J.M., 1997. Influence of forest disturbance on earthworm(Oligochaeta) communities in the Western Ghats (South India). Soil Biol.Biochem. 29 (3–4), 303–306.
Bonell, M., Gilmour, D.A., Sinclair, D.F., 1981. Soil hydraulic properties and theireffects on surface and subsurface water transfer in a tropical rainforestcatchment. Hydrol. Sci. Bull. 26, 1–18.
Bonell, M., Barnes, C.J., Grant, C.R., Howard, A., Burns, J., 1998. High rainfallresponse-dominated catchments: a comparative study of experiments intropical north-east Queensland with temperate New Zealand. In: Kendall, C.,McDonnell, J.J. (Eds.), Isotope Tracers in Catchment Hydrology. Elsevier, pp.347–390.
Bonell, M., Callaghan, J., Connor, G., 2004. Synoptic and mesoscale rain producingsystems in the humid tropics. In: Bonell, M., Bruijnzeel, L.A. (Eds.), Forests,Water and People in the Humid Tropics – Past, Present and Future HydrologicalResearch for Integrated Land and Water Management, UNESCO InternationalHydrology Series. Cambridge University Press, Cambridge, UK, pp. 194–266.
Bonell, M., Purandara, B., Venkatesh, B., Krishnaswamy, J., Acharya, H.A.K., Singh,U.V., Jayakumar, R., Chappell, N., 2010. The Impact of forest use andreforestation on soil hydraulic conductivity in the Western Ghats of India:implications for surface and sub-surface hydrology. J. Hydrol. 391, 47–62.http://dx.doi.org/10.1016/j.jhydrol.2010.07.004.
Bosch, J.M., Hewlett, J.D., 1982. A review of catchment experiments to determinethe effects of vegetation changes on water yield and evapotranspiration. J.Hydrol. 55, 3–23.
Bourgeon, G., 1989. Explanatory Booklet on the Reconnaissance Soil Map of ForestArea: Western Karnataka and Goa, Institutfrançais de Pondichéry, travaux de lasection scientifiqueet technique, hors série 20, Pondicherry, 96p +Annexes.
Bouwer, H., 1966. Rapid field measurement of air entry value and hydraulicconductivity of soils as significant parameters in flow system analysis. WaterResour. Res. 2, 729–738.
Brown, A.E., Zhang, L., McMahon, T.A., Western, A.W., Vertessy, R.A., 2005. A reviewof paired catchment studies for determining changes in water yield resultingfrom alterations in vegetation. J. Hydrol. 310, 28–61.
Bruijnzeel, L.A., 1989. (De)forestation and dry season flow in the tropics: a closerlook. J. Trop. For. Sci. 1 (3), 229–243.
Bruijnzeel, L.A., 1990. Hydrology of Moist Tropical Forest and Effects of Conversion:A State of Knowledge Review. UNESCO, Paris and VrijeUniversiteit, Amsterdam,The Netherlands, p. 226.
Bruijnzeel, L.A., 2004. Hydrological functions of tropical forest: not seeing the soilfor the trees? Agric. Ecosyst. Environ. 104, 185–228. http://dx.doi.org/10.1016/j.agee.2004.01.015.
Calder, I.R., 1999. The Blue Revolution, Land Use and Integrated Water ResourcesManagement. Earthscan, London, ISBN 1 85383634 6.
208 J. Krishnaswamy et al. / Journal of Hydrology 498 (2013) 191–209
AUTHOR'S PERSONAL COPY
Central Groundwater Board, 2008. Groundwater Information Booklet – UttaraKannada District, Karnataka. Government of India, Ministry of Water Resources,Central Groundwater Board, South Western Region, Bangalore, November 2008,pp. 24 +Appendices.
Chazdon, L.R., 2008. Beyond deforestation: restoring forests and ecosystem serviceson degraded lands. Science 5882 (320), 1458–1460.
Chiew, F.H.S., McMahon, T.A., 1991. The applicability of morton’s and penman’sevapotranspiration estimates in rainfall-runoff modeling. JAWRA, J. Am. WaterResour. Assoc. 27, 611–620. http://dx.doi.org/10.1111/j.1752-1688.1991.tb01462.x.
Cook, P.G., 2003. A Guide to Regional Groundwater Flow in Fractured Rock Aquifers.CSIRO-Seaview Press, South Australia, p. 108.
Cooper, J.D., 1980. Measurements of Water Fluxes in Unsaturated Soil in ThetfordForest. Report 66. Institute of Hydrology, Wallingford.
Costa, M.H., Botta, A., Cardille, J.A., 2003. Effects of large-scale changes in land coveron the discharge of the Tocantins River, Southeastern Amazonia. J. Hydrol. 283,206–217.
D’Almeida, C., Vorosmarty, C.J., Hurtt, G.C., Marengo, J.A., Dingman, S.L., Keim, B.D.,2007. The effects of deforestation on the hydrological cycle in Amazonia: areview on scale and resolution. Int. J. Climatol. 27, 633–647. http://dx.doi.org/10.1002/joc.1475.
Das, A., Krishnaswamy, J., Bawa, K.S., Kiran, M.C., Srinivas, V., Kumar, N.S., Karanth,K.U., 2006. Prioritisation of conservation areas in the western ghats, India. Biol.Conserv. 133, 16–31, http://dx.doi.org/10.1016/j.biocon.2006.05.023.
DeFries, R., Eshleman, K.N., 2004. Land-use change and hydrologic processes: amajor focus for the future. Hydrol. Process. 18, 2183–2186.
Elmqvist, T., Tuvendal, M., Krishnaswamy, J., Hylander, K., 2010. EcosystemServices: Managing trade – offs between provisioning and regulating services.In: Kumar, P., Mike Wood, M. (Eds.), Valuation of Regulating Services ofEcosystems: Methodology and Applications. Routledge, London, New York.
Elsenbeer, H., Lack, A., 1996. Hydrometric and hydrochemical evidence for fastflowpaths at La Cuenca, Western Amazonia. J. Hydrol. 180, 237–250.
FAO, 1998. World Reference Base for Soil Resources. FAO-UN, Rome.FAO-UNESCO, 1974. FAO-UNESCO Soil map of the world. Legend, UNESCO Press,
Paris (Later revised as FAO-UNESCO, 1988. Soil Map of the World, vol. 1. RevisedLegend. World Soil Resources Report 60, FAO, Rome).
Furey, P.R., Gupta, V.K., 2001. A physically based filter for separating base flow fromstreamflow time series. Water Resour. Res. 37, 2709–2722.
Geological Survey of India, 1981. Geological and Mineral Map of Karnataka andGoa.Geological Survey of India, Calcutta.
Geological Survey of India, 2006. Miscellaneous Publication 30. Part VII. Karnatakaand Goa.
Goswami, B.N., Venugopal, V., Sengupta, D., Madhusoodanan, M.S., Xavier, P.K.,2006. Increasing trend of extreme rain events over India in a warmingenvironment. Science 314, pp. 1442–1445.
Gunnell, Y., 1997. Relief and climate in South Asia: the influence of the WesternGhats on the current climate pattern of peninsular India. Int. J. Climatol. 17,1169–1182.
Gunnell, Y., Radhakrishna, B.P., 2001. Sahyadri: The Great Escarpment of the IndianSubcontinent (Patterns of Landscape Development in the Western Ghats).Geological Society of India, Bangalore, p. 1054.
Hijmans, R.J., Cameron, S.E., Parra, J.L., Jones, P.G., Jarvis, A., 2005. Very highresolution interpolated climate surfaces for global land areas. Int. J. Climatol. 25,1965–1978.
James, E.J., Kumar, P.K.P., Nandeshwar, M.D., Kandasamy, L.C., Ranganna, G., 2000.Investigations on the hydrology of forest watersheds in the Western Ghats. In:Varadan, K.M. (Ed.), Proc. Worskhop on Watershed Development in the WesternGhats Region of India, 28–29 Febraury 2000. Centre for Water resourcesDevelopment and Management, Kozhikode 673 571, Kerala, pp. 30–43.
Jensen, M.E., Burman, R.D., Allen, R.G., 1990. Evapotranspiration and IrrigationWater Requirements. ASCE Manuals and Reports on Engineering Practice No.70, ASCE, New York.
Kallarackal, J., Somen, C.K., 2008. Water loss from tree plantations in the tropics.Curr. Sci. 94 (2), 201–210.
Khalil, M., Sakai, M., Mizoguchi, M., Miyazaki, T., 2003. Current and prospectiveapplications of zero flux plane (ZFP) method. J. Jpn. Soc. Soil Phys. 95, 75–90.
Kirsch, S.W., 1993. A field Test of a soil-based measure of evaporatranspiration. SoilSci. 156, 396–404.
Krishnaswamy, J., Bonell, M., Venkatesh, B., Purandara, B.K., Lele, S., Kiran, M.C.,Reddy, V.B., Badiger, S., Rakesh, K.N., 2012. The rain runoff response of tropicalhumid forest ecosystems to use and reforestation in the western ghats of India.J. Hydrol. 472, 216–237.
Kume, T., Tanaka, Nobuaki, Kuraji, Koichiro, Komatsu, Hikaru, Yoshifuji, Natsuko,Saitoh, Taku M., Suzuki, Masakazu, Tomo’omiKumagai, 2011. Ten-yearevapotranspiration estimates in a Bornean tropical rainforest, Agri. For.Meteorol. 151(9), 1183–1192. ISSN 0168-1923, 10.1016/j.agrformet.2011.04.005. <http://www.sciencedirect.com/science/article/pii/S0168192311001183>.
Lal, M., Nozawa, T., Emori, S., Harasawa, H., Takahashi, K., Kimoto, M., Abe-Ouchi, A.,Nakajima, T., Takemura, T., Numaguti, A., 2001. Climate change: implication forindian summer monsoon and its variability. Curr. Sci. 9 (81), 1196–1207.
Ledger, D.C., 1975. The water balance of an exceptionally wet catchment area inWest Africa. J. Hydrol. 24, 207–214, http://dx.doi.org/10.1016/0022-1694(75)90081-5.
Limbrick, K.J., 2002. Estimating daily recharge to the Chalk aquifer of southernEngland – a simple methodology. Hydrol. Earth Syst. Sci. 6 (3), 485–496.
MA, 2005. Millennium Ecosystem Assessment (2005) General Synthesis Report.Island Press, Washington, DC.
Menon, S., Bawa, K.S., 1998. Deforestation in the tropics: reconciling disparities inestimates for India. Ambio 27, 576–577.
Nandagiri, L., Kovoor, G., 2006. Performance evaluation of referenceevapotranspiration equations across a range of Indian climates. J. Irrig. DrainEng. 132 (3), 238–249, doi: 10.1061/(ASCE)0733-9437(2006)132:3(238).
NBSSLUP, 1993. Land Evaluation for Land Use Planning. Bull. No. 42, NationalBureau of Soil Survey and Land Use Planning, Nagpur, India.
New, M., Hulme, M., Jones, P., 1999. Representing twentieth-century space–timeclimate variability. Part I: Development of a 1961–90 Mean Monthly terrestrialclimatology. J. Climate. 12, 829–856.
Oishi, A.C., Oren, R., Novick, K.A., Palmroth, S., Katul, G.G., 2010. Interannualinvariability of forest evapotranspiration and its consequence to water flowdownstream. Ecosystems 13 (3), 421–436.
Palmroth, S., Katul, G.G., Hui, D., McCarthy, H.R., Jackson, R.B., Oren, R., 2010.Estimation of long-term basin scale evapotranspiration from streamflow timeseries. Water Resour. Res. 46, W10512.
Pascal, J.P., 1982. Bioclimates of the Western Ghats on 1/500,000, 2 Sheets. InstituteFrancais de Pondichery, Travaux de la Section Scientifiqueet technique, Hors.Serie. No. 17.
Pascal, J.P., 1984. (with the collaboration of Shyam Sunder, S. & Meher – Hornji,V.M.). Forest Map of South India-Sheet: Belgaum–Dharwar–Panaji. Published bythe Karnataka and Goa Forest Department and the French Institute ofPondicherry. Inst. Fr. Pondichery, Trav. SEC. Sci. Tech. Hors. Serie. 18c.
Pascal, J.P., 1986. Explanatory Booklet on the Forest Map of South India- Sheets:Belgaum–Dharwar–Panaji; Shimoga; Mercara-Mysore. Karnataka ForestDepartment and the French Institute of Pondicherry, Rapport Institut françaisPondichéry, Trav.Sec.Sci.Tech. Hors.Serie. 18.
Pascal, J.P., 1988. Wet evergreen forests of the Western Ghats of India. Inst.fr.Pondichery, Trav. Sec. Sci. Tech., Tome 20 bis, p. 345.
Pattanaik, D.R., Rajeevan, M., 2010. Variability of extreme rainfall events over Indiaduring southwest monsoon season. Meteorol. Appl. 17, 88–104.
Pomeroy, M., Primack, R., Rai, S.N., 2003. Changes in four rainforest plots of theWestern Ghats, India, 1939–1993. Conserv. Soc. 1, 113–135.
Pontius, R.G., Pacheco, P., 2004. Calibration and validation of a model of forestdisturbance in the Western Ghats, India 1920–1990. GeoJournal 61 (4), 325–334. http://dx.doi.org/10.1007/s10708-004-5049-5.
Prieto, I., Armas, C., Pugnaire, F., 2012. Water release through plant roots: newinsights into its consequences at the plant and ecosystem level. New Phytol.193, 830–841.
Priya, D., Prita, D., Arjun, M., Pratjeesj, C.M., Carrigues, J.P., Puryavaud, J.P.,Roessingh, K., 2007. Forest degradation in the Western Ghats biodiversityhotspot, Resources collection, livelihood concersn and sustainability. Curr. Sci.93 (11), 1573–1578.
Putty, M.R.Y., Prasad, R., 2000a. Run off processes in head water catchment – anexperimental study in Western Ghats in South India. J. Hydrol. 235, 63–71.
Putty, M.R.Y., Prasad, R., 2000b. Understanding runoff processes using a watershedmodel—a case study in the Western Ghats in South India. J. Hydrol. 228, 215–227.
Rai, S.N., 1999. Nursery and Planting Techniques of Forest Trees in Tropical South-Asia. Punarvasu publications, Dharwad, Karantaka – Eastern Press, Bangalore,India. 217 pp.
Rai, N.D., 2004. The Socio-economic and ecological impact of Garciniagumm-guttafruit harvest in the Western Ghats, India. In: Kusters, Koen, Belcher, Brian (Eds.),Forest Products, Livelihoods and Conservation. Case Studies of Non-TimberForest Product Systems, vol. 1. CIFOR, Asia, pp. 23–42.
Rakhecha, P.R., Soman, M.K., 1994. Trends in the annual extreme rainfall events of1–3 days duration over India. Theor. Appl. Climatol. 48, 227–237.
Ramesh, B.R., Pascal, J., 1997. Atlas of endemics of the Western Ghats (India):Distribution of Tree Species in the Evergreen and Semi-evergreen Forests.Institut Francais de Pondichery, Publications du department d’ecologie, p. 38.
Ramesh, B.R., Swaminath, M.H., (with many collaborators), 1999. Assessment andConservation of Forest Biodiversity in the Western Ghats of Karnataka, India.French Institute of Pondicherry in Collaboration with the Karnataka ForestDepartment and FondsFrançais de l’EnvironnementMondial, December 1999,Report available from l’InsitutFrançais de Pondicherry, 126 pp (text plusbibliography, maps, colour plates, 5 Annexes).
Roa-García, M.C., Brown, S., Schreier, H., Lavkulich, L.M., 2011. The role of land useand soils in regulatingwater flow in small headwater catchments of the Andes.Water Resour. Res. 47, W05510. http://dx.doi.org/10.1029/2010WR009582.
Roberts, J.M., Gash, J.H.C., Tani, M., Bruijnzeel, L.A., 2004. Controls on evaporation inlowland tropical rainforest. In: Bonell, M., Bruijnzeel, L.A. (Eds.), Forests, Waterand People in the Humid Tropics – Past, Present and Future HydrologicalResearch for Integrated Land and Water Management. InternationalHydrological Series, Cambridge University Press, Cambridge, UK, pp.287–313.
Rodriguez, D.A., Tomasella, J., Linhares, C., 2010. Is forest conversion to pastureaffecting the hydrological response of Amazonian catchments? Signals in the Ji-Parana Basin. Hydrol. Process. 24 (10), 1254–1269.
Rossi, J.P., Blanchart, E., 2005. Seasonal and land-use induced variation of soil macrofauna composition in the Western Ghats, southern India. Soil Biol. Biochem. 37(6), 1093–1104.
Scott, D.F., Bruijnzeel, L.A., Mackensen, J., 2004. The hydrological impacts ofreforestation of grasslands, natural and degraded and of degraded forest in thetropics. In: Bonell, M., Bruijnzeel, L.A. (Eds.), Forests, Water andPeople in the

J. Krishnaswamy et al. / Journal of Hydrology 498 (2013) 191–209 209
AUTHOR'S PERSONAL COPY
Humid Tropics: Past, Present and Future Hydrological Research forIntegratedLand and Water Management. UNESCO-Cambridge University Press,Cambridge, UK, pp. 622–651.
Seen, D.L., Ramesh, B.R., Nair, K.M., Martin, M., Arrouay, D., Bourgeon, G., 2010. Soilcarbon stocks, deforestation and land-cover changes in the Western Ghatsbiodiversity hotspot (India). Glob. Change Biol. 16, 1777–1792. http://dx.doi.org/10.1111/j.1365-2486.2009.02127.x.
Shivaprasad, C.R., Reddy, R.S., Sehgal, J., Velayutham, M., 1998. Soils of Karnataka,Soils of India Series, National Bureau of Soil Survey and Land Use Planning(NBSSLUP), Publ. No. 47, 88 pp.
Smakhtin, V.U., 2001. Low flow hydrology.arivew. J. Hydrol. 240, 147–186 <http://dx.doi.org/10.1016/S0022-1694(00)00340-1>.
Soil Survey Staff, 1975 (later 2nd ed. 1999). Soil Taxonomy: A Basic System of SoilClassification for Making and Interpreting Soil Surveys. US Department ofAgriculture Handbook No. 436, 754 pp.
Stonestrom, D.A., Scanlon, B.R., Zhang, L., 2009. Introduction to special section onimpacts of land use change on water resources. Water Resour. Res. 45. http://dx.doi.org/10.1029/2009WR007937, 2009.
Turc, L., 1961. Evaluation de besoins en eau d’irrigation, ET potentielle. Ann. Agron.12, 13–49.
Turner, M.G., Hargrove, W.W., Gardner, R.H., Romme, W.H., 1994. Effects of fire onlandscape heterogeneity in Yellowstone National Park, Wyoming. J. Veg. Sci. 5,731–742.
Venkatesh, B., Lakshman, N., Purandara, B.K., Reddy, V.B., 2011. Analysis of observedsoil moisture patterns under different land covers in Western Ghats, India. J.Hydrol. 397, 281–294.
Verburg, K., 1996. Methodology in soil water and solute balance modelling: anevaluation of the APSIM-Soil Wat and SWIMv2 models ISBN 0 643 05868 0.Adelaide: CSIRO Division of Soils. Divisional Report.
Vogel, R.M., Fennessey, N.M., 1994. Flow Duration Curves I: New interpretation andconfidence intervals. J. Water Resour. Plann. Manage. 120, 485–504.
Vogel, R.M., Fennessey, N.M., 1995. Flow Duration Curves II: a review of applicationin water resource planning. JAWRA 31, 1029–1039.
Vorosmarty, C.J., Sahagian, D., 2000. antropogenic disturbance of the terrestrialwater cycle. Bioscience 50 (9), 753–765.
Wellings, S.R., Bell, J.P., 1980. Movement of water and nitrate in the unsaturatedzone of Upper Chalk near Winchester Hants, England. J. Hydrol. 48, 119–136.
Yoder, R.E., Odiahambo, L.O., Wright, W.C., 2005. Evalaution of methods forestimating daily reference crop evapotranspiration at a site in humid southeast United States. Appl. Eng. Agri. (ASAE) 21, 197–202.