Embed Size (px)
Citation preview
1
2
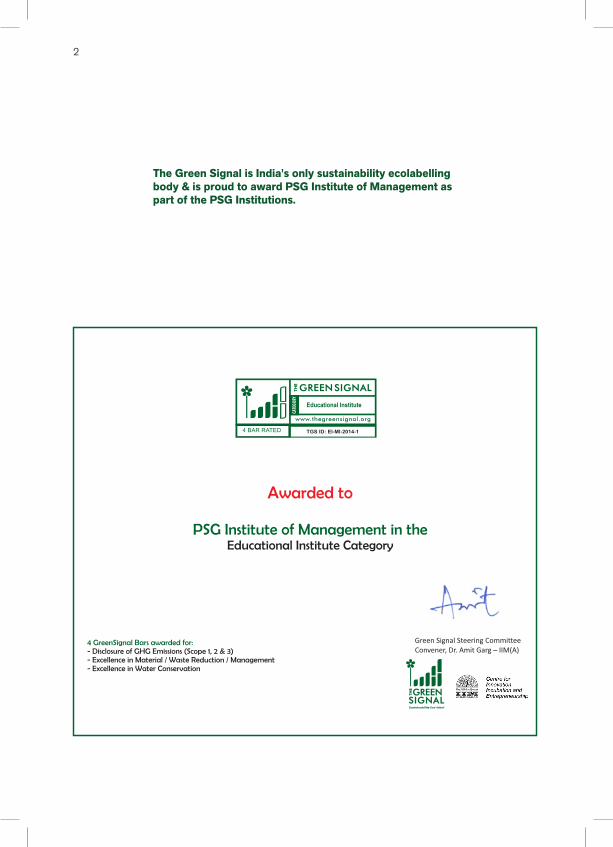
The Green Signal is India's only sustainability ecolabelling body & is proud to award PSG Institute of Management as part of the PSG Institutions.
Awarded to
PSG Institute of Management in the Educational Institute Category
4 GreenSignal Bars awarded for:- Disclosure of GHG Emissions (Scope 1, 2 & 3)- Excellence in Material / Waste Reduction / Management- Excellence in Water Conservation
Green Signal Steering CommitteeConvener, Dr. Amit Garg – IIM(A)
4 BAR RATED
Educational Institute
TGS ID: EI-MI-2014-1
3
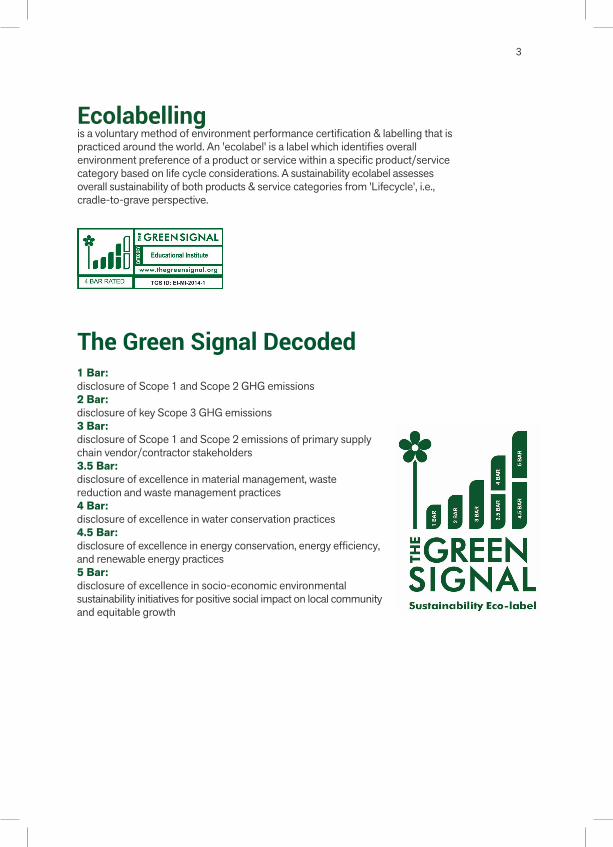
Ecolabelling is a voluntary method of environment performance certification & labelling that is practiced around the world. An 'ecolabel' is a label which identifies overall environment preference of a product or service within a specific product/service category based on life cycle considerations. A sustainability ecolabel assesses overall sustainability of both products & service categories from 'Lifecycle', i.e., cradle-to-grave perspective.
The Green Signal Decoded1 Bar: disclosure of Scope 1 and Scope 2 GHG emissions2 Bar: disclosure of key Scope 3 GHG emissions3 Bar: disclosure of Scope 1 and Scope 2 emissions of primary supply chain vendor/contractor stakeholders3.5 Bar: disclosure of excellence in material management, waste reduction and waste management practices4 Bar: disclosure of excellence in water conservation practices4.5 Bar: disclosure of excellence in energy conservation, energy efficiency, and renewable energy practices5 Bar: disclosure of excellence in socio-economic environmental sustainability initiatives for positive social impact on local community and equitable growth
Contents
Background 06Project Objective 06Introduction 07Meaning of Sustainability to PSGIM 08Why - 'The Green Signal Ecolabelling'? 09
Ecolabelling Framework 10Defining Organizational Boundary 11Defining Operational Boundary 12
GHG Inventory of PSGIM 14
PSGIM GHG Emissions 16
Positive Environmental ImpactsSolid Waste Management 20Wastewater Management 22
4
Materiality and Waste Reduction / Management 24Biodegradable / Low-Embodied carbon / Recycled Materials Procurement 25Water Conservation Practices 27Energy Conservation Practices 28Sustainability Practices 33
Reaching Higher — Sustainability at PSGIM 36
5
6
BackgroundThe conventional definitions of ‘green institutions’ in India are based largely on design intent, suppositions, rules-of-thumb, and general notions of ‘green versus not-green’ practices. In general, the paradigm of defining ‘green’ through accurate measurement of environmental impacts of design, construction and operational activities of organizations is not prevalent in India. The practice has manifested itself by relying mainly on qualitative ‘checklist’ based approaches to strive towards greener development of institutions.
This Ecolabelling report seeks to provide a comprehensive overview of the environmental practices of the PSG Institute of management based on a meticulous evaluation of its operational activities - for the primary purpose of acquiring the highest possible rating awarded by the The Green Signal Ecolabelling Body instituted by Centre for Innovation, Incubation and Entrepreneurship at IIM(A).
Project ObjectiveThe Green Signal Certification for PSG Institute of Management, Coimbatore campus which will enable it to become the First Ecolabelled Educational Institution in India.
The purpose of this study was to collect, collate, document, verify and analyse all data related to activities contributing to the carbon footprint and sustainability best practices followed by PSG Institute of Management, as per ecolabelling methodology for educational institutions defined by The Green Signal and included within the scope of the project.
As part of the overarching objective, the project aims to provide an assessment on all relevant consumption activities to yield an in-depth overview of the resource intensive hot-spots and carbon risks.
6
7
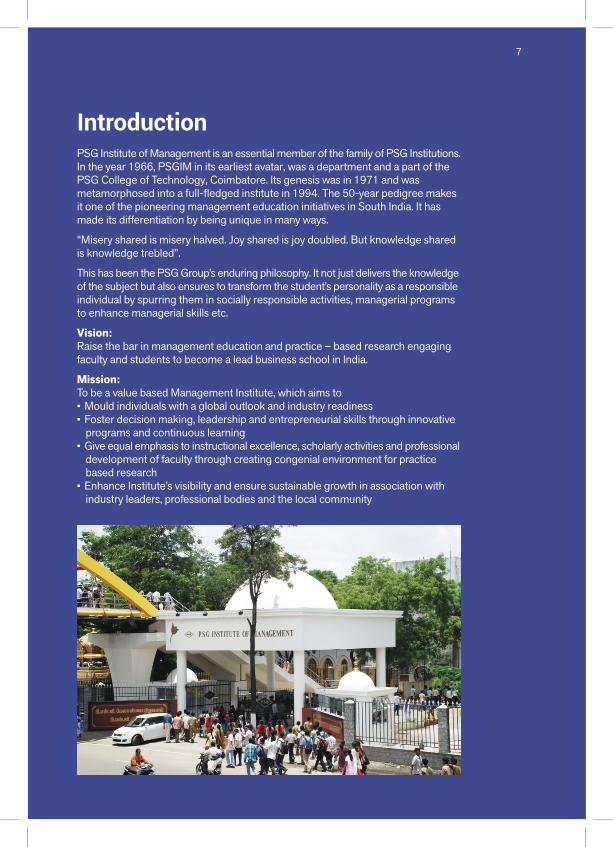
IntroductionPSG Institute of Management is an essential member of the family of PSG Institutions. In the year 1966, PSGIM in its earliest avatar, was a department and a part of the PSG College of Technology, Coimbatore. Its genesis was in 1971 and was metamorphosed into a full-fledged institute in 1994. The 50-year pedigree makes it one of the pioneering management education initiatives in South India. It has made its differentiation by being unique in many ways.
“Misery shared is misery halved. Joy shared is joy doubled. But knowledge shared is knowledge trebled”.
This has been the PSG Group’s enduring philosophy. It not just delivers the knowledge of the subject but also ensures to transform the student’s personality as a responsible individual by spurring them in socially responsible activities, managerial programs to enhance managerial skills etc.
Vision:Raise the bar in management education and practice – based research engaging faculty and students to become a lead business school in India.
Mission: To be a value based Management Institute, which aims to•Mould individuals with a global outlook and industry readiness•Foster decision making, leadership and entrepreneurial skills through innovative
programs and continuous learning•Give equal emphasis to instructional excellence, scholarly activities and professional
development of faculty through creating congenial environment for practice based research
•Enhance Institute’s visibility and ensure sustainable growth in association with industry leaders, professional bodies and the local community
7
8
Meaning of Sustainability to PSGIM
Sustainability is more than ensuring that our future generations have their rightful share of natural resources. It is treating the environment with respect and owning responsibility for our actions. As an academic institution, PSGIM believes it needs to sensitize students to the current environmental degradation that is going on in the name of “modernization” and to help them identify alternate paths for development. Accordingly, students are taught a course on Environmental Management and in addition participate in social initiatives to protect and preserve the environment.
9
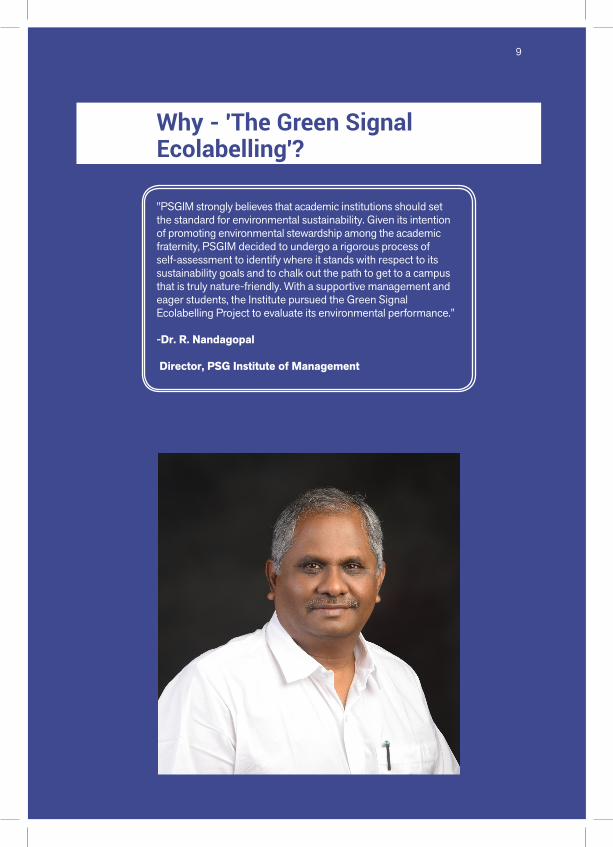
Why - 'The Green Signal Ecolabelling'? "PSGIM strongly believes that academic institutions should set the standard for environmental sustainability. Given its intention of promoting environmental stewardship among the academic fraternity, PSGIM decided to undergo a rigorous process of self-assessment to identify where it stands with respect to its sustainability goals and to chalk out the path to get to a campus that is truly nature-friendly. With a supportive management and eager students, the Institute pursued the Green Signal Ecolabelling Project to evaluate its environmental performance.”
-Dr. R. Nandagopal
Director, PSG Institute of Management
10
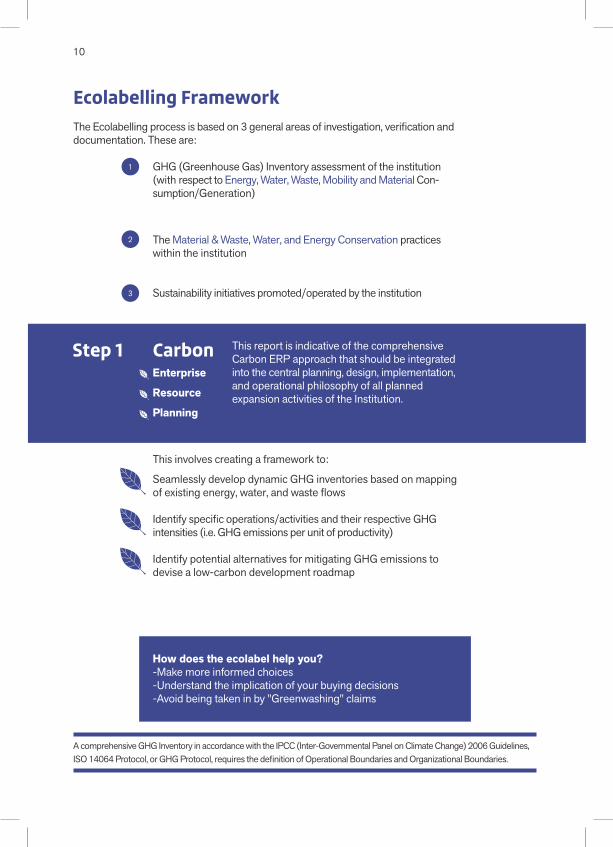
Ecolabelling FrameworkThe Ecolabelling process is based on 3 general areas of investigation, verification and documentation. These are:
Seamlessly develop dynamic GHG inventories based on mapping of existing energy, water, and waste flows
Identify specific operations/activities and their respective GHG intensities (i.e. GHG emissions per unit of productivity)
Identify potential alternatives for mitigating GHG emissions to devise a low-carbon development roadmap
This involves creating a framework to:
A comprehensive GHG Inventory in accordance with the IPCC (Inter-Governmental Panel on Climate Change) 2006 Guidelines, ISO 14064 Protocol, or GHG Protocol, requires the definition of Operational Boundaries and Organizational Boundaries.
Sustainability initiatives promoted/operated by the institution
The Material & Waste, Water, and Energy Conservation practices within the institution
GHG (Greenhouse Gas) Inventory assessment of the institution (with respect to Energy, Water, Waste, Mobility and Material Con-sumption/Generation)
Step 1 CarbonEnterprise
Resource
Planning
How does the ecolabel help you?-Make more informed choices-Understand the implication of your buying decisions-Avoid being taken in by "Greenwashing" claims
This report is indicative of the comprehensive Carbon ERP approach that should be integrated into the central planning, design, implementation, and operational philosophy of all planned expansion activities of the Institution.
1
2
3
11
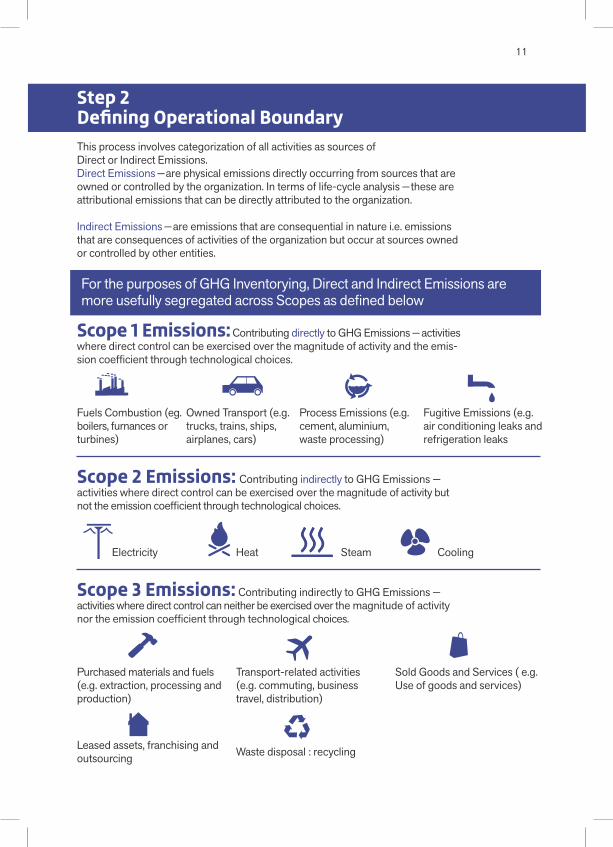
Step 2 Defining Operational BoundaryThis process involves categorization of all activities as sources of Direct or Indirect Emissions. Direct Emissions — are physical emissions directly occurring from sources that are owned or controlled by the organization. In terms of life-cycle analysis — these are attributional emissions that can be directly attributed to the organization.
Indirect Emissions — are emissions that are consequential in nature i.e. emissions that are consequences of activities of the organization but occur at sources owned or controlled by other entities.
Scope 1 Emissions: Contributing directly to GHG Emissions — activities where direct control can be exercised over the magnitude of activity and the emis-sion coefficient through technological choices.
Scope 2 Emissions: Contributing indirectly to GHG Emissions — activities where direct control can be exercised over the magnitude of activity but not the emission coefficient through technological choices.
Scope 3 Emissions: Contributing indirectly to GHG Emissions — activities where direct control can neither be exercised over the magnitude of activity nor the emission coefficient through technological choices.
Electricity
Purchased materials and fuels (e.g. extraction, processing and production)
Transport-related activities (e.g. commuting, business travel, distribution)
Heat Steam
Waste disposal : recycling
Sold Goods and Services ( e.g. Use of goods and services)
Leased assets, franchising and outsourcing
Cooling
Owned Transport (e.g. trucks, trains, ships, airplanes, cars)
Fuels Combustion (eg. boilers, furnances or turbines)
Process Emissions (e.g. cement, aluminium, waste processing)
Fugitive Emissions (e.g. air conditioning leaks and refrigeration leaks
For the purposes of GHG Inventorying, Direct and Indirect Emissions are more usefully segregated across Scopes as defined below
12
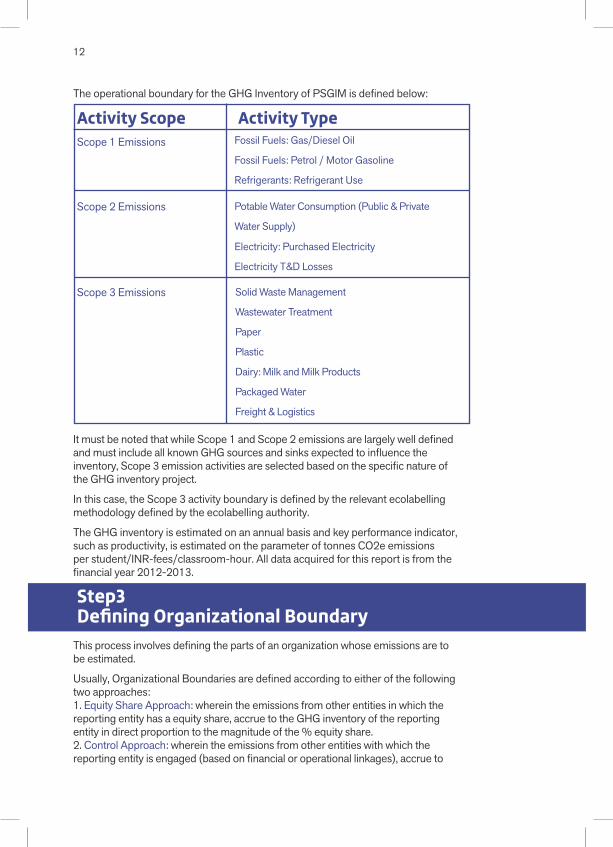
The operational boundary for the GHG Inventory of PSGIM is defined below:
Solid Waste Management
Wastewater Treatment
Paper
Plastic
Dairy: Milk and Milk Products
Packaged Water
Freight & Logistics
Potable Water Consumption (Public & Private
Water Supply)
Electricity: Purchased Electricity
Electricity T&D Losses
Activity TypeFossil Fuels: Gas/Diesel Oil
Fossil Fuels: Petrol / Motor Gasoline
Refrigerants: Refrigerant Use
Activity ScopeScope 1 Emissions
Scope 2 Emissions
Scope 3 Emissions
Step3Defining Organizational Boundary
This process involves defining the parts of an organization whose emissions are to be estimated.
Usually, Organizational Boundaries are defined according to either of the following two approaches:1. Equity Share Approach: wherein the emissions from other entities in which the reporting entity has a equity share, accrue to the GHG inventory of the reporting entity in direct proportion to the magnitude of the % equity share.2. Control Approach: wherein the emissions from other entities with which the reporting entity is engaged (based on financial or operational linkages), accrue to
It must be noted that while Scope 1 and Scope 2 emissions are largely well defined and must include all known GHG sources and sinks expected to influence the inventory, Scope 3 emission activities are selected based on the specific nature of the GHG inventory project.
In this case, the Scope 3 activity boundary is defined by the relevant ecolabelling methodology defined by the ecolabelling authority.
The GHG inventory is estimated on an annual basis and key performance indicator, such as productivity, is estimated on the parameter of tonnes CO2e emissions per student/INR-fees/classroom-hour. All data acquired for this report is from the financial year 2012-2013.
13
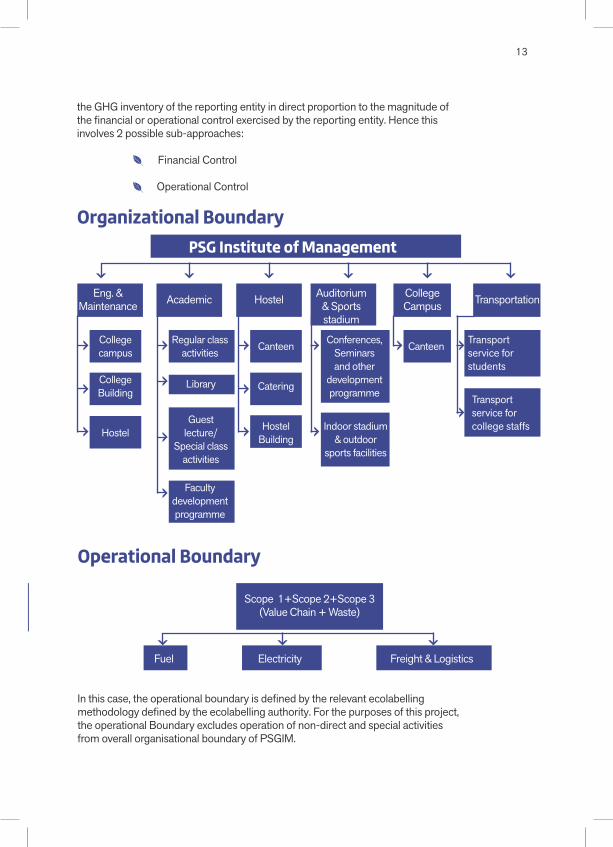
Organizational Boundary
Operational Boundary
PSG Institute of Management
Eng. & Maintenance
College campus Canteen CanteenConferences,
Seminars and other
development programme
Transport service for students
Regular class activities
Faculty development programme
College Building CateringLibrary
Hostel Hostel Building
Indoor stadium & outdoor
sports facilities
Transport service for college staffsGuest
lecture/ Special class
activities
College Campus
Auditorium & Sports stadium
Academic Hostel Transportation
In this case, the operational boundary is defined by the relevant ecolabelling methodology defined by the ecolabelling authority. For the purposes of this project, the operational Boundary excludes operation of non-direct and special activities from overall organisational boundary of PSGIM.
the GHG inventory of the reporting entity in direct proportion to the magnitude of the financial or operational control exercised by the reporting entity. Hence this involves 2 possible sub-approaches:
Financial Control
Operational Control
Scope 1+Scope 2+Scope 3(Value Chain + Waste)
Fuel Electricity Freight & Logistics
GHG Inventory of PSGIM
Scope 2 Emissions
Scope 3 Emissions
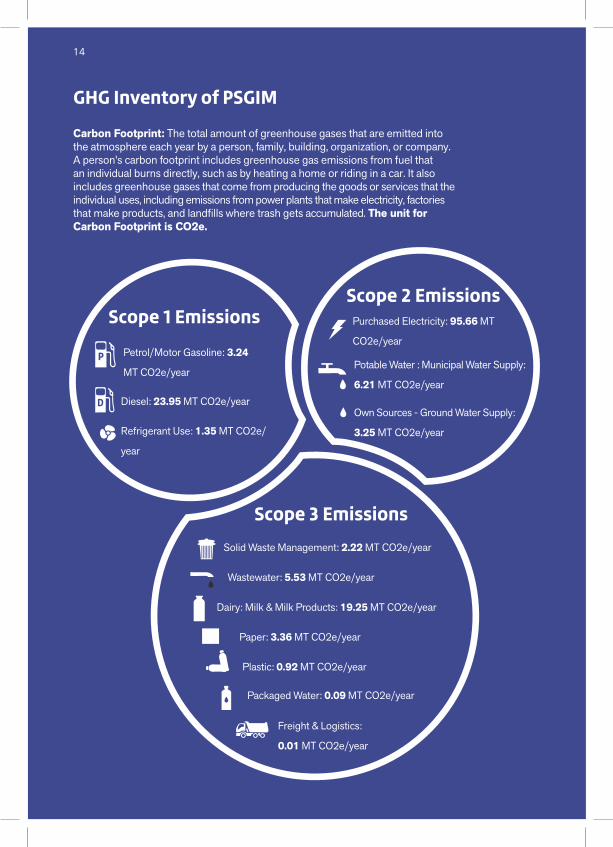
Scope 1 Emissions Purchased Electricity: 95.66 MT
CO2e/year
Potable Water : Municipal Water Supply:
6.21 MT CO2e/year
Own Sources - Ground Water Supply:
3.25 MT CO2e/year
Packaged Water: 0.09 MT CO2e/year
Solid Waste Management: 2.22 MT CO2e/year
Dairy: Milk & Milk Products: 19.25 MT CO2e/year
Plastic: 0.92 MT CO2e/year
Diesel: 23.95 MT CO2e/year
Refrigerant Use: 1.35 MT CO2e/
year
Petrol/Motor Gasoline: 3.24
MT CO2e/year
Wastewater: 5.53 MT CO2e/year
Paper: 3.36 MT CO2e/year
Freight & Logistics:
0.01 MT CO2e/year
Carbon Footprint: The total amount of greenhouse gases that are emitted into the atmosphere each year by a person, family, building, organization, or company. A person's carbon footprint includes greenhouse gas emissions from fuel that an individual burns directly, such as by heating a home or riding in a car. It also includes greenhouse gases that come from producing the goods or services that the individual uses, including emissions from power plants that make electricity, factories that make products, and landfills where trash gets accumulated. The unit for Carbon Footprint is CO2e.
14
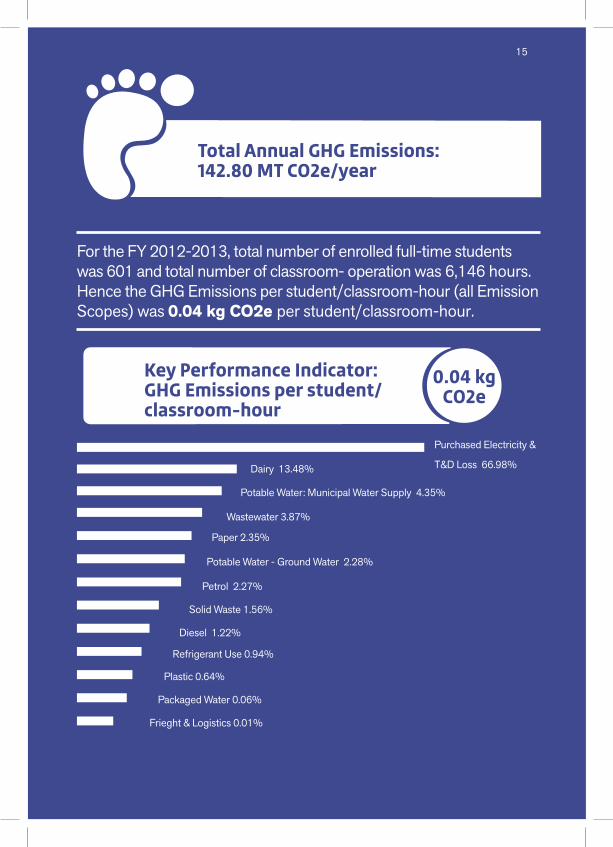
For the FY 2012-2013, total number of enrolled full-time students was 601 and total number of classroom- operation was 6,146 hours. Hence the GHG Emissions per student/classroom-hour (all Emission Scopes) was 0.04 kg CO2e per student/classroom-hour.
Total Annual GHG Emissions:142.80 MT CO2e/year
Purchased Electricity &
T&D Loss 66.98%
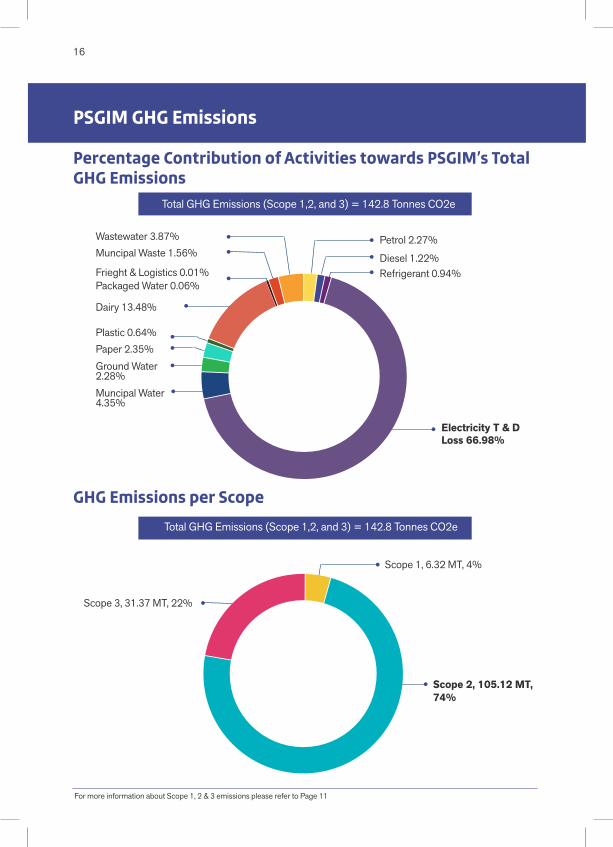
Potable Water: Municipal Water Supply 4.35%
Dairy 13.48%
Petrol 2.27%
Plastic 0.64%
Packaged Water 0.06%
Frieght & Logistics 0.01%
Diesel 1.22%
Potable Water - Ground Water 2.28%
Refrigerant Use 0.94%
Solid Waste 1.56%
Paper 2.35%
Wastewater 3.87%
15
Key Performance Indicator:GHG Emissions per student/ classroom-hour
0.04 kg CO2e
16
PSGIM GHG Emissions
Percentage Contribution of Activities towards PSGIM’s Total GHG Emissions
GHG Emissions per Scope
Muncipal Water4.35%
Scope 3, 31.37 MT, 22%
Scope 2, 105.12 MT, 74%
For more information about Scope 1, 2 & 3 emissions please refer to Page 11
Scope 1, 6.32 MT, 4%
Ground Water 2.28%
Paper 2.35%Plastic 0.64%
Dairy 13.48%
Muncipal Waste 1.56%Wastewater 3.87%
Total GHG Emissions (Scope 1,2, and 3) = 142.8 Tonnes CO2e
Total GHG Emissions (Scope 1,2, and 3) = 142.8 Tonnes CO2e
Petrol 2.27%
Diesel 1.22%Refrigerant 0.94%
Electricity T & D Loss 66.98%
Frieght & Logistics 0.01% Packaged Water 0.06%
17
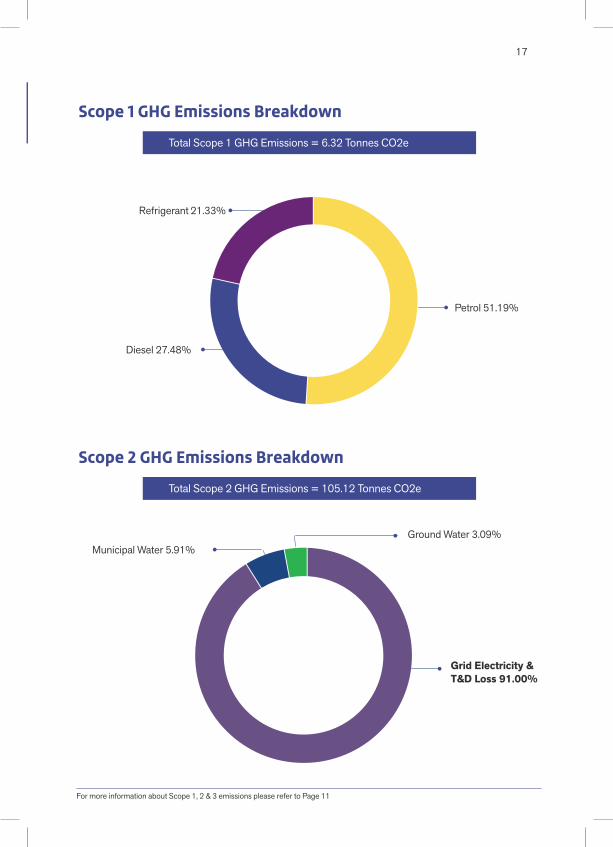
Scope 2 GHG Emissions Breakdown
Scope 1 GHG Emissions Breakdown
For more information about Scope 1, 2 & 3 emissions please refer to Page 11
Total Scope 2 GHG Emissions = 105.12 Tonnes CO2e
Total Scope 1 GHG Emissions = 6.32 Tonnes CO2e
Petrol 51.19%
Diesel 27.48%
Municipal Water 5.91%
Grid Electricity & T&D Loss 91.00%
Ground Water 3.09%
Refrigerant 21.33%
18
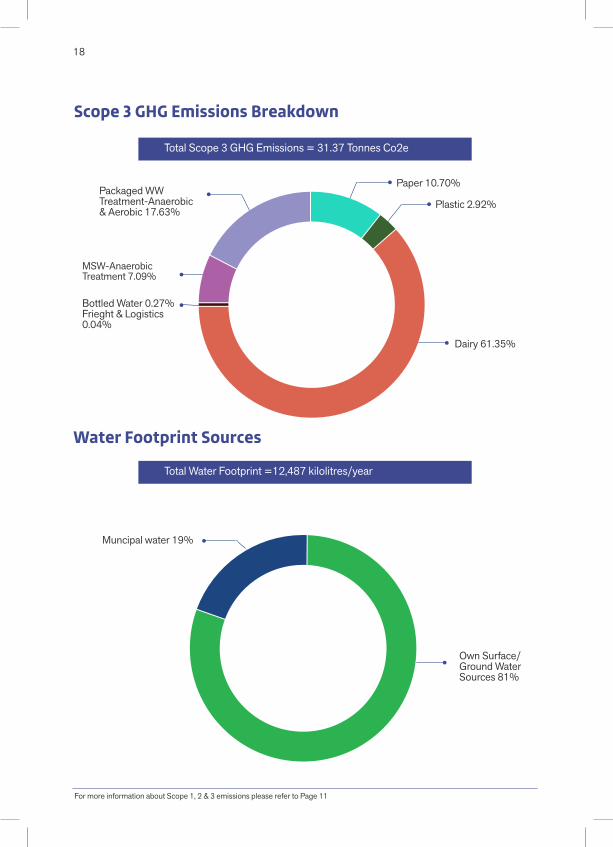
Bottled Water 0.27%Frieght & Logistics 0.04%
MSW-Anaerobic Treatment 7.09%
Packaged WW Treatment-Anaerobic & Aerobic 17.63%
Paper 10.70%
Plastic 2.92%
Dairy 61.35%
Scope 3 GHG Emissions Breakdown
Total Scope 3 GHG Emissions = 31.37 Tonnes Co2e
Water Footprint Sources
Own Surface/Ground Water Sources 81%
Muncipal water 19%
Total Water Footprint =12,487 kilolitres/year
For more information about Scope 1, 2 & 3 emissions please refer to Page 11
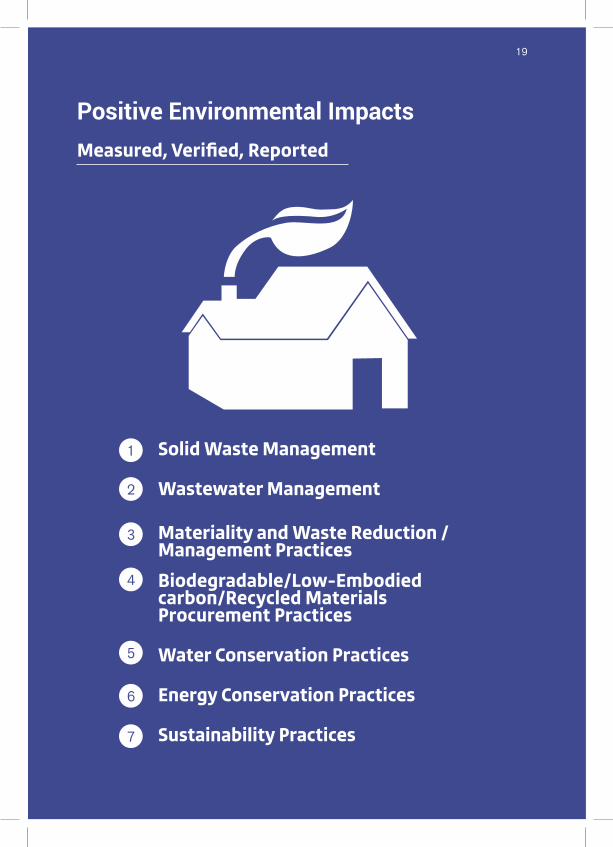
Solid Waste Management
Wastewater Management
Materiality and Waste Reduction / Management Practices
Biodegradable/Low-Embodied carbon/Recycled Materials Procurement Practices
Water Conservation Practices
Energy Conservation Practices
Sustainability Practices
Positive Environmental Impacts
1
2
3
4
5
6
7
Measured, Verified, Reported
19
20 Solid Waste Management
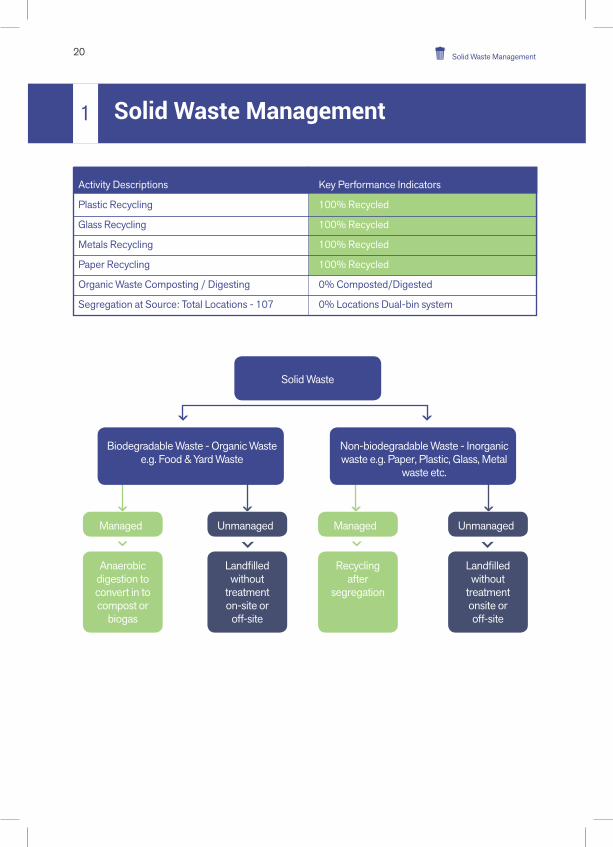
Solid Waste Management
Activity Descriptions Key Performance Indicators
Plastic Recycling 100% Recycled
Glass Recycling 100% Recycled
Metals Recycling 100% Recycled
Paper Recycling 100% Recycled
Organic Waste Composting / Digesting 0% Composted/Digested
Segregation at Source: Total Locations - 107 0% Locations Dual-bin system
1
Solid Waste
Managed
Anaerobic digestion to convert in to compost or
biogas
Recycling after
segregation
Landfilled without
treatment on-site or
off-site
Landfilled without
treatment onsite or off-site
ManagedUnmanaged Unmanaged
Biodegradable Waste - Organic Waste e.g. Food & Yard Waste
Non-biodegradable Waste - Inorganic waste e.g. Paper, Plastic, Glass, Metal
waste etc.
21Solid Waste Management
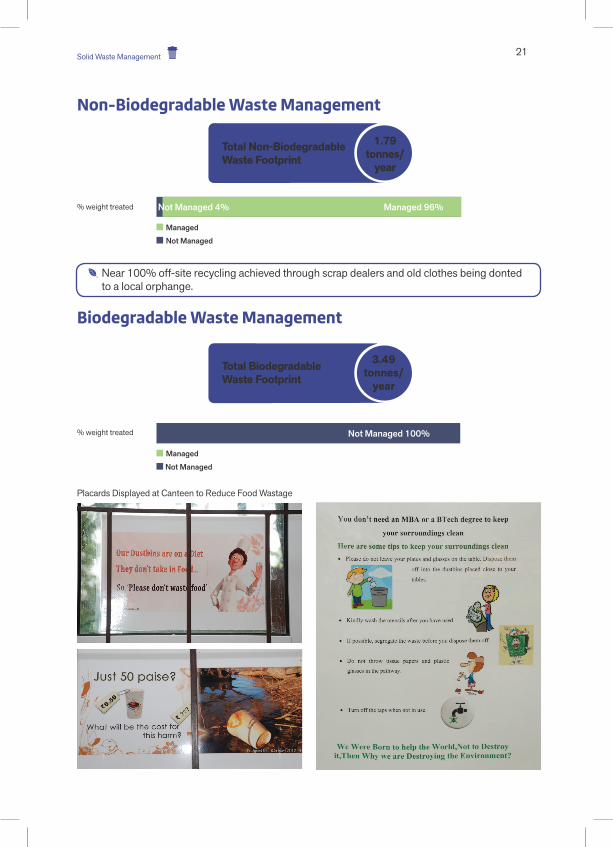
% weight treated
Managed
Not Managed
Not Managed 100%
Non-Biodegradable Waste Management
Biodegradable Waste Management
Placards Displayed at Canteen to Reduce Food Wastage
Near 100% off-site recycling achieved through scrap dealers and old clothes being donted to a local orphange.
% weight treated
Managed
Not Managed
Not Managed 4% Managed 96%
Total Non-Biodegradable Waste Footprint
Total Biodegradable Waste Footprint
1.79 tonnes/
year
3.49 tonnes/
year
22 Wastewater Management
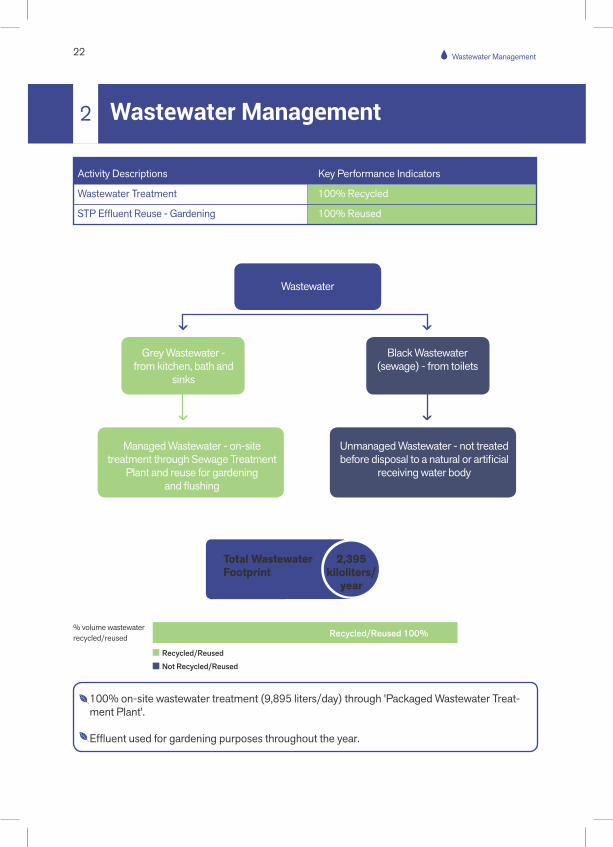
Wastewater Management
Activity Descriptions Key Performance Indicators
Wastewater Treatment 100% Recycled
STP Effluent Reuse - Gardening 100% Reused
% volume wastewater recycled/reused
Not Recycled/Reused
Recycled/Reused
2
Wastewater
Grey Wastewater - from kitchen, bath and
sinks
Managed Wastewater - on-site treatment through Sewage Treatment
Plant and reuse for gardening and flushing
Black Wastewater (sewage) - from toilets
Unmanaged Wastewater - not treated before disposal to a natural or artificial
receiving water body
Recycled/Reused 100%
100% on-site wastewater treatment (9,895 liters/day) through 'Packaged Wastewater Treat-ment Plant'.
Effluent used for gardening purposes throughout the year.
Total Wastewater Footprint
2,395 kiloliters/
year
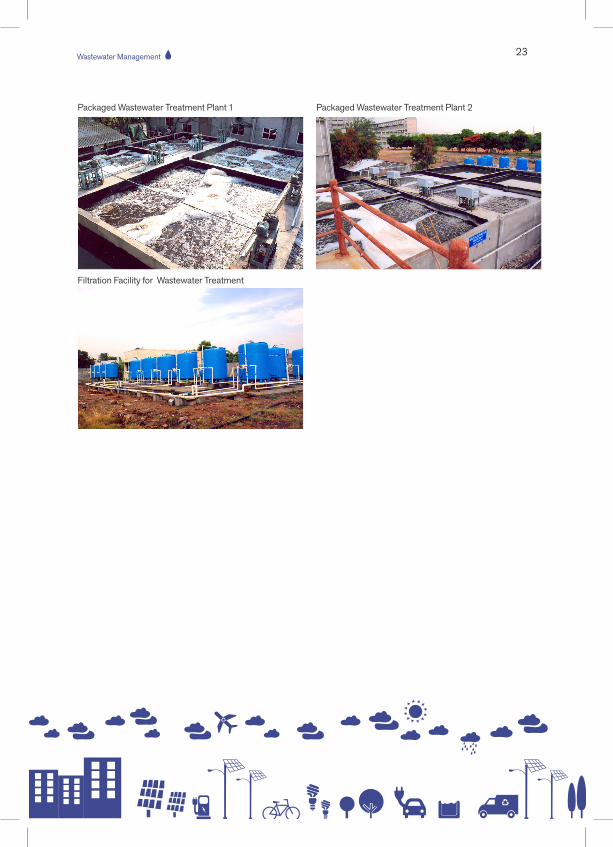
23Wastewater Management
Packaged Wastewater Treatment Plant 1
Filtration Facility for Wastewater Treatment
Packaged Wastewater Treatment Plant 2
24 Material/Waste Reduction Practices
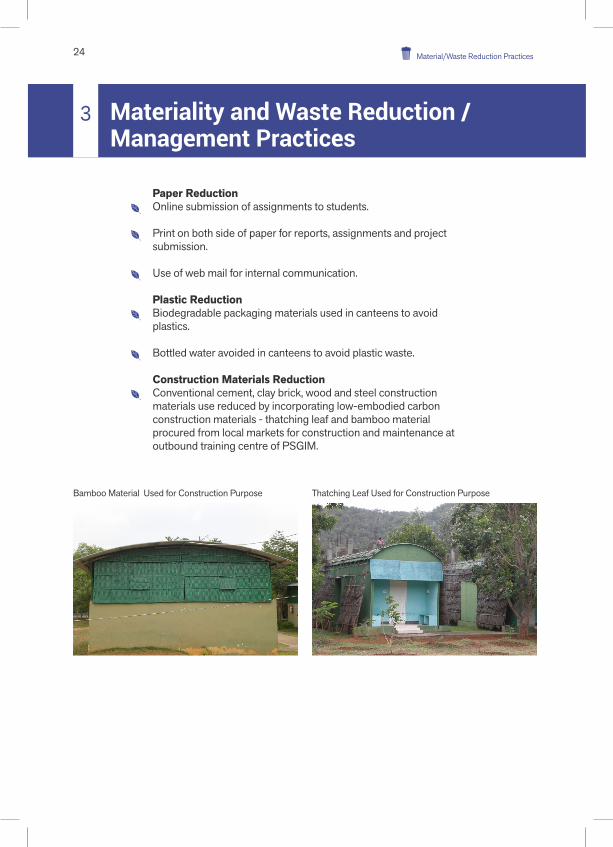
Bamboo Material Used for Construction Purpose Thatching Leaf Used for Construction Purpose
Materiality and Waste Reduction / Management Practices
3
Paper ReductionOnline submission of assignments to students.
Print on both side of paper for reports, assignments and project submission.
Use of web mail for internal communication.
Plastic ReductionBiodegradable packaging materials used in canteens to avoid plastics.
Bottled water avoided in canteens to avoid plastic waste.
Construction Materials ReductionConventional cement, clay brick, wood and steel construction materials use reduced by incorporating low-embodied carbon construction materials - thatching leaf and bamboo material procured from local markets for construction and maintenance at outbound training centre of PSGIM.
25Material Procurement Practices
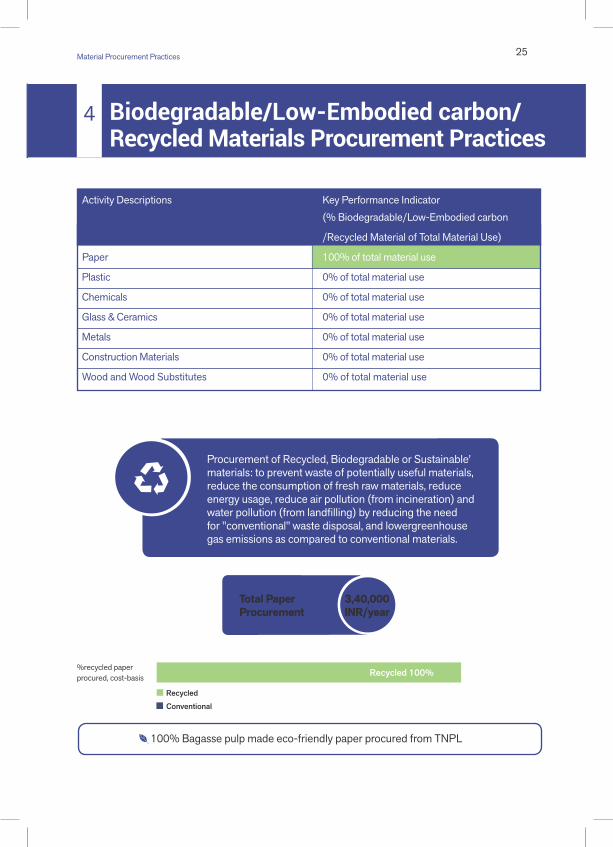
Biodegradable/Low-Embodied carbon/Recycled Materials Procurement Practices
4
Activity Descriptions Key Performance Indicator
(% Biodegradable/Low-Embodied carbon
/Recycled Material of Total Material Use)
Paper 100% of total material use
Plastic 0% of total material use
Chemicals 0% of total material use
Glass & Ceramics 0% of total material use
Metals 0% of total material use
Construction Materials 0% of total material use
Wood and Wood Substitutes 0% of total material use
Recycled
%recycled paper procured, cost-basis
Conventional
Procurement of Recycled, Biodegradable or Sustainable' materials: to prevent waste of potentially useful materials, reduce the consumption of fresh raw materials, reduce energy usage, reduce air pollution (from incineration) and water pollution (from landfilling) by reducing the need for "conventional" waste disposal, and lowergreenhouse gas emissions as compared to conventional materials.
Recycled 100%
100% Bagasse pulp made eco-friendly paper procured from TNPL
Total Paper Procurement
3,40,000 INR/year
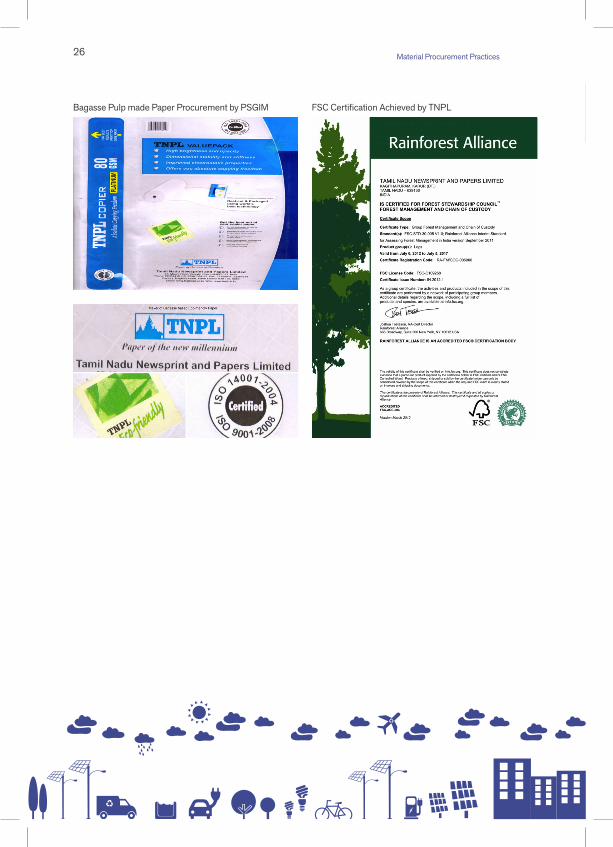
26 Material Procurement Practices
Bagasse Pulp made Paper Procurement by PSGIM FSC Certification Achieved by TNPL
27Water Related Practices
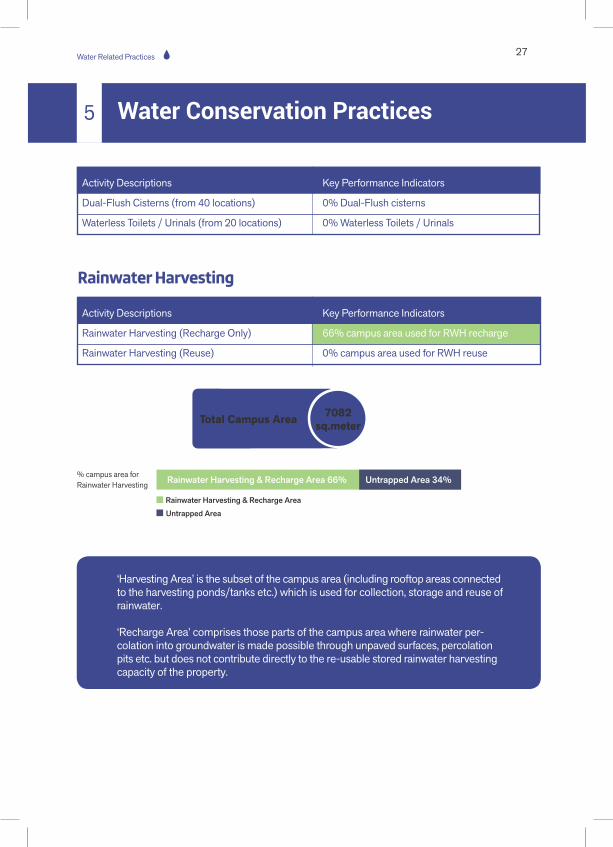
‘Harvesting Area’ is the subset of the campus area (including rooftop areas connected to the harvesting ponds/tanks etc.) which is used for collection, storage and reuse of rainwater.
‘Recharge Area’ comprises those parts of the campus area where rainwater per-colation into groundwater is made possible through unpaved surfaces, percolation pits etc. but does not contribute directly to the re-usable stored rainwater harvesting capacity of the property.
Water Conservation Practices
Activity Descriptions Key Performance Indicators
Dual-Flush Cisterns (from 40 locations) 0% Dual-Flush cisterns
Waterless Toilets / Urinals (from 20 locations) 0% Waterless Toilets / Urinals
Activity Descriptions Key Performance Indicators
Rainwater Harvesting (Recharge Only) 66% campus area used for RWH recharge
Rainwater Harvesting (Reuse) 0% campus area used for RWH reuse
5
Rainwater Harvesting
% campus area for Rainwater Harvesting
Rainwater Harvesting & Recharge Area
Untrapped Area
Rainwater Harvesting & Recharge Area 66% Untrapped Area 34%
Total Campus Area 7082 sq.meter
28 Energy Conservation Practices
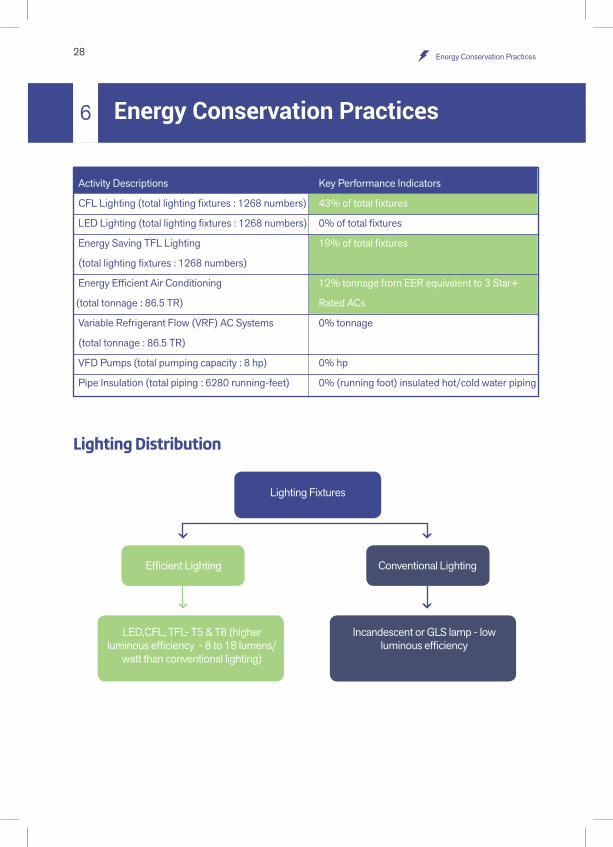
Energy Conservation Practices
Activity Descriptions Key Performance Indicators
CFL Lighting (total lighting fixtures : 1268 numbers) 43% of total fixtures
LED Lighting (total lighting fixtures : 1268 numbers) 0% of total fixtures
Energy Saving TFL Lighting 19% of total fixtures
(total lighting fixtures : 1268 numbers)
Energy Efficient Air Conditioning 12% tonnage from EER equivalent to 3 Star+
(total tonnage : 86.5 TR) Rated ACs
Variable Refrigerant Flow (VRF) AC Systems 0% tonnage
(total tonnage : 86.5 TR)
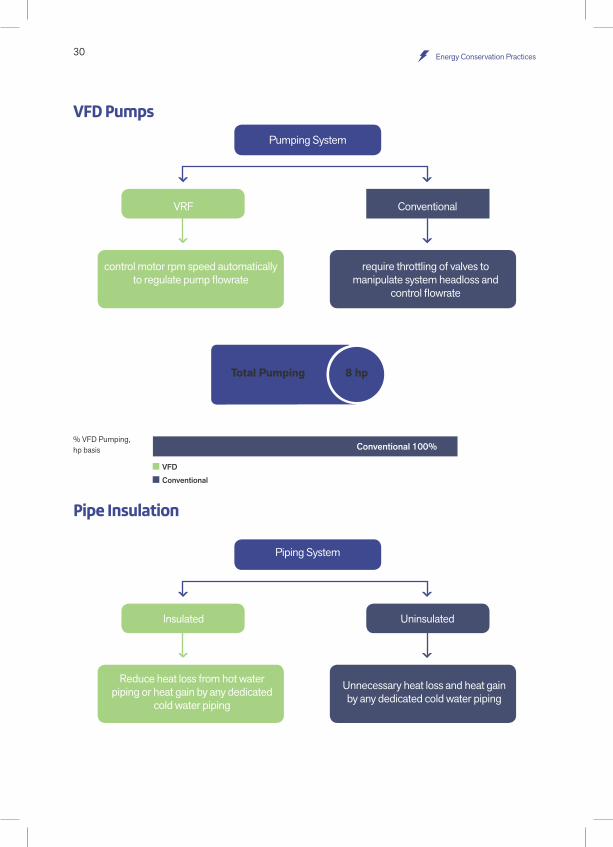
VFD Pumps (total pumping capacity : 8 hp) 0% hp
Pipe Insulation (total piping : 6280 running-feet) 0% (running foot) insulated hot/cold water piping
6
Lighting Distribution
Lighting Fixtures
Efficient Lighting
LED,CFL, TFL- T5 & T8 (higher luminous efficiency - 8 to 18 lumens/
watt than conventional lighting)
Conventional Lighting
Incandescent or GLS lamp - low luminous efficiency
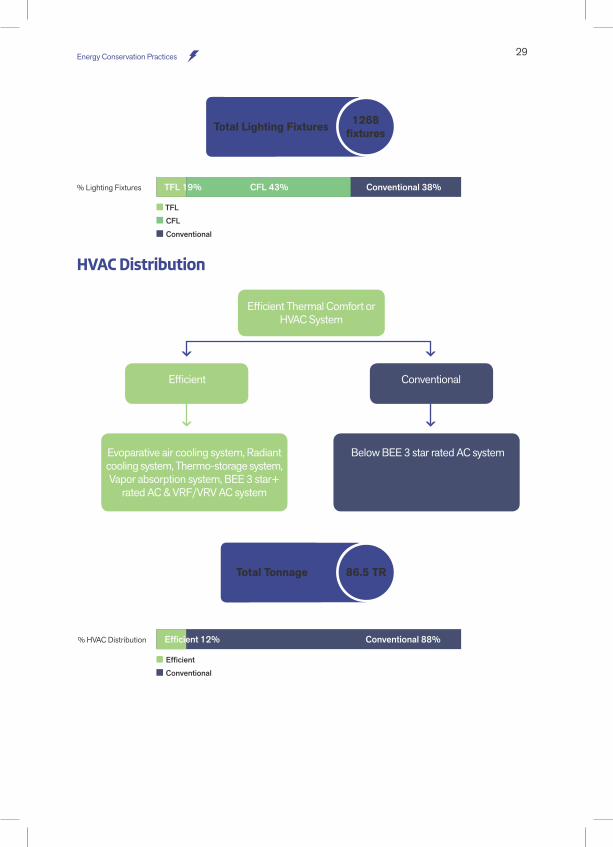
29Energy Conservation Practices
% Lighting Fixtures
CFL
TFL
Conventional
Conventional 38%CFL 43%TFL 19%
HVAC Distribution
Efficient
Conventional
Efficient Thermal Comfort or HVAC System
Efficient
Evoparative air cooling system, Radiant cooling system, Thermo-storage system, Vapor absorption system, BEE 3 star+
rated AC & VRF/VRV AC system
Conventional
Below BEE 3 star rated AC system
Conventional 88%Efficient 12%% HVAC Distribution
Total Lighting Fixtures 1268 fixtures
Total Tonnage 86.5 TR
30 Energy Conservation Practices
% VFD Pumping, hp basis
VFD
Conventional
VFD Pumps
Pipe Insulation
Pumping System
Piping System
VRF
Insulated
control motor rpm speed automatically to regulate pump flowrate
Reduce heat loss from hot water piping or heat gain by any dedicated
cold water piping
Conventional
Uninsulated
require throttling of valves to manipulate system headloss and
control flowrate
Unnecessary heat loss and heat gain by any dedicated cold water piping
Total Pumping 8 hp
Conventional 100%
31Energy Conservation Practices
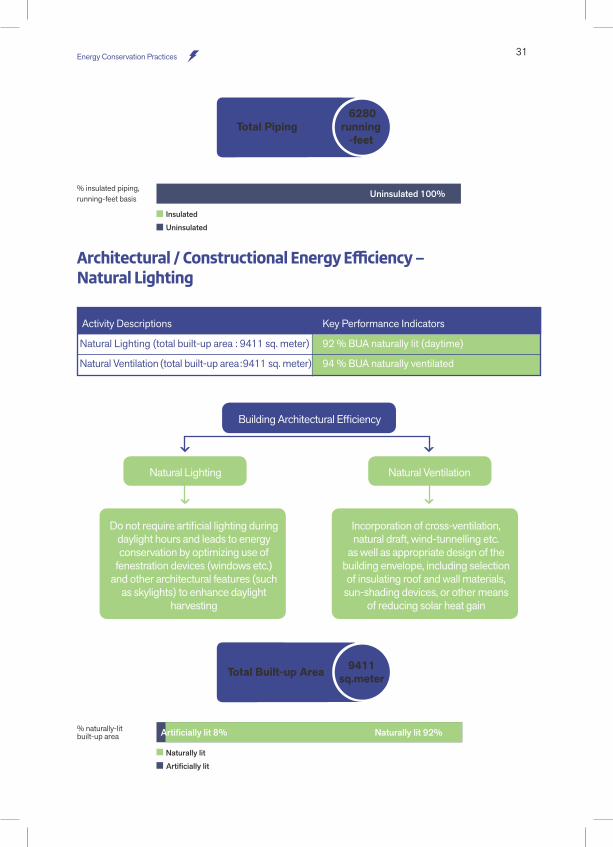
% naturally-lit built-up area
Naturally lit
Artificially lit
Naturally lit 92%Artificially lit 8%
% insulated piping, running-feet basis
Insulated
Uninsulated
Architectural / Constructional Energy Efficiency – Natural Lighting
Building Architectural Efficiency
Natural Lighting
Do not require artificial lighting during daylight hours and leads to energy conservation by optimizing use of
fenestration devices (windows etc.) and other architectural features (such
as skylights) to enhance daylight harvesting
Natural Ventilation
Incorporation of cross-ventilation, natural draft, wind-tunnelling etc.
as well as appropriate design of the building envelope, including selection of insulating roof and wall materials,
sun-shading devices, or other means of reducing solar heat gain
Uninsulated 100%
Total Piping 6280
running -feet
Activity Descriptions Key Performance Indicators
Natural Lighting (total built-up area : 9411 sq. meter) 92 % BUA naturally lit (daytime)
Natural Ventilation (total built-up area : 9411 sq. meter) 94 % BUA naturally ventilated
Total Built-up Area 9411 sq.meter
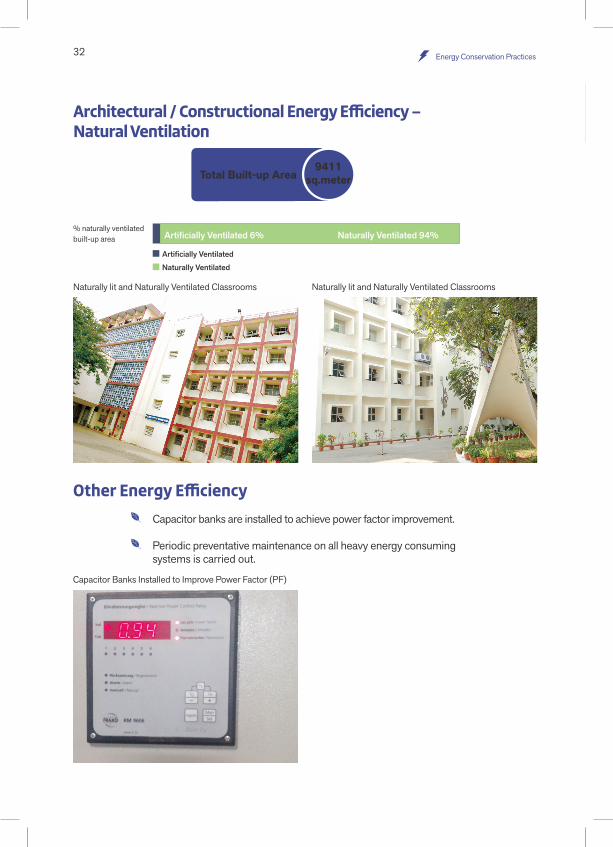
32 Energy Conservation Practices
Architectural / Constructional Energy Efficiency – Natural Ventilation
% naturally ventilated built-up area
Naturally Ventilated
Artificially Ventilated
Naturally Ventilated 94%Artificially Ventilated 6%
Naturally lit and Naturally Ventilated Classrooms Naturally lit and Naturally Ventilated Classrooms
Capacitor banks are installed to achieve power factor improvement.
Periodic preventative maintenance on all heavy energy consuming systems is carried out.
Other Energy Efficiency
Capacitor Banks Installed to Improve Power Factor (PF)
Total Built-up Area9411
sq.meter
33Sustainability Practices
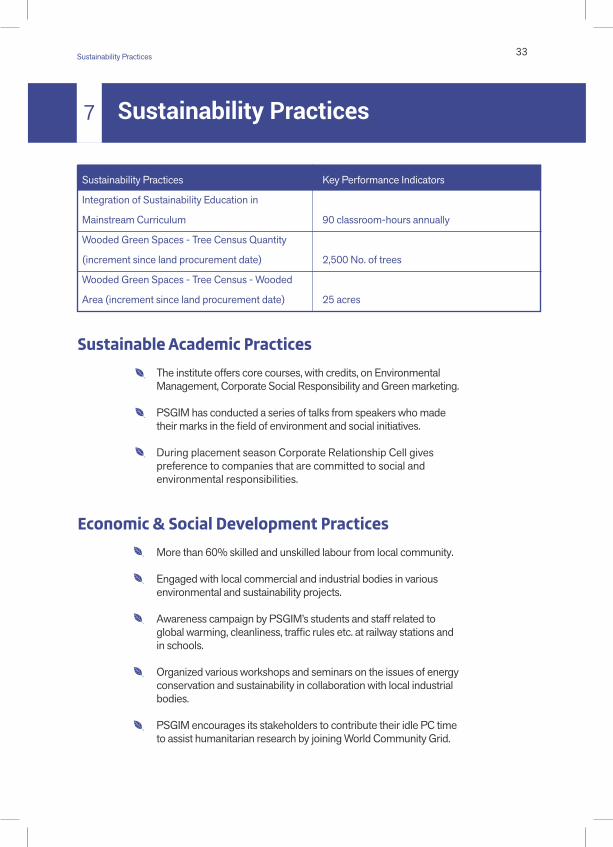
The institute offers core courses, with credits, on Environmental Management, Corporate Social Responsibility and Green marketing.
PSGIM has conducted a series of talks from speakers who made their marks in the field of environment and social initiatives.
During placement season Corporate Relationship Cell gives preference to companies that are committed to social and environmental responsibilities.
More than 60% skilled and unskilled labour from local community.
Engaged with local commercial and industrial bodies in various environmental and sustainability projects.
Awareness campaign by PSGIM’s students and staff related to global warming, cleanliness, traffic rules etc. at railway stations and in schools.
Organized various workshops and seminars on the issues of energy conservation and sustainability in collaboration with local industrial bodies.
PSGIM encourages its stakeholders to contribute their idle PC time to assist humanitarian research by joining World Community Grid.
Sustainable Academic Practices
Economic & Social Development Practices
Sustainability Practices7
Sustainability Practices Key Performance Indicators
Integration of Sustainability Education in
Mainstream Curriculum 90 classroom-hours annually
Wooded Green Spaces - Tree Census Quantity
(increment since land procurement date) 2,500 No. of trees
Wooded Green Spaces - Tree Census - Wooded
Area (increment since land procurement date) 25 acres
34 Sustainability Practices
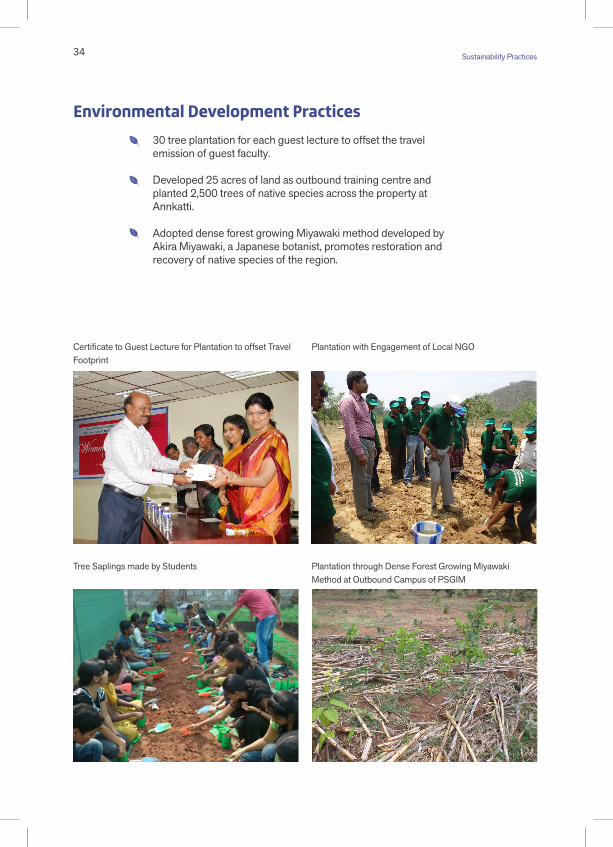
30 tree plantation for each guest lecture to offset the travel emission of guest faculty.
Developed 25 acres of land as outbound training centre and planted 2,500 trees of native species across the property at Annkatti.
Adopted dense forest growing Miyawaki method developed by Akira Miyawaki, a Japanese botanist, promotes restoration and recovery of native species of the region.
Environmental Development Practices
Certificate to Guest Lecture for Plantation to offset Travel Footprint
Tree Saplings made by Students
Plantation with Engagement of Local NGO
Plantation through Dense Forest Growing Miyawaki Method at Outbound Campus of PSGIM
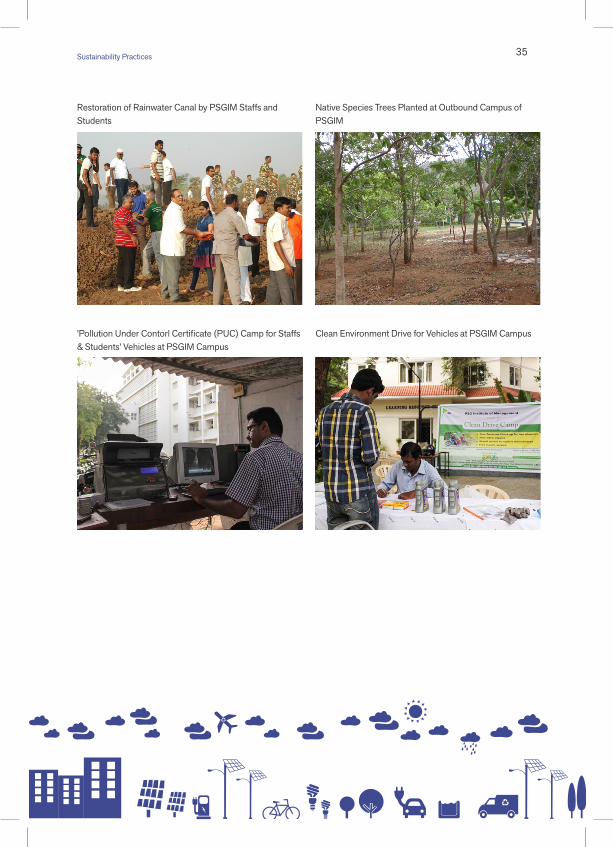
35Sustainability Practices
Native Species Trees Planted at Outbound Campus of PSGIM
Clean Environment Drive for Vehicles at PSGIM Campus
Restoration of Rainwater Canal by PSGIM Staffs and Students
'Pollution Under Contorl Certificate (PUC) Camp for Staffs & Students' Vehicles at PSGIM Campus
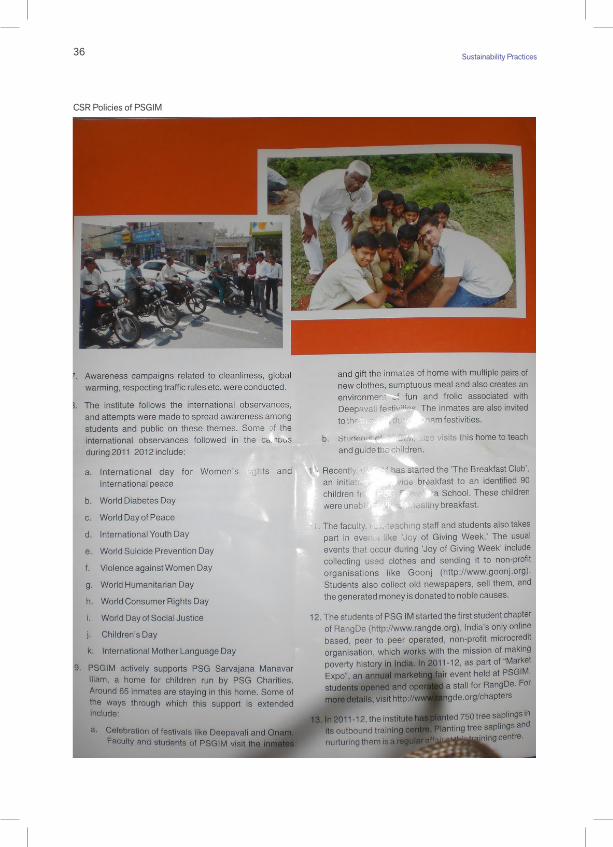
36 Sustainability Practices
CSR Policies of PSGIM
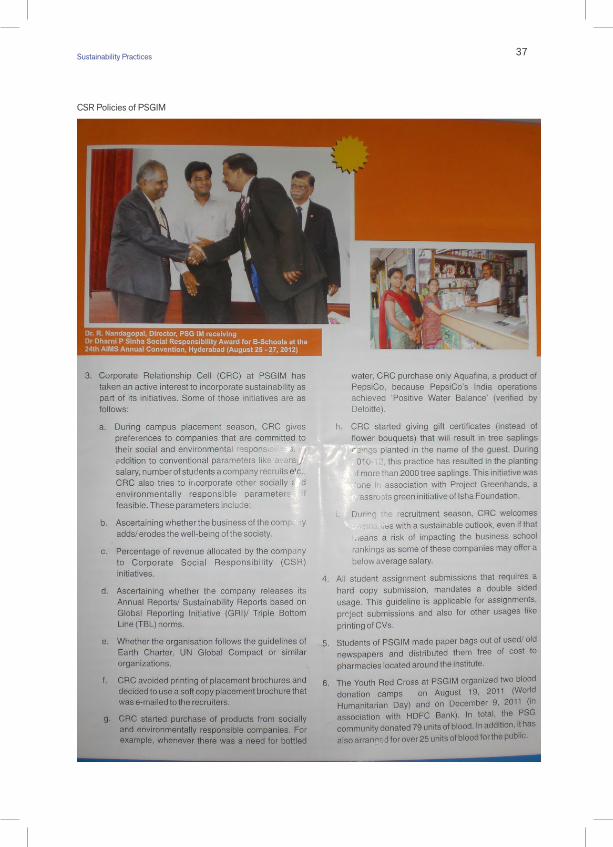
37Sustainability Practices
CSR Policies of PSGIM
38
Independent Assurance Statement from Consultant (cBalance Solutions Pvt. Ltd.)
cBalance Solutions Pvt. Ltd. consultant was retained by PSG Institute of Management (the "Company") to provide an independent assurance on its Ecolabelling Report, limited to the social and environmental information therein. The Company’s management is responsible for the content of the Report and its presentation. The consultant’s responsibility is to provide assurance on the Report content, as described in the scope of assurance. Our responsibility in performing our assurance activities is to the management of the Company only, and in accordance with the terms of reference agreed with the Company. We do not therefore accept or assume any responsibility for any other purpose or to any other person or organisation.
Scope of Assurance and MethodologyThe scope of our work for this assurance is limited to review of information pertaining to environment and social performance for the period of 1st April 2012 to 31st March 2013 of PSGIM Coimbatore campus which head office is situated at Coimbatore, which are material to the Company’s Financial Performance.cBalance’s multidisciplinary team of professionals visited the PSGIM Coimbatore campus in order to review and verify the data and information presented in the Report, on core ecolabelling indicators listed below:
Scope 1 emissionScope 2 emissionEnergy (Direct &Indirect) emissions for special activitiesSolid waste emissionsWastewater emissionsOther Scope 3 emissionsMateriality Reduction & Waste related practicesWater related practicesEnergy related practicesSustainability related best practices
39
The nature and scope of our work was based on our professional judgment and we have performed procedures deemed necessary to provide a basis for our conclusions. The approach to the assurance exercise included interaction with key personnel to identify the processes in place to capture sustainability performance data and information as per TGS Ecolabelling guidelines.
-Review of major anomaly within the Report as well as between the Report and source data/information
-Verification of the transcription of data internally verified by the Company
-Execution of audit trail of selected data streams and information to determine the level of accuracy in collection, transcription and aggregation processes followed
-Review of the Company’s plans, policies and practices, pertaining to their social, environmental and sustainable development
Limitations of our engagementThe assurance scope excludes:
-Aspects of the Report other than those mentioned above
-Data and information outside the defined reporting period (1st April 2012 to 31st March 2013)
-Data and information on economic and financial performance of the Company, which are from the PSGIM’s audited financial records
The team conducted review and verification of data collection process, measurement methodology and general review of the logic of inclusion/omission of necessary information/data to:
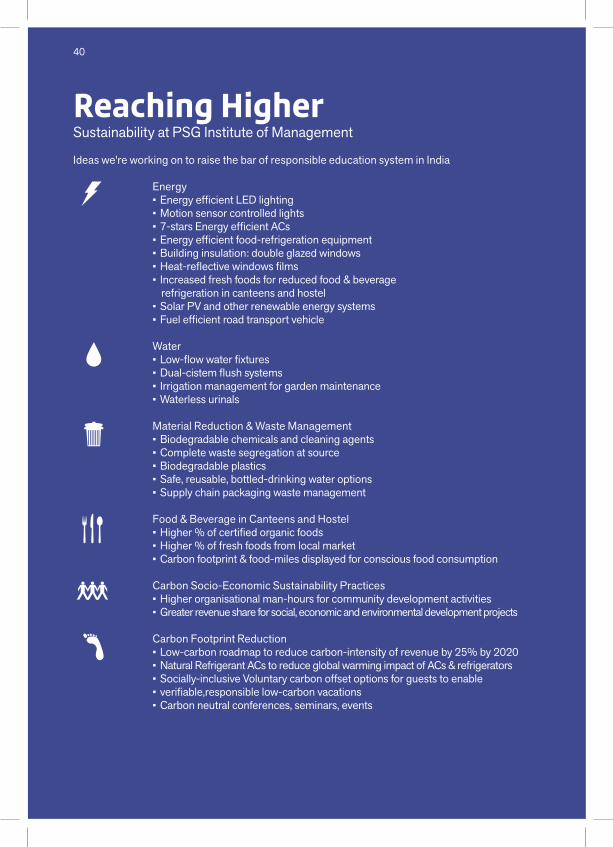
Reaching HigherSustainability at PSG Institute of Management
Ideas we're working on to raise the bar of responsible education system in India
Energy•Energy efficient LED lighting•Motion sensor controlled lights•7-stars Energy efficient ACs•Energy efficient food-refrigeration equipment•Building insulation: double glazed windows•Heat-reflective windows films• Increased fresh foods for reduced food & beverage
refrigeration in canteens and hostel•Solar PV and other renewable energy systems•Fuel efficient road transport vehicle
Water•Low-flow water fixtures•Dual-cistem flush systems• Irrigation management for garden maintenance•Waterless urinals
Material Reduction & Waste Management•Biodegradable chemicals and cleaning agents •Complete waste segregation at source•Biodegradable plastics•Safe, reusable, bottled-drinking water options•Supply chain packaging waste management
Food & Beverage in Canteens and Hostel•Higher % of certified organic foods•Higher % of fresh foods from local market•Carbon footprint & food-miles displayed for conscious food consumption
Carbon Socio-Economic Sustainability Practices•Higher organisational man-hours for community development activities•Greater revenue share for social, economic and environmental development projects
Carbon Footprint Reduction•Low-carbon roadmap to reduce carbon-intensity of revenue by 25% by 2020•Natural Refrigerant ACs to reduce global warming impact of ACs & refrigerators•Socially-inclusive Voluntary carbon offset options for guests to enable •verifiable,responsible low-carbon vacations•Carbon neutral conferences, seminars, events
40
41
AbbreviationACs – Air Conditioners
BEE – Bureau of Energy Efficiency
cBalance – cBalance Solutions Private Limited
CO2e – CO2 equivalent
EER – Energy Efficiency Rating
FY – Financial Year
GHG Emission – Greenhouse Gas Emission
hp – Horsepower
HVAC – Heating, Ventilating and Air Conditioning
IIM (A) – Indian Institute of Management, Ahmadabad
LED – Light Emitting Diode
MSW – Municipal Solid Waste
MT – Metric Tonne
Packaged WW Treatment – Packaged Wastewater Treatment
PSGIM – PSG Institute of Management
T&D Loss – Transmission & Distribution Loss
TNPL – Tamil Nadu Newsprint Paper Limited
VFD Pump – Variable Frequency Drive Pump
H2/7, Brahma Paradise, Nathan Road, Sangamwadi, Pune - 411001
Website www.cbalance.in
Telephone +91-20-30421636 | Email [email protected], [email protected]
cBalance Solutions Pvt. Ltd.

FSC® C084365
This report is printed on FSC certi�ed paper sourced from responsible forests