Embed Size (px)
Citation preview
SSI Review 2014 | 131
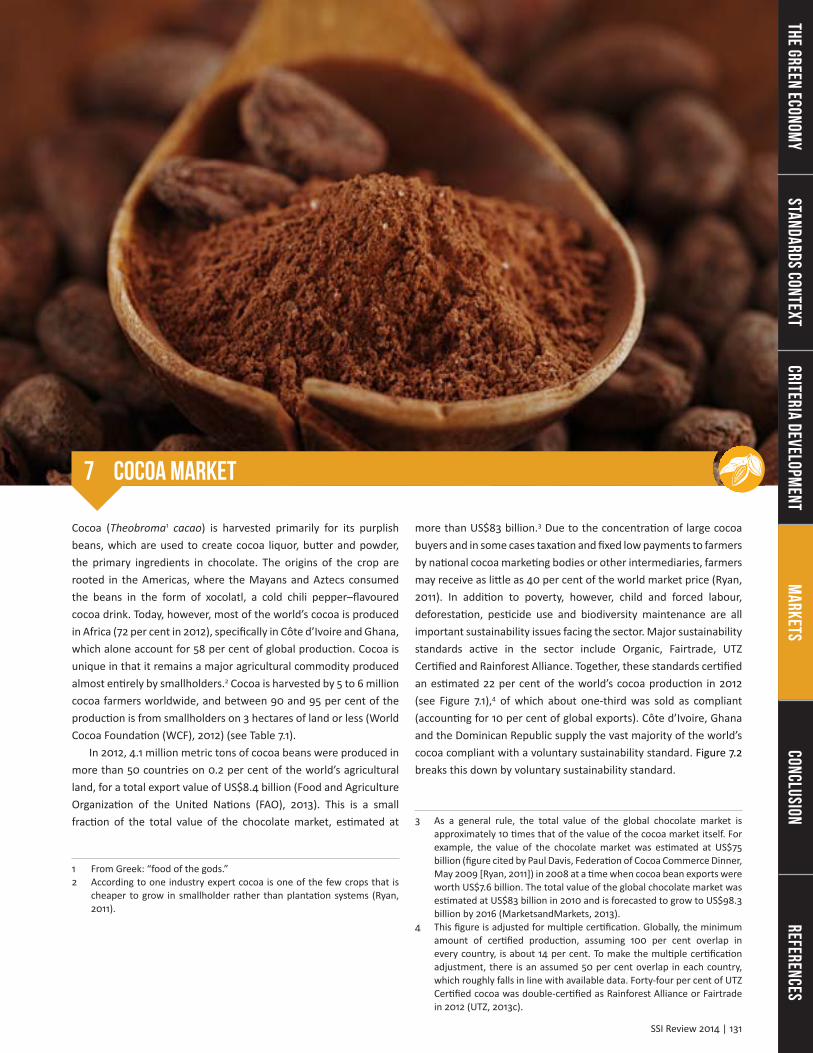
Cocoa (Theobroma1 cacao) is harvested primarily for its purplish beans, which are used to create cocoa liquor, butter and powder, the primary ingredients in chocolate. The origins of the crop are rooted in the Americas, where the Mayans and Aztecs consumed the beans in the form of xocolatl, a cold chili pepper–flavoured cocoa drink. Today, however, most of the world’s cocoa is produced in Africa (72 per cent in 2012), specifically in Côte d’Ivoire and Ghana, which alone account for 58 per cent of global production. Cocoa is unique in that it remains a major agricultural commodity produced almost entirely by smallholders.2 Cocoa is harvested by 5 to 6 million cocoa farmers worldwide, and between 90 and 95 per cent of the production is from smallholders on 3 hectares of land or less (World Cocoa Foundation (WCF), 2012) (see Table 7.1).
In 2012, 4.1 million metric tons of cocoa beans were produced in more than 50 countries on 0.2 per cent of the world’s agricultural land, for a total export value of US$8.4 billion (Food and Agriculture Organization of the United Nations (FAO), 2013). This is a small fraction of the total value of the chocolate market, estimated at
1 From Greek: “food of the gods.”2 According to one industry expert cocoa is one of the few crops that is
cheaper to grow in smallholder rather than plantation systems (Ryan, 2011).
7 Cocoa Market
more than US$83 billion.3 Due to the concentration of large cocoa buyers and in some cases taxation and fixed low payments to farmers by national cocoa marketing bodies or other intermediaries, farmers may receive as little as 40 per cent of the world market price (Ryan, 2011). In addition to poverty, however, child and forced labour, deforestation, pesticide use and biodiversity maintenance are all important sustainability issues facing the sector. Major sustainability standards active in the sector include Organic, Fairtrade, UTZ Certified and Rainforest Alliance. Together, these standards certified an estimated 22 per cent of the world’s cocoa production in 2012 (see Figure 7.1),4 of which about one-third was sold as compliant (accounting for 10 per cent of global exports). Côte d’Ivoire, Ghana and the Dominican Republic supply the vast majority of the world’s cocoa compliant with a voluntary sustainability standard. Figure 7.2 breaks this down by voluntary sustainability standard.
3 As a general rule, the total value of the global chocolate market is approximately 10 times that of the value of the cocoa market itself. For example, the value of the chocolate market was estimated at US$75 billion (figure cited by Paul Davis, Federation of Cocoa Commerce Dinner, May 2009 [Ryan, 2011]) in 2008 at a time when cocoa bean exports were worth US$7.6 billion. The total value of the global chocolate market was estimated at US$83 billion in 2010 and is forecasted to grow to US$98.3 billion by 2016 (MarketsandMarkets, 2013).
4 This figure is adjusted for multiple certification. Globally, the minimum amount of certified production, assuming 100 per cent overlap in every country, is about 14 per cent. To make the multiple certification adjustment, there is an assumed 50 per cent overlap in each country, which roughly falls in line with available data. Forty-four per cent of UTZ Certified cocoa was double-certified as Rainforest Alliance or Fairtrade in 2012 (UTZ, 2013c).
Banana
Biofuel
Cocoa
Co�ee
Cotton
Forestry
Palm Oil
Soy Bean
Sugar Cane
Tea
ReferencesConclusion
Markets
Criteria Development
Standards ContextThe Green Econom
y
VietnamDominican Republic
Philippines
Nicaragua
Côte d’Ivoire
Ghana
Cameroon
Uganda
Indonesia
EcuadorPapua New Guinea
United Republic of Tanzania Solomon Islands
Bolivia (Plurinational State of)Madagascar
IndiaMexico
Peru Brazil
Production (mt)0
1,485,900
1,000,000
500,000
Conventional (2012)
Fairtrade (2011)
Organic (2011)
Rainforest Alliance (2012)
UTZ (2012)
SSI Review 2014 | 133 132 | SSI Review 2014
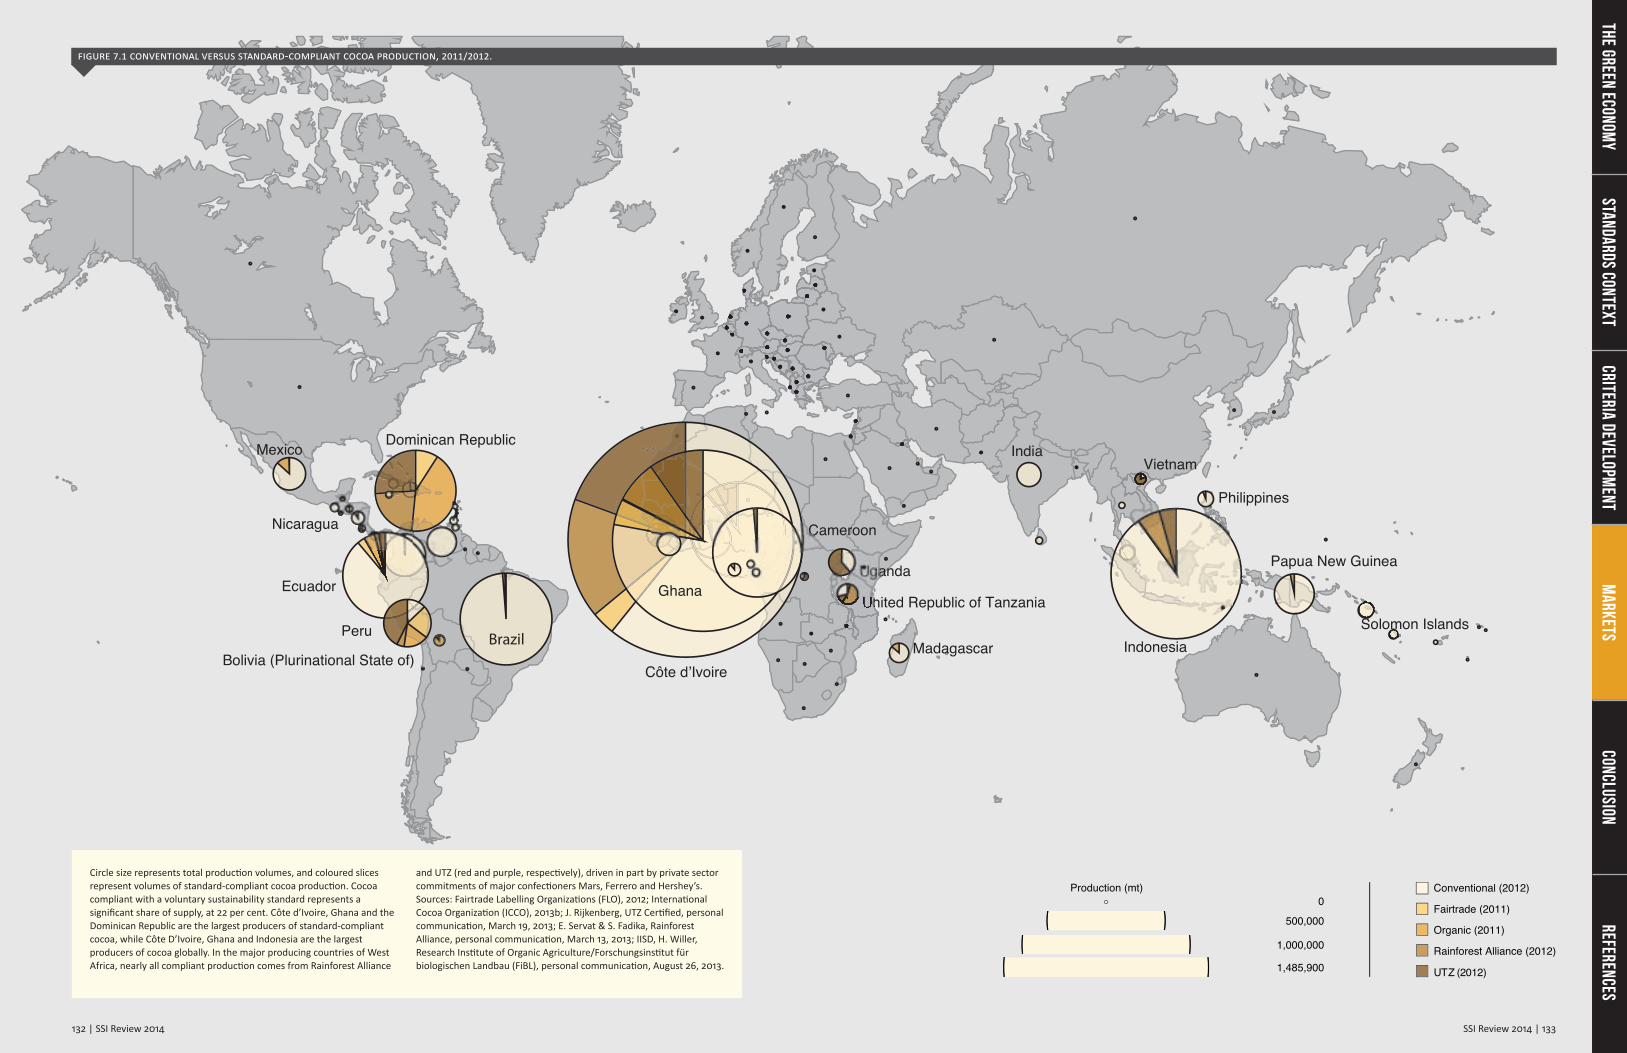
Circle size represents total production volumes, and coloured slices represent volumes of standard-compliant cocoa production. Cocoa compliant with a voluntary sustainability standard represents a significant share of supply, at 22 per cent. Côte d’Ivoire, Ghana and the Dominican Republic are the largest producers of standard-compliant cocoa, while Côte D’Ivoire, Ghana and Indonesia are the largest producers of cocoa globally. In the major producing countries of West Africa, nearly all compliant production comes from Rainforest Alliance
and UTZ (red and purple, respectively), driven in part by private sector commitments of major confectioners Mars, Ferrero and Hershey’s. Sources: Fairtrade Labelling Organizations (FLO), 2012; International Cocoa Organization (ICCO), 2013b; J. Rijkenberg, UTZ Certified, personal communication, March 19, 2013; E. Servat & S. Fadika, Rainforest Alliance, personal communication, March 13, 2013; IISD, H. Willer, Research Institute of Organic Agriculture/Forschungsinstitut für biologischen Landbau (FiBL), personal communication, August 26, 2013.
Figure 7.1 Conventional versus standard-Compliant CoCoa produCtion, 2011/2012.
ReferencesConclusion
Markets
Criteria Development
Standards ContextThe Green Econom
y
134 | SSI Review 2014
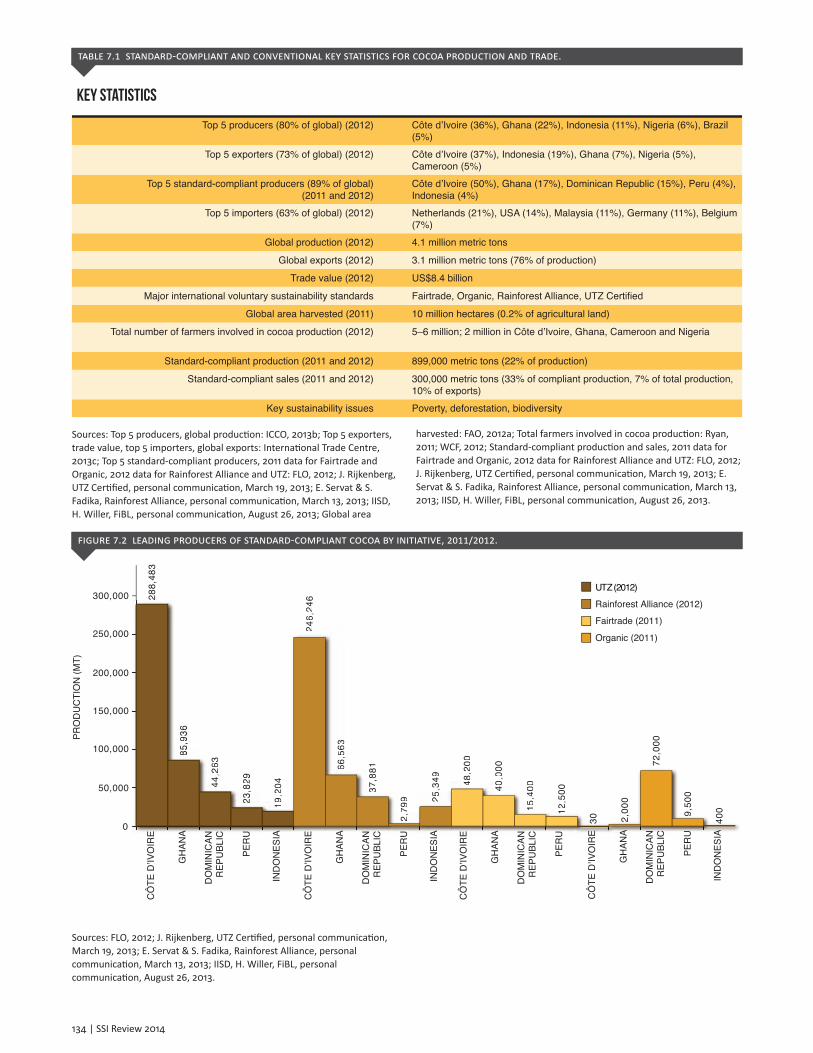
Key statistics
Top 5 producers (80% of global) (2012) Côte d’Ivoire (36%), Ghana (22%), Indonesia (11%), Nigeria (6%), Brazil (5%)
Top 5 exporters (73% of global) (2012) Côte d’Ivoire (37%), Indonesia (19%), Ghana (7%), Nigeria (5%), Cameroon (5%)
Top 5 standard-compliant producers (89% of global) (2011 and 2012)
Côte d’Ivoire (50%), Ghana (17%), Dominican Republic (15%), Peru (4%), Indonesia (4%)
Top 5 importers (63% of global) (2012) Netherlands (21%), USA (14%), Malaysia (11%), Germany (11%), Belgium (7%)
Global production (2012) 4.1 million metric tons
Global exports (2012) 3.1 million metric tons (76% of production)
Trade value (2012) US$8.4 billion
Major international voluntary sustainability standards
Global area harvested (2011) 10 million hectares (0.2% of agricultural land)
Total number of farmers involved in cocoa production (2012) 5–6 million; 2 million in Côte d’Ivoire, Ghana, Cameroon and Nigeria
Standard-compliant production (2011 and 2012) 899,000 metric tons (22% of production)
Standard-compliant sales (2011 and 2012) 300,000 metric tons (33% of compliant production, 7% of total production, 10% of exports)
Key sustainability issues Poverty, deforestation, biodiversity
Sources: Top 5 producers, global production: ICCO, 2013b; Top 5 exporters, trade value, top 5 importers, global exports: International Trade Centre, 2013c; Top 5 standard-compliant producers, 2011 data for Fairtrade and Organic, 2012 data for Rainforest Alliance and UTZ: FLO, 2012; J. Rijkenberg, UTZ Certified, personal communication, March 19, 2013; E. Servat & S. Fadika, Rainforest Alliance, personal communication, March 13, 2013; IISD, H. Willer, FiBL, personal communication, August 26, 2013; Global area
harvested: FAO, 2012a; Total farmers involved in cocoa production: Ryan, 2011; WCF, 2012; Standard-compliant production and sales, 2011 data for Fairtrade and Organic, 2012 data for Rainforest Alliance and UTZ: FLO, 2012; J. Rijkenberg, UTZ Certified, personal communication, March 19, 2013; E. Servat & S. Fadika, Rainforest Alliance, personal communication, March 13, 2013; IISD, H. Willer, FiBL, personal communication, August 26, 2013.
0
50,000
100,000
150,000
200,000
250,000
300,000
19,2
04
23,8
2944,2
63
85,9
36
288,
483
25,3
49
2,79
9
37,8
8166,5
63
246,
246
12,5
00
15,4
0040,0
00
48,2
00
19,2
04
23,8
2944,2
63
85,9
36
25,3
49
2,79
9
37,8
8166,5
63
246,
246
12,5
00
15,4
0040,0
00
48,2
00
4009,50
0
72,0
00
2,00
0
30
PRO
DU
CTI
ON
(MT)
CÔ
TE D
’IVO
IRE
GH
ANA
DO
MIN
ICAN
REP
UBL
IC
PER
U
IND
ON
ESIA
CÔ
TE D
’IVO
IRE
GH
ANA
DO
MIN
ICAN
REP
UBL
IC
PER
U
IND
ON
ESIA
CÔ
TE D
’IVO
IRE
GH
ANA
DO
MIN
ICAN
REP
UBL
IC
PER
U
CÔ
TE D
’IVO
IRE
GH
ANA
DO
MIN
ICAN
REP
UBL
IC
PER
U
IND
ON
ESIA
Fairtrade (2011)
Organic (2011)
Rainforest Alliance (2012)
UTZ (2012)
Sources: FLO, 2012; J. Rijkenberg, UTZ Certified, personal communication, March 19, 2013; E. Servat & S. Fadika, Rainforest Alliance, personal communication, March 13, 2013; IISD, H. Willer, FiBL, personal communication, August 26, 2013.
table 7.1 standard-Compliant and Conventional key statistiCs For CoCoa produCtion and trade.
Figure 7.2 leading produCers oF standard-Compliant CoCoa by initiative, 2011/2012.
SSI Review 2014 | 135
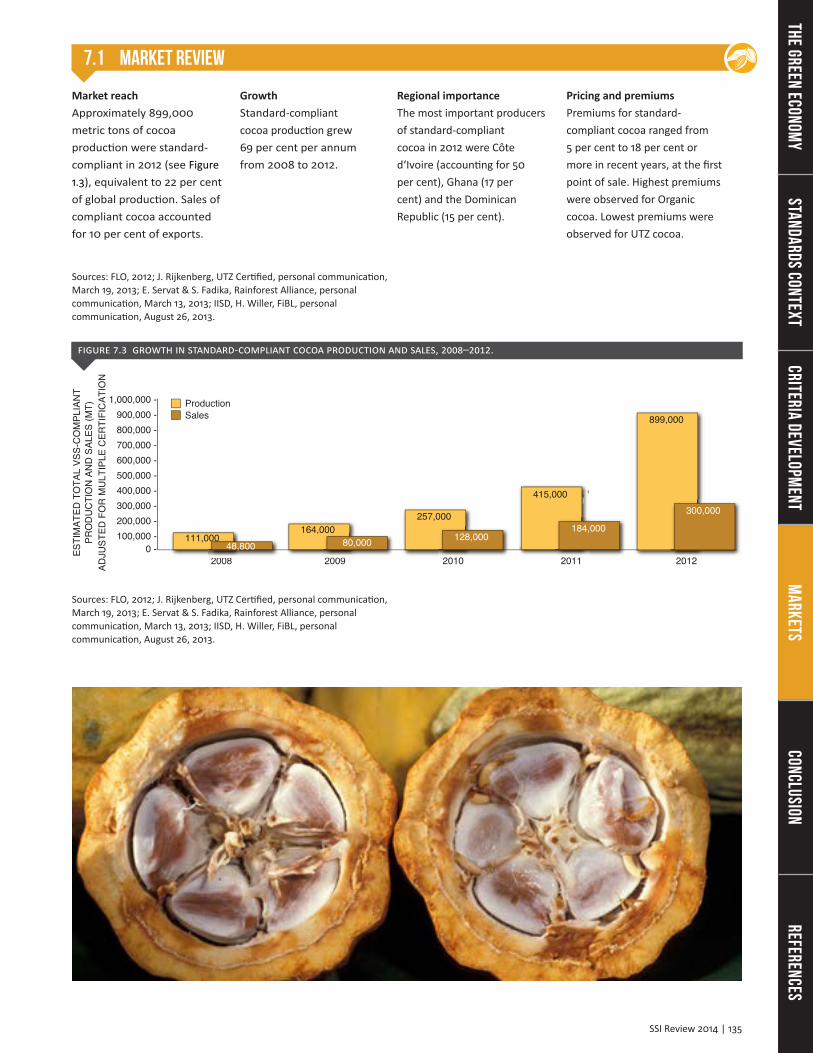
7.1 Market Review
Market reachApproximately 899,000 metric tons of cocoa production were standard-compliant in 2012 (see Figure 1.3), equivalent to 22 per cent of global production. Sales of compliant cocoa accounted for 10 per cent of exports.
GrowthStandard-compliant cocoa production grew 69 per cent per annum from 2008 to 2012.
Regional importanceThe most important producers of standard-compliant cocoa in 2012 were Côte d‘Ivoire (accounting for 50 per cent), Ghana (17 per cent) and the Dominican Republic (15 per cent).
Pricing and premiumsPremiums for standard-compliant cocoa ranged from 5 per cent to 18 per cent or more in recent years, at the first point of sale. Highest premiums were observed for Organic cocoa. Lowest premiums were observed for UTZ cocoa.
Sources: FLO, 2012; J. Rijkenberg, UTZ Certified, personal communication, March 19, 2013; E. Servat & S. Fadika, Rainforest Alliance, personal communication, March 13, 2013; IISD, H. Willer, FiBL, personal communication, August 26, 2013.
2008 2009 2010 2011
ProductionSales
2012
111,000 164,000
257,000
415,000
899,000
48,800 80,000 128,000 184,000
300,000
0 -100,000 -200,000 -300,000 -400,000 -500,000 -600,000 -700,000 -800,000 -900,000 -
1,000,000 -
ESTI
MAT
ED T
OTA
L VS
S-C
OM
PLIA
NT
PRO
DU
CTI
ON
AN
D S
ALES
(MT)
AD
JUST
ED F
OR
MU
LTIP
LE C
ERTI
FIC
ATIO
N
Figure 7.3 growth in standard-Compliant CoCoa produCtion and sales, 2008–2012.
Sources: FLO, 2012; J. Rijkenberg, UTZ Certified, personal communication, March 19, 2013; E. Servat & S. Fadika, Rainforest Alliance, personal communication, March 13, 2013; IISD, H. Willer, FiBL, personal communication, August 26, 2013.
Banana
Biofuel
Cocoa
Co�ee
Cotton
Forestry
Palm Oil
Soy Bean
Sugar Cane
Tea
ReferencesConclusion
Markets
Criteria Development
Standards ContextThe Green Econom
y
136 | SSI Review 2014
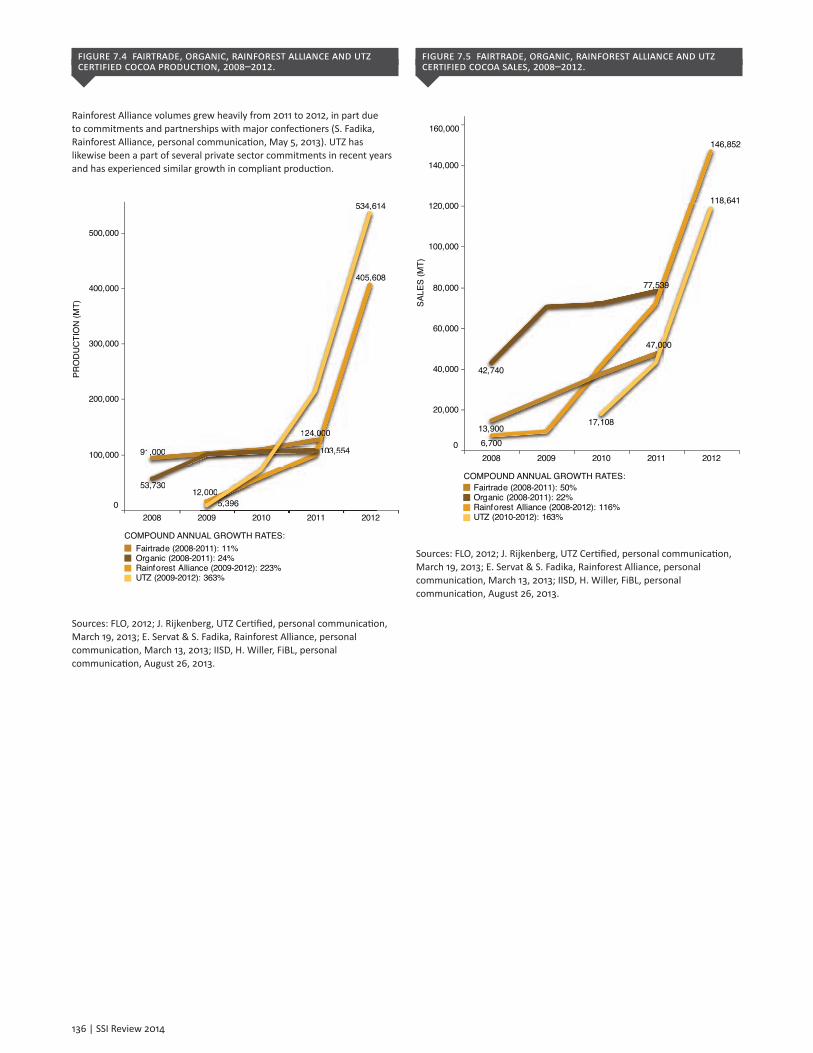
Figure 7.4 Fairtrade, organiC, rainForest allianCe and utZ CertiFied CoCoa produCtion, 2008–2012.
Rainforest Alliance volumes grew heavily from 2011 to 2012, in part due to commitments and partnerships with major confectioners (S. Fadika, Rainforest Alliance, personal communication, May 5, 2013). UTZ has likewise been a part of several private sector commitments in recent years and has experienced similar growth in compliant production.
2008 2009 2010 2011 2012
53,730
91,000
12,000
405,608
5,396
534,614
Fairtrade (2008-2011): 11%Organic (2008-2011): 24%Rainforest Alliance (2009-2012): 223%UTZ (2009-2012): 363%
103,554
PRO
DU
CTI
ON
(MT)
COMPOUND ANNUAL GROWTH RATES:
33 77773330
1,,,0000000000
124,000
0
100,000
200,000
300,000
400,000
500,000
2,00000
4440055,66
55555555,3396
534,,6
03,55411
112244,000000000
Sources: FLO, 2012; J. Rijkenberg, UTZ Certified, personal communication, March 19, 2013; E. Servat & S. Fadika, Rainforest Alliance, personal communication, March 13, 2013; IISD, H. Willer, FiBL, personal communication, August 26, 2013.
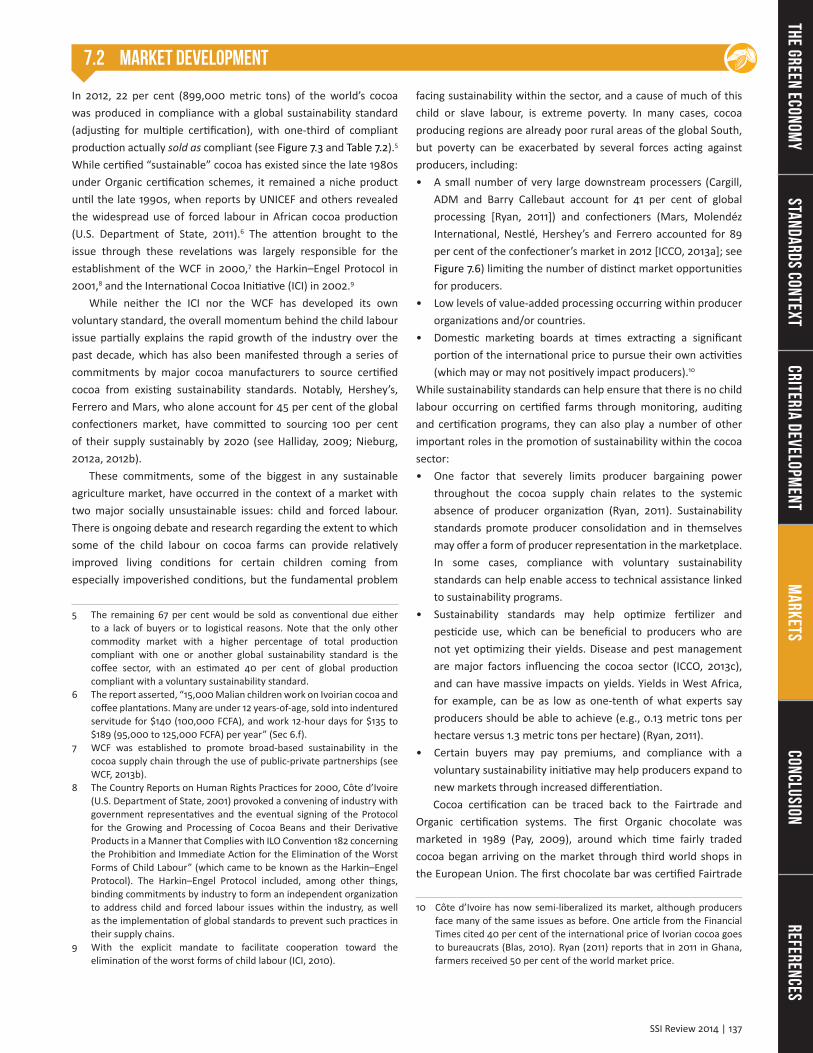
Figure 7.5 Fairtrade, organiC, rainForest allianCe and utZ CertiFied CoCoa sales, 2008–2012.
2008 2009 2010 2011 2012
42,740
77,539
13,900
47,000
146,852
17,108
118,641
Fairtrade (2008-2011): 50%Organic (2008-2011): 22%Rainforest Alliance (2008-2012): 116%UTZ (2010-2012): 163%
6,700
COMPOUND ANNUAL GROWTH RATES:
SALE
S (M
T)
0
20,000
40,000
60,000
80,000
100,000
120,000
140,000
160,000
Sources: FLO, 2012; J. Rijkenberg, UTZ Certified, personal communication, March 19, 2013; E. Servat & S. Fadika, Rainforest Alliance, personal communication, March 13, 2013; IISD, H. Willer, FiBL, personal communication, August 26, 2013.
SSI Review 2014 | 137
7.2 Market Development
In 2012, 22 per cent (899,000 metric tons) of the world’s cocoa was produced in compliance with a global sustainability standard (adjusting for multiple certification), with one-third of compliant production actually sold as compliant (see Figure 7.3 and Table 7.2).5 While certified “sustainable” cocoa has existed since the late 1980s under Organic certification schemes, it remained a niche product until the late 1990s, when reports by UNICEF and others revealed the widespread use of forced labour in African cocoa production (U.S. Department of State, 2011).6 The attention brought to the issue through these revelations was largely responsible for the establishment of the WCF in 2000,7 the Harkin–Engel Protocol in 2001,8 and the International Cocoa Initiative (ICI) in 2002.9
While neither the ICI nor the WCF has developed its own voluntary standard, the overall momentum behind the child labour issue partially explains the rapid growth of the industry over the past decade, which has also been manifested through a series of commitments by major cocoa manufacturers to source certified cocoa from existing sustainability standards. Notably, Hershey’s, Ferrero and Mars, who alone account for 45 per cent of the global confectioners market, have committed to sourcing 100 per cent of their supply sustainably by 2020 (see Halliday, 2009; Nieburg, 2012a, 2012b).
These commitments, some of the biggest in any sustainable agriculture market, have occurred in the context of a market with two major socially unsustainable issues: child and forced labour. There is ongoing debate and research regarding the extent to which some of the child labour on cocoa farms can provide relatively improved living conditions for certain children coming from especially impoverished conditions, but the fundamental problem
5 The remaining 67 per cent would be sold as conventional due either to a lack of buyers or to logistical reasons. Note that the only other commodity market with a higher percentage of total production compliant with one or another global sustainability standard is the coffee sector, with an estimated 40 per cent of global production compliant with a voluntary sustainability standard.
6 The report asserted, “15,000 Malian children work on Ivoirian cocoa and coffee plantations. Many are under 12 years-of-age, sold into indentured servitude for $140 (100,000 FCFA), and work 12-hour days for $135 to $189 (95,000 to 125,000 FCFA) per year” (Sec 6.f).
7 WCF was established to promote broad-based sustainability in the cocoa supply chain through the use of public-private partnerships (see WCF, 2013b).
8 The Country Reports on Human Rights Practices for 2000, Côte d’Ivoire (U.S. Department of State, 2001) provoked a convening of industry with government representatives and the eventual signing of the Protocol for the Growing and Processing of Cocoa Beans and their Derivative Products in a Manner that Complies with ILO Convention 182 concerning the Prohibition and Immediate Action for the Elimination of the Worst Forms of Child Labour” (which came to be known as the Harkin–Engel Protocol). The Harkin–Engel Protocol included, among other things, binding commitments by industry to form an independent organization to address child and forced labour issues within the industry, as well as the implementation of global standards to prevent such practices in their supply chains.
9 With the explicit mandate to facilitate cooperation toward the elimination of the worst forms of child labour (ICI, 2010).
facing sustainability within the sector, and a cause of much of this child or slave labour, is extreme poverty. In many cases, cocoa producing regions are already poor rural areas of the global South, but poverty can be exacerbated by several forces acting against producers, including: • A small number of very large downstream processers (Cargill,
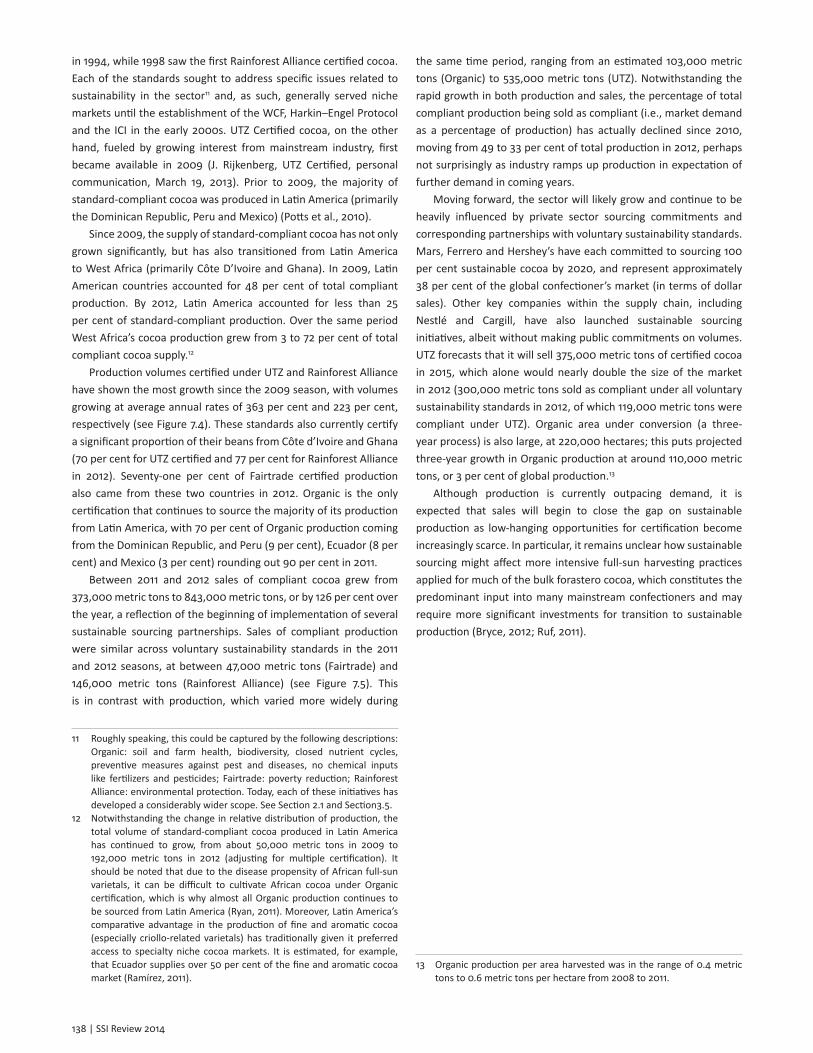
ADM and Barry Callebaut account for 41 per cent of global processing [Ryan, 2011]) and confectioners (Mars, Molendéz International, Nestlé, Hershey’s and Ferrero accounted for 89 per cent of the confectioner’s market in 2012 [ICCO, 2013a]; see Figure 7.6) limiting the number of distinct market opportunities for producers.
• Low levels of value-added processing occurring within producer organizations and/or countries.
• Domestic marketing boards at times extracting a significant portion of the international price to pursue their own activities (which may or may not positively impact producers).10
While sustainability standards can help ensure that there is no child labour occurring on certified farms through monitoring, auditing and certification programs, they can also play a number of other important roles in the promotion of sustainability within the cocoa sector:• One factor that severely limits producer bargaining power
throughout the cocoa supply chain relates to the systemic absence of producer organization (Ryan, 2011). Sustainability standards promote producer consolidation and in themselves may offer a form of producer representation in the marketplace. In some cases, compliance with voluntary sustainability standards can help enable access to technical assistance linked to sustainability programs.
• Sustainability standards may help optimize fertilizer and pesticide use, which can be beneficial to producers who are not yet optimizing their yields. Disease and pest management are major factors influencing the cocoa sector (ICCO, 2013c), and can have massive impacts on yields. Yields in West Africa, for example, can be as low as one-tenth of what experts say producers should be able to achieve (e.g., 0.13 metric tons per hectare versus 1.3 metric tons per hectare) (Ryan, 2011).
• Certain buyers may pay premiums, and compliance with a voluntary sustainability initiative may help producers expand to new markets through increased differentiation. Cocoa certification can be traced back to the Fairtrade and
Organic certification systems. The first Organic chocolate was marketed in 1989 (Pay, 2009), around which time fairly traded cocoa began arriving on the market through third world shops in the European Union. The first chocolate bar was certified Fairtrade
10 Côte d’Ivoire has now semi-liberalized its market, although producers face many of the same issues as before. One article from the Financial Times cited 40 per cent of the international price of Ivorian cocoa goes to bureaucrats (Blas, 2010). Ryan (2011) reports that in 2011 in Ghana, farmers received 50 per cent of the world market price.
Banana
Biofuel
Cocoa
Co�ee
Cotton
Forestry
Palm Oil
Soy Bean
Sugar Cane
Tea
ReferencesConclusion
Markets
Criteria Development
Standards ContextThe Green Econom
y
138 | SSI Review 2014
in 1994, while 1998 saw the first Rainforest Alliance certified cocoa. Each of the standards sought to address specific issues related to sustainability in the sector11 and, as such, generally served niche markets until the establishment of the WCF, Harkin–Engel Protocol and the ICI in the early 2000s. UTZ Certified cocoa, on the other hand, fueled by growing interest from mainstream industry, first became available in 2009 (J. Rijkenberg, UTZ Certified, personal communication, March 19, 2013). Prior to 2009, the majority of standard-compliant cocoa was produced in Latin America (primarily the Dominican Republic, Peru and Mexico) (Potts et al., 2010).
Since 2009, the supply of standard-compliant cocoa has not only grown significantly, but has also transitioned from Latin America to West Africa (primarily Côte D’Ivoire and Ghana). In 2009, Latin American countries accounted for 48 per cent of total compliant production. By 2012, Latin America accounted for less than 25 per cent of standard-compliant production. Over the same period West Africa’s cocoa production grew from 3 to 72 per cent of total compliant cocoa supply.12
Production volumes certified under UTZ and Rainforest Alliance have shown the most growth since the 2009 season, with volumes growing at average annual rates of 363 per cent and 223 per cent, respectively (see Figure 7.4). These standards also currently certify a significant proportion of their beans from Côte d’Ivoire and Ghana (70 per cent for UTZ certified and 77 per cent for Rainforest Alliance in 2012). Seventy-one per cent of Fairtrade certified production also came from these two countries in 2012. Organic is the only certification that continues to source the majority of its production from Latin America, with 70 per cent of Organic production coming from the Dominican Republic, and Peru (9 per cent), Ecuador (8 per cent) and Mexico (3 per cent) rounding out 90 per cent in 2011.
Between 2011 and 2012 sales of compliant cocoa grew from 373,000 metric tons to 843,000 metric tons, or by 126 per cent over the year, a reflection of the beginning of implementation of several sustainable sourcing partnerships. Sales of compliant production were similar across voluntary sustainability standards in the 2011 and 2012 seasons, at between 47,000 metric tons (Fairtrade) and 146,000 metric tons (Rainforest Alliance) (see Figure 7.5). This is in contrast with production, which varied more widely during
11 Roughly speaking, this could be captured by the following descriptions: Organic: soil and farm health, biodiversity, closed nutrient cycles, preventive measures against pest and diseases, no chemical inputs like fertilizers and pesticides; Fairtrade: poverty reduction; Rainforest Alliance: environmental protection. Today, each of these initiatives has developed a considerably wider scope. See Section 2.1 and Section3.5.
12 Notwithstanding the change in relative distribution of production, the total volume of standard-compliant cocoa produced in Latin America has continued to grow, from about 50,000 metric tons in 2009 to 192,000 metric tons in 2012 (adjusting for multiple certification). It should be noted that due to the disease propensity of African full-sun varietals, it can be difficult to cultivate African cocoa under Organic certification, which is why almost all Organic production continues to be sourced from Latin America (Ryan, 2011). Moreover, Latin America’s comparative advantage in the production of fine and aromatic cocoa (especially criollo-related varietals) has traditionally given it preferred access to specialty niche cocoa markets. It is estimated, for example, that Ecuador supplies over 50 per cent of the fine and aromatic cocoa market (Ramírez, 2011).
the same time period, ranging from an estimated 103,000 metric tons (Organic) to 535,000 metric tons (UTZ). Notwithstanding the rapid growth in both production and sales, the percentage of total compliant production being sold as compliant (i.e., market demand as a percentage of production) has actually declined since 2010, moving from 49 to 33 per cent of total production in 2012, perhaps not surprisingly as industry ramps up production in expectation of further demand in coming years.
Moving forward, the sector will likely grow and continue to be heavily influenced by private sector sourcing commitments and corresponding partnerships with voluntary sustainability standards. Mars, Ferrero and Hershey’s have each committed to sourcing 100 per cent sustainable cocoa by 2020, and represent approximately 38 per cent of the global confectioner’s market (in terms of dollar sales). Other key companies within the supply chain, including Nestlé and Cargill, have also launched sustainable sourcing initiatives, albeit without making public commitments on volumes. UTZ forecasts that it will sell 375,000 metric tons of certified cocoa in 2015, which alone would nearly double the size of the market in 2012 (300,000 metric tons sold as compliant under all voluntary sustainability standards in 2012, of which 119,000 metric tons were compliant under UTZ). Organic area under conversion (a three-year process) is also large, at 220,000 hectares; this puts projected three-year growth in Organic production at around 110,000 metric tons, or 3 per cent of global production.13
Although production is currently outpacing demand, it is expected that sales will begin to close the gap on sustainable production as low-hanging opportunities for certification become increasingly scarce. In particular, it remains unclear how sustainable sourcing might affect more intensive full-sun harvesting practices applied for much of the bulk forastero cocoa, which constitutes the predominant input into many mainstream confectioners and may require more significant investments for transition to sustainable production (Bryce, 2012; Ruf, 2011).
13 Organic production per area harvested was in the range of 0.4 metric tons to 0.6 metric tons per hectare from 2008 to 2011.
SSI Review 2014 | 139
Figure 7.6 top global ConFeCtionery Companies that manuFaCture some Form oF ChoColate, by net ConFeCtionery sales value, 2012.
Although high concentration in the chocolate sector has historically been associated with reduced bargaining power among producers (Ryan, 2011), it also points toward the opportunity for substantial adoption of sustainable practices through a limited number of sourcing commitments.
Mars Inc. (USA) 22%
Mondelez International Inc. (USA)21%
Nestlé SA(Switzerland) 17%
Hershey Foods Corp(USA) 9%
Ferrero Group(Italy) 7%
ChocoladenfabrikenLindt & Sprüngli AG
(Switzerland) 4%
August Storck KG(Germany) 3%
Yildiz Holding(Turkey) 3%
Other 14%
Mars Inc. (U
MIn21orp
9%
ng3%
Other 14%
Source: ICCO, 2013a.
7.3 Market Performance
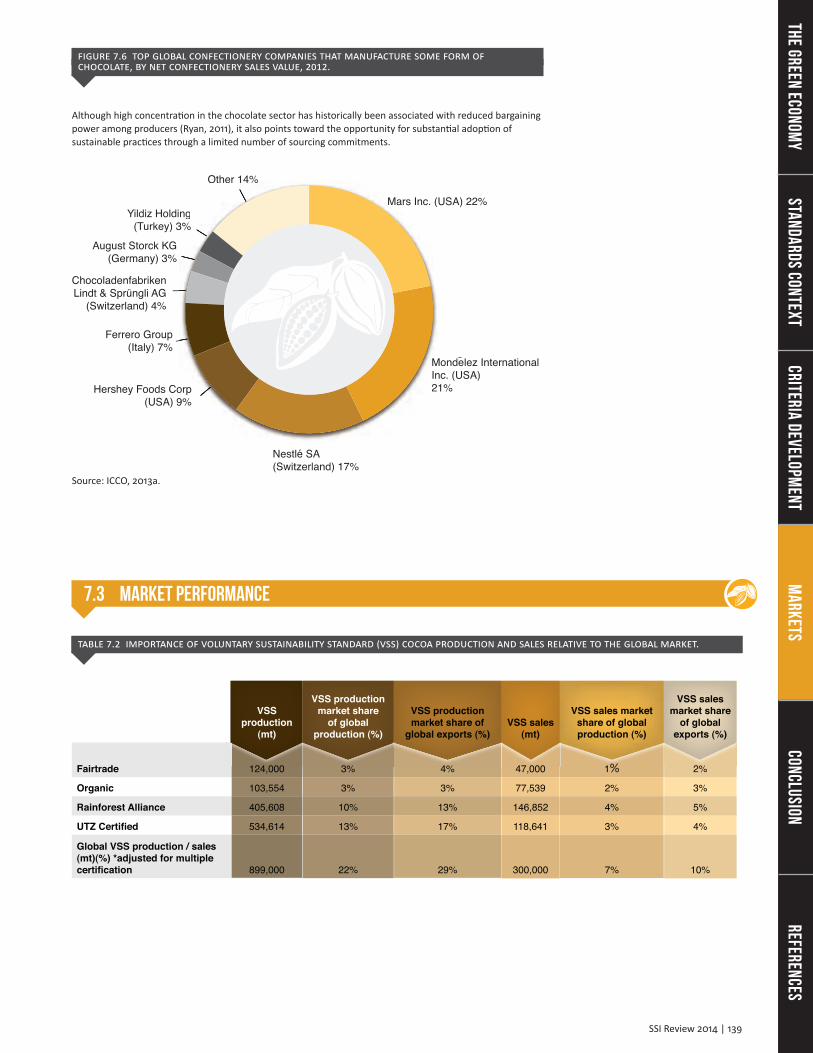
table 7.2 importanCe oF voluntary sustainability standard (vss) CoCoa produCtion and sales relative to the global market.
Fairtrade 124,000 3% 4% 47,000 1% 2%
Organic 103,554 3% 3% 77,539 2% 3%
Rainforest Alliance 405,608 10% 13% 146,852 4% 5%
534,614 13% 17% 118,641 3% 4%
Global VSS production / sales (mt)(%) *adjusted for multiple
899,000 22% 29% 300,000 7% 10%
VSS production
(mt)
VSS production market share
of global production (%)
VSS production market share of
global exports (%)VSS sales
(mt)
VSS sales market share of global production (%)
VSS sales market share
of global exports (%)
Banana
Biofuel
Cocoa
Co�ee
Cotton
Forestry
Palm Oil
Soy Bean
Sugar Cane
Tea
ReferencesConclusion
Markets
Criteria Development
Standards ContextThe Green Econom
y
140 | SSI Review 2014
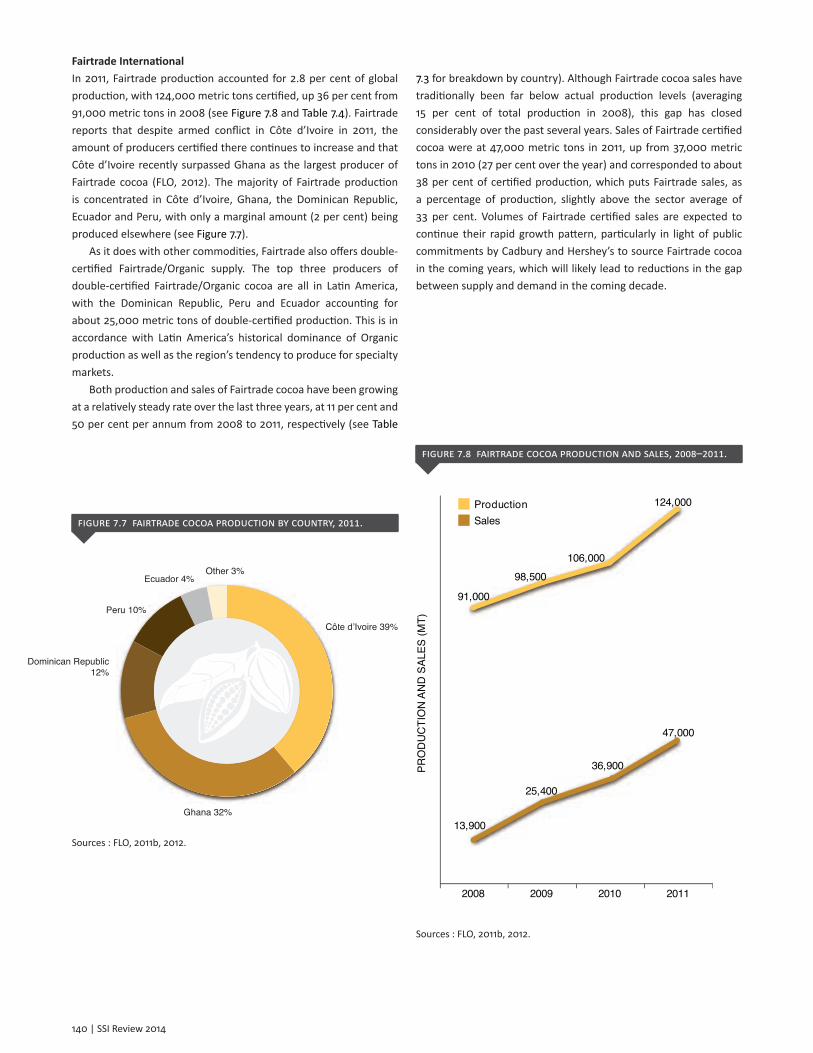
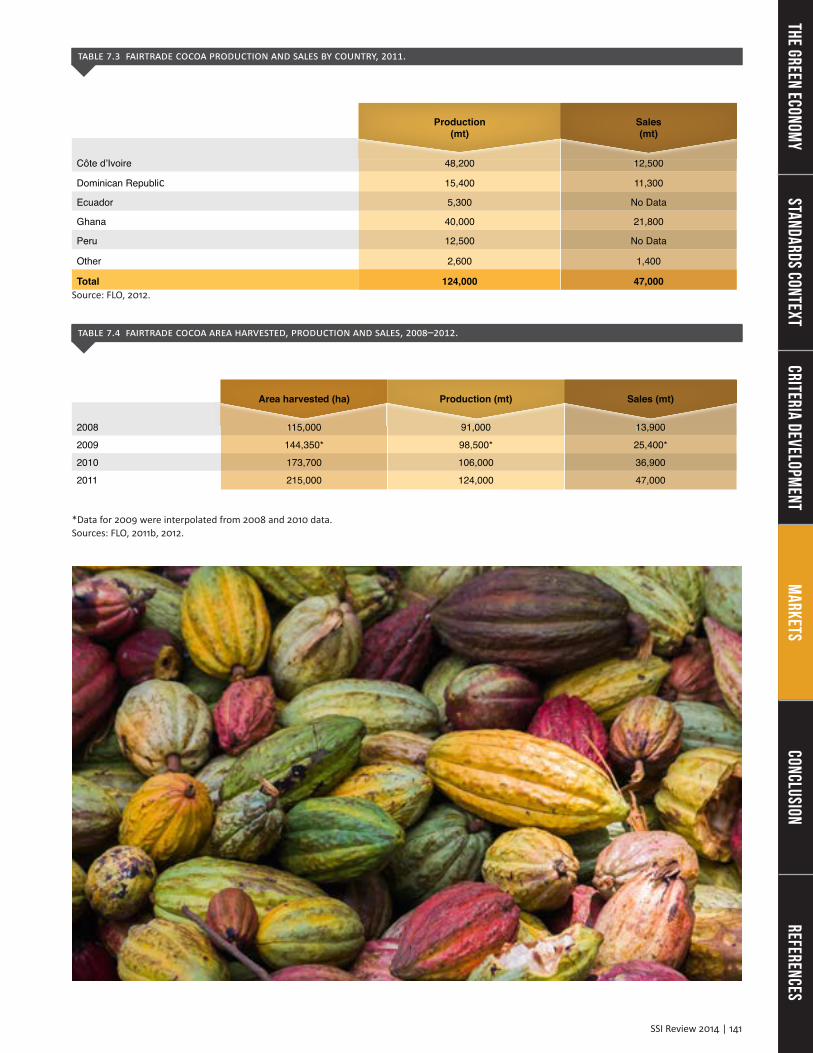
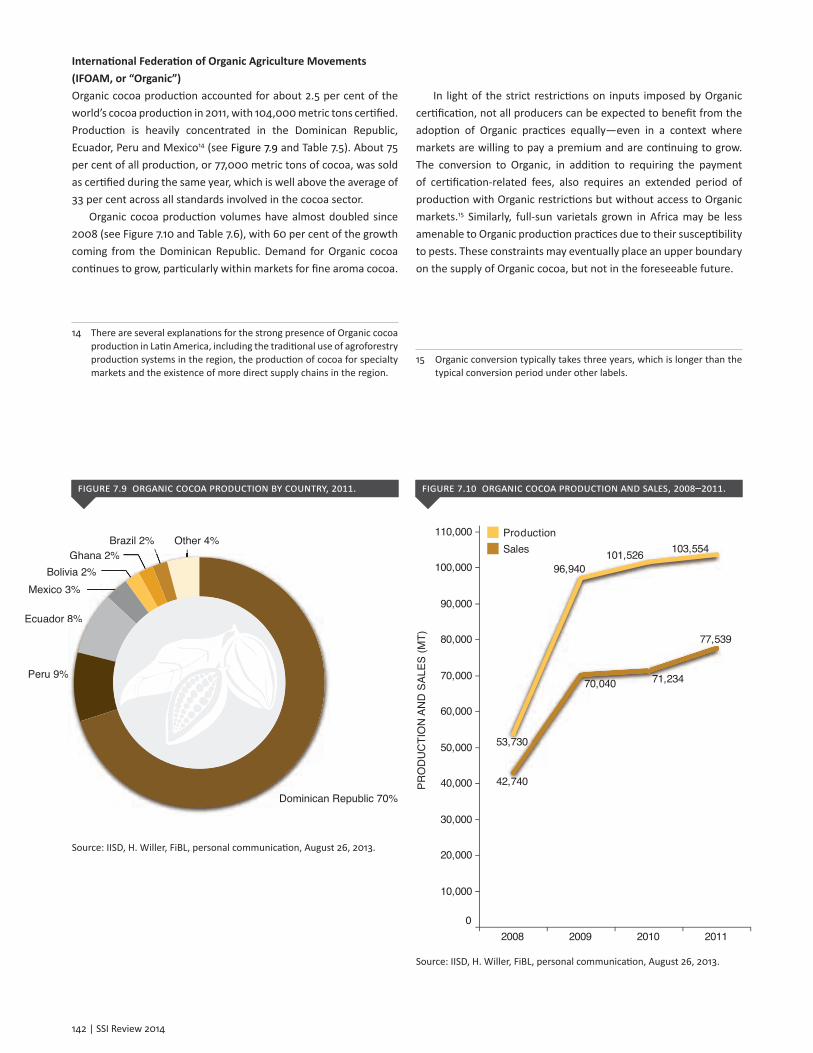
Fairtrade International In 2011, Fairtrade production accounted for 2.8 per cent of global production, with 124,000 metric tons certified, up 36 per cent from 91,000 metric tons in 2008 (see Figure 7.8 and Table 7.4). Fairtrade reports that despite armed conflict in Côte d’Ivoire in 2011, the amount of producers certified there continues to increase and that Côte d’Ivoire recently surpassed Ghana as the largest producer of Fairtrade cocoa (FLO, 2012). The majority of Fairtrade production is concentrated in Côte d’Ivoire, Ghana, the Dominican Republic, Ecuador and Peru, with only a marginal amount (2 per cent) being produced elsewhere (see Figure 7.7).
As it does with other commodities, Fairtrade also offers double-certified Fairtrade/Organic supply. The top three producers of double-certified Fairtrade/Organic cocoa are all in Latin America, with the Dominican Republic, Peru and Ecuador accounting for about 25,000 metric tons of double-certified production. This is in accordance with Latin America’s historical dominance of Organic production as well as the region’s tendency to produce for specialty markets.
Both production and sales of Fairtrade cocoa have been growing at a relatively steady rate over the last three years, at 11 per cent and 50 per cent per annum from 2008 to 2011, respectively (see Table
7.3 for breakdown by country). Although Fairtrade cocoa sales have traditionally been far below actual production levels (averaging 15 per cent of total production in 2008), this gap has closed considerably over the past several years. Sales of Fairtrade certified cocoa were at 47,000 metric tons in 2011, up from 37,000 metric tons in 2010 (27 per cent over the year) and corresponded to about 38 per cent of certified production, which puts Fairtrade sales, as a percentage of production, slightly above the sector average of 33 per cent. Volumes of Fairtrade certified sales are expected to continue their rapid growth pattern, particularly in light of public commitments by Cadbury and Hershey’s to source Fairtrade cocoa in the coming years, which will likely lead to reductions in the gap between supply and demand in the coming decade.
Figure 7.7 Fairtrade CoCoa produCtion by Country, 2011.
Côte d’Ivoire 39%
Ghana 32%
Dominican Republic12%
Peru 10%
Ecuador 4%Other 3%
Côt
eru 10%
Ecuador 4%
Sources : FLO, 2011b, 2012.
Figure 7.8 Fairtrade CoCoa produCtion and sales, 2008–2011.
2008 2009 2010 2011
13,900
25,400
36,900
47,000
91,000
106,000
124,000ProductionSales
PRO
DU
CTI
ON
AN
D S
ALES
(MT)
98,500
Sources : FLO, 2011b, 2012.
SSI Review 2014 | 141
table 7.3 Fairtrade CoCoa produCtion and sales by Country, 2011.
Côte d’Ivoire 48,200 12,500
Dominican Republic 15,400 11,300
Ecuador 5,300 No Data
Ghana 40,000 21,800
Peru 12,500 No Data
Other 2,600 1,400
Total 124,000 47,000
Production(mt)
Sales(mt)
Source: FLO, 2012.
table 7.4 Fairtrade CoCoa area harvested, produCtion and sales, 2008–2012.
2008 115,000 91,000 13,900
2009 144,350* 98,500* 25,400*
2010 173,700 106,000 36,900
2011 215,000 124,000 47,000
115 000 91 000 13 900
Area harvested (ha) Production (mt) Sales (mt)
*Data for 2009 were interpolated from 2008 and 2010 data. Sources: FLO, 2011b, 2012.
ReferencesConclusion
Markets
Criteria Development
Standards ContextThe Green Econom
y
142 | SSI Review 2014
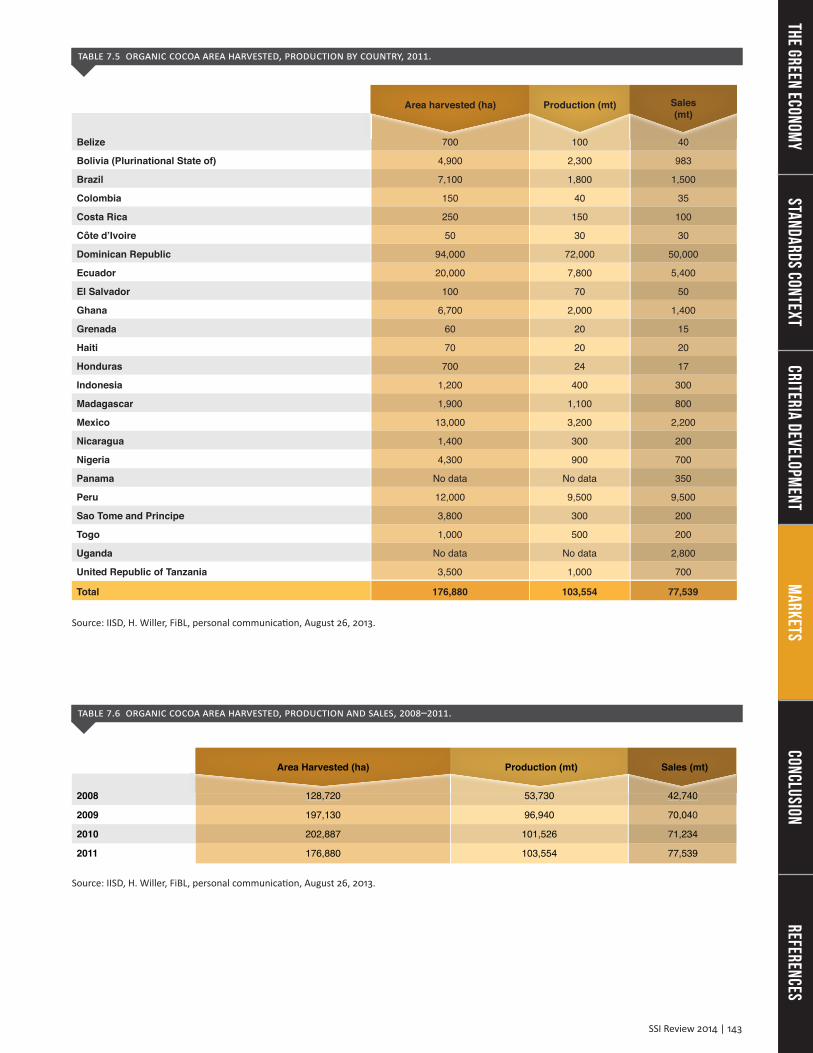
International Federation of Organic Agriculture Movements (IFOAM, or “Organic”)Organic cocoa production accounted for about 2.5 per cent of the world’s cocoa production in 2011, with 104,000 metric tons certified. Production is heavily concentrated in the Dominican Republic, Ecuador, Peru and Mexico14 (see Figure 7.9 and Table 7.5). About 75 per cent of all production, or 77,000 metric tons of cocoa, was sold as certified during the same year, which is well above the average of 33 per cent across all standards involved in the cocoa sector.
Organic cocoa production volumes have almost doubled since 2008 (see Figure 7.10 and Table 7.6), with 60 per cent of the growth coming from the Dominican Republic. Demand for Organic cocoa continues to grow, particularly within markets for fine aroma cocoa.
14 There are several explanations for the strong presence of Organic cocoa production in Latin America, including the traditional use of agroforestry production systems in the region, the production of cocoa for specialty markets and the existence of more direct supply chains in the region.
In light of the strict restrictions on inputs imposed by Organic certification, not all producers can be expected to benefit from the adoption of Organic practices equally—even in a context where markets are willing to pay a premium and are continuing to grow. The conversion to Organic, in addition to requiring the payment of certification-related fees, also requires an extended period of production with Organic restrictions but without access to Organic markets.15 Similarly, full-sun varietals grown in Africa may be less amenable to Organic production practices due to their susceptibility to pests. These constraints may eventually place an upper boundary on the supply of Organic cocoa, but not in the foreseeable future.
15 Organic conversion typically takes three years, which is longer than the typical conversion period under other labels.
Figure 7.9 organiC CoCoa produCtion by Country, 2011.
Peru 9%
Dominican Republic 70%
Ecuador 8%
Mexico 3%Bolivia 2%
Ghana 2%Brazil 2% Other 4%
%
Dominican
8%
3%via 2%Ghana 2%
Source: IISD, H. Willer, FiBL, personal communication, August 26, 2013.
Figure 7.10 organiC CoCoa produCtion and sales, 2008–2011.
2008 2009 2010 20110
10,000
20,000
30,000
40,000
50,000
60,000
70,000
80,000
90,000
100,000
110,000
42,740
70,040 71,234
77,539
53,730
96,940101,526 103,554
ProductionSales
PRO
DU
CTI
ON
AN
D S
ALES
(MT)
Source: IISD, H. Willer, FiBL, personal communication, August 26, 2013.
SSI Review 2014 | 143
table 7.5 organiC CoCoa area harvested, produCtion by Country, 2011.
Belize 700 100 40
Bolivia (Plurinational State of) 4,900 2,300 983
Brazil 7,100 1,800 1,500
Colombia 150 40 35
Costa Rica 250 150 100
Côte d’Ivoire 50 30 30
Dominican Republic 94,000 72,000 50,000
Ecuador 20,000 7,800 5,400
El Salvador 100 70 50
Ghana 6,700 2,000 1,400
Grenada 60 20 15
Haiti 70 20 20
Honduras 700 24 17
Indonesia 1,200 400 300
Madagascar 1,900 1,100 800
Mexico 13,000 3,200 2,200
Nicaragua 1,400 300 200
Nigeria 4,300 900 700
Panama No data No data 350
Peru 12,000 9,500 9,500
Sao Tome and Principe 3,800 300 200
Togo 1,000 500 200
Uganda No data No data 2,800
United Republic of Tanzania 3,500 1,000 700
Total 176,880 103,554 77,539
100700 40
Area harvested (ha) Production (mt) Sales (mt)
Source: IISD, H. Willer, FiBL, personal communication, August 26, 2013.
table 7.6 organiC CoCoa area harvested, produCtion and sales, 2008–2011.
2008 128,720 53,730 42,740
2009 197,130 96,940 70,040
2010 202,887 101,526 71,234
2011 176,880 103,554 77,539
128 720 53 730 42 740
Area Harvested (ha) Production (mt) Sales (mt)
Source: IISD, H. Willer, FiBL, personal communication, August 26, 2013.
ReferencesConclusion
Markets
Criteria Development
Standards ContextThe Green Econom
y
144 | SSI Review 2014
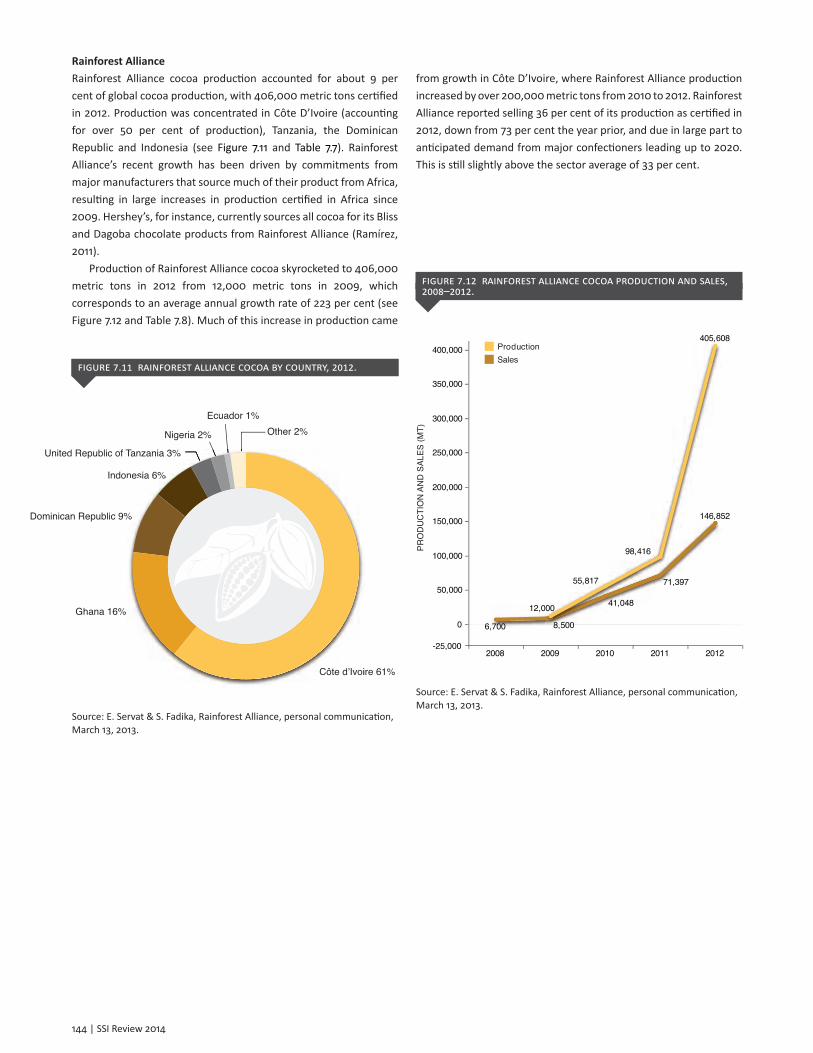
Rainforest AllianceRainforest Alliance cocoa production accounted for about 9 per cent of global cocoa production, with 406,000 metric tons certified in 2012. Production was concentrated in Côte D’Ivoire (accounting for over 50 per cent of production), Tanzania, the Dominican Republic and Indonesia (see Figure 7.11 and Table 7.7). Rainforest Alliance’s recent growth has been driven by commitments from major manufacturers that source much of their product from Africa, resulting in large increases in production certified in Africa since 2009. Hershey’s, for instance, currently sources all cocoa for its Bliss and Dagoba chocolate products from Rainforest Alliance (Ramírez, 2011).
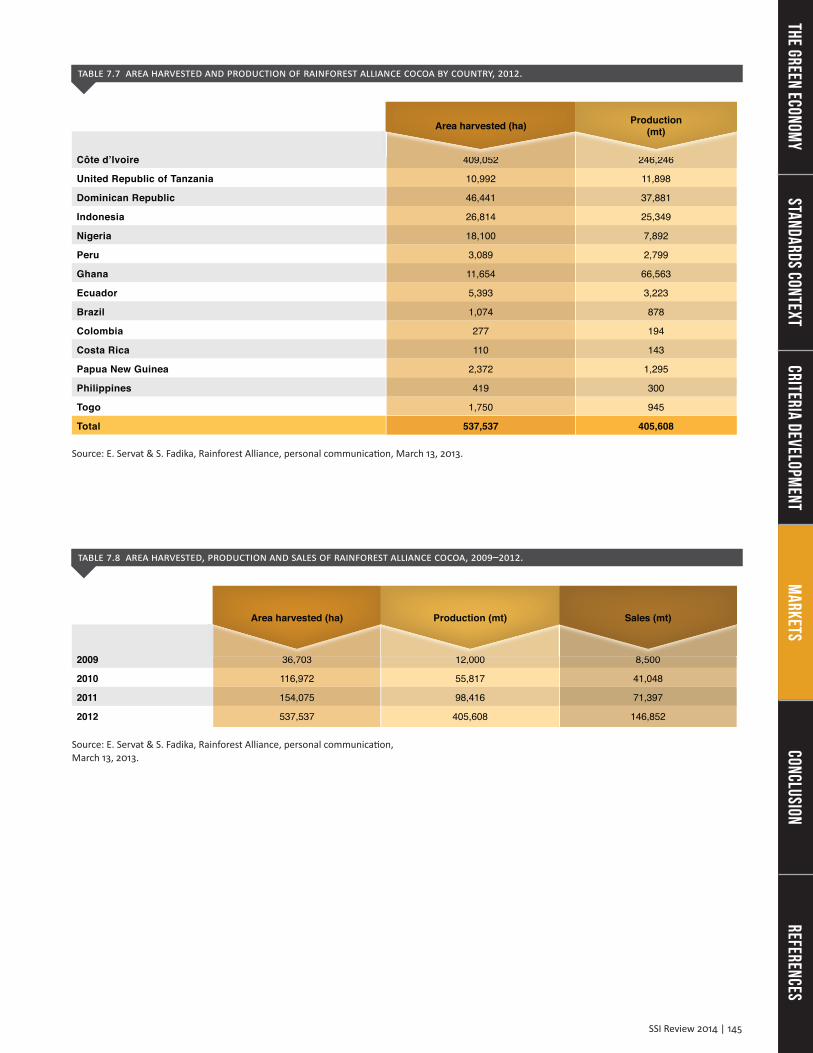
Production of Rainforest Alliance cocoa skyrocketed to 406,000 metric tons in 2012 from 12,000 metric tons in 2009, which corresponds to an average annual growth rate of 223 per cent (see Figure 7.12 and Table 7.8). Much of this increase in production came
from growth in Côte D’Ivoire, where Rainforest Alliance production increased by over 200,000 metric tons from 2010 to 2012. Rainforest Alliance reported selling 36 per cent of its production as certified in 2012, down from 73 per cent the year prior, and due in large part to anticipated demand from major confectioners leading up to 2020. This is still slightly above the sector average of 33 per cent.
Figure 7.11 rainForest allianCe CoCoa by Country, 2012.
Côte d’Ivoire 61%
Ghana 16%
Dominican Republic 9%
Indonesia 6%
United Republic of Tanzania 3%
Nigeria 2%
Ecuador 1% Other 2%
Côte d’Ivoi
%
nesia 6%
Tanzania 3%
Source: E. Servat & S. Fadika, Rainforest Alliance, personal communication, March 13, 2013.
Figure 7.12 rainForest allianCe CoCoa produCtion and sales, 2008–2012.
2008 2009 2010 2011 2012
0
50,000
100,000
150,000
200,000
250,000
300,000
350,000
400,000
6,700 8,500
41,048
71,397
146,852
12,000
55,817
98,416
405,608
PRO
DU
CTI
ON
AN
D S
ALES
(MT)
-25,000
ProductionSales
Source: E. Servat & S. Fadika, Rainforest Alliance, personal communication, March 13, 2013.
SSI Review 2014 | 145
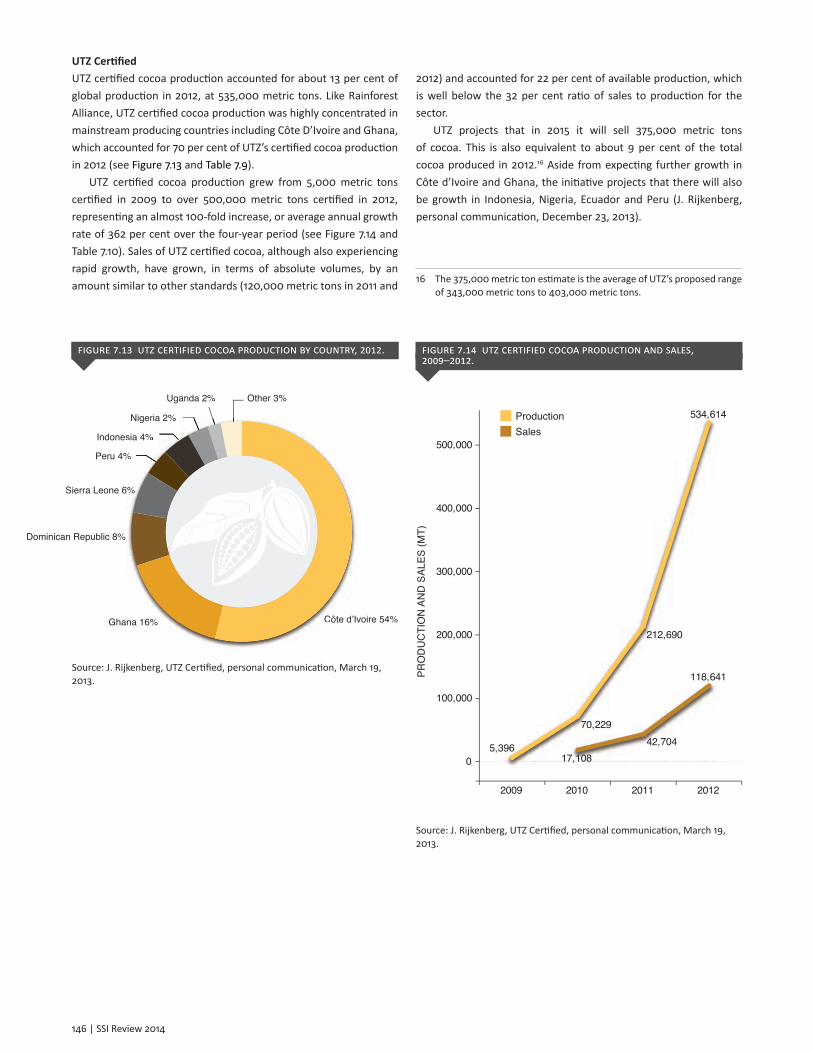
table 7.7 area harvested and produCtion oF rainForest allianCe CoCoa by Country, 2012.
Côte d’Ivoire 409,052 246,246
United Republic of Tanzania 10,992 11,898
Dominican Republic 46,441 37,881
Indonesia 26,814 25,349
Nigeria 18,100 7,892
Peru 3,089 2,799
Ghana 11,654 66,563
Ecuador 5,393 3,223
Brazil 1,074 878
Colombia 277 194
Costa Rica 110 143
Papua New Guinea 2,372 1,295
Philippines 419 300
Togo 1,750 945
Total 537,537 405,608
409 0 2 246 246
Area harvested (ha) Production(mt)
Source: E. Servat & S. Fadika, Rainforest Alliance, personal communication, March 13, 2013.
table 7.8 area harvested, produCtion and sales oF rainForest allianCe CoCoa, 2009–2012.
2009 36,703 12,000 8,500
2010 116,972 55,817 41,048
2011 154,075 98,416 71,397
2012 537,537 405,608 146,852
36 03 8 012 000 0
Area harvested (ha) Production (mt) Sales (mt)
Source: E. Servat & S. Fadika, Rainforest Alliance, personal communication, March 13, 2013.
ReferencesConclusion
Markets
Criteria Development
Standards ContextThe Green Econom
y
146 | SSI Review 2014
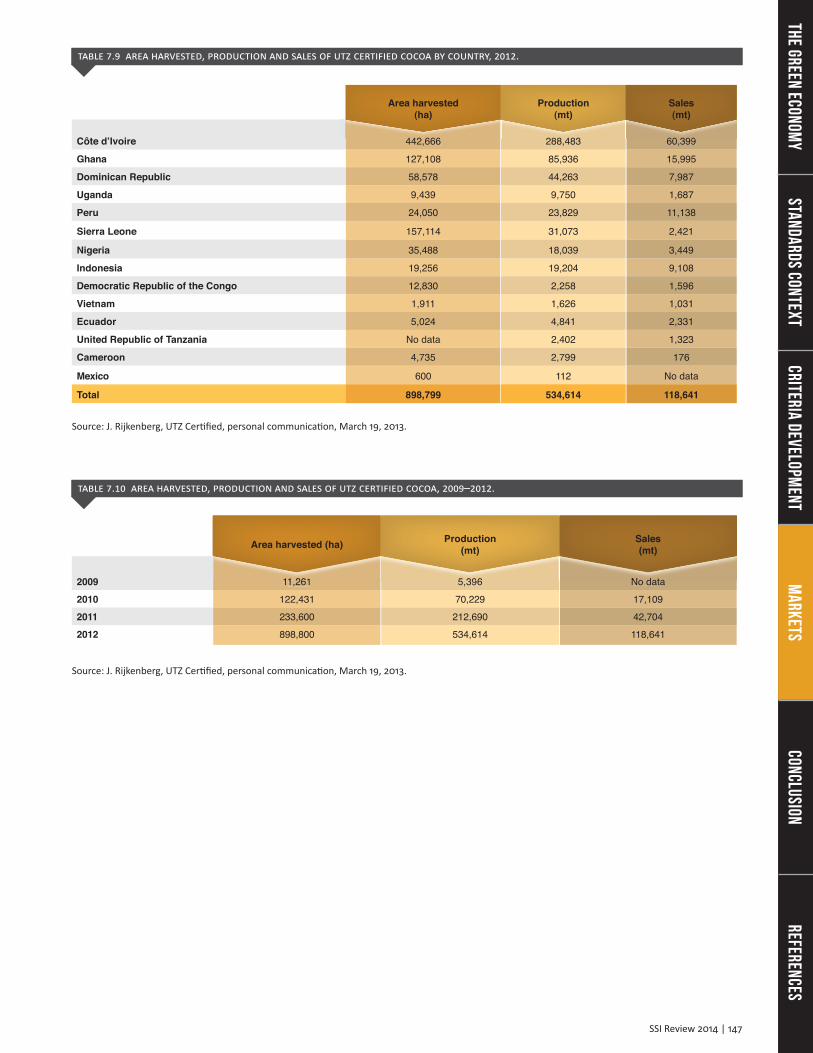
UTZ CertifiedUTZ certified cocoa production accounted for about 13 per cent of global production in 2012, at 535,000 metric tons. Like Rainforest Alliance, UTZ certified cocoa production was highly concentrated in mainstream producing countries including Côte D’Ivoire and Ghana, which accounted for 70 per cent of UTZ’s certified cocoa production in 2012 (see Figure 7.13 and Table 7.9).
UTZ certified cocoa production grew from 5,000 metric tons certified in 2009 to over 500,000 metric tons certified in 2012, representing an almost 100-fold increase, or average annual growth rate of 362 per cent over the four-year period (see Figure 7.14 and Table 7.10). Sales of UTZ certified cocoa, although also experiencing rapid growth, have grown, in terms of absolute volumes, by an amount similar to other standards (120,000 metric tons in 2011 and
2012) and accounted for 22 per cent of available production, which is well below the 32 per cent ratio of sales to production for the sector.
UTZ projects that in 2015 it will sell 375,000 metric tons of cocoa. This is also equivalent to about 9 per cent of the total cocoa produced in 2012.16 Aside from expecting further growth in Côte d’Ivoire and Ghana, the initiative projects that there will also be growth in Indonesia, Nigeria, Ecuador and Peru (J. Rijkenberg, personal communication, December 23, 2013).
16 The 375,000 metric ton estimate is the average of UTZ’s proposed range of 343,000 metric tons to 403,000 metric tons.
Figure 7.13 utZ CertiFied CoCoa produCtion by Country, 2012.
Côte d’Ivoire 54%
Sierra Leone 6%
Peru 4%
Indonesia 4%
Nigeria 2%
Uganda 2% Other 3%
Ghana 16%
Dominican Republic 8%
Côte d’Iv
6%
%
sia 4%
Nigeria 2%
na 16%
Source: J. Rijkenberg, UTZ Certified, personal communication, March 19, 2013.
Figure 7.14 utZ CertiFied CoCoa produCtion and sales, 2009–2012.
2009 2010 2011 2012
0
100,000
200,000
300,000
400,000
500,000
17,10842,704
118,641
5,396
70,229
212,690
534,614ProductionSales
PRO
DU
CTI
ON
AN
D S
ALES
(MT)
Source: J. Rijkenberg, UTZ Certified, personal communication, March 19, 2013.
SSI Review 2014 | 147
table 7.9 area harvested, produCtion and sales oF utZ CertiFied CoCoa by Country, 2012.
Côte d’Ivoire 442,666 288,483 60,399
Ghana 127,108 85,936 15,995
Dominican Republic 58,578 44,263 7,987
Uganda 9,439 9,750 1,687
Peru 24,050 23,829 11,138
Sierra Leone 157,114 31,073 2,421
Nigeria 35,488 18,039 3,449
Indonesia 19,256 19,204 9,108
Democratic Republic of the Congo 12,830 2,258 1,596
Vietnam 1,911 1,626 1,031
Ecuador 5,024 4,841 2,331
United Republic of Tanzania No data 2,402 1,323
Cameroon 4,735 2,799 176
Mexico 600 112 No data
Total 898,799 534,614 118,641
4422 6666 2888 4483 60 3399
Area harvested
(ha)Production
(mt)Sales(mt)
Source: J. Rijkenberg, UTZ Certified, personal communication, March 19, 2013.
table 7.10 area harvested, produCtion and sales oF utZ CertiFied CoCoa, 2009–2012.
2009 11,261 5,396 No data
2010 122,431 70,229 17,109
2011 233,600 212,690 42,704
2012 898,800 534,614 118,641
11 22661 5 39396 No ddata
Area harvested (ha) Production (mt)
Sales (mt)
Source: J. Rijkenberg, UTZ Certified, personal communication, March 19, 2013.
ReferencesConclusion
Markets
Criteria Development
Standards ContextThe Green Econom
y
148 | SSI Review 2014
7.4 Supply
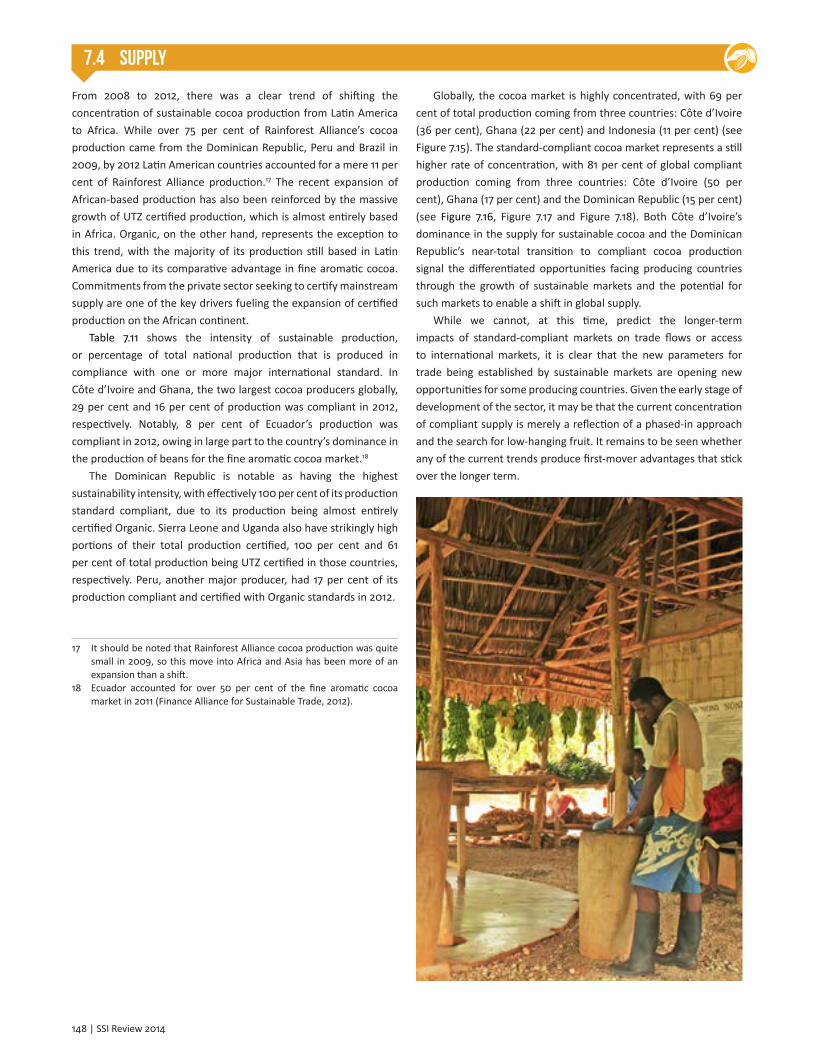
From 2008 to 2012, there was a clear trend of shifting the concentration of sustainable cocoa production from Latin America to Africa. While over 75 per cent of Rainforest Alliance’s cocoa production came from the Dominican Republic, Peru and Brazil in 2009, by 2012 Latin American countries accounted for a mere 11 per cent of Rainforest Alliance production.17 The recent expansion of African-based production has also been reinforced by the massive growth of UTZ certified production, which is almost entirely based in Africa. Organic, on the other hand, represents the exception to this trend, with the majority of its production still based in Latin America due to its comparative advantage in fine aromatic cocoa. Commitments from the private sector seeking to certify mainstream supply are one of the key drivers fueling the expansion of certified production on the African continent.
Table 7.11 shows the intensity of sustainable production, or percentage of total national production that is produced in compliance with one or more major international standard. In Côte d’Ivoire and Ghana, the two largest cocoa producers globally, 29 per cent and 16 per cent of production was compliant in 2012, respectively. Notably, 8 per cent of Ecuador’s production was compliant in 2012, owing in large part to the country’s dominance in the production of beans for the fine aromatic cocoa market.18
The Dominican Republic is notable as having the highest sustainability intensity, with effectively 100 per cent of its production standard compliant, due to its production being almost entirely certified Organic. Sierra Leone and Uganda also have strikingly high portions of their total production certified, 100 per cent and 61 per cent of total production being UTZ certified in those countries, respectively. Peru, another major producer, had 17 per cent of its production compliant and certified with Organic standards in 2012.
17 It should be noted that Rainforest Alliance cocoa production was quite small in 2009, so this move into Africa and Asia has been more of an expansion than a shift.
18 Ecuador accounted for over 50 per cent of the fine aromatic cocoa market in 2011 (Finance Alliance for Sustainable Trade, 2012).
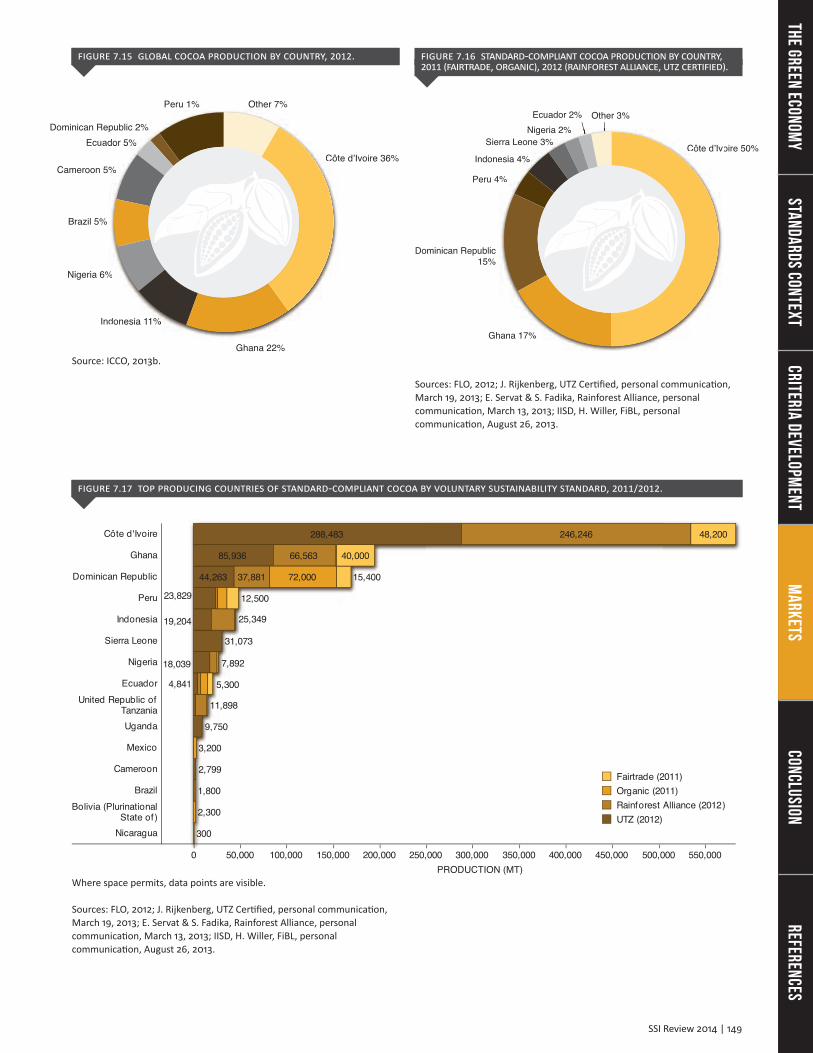
Globally, the cocoa market is highly concentrated, with 69 per cent of total production coming from three countries: Côte d’Ivoire (36 per cent), Ghana (22 per cent) and Indonesia (11 per cent) (see Figure 7.15). The standard-compliant cocoa market represents a still higher rate of concentration, with 81 per cent of global compliant production coming from three countries: Côte d’Ivoire (50 per cent), Ghana (17 per cent) and the Dominican Republic (15 per cent) (see Figure 7.16, Figure 7.17 and Figure 7.18). Both Côte d’Ivoire’s dominance in the supply for sustainable cocoa and the Dominican Republic’s near-total transition to compliant cocoa production signal the differentiated opportunities facing producing countries through the growth of sustainable markets and the potential for such markets to enable a shift in global supply.
While we cannot, at this time, predict the longer-term impacts of standard-compliant markets on trade flows or access to international markets, it is clear that the new parameters for trade being established by sustainable markets are opening new opportunities for some producing countries. Given the early stage of development of the sector, it may be that the current concentration of compliant supply is merely a reflection of a phased-in approach and the search for low-hanging fruit. It remains to be seen whether any of the current trends produce first-mover advantages that stick over the longer term.
Banana
Biofuel
Cocoa
Co�ee
Cotton
Forestry
Palm Oil
Soy Bean
Sugar Cane
Tea
SSI Review 2014 | 149
Figure 7.15 global CoCoa produCtion by Country, 2012.
Côte d’Ivoire 36%
Ghana 22%
Indonesia 11%
Nigeria 6%
Brazil 5%
Cameroon 5%
Ecuador 5%Dominican Republic 2%
Peru 1% Other 7%
Côt
donesia 11%
%
%
dor 5%public 2%
Source: ICCO, 2013b.
Figure 7.16 standard-Compliant CoCoa produCtion by Country, 2011 (Fairtrade, organiC), 2012 (rainForest allianCe, utZ CertiFied).
Côte d’Ivoire 50%
Ghana 17%
Dominican Republic15%
Peru 4%
Indonesia 4%
Sierra Leone 3%Nigeria 2%
Other 3%Ecuador 2%
Côte d’Ivo
hana 17%
%
esia 4%
rra Leone 3%Nigeria 2%
Sources: FLO, 2012; J. Rijkenberg, UTZ Certified, personal communication, March 19, 2013; E. Servat & S. Fadika, Rainforest Alliance, personal communication, March 13, 2013; IISD, H. Willer, FiBL, personal communication, August 26, 2013.
Figure 7.17 top produCing Countries oF standard-Compliant CoCoa by voluntary sustainability standard, 2011/2012.
Côte d'Ivoire
Ghana
Dominican Republic
Peru
Indonesia
Sierra Leone
Nigeria
EcuadorUnited Republic of
TanzaniaUganda
Mexico
Cameroon
BrazilBolivia (Plurinational
State of)Nicaragua
2,799
9,750
4,841
18,039
31,073
19,204
23,829
44,263
85,936
288,483
11,898
7,892
25,349
37,881
66,563
246,246
300
2,300
1,800
3,200
72,000
5,300
12,500
15,400
40,000
48,200
Fairtrade (2011)Organic (2011)Rainforest Alliance (2012)UTZ (2012)
0 50,000 100,000 150,000 200,000 250,000 300,000 350,000 400,000 450,000 500,000 550,000PRODUCTION (MT)
Where space permits, data points are visible. Sources: FLO, 2012; J. Rijkenberg, UTZ Certified, personal communication, March 19, 2013; E. Servat & S. Fadika, Rainforest Alliance, personal communication, March 13, 2013; IISD, H. Willer, FiBL, personal communication, August 26, 2013.
ReferencesConclusion
Markets
Criteria Development
Standards ContextThe Green Econom
y
150 | SSI Review 2014
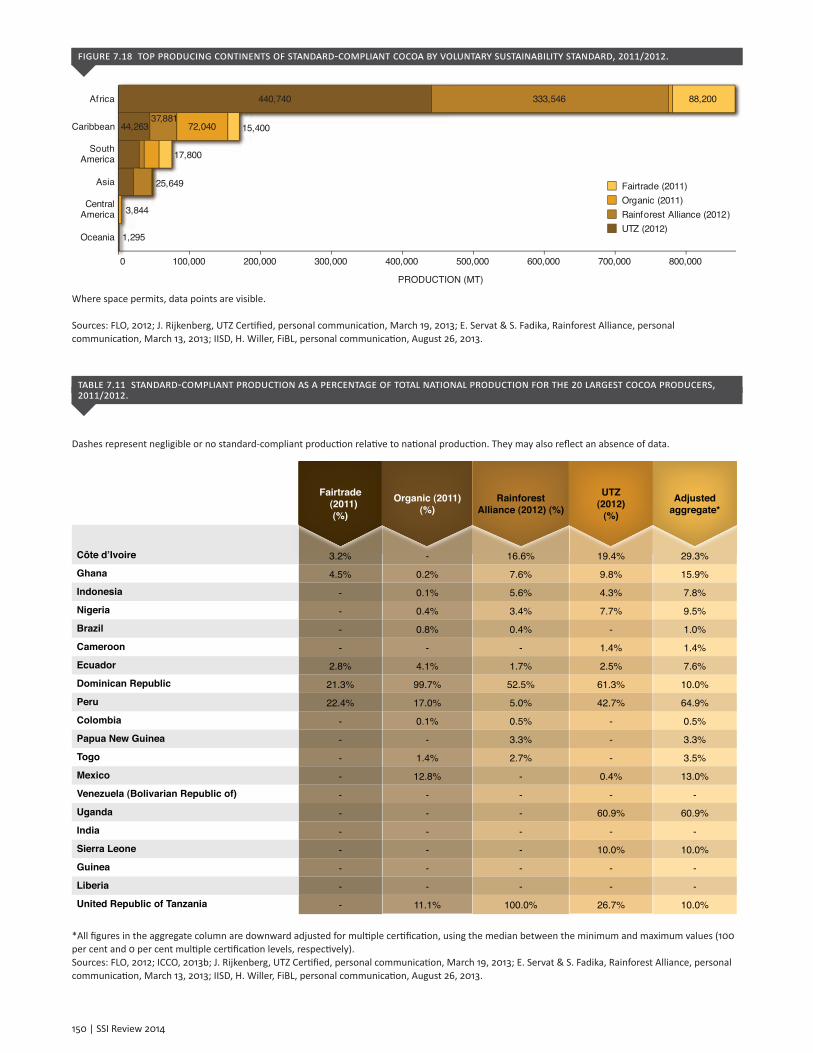
Figure 7.18 top produCing Continents oF standard-Compliant CoCoa by voluntary sustainability standard, 2011/2012.
Fairtrade (2011)Organic (2011)Rainforest Alliance (2012)UTZ (2012)
PRODUCTION (MT)
0 100,000 200,000 300,000 400,000 500,000 600,000 700,000 800,000
Africa
Caribbean
SouthAmerica
Asia
CentralAmerica
Oceania
44,263
440,740
1,295
25,649
37,881
333,546
3,844
72,040
17,800
15,400
88,200
Where space permits, data points are visible. Sources: FLO, 2012; J. Rijkenberg, UTZ Certified, personal communication, March 19, 2013; E. Servat & S. Fadika, Rainforest Alliance, personal communication, March 13, 2013; IISD, H. Willer, FiBL, personal communication, August 26, 2013.
table 7.11 standard-Compliant produCtion as a perCentage oF total national produCtion For the 20 largest CoCoa produCers, 2011/2012.
Dashes represent negligible or no standard-compliant production relative to national production. They may also reflect an absence of data.
Côte d’Ivoire 3.2% - 16.6% 19.4% 29.3%Ghana 4.5% 0.2% 7.6% 9.8% 15.9%Indonesia - 0.1% 5.6% 4.3% 7.8%Nigeria - 0.4% 3.4% 7.7% 9.5%Brazil - 0.8% 0.4% - 1.0%Cameroon - - - 1.4% 1.4%Ecuador 2.8% 4.1% 1.7% 2.5% 7.6%Dominican Republic 21.3% 99.7% 52.5% 61.3% 10.0%
Peru 22.4% 17.0% 5.0% 42.7% 64.9%
Colombia - 0.1% 0.5% - 0.5%
Papua New Guinea - - 3.3% - 3.3%
Togo - 1.4% 2.7% - 3.5%
Mexico - 12.8% - 0.4% 13.0%
Venezuela (Bolivarian Republic of) - - - - -
Uganda - - - 60.9% 60.9%
India - - - - -
Sierra Leone - - - 10.0% 10.0%
Guinea - - - - -
Liberia - - - - -United Republic of Tanzania - 11.1% 100.0% 26.7% 10.0%
Fairtrade(2011)(%)
Organic (2011)(%)
Rainforest Alliance (2012) (%)
UTZ(2012)
(%)
Adjusted aggregate*
*All figures in the aggregate column are downward adjusted for multiple certification, using the median between the minimum and maximum values (100 per cent and 0 per cent multiple certification levels, respectively). Sources: FLO, 2012; ICCO, 2013b; J. Rijkenberg, UTZ Certified, personal communication, March 19, 2013; E. Servat & S. Fadika, Rainforest Alliance, personal communication, March 13, 2013; IISD, H. Willer, FiBL, personal communication, August 26, 2013.
SSI Review 2014 | 151
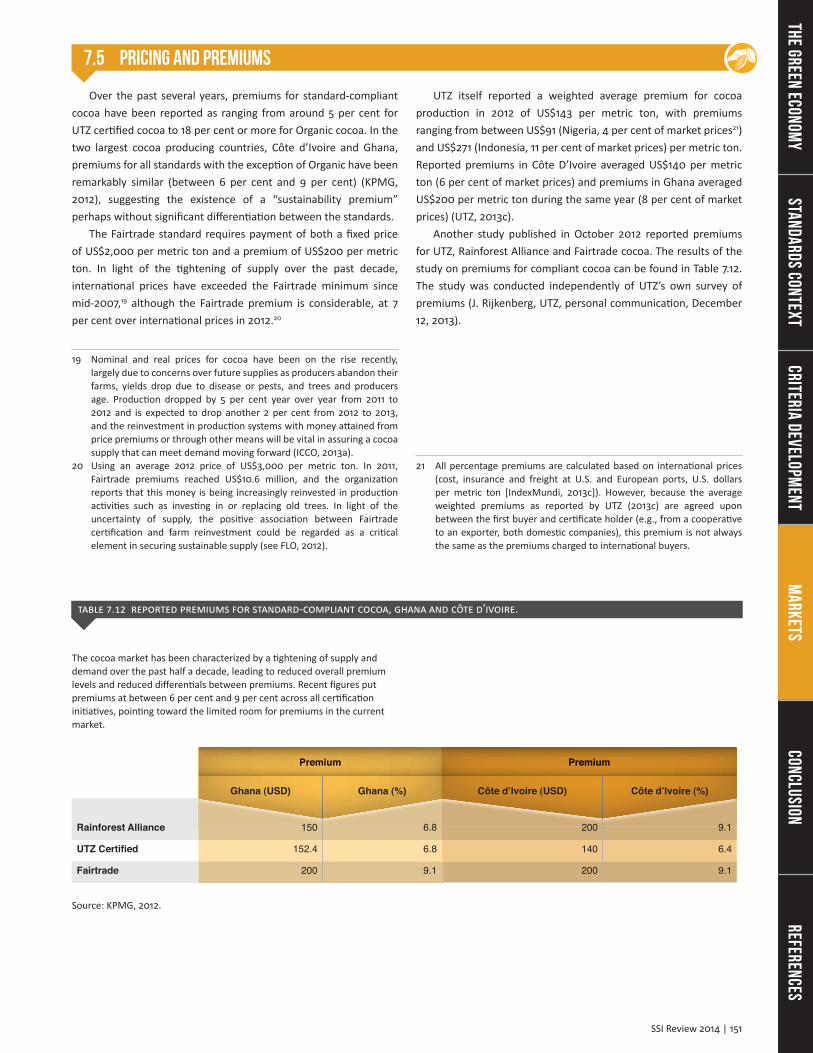
7.5 Pricing and Premiums
Over the past several years, premiums for standard-compliant cocoa have been reported as ranging from around 5 per cent for UTZ certified cocoa to 18 per cent or more for Organic cocoa. In the two largest cocoa producing countries, Côte d’Ivoire and Ghana, premiums for all standards with the exception of Organic have been remarkably similar (between 6 per cent and 9 per cent) (KPMG, 2012), suggesting the existence of a “sustainability premium” perhaps without significant differentiation between the standards.
The Fairtrade standard requires payment of both a fixed price of US$2,000 per metric ton and a premium of US$200 per metric ton. In light of the tightening of supply over the past decade, international prices have exceeded the Fairtrade minimum since mid-2007,19 although the Fairtrade premium is considerable, at 7 per cent over international prices in 2012.20
19 Nominal and real prices for cocoa have been on the rise recently, largely due to concerns over future supplies as producers abandon their farms, yields drop due to disease or pests, and trees and producers age. Production dropped by 5 per cent year over year from 2011 to 2012 and is expected to drop another 2 per cent from 2012 to 2013, and the reinvestment in production systems with money attained from price premiums or through other means will be vital in assuring a cocoa supply that can meet demand moving forward (ICCO, 2013a).
20 Using an average 2012 price of US$3,000 per metric ton. In 2011, Fairtrade premiums reached US$10.6 million, and the organization reports that this money is being increasingly reinvested in production activities such as investing in or replacing old trees. In light of the uncertainty of supply, the positive association between Fairtrade certification and farm reinvestment could be regarded as a critical element in securing sustainable supply (see FLO, 2012).
UTZ itself reported a weighted average premium for cocoa production in 2012 of US$143 per metric ton, with premiums ranging from between US$91 (Nigeria, 4 per cent of market prices21) and US$271 (Indonesia, 11 per cent of market prices) per metric ton. Reported premiums in Côte D’Ivoire averaged US$140 per metric ton (6 per cent of market prices) and premiums in Ghana averaged US$200 per metric ton during the same year (8 per cent of market prices) (UTZ, 2013c).
Another study published in October 2012 reported premiums for UTZ, Rainforest Alliance and Fairtrade cocoa. The results of the study on premiums for compliant cocoa can be found in Table 7.12. The study was conducted independently of UTZ’s own survey of premiums (J. Rijkenberg, UTZ, personal communication, December 12, 2013).
21 All percentage premiums are calculated based on international prices (cost, insurance and freight at U.S. and European ports, U.S. dollars per metric ton [IndexMundi, 2013c]). However, because the average weighted premiums as reported by UTZ (2013c) are agreed upon between the first buyer and certificate holder (e.g., from a cooperative to an exporter, both domestic companies), this premium is not always the same as the premiums charged to international buyers.
table 7.12 reported premiums For standard-Compliant CoCoa, ghana and Côte d’ivoire.
The cocoa market has been characterized by a tightening of supply and demand over the past half a decade, leading to reduced overall premium levels and reduced differentials between premiums. Recent figures put premiums at between 6 per cent and 9 per cent across all certification initiatives, pointing toward the limited room for premiums in the current market.
Premium Premium
Ghana (USD) Ghana (%) Côte d’Ivoire (USD) Côte d’Ivoire (%)
Rainforest Alliance 150 6.8 200 9.1
152.4 6.8 140 6.4
Fairtrade 200 9.1 200 9.1
PPre imium PPre imium
UTZ Certified
Source: KPMG, 2012.
Banana
Biofuel
Cocoa
Co�ee
Cotton
Forestry
Palm Oil
Soy Bean
Sugar Cane
Tea
ReferencesConclusion
Markets
Criteria Development
Standards ContextThe Green Econom
y
152 | SSI Review 2014
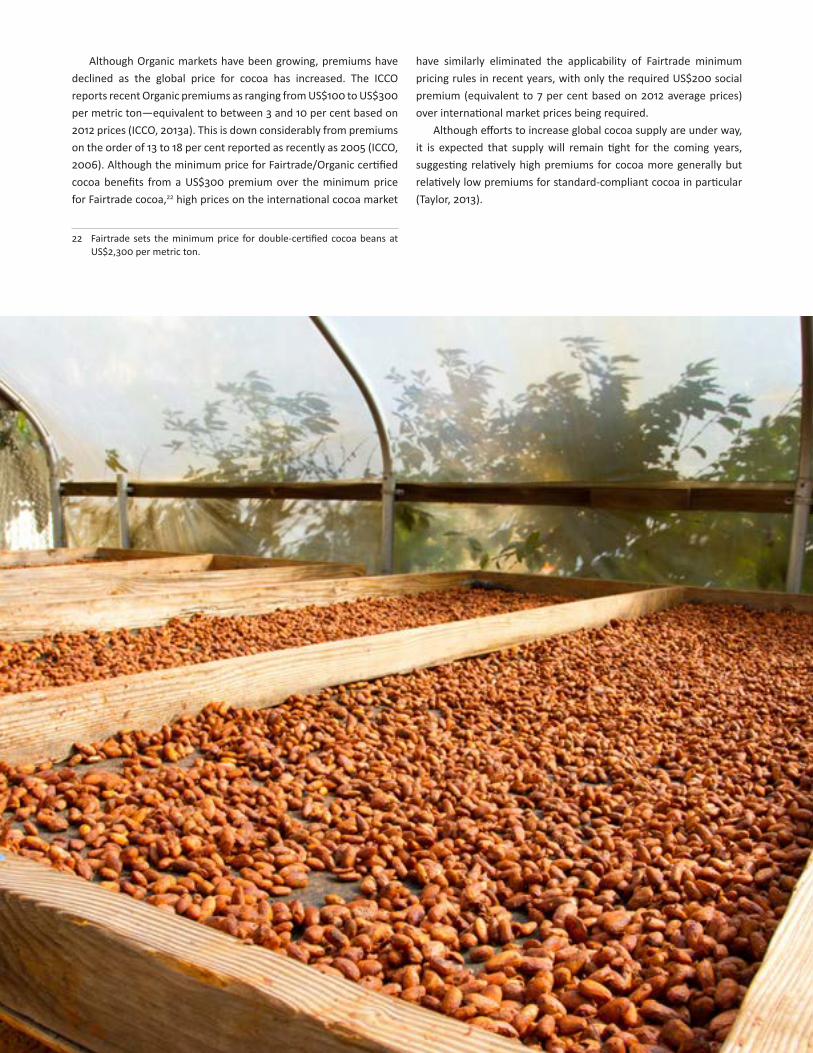
Although Organic markets have been growing, premiums have declined as the global price for cocoa has increased. The ICCO reports recent Organic premiums as ranging from US$100 to US$300 per metric ton—equivalent to between 3 and 10 per cent based on 2012 prices (ICCO, 2013a). This is down considerably from premiums on the order of 13 to 18 per cent reported as recently as 2005 (ICCO, 2006). Although the minimum price for Fairtrade/Organic certified cocoa benefits from a US$300 premium over the minimum price for Fairtrade cocoa,22 high prices on the international cocoa market
22 Fairtrade sets the minimum price for double-certified cocoa beans at US$2,300 per metric ton.
have similarly eliminated the applicability of Fairtrade minimum pricing rules in recent years, with only the required US$200 social premium (equivalent to 7 per cent based on 2012 average prices) over international market prices being required.
Although efforts to increase global cocoa supply are under way, it is expected that supply will remain tight for the coming years, suggesting relatively high premiums for cocoa more generally but relatively low premiums for standard-compliant cocoa in particular (Taylor, 2013).
SSI Review 2014 | 153
7.6 Challenges and Opportunities
Over the past five years sustainable cocoa supply has grown an average of 69 per cent per annum, reaching 899,000 metric tons in 2012, which represents an eight-fold increase in absolute volume. Given deep concerns about the security of supply, we expect investment in sustainable cocoa production systems to continue at a rapid pace in the coming years with total standard-compliant production reaching a minimum of 1.5 million metric tons by 2020, equivalent to 37 per cent of global production, or 48 per cent of global exports.23
From a broader sustainability perspective, the cocoa sector faces two convergent and widely recognized challenges. On the one hand, the productive base has faced systemic poverty over a period of many decades fuelling, among other things, the historical use of unacceptable labour practices. On the other hand, the cocoa supply base has fallen into disrepair, threatening overall global supply. Voluntary standards offer promise in addressing both of these major challenges, which explains to a large degree the significant commitments to standard-compliant production by many of the most important confectioners over the past several years.
While standard-compliant production largely emerged in the shade-grown production systems of Latin America (notably Organic production), Fairtrade, Rainforest Alliance and UTZ cocoa have rapidly expanded into mainstream markets, drawing from the full-sun production systems of Côte d’Ivoire, Ghana and Indonesia. This development shows promise for the continued growth and relevance of voluntary standards to the issues facing the sector. The fact that cocoa purchases are dominated by the countries in the global North with a long history of promoting sustainability standards (notably the Netherlands in the specific case of cocoa) also points toward the continued growth prospects for standard-compliant cocoa moving forward.
23 Note that this estimate is based on the full implementation of existing commitments to sustainable sourcing within the chocolate sector. It does not take into consideration forthcoming commitments to sustainable production and thus is considered a conservative estimate.
Moreover, with cocoa supplies tight and overall prices relatively high, the current context represents a rare opportunity for guiding increased investment within the sector toward more sustainable practices. Indeed, current market conditions suggest that the market is increasingly able to absorb the costs of transitioning to sustainable practices. Notwithstanding this potential, there is still a significant gap between existing production levels of standard-compliant cocoa and actual sales, or the explicit implementation of commitments to the purchase of sustainable cocoa. It is possible that confectioners, faced with high prices on the international market, may not feel the pressure to pay for the additional costs associated with certification per se, which could leave the voluntary sustainability standard market in jeopardy. A permanent state of oversupply on this market is unlikely to be sustainable in its own right. Special attention to, and monitoring of, the formal implementation of public commitments is therefore warranted.
Another important challenge voluntary sustainability standards face in the cocoa sector relates to the speed with which growth and uptake has evolved, particularly across the African supply base. Production conditions within the African continent face significant challenges, and ensuring that sustainable practices being claimed are actually being applied is a task of monumental proportions related not merely to the development of the requisite monitoring infrastructure within the standards systems themselves, but to the development of the needed support institutions on the ground as well. The repercussions of deep and long-standing poverty in many cocoa producing regions involve a wider community of factors than mere supply chain relations, and thus securing supply chain sustainability will require working along other channels as well. Attention to and investment in broader landscape and community development will therefore almost certainly be a prerequisite for the successful implementation of voluntary sustainability standard growth over the longer term and signals the importance of investment beyond the commercial transactions associated with standard-compliant cocoa production alone.
Banana
Biofuel
Cocoa
Co�ee
Cotton
Forestry
Palm Oil
Soy Bean
Sugar Cane
Tea
ReferencesConclusion
Markets
Criteria Development
Standards ContextThe Green Econom
y
154 | SSI Review 2014
7.7 References
Bariyo. N. (2012). Cotton farmers riot in Zambia. The Wall Street Journal. Retrieved from http://online.wsj.com/news/articles/SB10001424052702304708604577502503059994664
Blas, J. (2010, May 28). Falling cocoa yields in Ivory Coast. The Financial Times. Retrieved from http://www.ft.com
Bryce, E. (2012, December 11). Reshaping the future of cocoa in Africa. The New York Times Blog. Retrieved from http://green.blogs.nytimes.com/2012/12/11/reshaping-the-future-of-cocoa-in-africa/?_r=2
Fairtrade Labelling Organizations (FLO). (2011b). Monitoring the scope and benefits of Fairtrade, third edition. Bonn, Germany.
Fairtrade Labelling Organizations (FLO). (2012). Monitoring the scope and benefits of Fairtrade, fourth edition. Bonn, Germany.
Finance Alliance for Sustainable Trade. (2012). A brief overview of the sustainable cocoa sector in Latin America and the Caribbean. Montreal, QC.
Food and Agriculture Organization of the United Nations (FAO). (2012a). FAOStat. Retrieved from http://faostat.fao.org/default.aspx?lang=en
Halliday, J. (2009, April 10). Mars pledges sustainable cocoa only by 2020. Confectionery News. Retrieved from http://www.confectionerynews.com/Commodities/Mars-pledges-sustainable-cocoa-only-by-2020
Hershey CSR Scorecard Shows Continued Progress on Key Sustainability Initiatives. (2013, April 22). Business Wire. Retrieved from http://www.businesswire.com/news/home/ 20130422005970/en/Hershey-CSR-Scorecard-Shows-Continued-Progress-Key
IndexMundi. (2013c). Commodity prices. Retrieved from http://www.Indexmundi.com/commodities/
International Cocoa Initiative (ICI). (2010). About ICI. Retrieved from http://www.cocoainitiative.org/en/about-ici
International Cocoa Organization (ICCO). (2006). A study on the market for organic cocoa, (September), 12–15. Retrieved from http://www.icco.org/about-us/international-cocoa-agreements/cat_view/30-related-documents/37-fair-trade-organic-cocoa.html
International Cocoa Organization (ICCO). (2013a). The chocolate industry. Retrieved from http://www.icco.org/about-cocoa/chocolate-industry.html
International Cocoa Organization (ICCO). (2013b). ICCO quarterly bulletin of cocoa statistics, XXXIX(2). London, UK.
International Cocoa Organization (ICCO). (2013c). Pests and diseases. Retrieved from http://www.icco.org/about-cocoa/pest-a-diseases.html
International Trade Centre (ITC). (2013c). Trade map. Retrieved from http://www.trademap.org/
KPMG. (2012). Study on the costs, advantages and disadvantages of cocoa certification. The Netherlands.
MarketsandMarkets. (2013). MarketsandMarkets: Global Chocolate Market worth $ 98.3 billion by 2016. Retrieved from http://www.marketsandmarkets.com/PressReleases/global-chocolate-market.asp
Mars. (2012). Cocoa. Retrieved from http://www.mars.com/global/about-mars/mars-pia/our-supply-chain/cocoa.aspx
Nestlé. (n.d.) The Nestlé cocoa plan. Retrieved from http://www.corporate.Nestlé.ca/en/CreatingSharedValue/CaseStudies/Pages/TheCocoaPlan.aspx
Nieburg, O. (2012a, April 16). Ferrero promises transparency as it sets 2020 target for sustainable cocoa. Confectionery News. Retrieved from http://www.confectionerynews.com/Commodities/Ferrero-promises-transparency-as-it-sets-2020-target-for-sustainable-cocoa
Nieburg, O. (2012b, October 4). Hershey stuns critics with commitment to source 100% certified cocoa by 2020. Confectionery News. Retrieved from http://www.confectionerynews.com/Commodities/Hershey-stuns-critics-with-commitment-to-source-100-certified-cocoa-by-2020
Pay, E. (2009). The market for Organic and Fair-Trade cocoa. Food and Agriculture Organization (FAO) of the United Nations, Trade and Markets Division. Retrieved from http://www.fao.org/fileadmin/templates/organicexports/docs/Market_Organic_FT_Cocoa.pdf
Potts, J., van der Meer, J., Daitchman, J., Carlile, L., Earley, J., Kenney, K., … Holmes, D. (ed.). (2010). The State of Sustainability Initiatives review 2010: The state of sustainability and transparency. Winnipeg: IISD.
Ramírez, P. (2011). Diseño de la estrategia de mejoramiento de la cadena de valor, 1–38. Response to Hershey’s Rainforest Alliance Certified Bliss Announcement. (2012, March 19). Raise the Bar, Hershey. Retrieved from http://www.raisethebarhershey.org/response-to-hershey%E2%80%99s-rainforest-alliance-certified-bliss-announcement/
Ruf, F. O. (2011). The myth of complex cocoa agroforests: The case of Ghana. Human Ecology, 39(3), 373-388.
Ryan, Ó. (2011). Chocolate nations: Living and dying for cocoa in West Africa (1st ed.). London: Zed Books.
Taylor, M. (2013, March 26). Global cocoa prices could more than double by 2020 if output lags –Petra. Reuters. Retrieved from http://www.reuters.com/article/2013/03/26/indonesia-cocoa-deficit-idUSL3N0CI13Q20130326
U.S. Department of State (2001). Country reports on human rights practices for 2000: Côte d’Ivoire. Retrieved from http://www.state.gov/j/drl/rls/hrrpt/2000/af/773.htm
UTZ Certified. (2013c). Cocoa statistics report UTZ supply & demand trends 2012 (April).
World Cocoa Foundation (WCF). (2012a). Cocoa market update. Retrieved from http://worldcocoafoundation.org/wp-content/uploads/Cocoa-Market-Update-as-of-3.20.2012.pdf
World Cocoa Foundation (WCF). (2012b). Our approach. Retrieved from http://worldcocoafoundation.org/our-work/our-approach/
Banana
Biofuel
Cocoa
Co�ee
Cotton
Forestry
Palm Oil
Soy Bean
Sugar Cane
Tea