Embed Size (px)
Citation preview
THE GREAT RECESSIONTHE GREAT RECESSIONAND THE DEVELOPING WORLDAND THE DEVELOPING WORLD
JOSÉ ANTONIO OCAMPOJOSÉ ANTONIO OCAMPO
COLUMBIA UNIVERSITYCOLUMBIA UNIVERSITY

FIVE PHASES OF THE CRISIS
Ag 07/Mar 08: Crisis in the market for asset-backed securities
Mar-Sept 14 08: Growing distrust in financial agents after collapse of Bear Stearns.
Sept 14-March 08: Global financial and economic collapse
2nd and 3rd quarters 09: “Green shoots”
Since 4th quarter 09: the return of global imbalances
The developing countries largely escaped the first two phases, were severely affected by the third, and had diverse outcomes during the fourth and fifth.

INDUSTRIAL PRODUCTION (1)
70
75
80
85
90
95
100
105
110
115
120
Jan
_0
6
Mar
_0
6
May
_0
6
Jul_
06
Sep
_0
6
No
v_0
6
Jan
_0
7
Mar
_0
7
May
_0
7
Jul_
07
Sep
_0
7
No
v_0
7
Jan
_0
8
Mar
_0
8
May
_0
8
Jul_
08
Sep
_0
8
No
v_0
8
Jan
_0
9
Mar
_0
9
May
_0
9
Jul_
09
Sep
_0
9
No
v_0
9
Advanced Economies Emerging Economies

INDUSTRIAL PRODUCTION (2)
70
75
80
85
90
95
100
105
110
115
120
Jan
_0
6
Mar
_0
6
May
_0
6
Jul_
06
Sep
_0
6
No
v_0
6
Jan
_0
7
Mar
_0
7
May
_0
7
Jul_
07
Sep
_0
7
No
v_0
7
Jan
_0
8
Mar
_0
8
May
_0
8
Jul_
08
Sep
_0
8
No
v_0
8
Jan
_0
9
Mar
_0
9
May
_0
9
Jul_
09
Sep
_0
9
No
v_0
9
Asia Central and Eastern Europe
Latin America Africa and Middle East

WHY WAS THIS NOT A GREAT DEPRESSION?
Adoption of the most massive Keynesian package in history, by developed and several developing countries (with great diversity).
Massive financial bailouts (helped to avoid further recession, but have not contributed to the recovery)
Existence of an alternative engine: a large economy (China) that the space and willingness to adopt strongly expansionary policies.
… but risks are still present!

Remittances: affected migrants to the US, Europe and Russia, not the Gulf countries, and mainly small economies
Financial conditions generated a sharp but short effect, that affected mainly middle-income countries
The trade shock (in volume and price terms) has been more severe, and affected all countries
THE TRANSMISION OF THE CRISIS

COUNTRIES SEVERELY AFFECTED BY FALL IN REMITTANCES
CountryImpact% GDP
Tajikistan -14.2%
Moldova -6.7%
Kyrgyz Republic -5.0%
Armenia -2.7%
Honduras -2.1%
Jamaica -1.7%
El Salvador -1.6%
Georgia -1.5%
Tonga -1.4%
Morocco -1.4%
Haiti -1.1%
Guyana -1.1%
Azerbaijan -1.0%
Guatemala -1.0%

THE FINANCIAL SHOCK WAS STRONG THE FINANCIAL SHOCK WAS STRONG BUT RELATIVELY SHORT (1)BUT RELATIVELY SHORT (1)
Emerging Markets' Spreads and Yields, 1998-2010
0.0
2.0
4.0
6.0
8.0
10.0
12.0
14.0
16.0
18.0
20.0
22.0
1-Ja
n-98
1-Ja
n-99
1-Ja
n-00
1-Ja
n-01
1-Ja
n-02
1-Ja
n-03
1-Ja
n-04
1-Ja
n-05
1-Ja
n-06
1-Ja
n-07
1-Ja
n-08
1-Ja
n-09
1-Ja
n-10
Spreads Yields
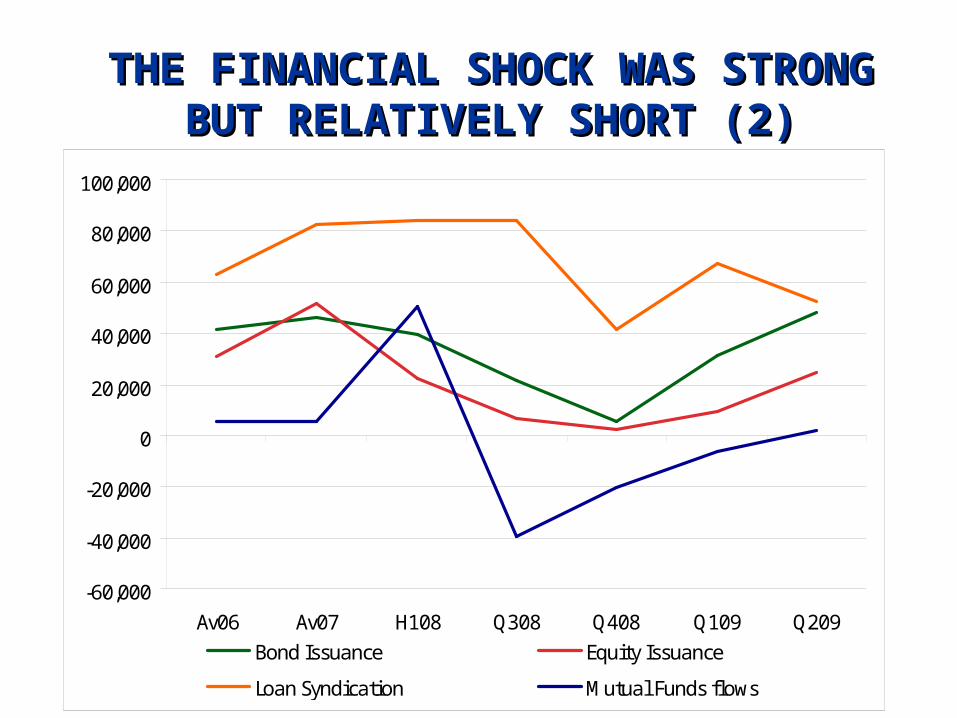
THE FINANCIAL SHOCK WAS STRONG THE FINANCIAL SHOCK WAS STRONG BUT RELATIVELY SHORT (2)BUT RELATIVELY SHORT (2)
-60,000
-40,000
-20,000
0
20,000
40,000
60,000
80,000
100,000
Av06 Av07 H108 Q308 Q408 Q109 Q209Bond Issuance Equity Issuance
Loan Syndication Mutual Funds flows

WORLD TRADE COLLAPSED, AND WORLD TRADE COLLAPSED, AND HAS NOT FULLY RECOVERED (1)HAS NOT FULLY RECOVERED (1)
70.00
75.00
80.00
85.00
90.00
95.00
100.00
105.00
110.00Ja
n_06
Mar
_0M
ay_0
Jul_
06Se
p_06
Nov
_0Ja
n_07
Mar
_0M
ay_0
Jul_
07Se
p_07
Nov
_0Ja
n_08
Mar
_0M
ay_0
Jul_
08Se
p_08
Nov
_0Ja
n_09
Mar
_0M
ay_0
Jul_
09Se
p_09
Nov
_0
Advanced Economies Emerging Economies

WORLD TRADE COLLAPSED, AND WORLD TRADE COLLAPSED, AND HAS NOT FULLY RECOVERED (2)HAS NOT FULLY RECOVERED (2)
70.00
75.00
80.00
85.00
90.00
95.00
100.00
105.00
110.00
Jan_
06M
ar_0
6M
ay_0
6Ju
l_06
Sep_
06N
ov_0
6Ja
n_07
Mar
_07
May
_07
Jul_
07Se
p_07
Nov
_07
Jan_
08M
ar_0
8M
ay_0
8Ju
l_08
Sep_
08N
ov_0
8Ja
n_09
Mar
_09
May
_09
Jul_
09Se
p_09
Nov
_09
Asia Central and Eastern EuropeLatin America Africa and Middle East

THE TRADE SHOCK HAD DIVERSETHE TRADE SHOCK HAD DIVERSEEFFECTS ACCORDING EFFECTS ACCORDING
TO SPECIALIZATION PATTERNSTO SPECIALIZATION PATTERNS
-15.00
-10.00
-5.00
0.00
5.00
10.00
15.00
All DevelopingCountries
Energy(>40%)
Mineral( >40% )
Agricult. ( >40% )
Manufact ( >50% )
Diversif.
2001-07
2008
2009
2010

Greater policy space thanks to improvements in external balance sheets of countries (except in Central and Eastern Europe)
This was reflected in reduction in interest rates and reserve requirements, and foreign exchange interventions.
Public sector banks played a positive role, high dependence on external funding for banks a very negative one.
The fiscal space was also used by many, but not all countries. East Asia and the Gulf were aggressive; South Asia went ahead despite weak fiscal situation; Latin America and Africa are more mixed stories.
COUNTER-CYCLICAL POLICIES
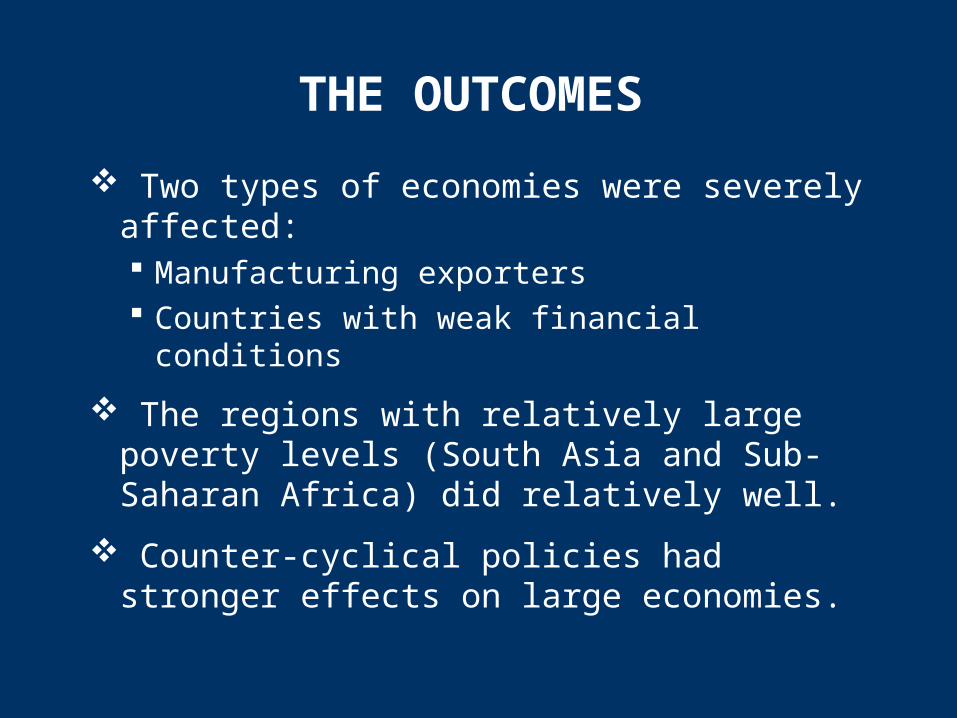
THE OUTCOMES
Two types of economies were severely affected: Manufacturing exporters Countries with weak financial conditions
The regions with relatively large poverty levels (South Asia and Sub-Saharan Africa) did relatively well.
Counter-cyclical policies had stronger effects on large economies.

REGIONS WITH GOOD OR FAIR PERFORMANCE
0.00 2.00 4.00 6.00 8.00 10.00 12.00
China
South Asia
Africa
Western Asia, exclTurkey
2003-07
2009

REGIONS WITH POOR PERFORMANCE
-8.00 -6.00 -4.00 -2.00 0.00 2.00 4.00 6.00 8.00 10.00
East Asia, excl.China
Latin America
New EU members
TransitionEconomies
2003-07
2009

SOCIAL OUTCOMES
Around 80 million additional indigents, relative to a situation of continued growth.
This does not affect much the MDG targets.
Unemployment effects have been very diverse, largely concentrated in transition economies and, lo a lesser extent, Latin America. Loss of employment in manufacturing exports was very important worldwide.
Informal employment/working poor, and the lack of social protection are more important issues in developing countries.

WITH FEW EXCEPTIONS, GAINS IN REDUCING THE WORKING POOR
WERE REVERSED
0
10
20
30
40
50
60
70
80
90
2003
2008
2009
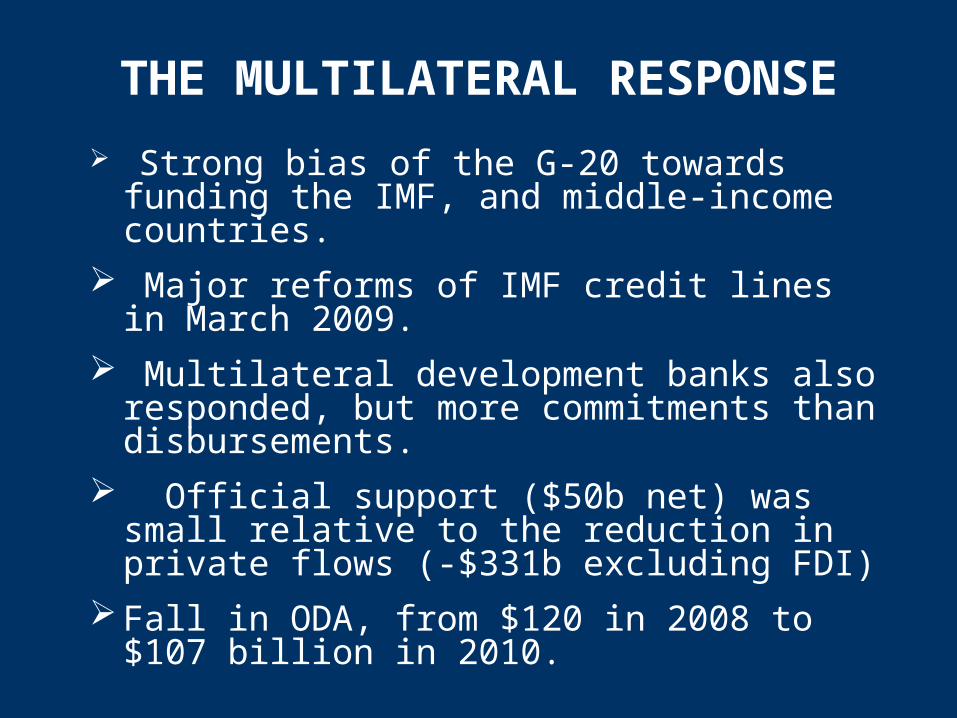
THE MULTILATERAL RESPONSE
Strong bias of the G-20 towards funding the IMF, and middle-income countries.
Major reforms of IMF credit lines in March 2009.
Multilateral development banks also responded, but more commitments than disbursements.
Official support ($50b net) was small relative to the reduction in private flows (-$331b excluding FDI)
Fall in ODA, from $120 in 2008 to $107 billion in 2010.

WORLD BANK: LARGE INCREASE IN COMMITMENTS, LIMITED
DISBURSEMENTS
-3,000
-1,000
1,000
3,000
5,000
7,000
9,000
2004-08 Average 2009 2004-08 Average 2009 2004-08 Average 2009
IBRD and IDA commitments Gross disbursements Net Flows in repayments & interest
Asia Pacific Africa South Asia Latin America & Carr. East & Central Europe MENA
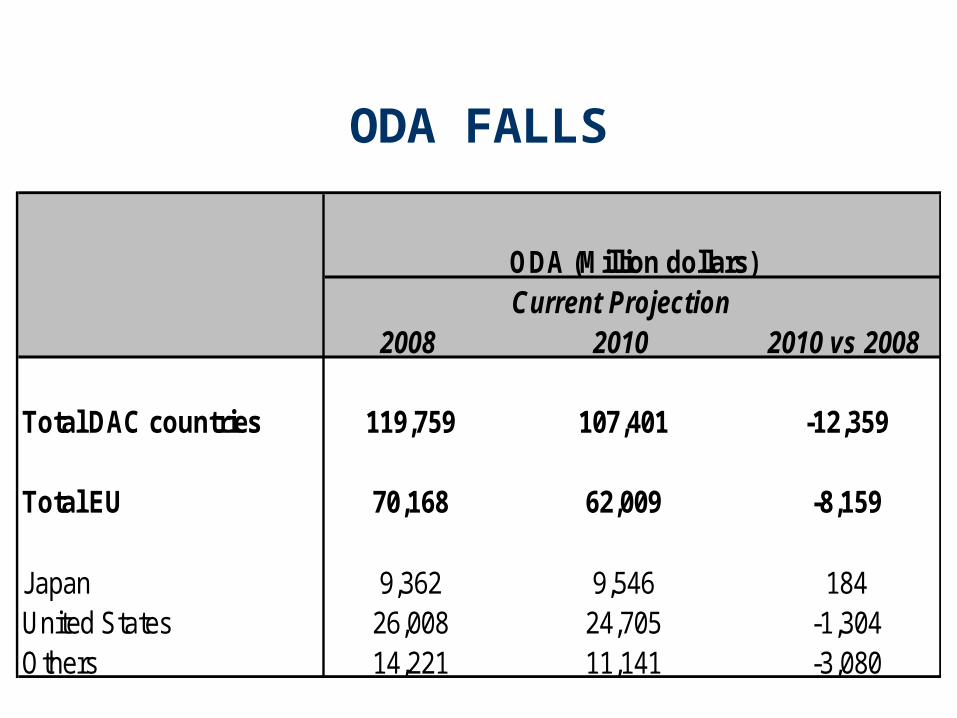
ODA FALLS
Current Projection2010 2010 vs 2008
Total DAC countries 119,759 107,401 -12,359
Total EU 70,168 62,009 -8,159
Japan 9,362 9,546 184United States 26,008 24,705 -1,304Others 14,221 11,141 -3,080
ODA (Million dollars)
2008

Mainstreaming counter-cyclical policies.
Time to look back at the domestic market, even to inward-looking strategies?
Since this has a bias in favor of large countries, a role for regional integration.
Placing employment generation at the center of all macro policies
And creating or improving social protection systems
RETHINKING THE PARADIGM

MAJOR GLOBAL ISSUES
How to avert early withdrawal of stimulus, and stable reform of finance.
If China is going to lead, how is it going to disseminate its growth to other economies?
Disorderly capital flows towards developing countries: the time to go back to capital controls?
Who is going to give confidence that countries running current account deficits would not face problems in the future?
How are the benefits from the new world growth pattern to be shared?

THE GREAT RECESSIONTHE GREAT RECESSIONAND THE DEVELOPING WORLDAND THE DEVELOPING WORLD
JOSÉ ANTONIO OCAMPOJOSÉ ANTONIO OCAMPO
COLUMBIA UNIVERSITYCOLUMBIA UNIVERSITY