Embed Size (px)
Citation preview
The Good, the Bad, & the Ugly
Interpreting the Results from Your Multiple Choice Test
The best car on the market today Is the
A. BMW 328iB. Tesla Model 3C. Volvo XC 90D. Ford F150E. Toyota Yaris
The boiling point of ethanol is
A. 173.07 degrees CB. 78.37 degrees CC. 100.00 degrees CD. 100.00 degrees FE. not calculable
Reliability
• Is test consistent?
• Similar results at different times?
• Stairs method of grading…
Validity
• Does test measure what it issupposed to measure?
• Does test reflect objectives?
• Was the test fair?
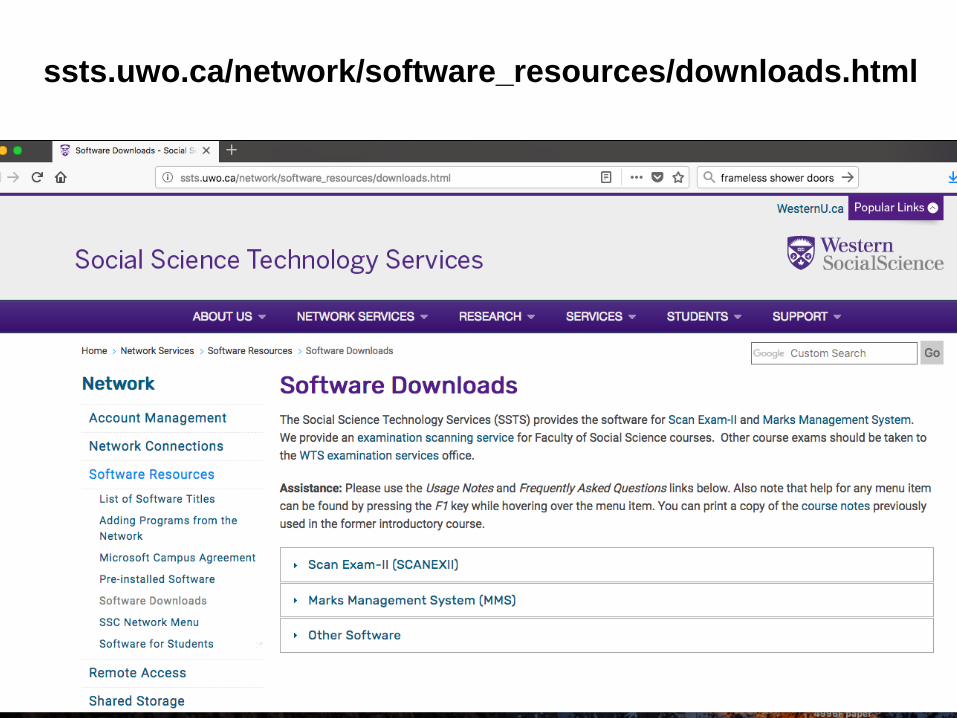
ssts.uwo.ca/network/software_resources/downloads.html
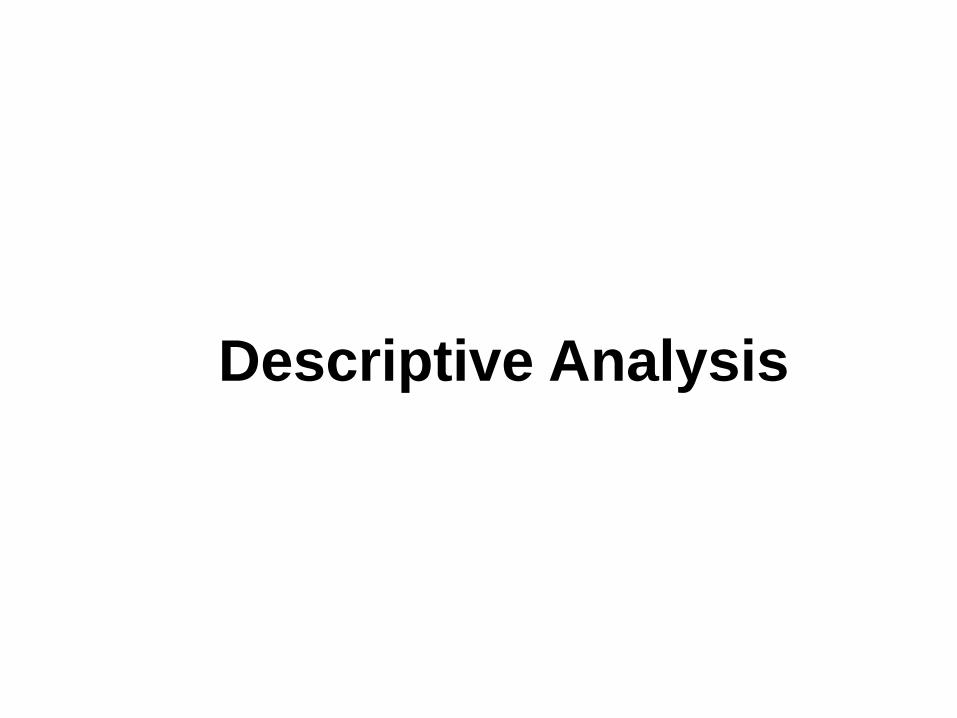
Descriptive Analysis
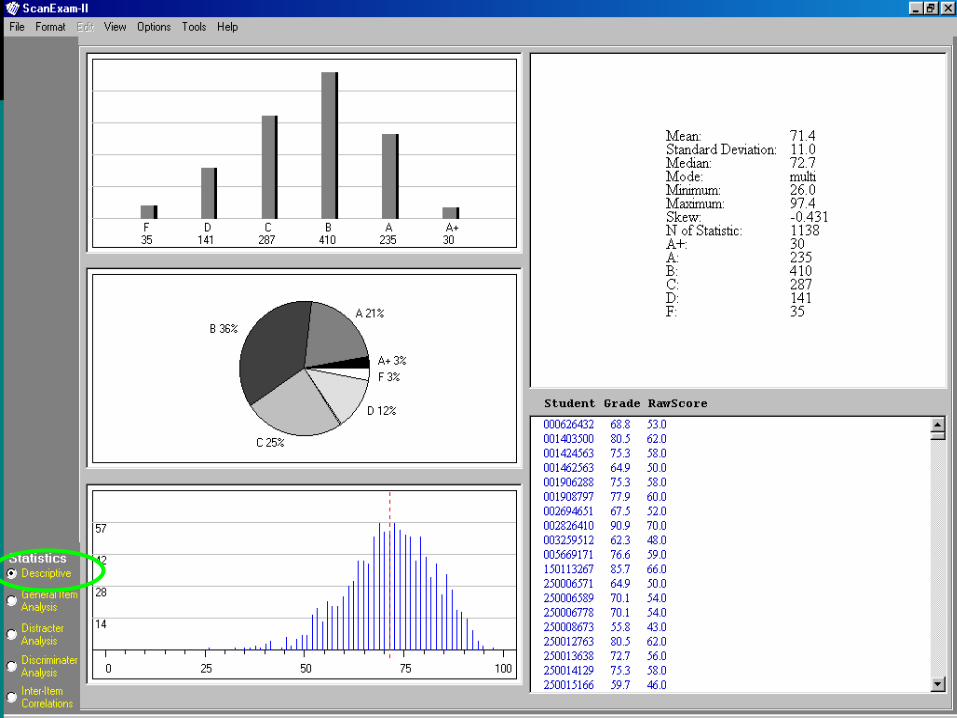
Distribution of Scores
Frequency chartby letter grade
Pie chart
Raw frequencies
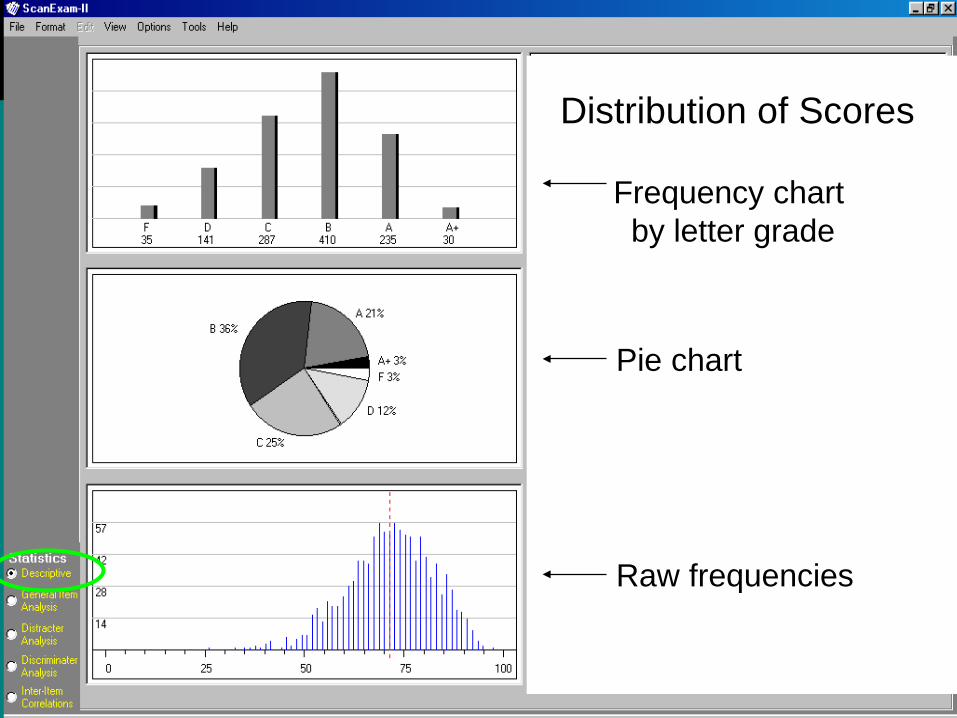
Summary Statisticsfor the exam
Student grades
General Item Analysis
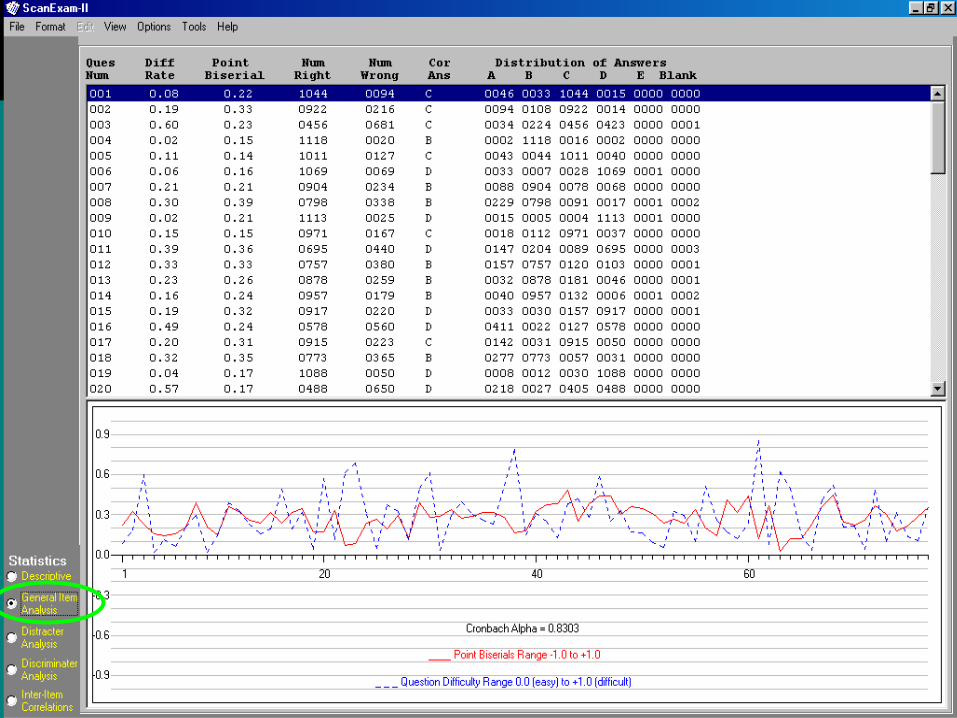
Number of people whochoose each alternative
Total number right & wrong
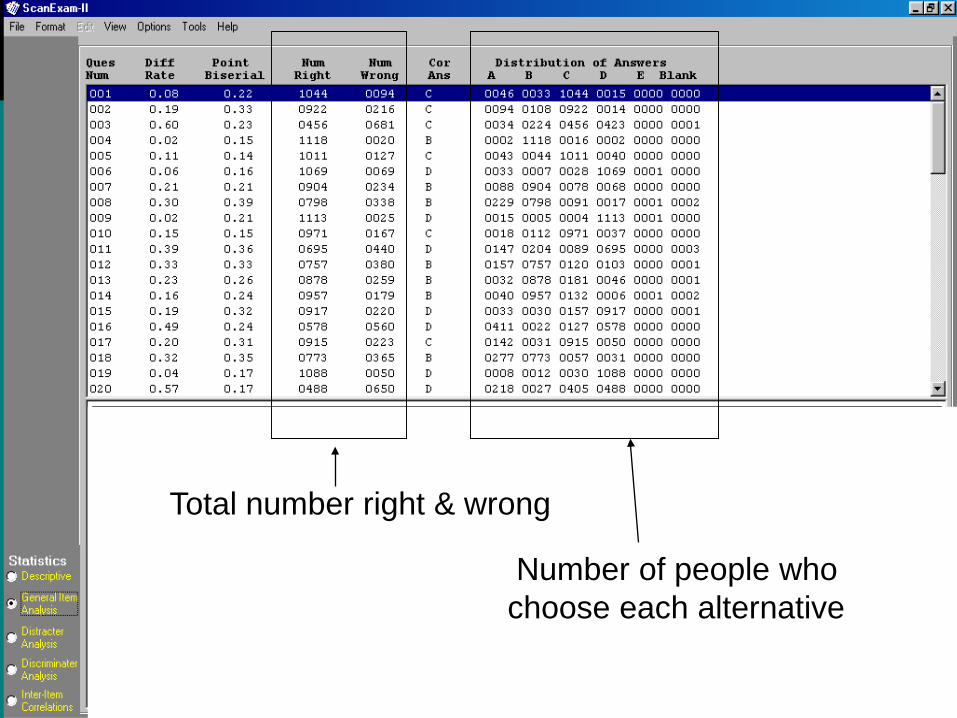
Item-total correlation: did the students who did well overall get this item correct?…as the index approaches +1.0, the beststudents got it right. As it approaches –1.0,the poorest students got the item correct.
% wrong answers
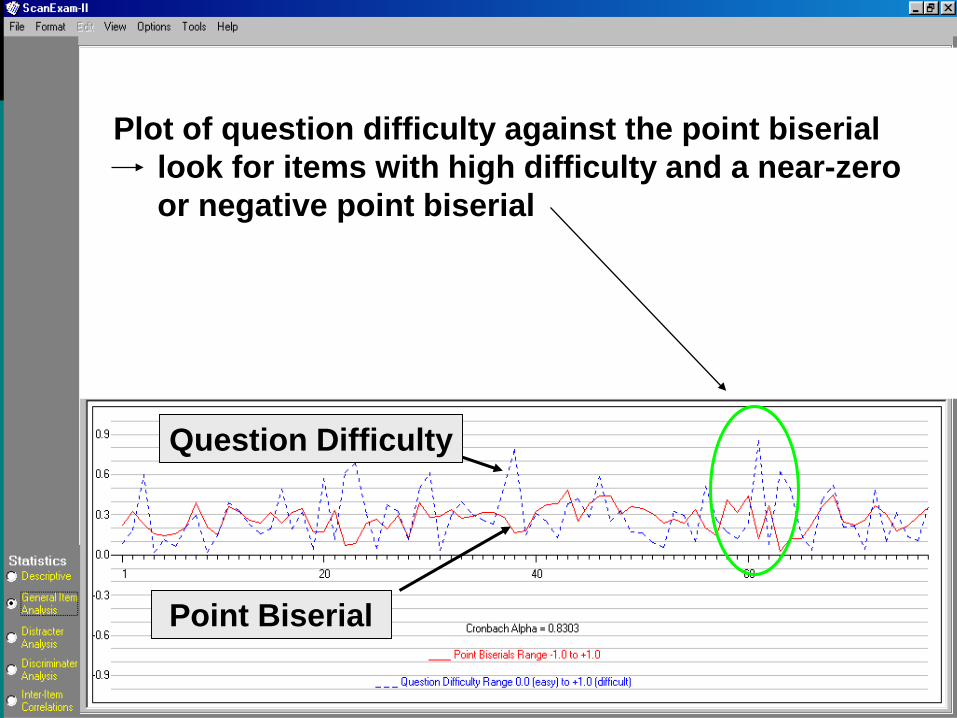
Question Difficulty
Point Biserial
Plot of question difficulty against the point biseriallook for items with high difficulty and a near-zeroor negative point biserial
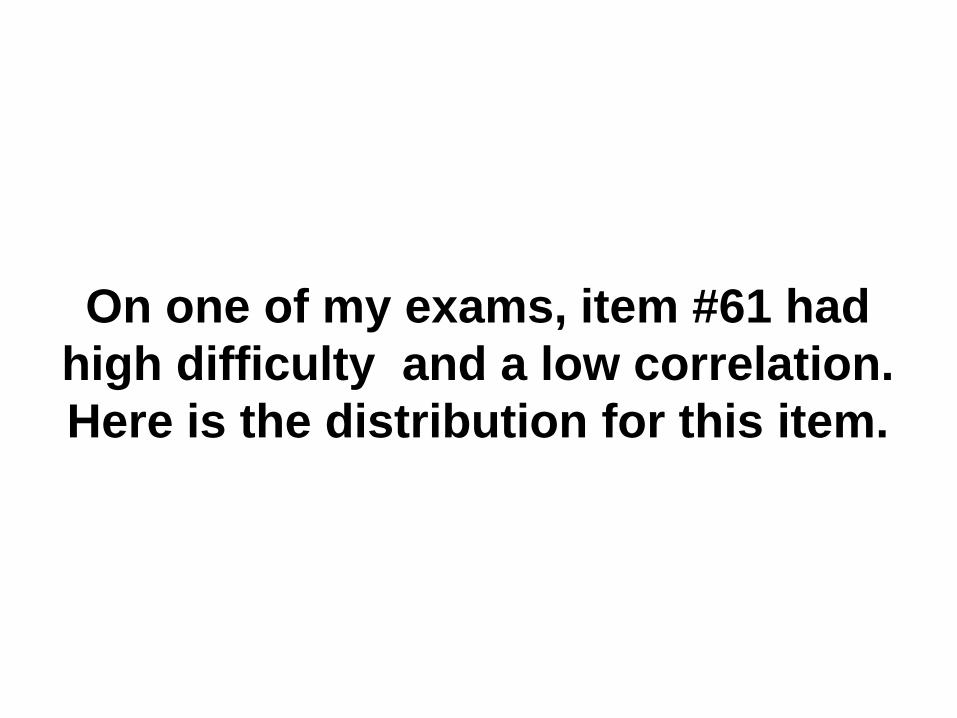
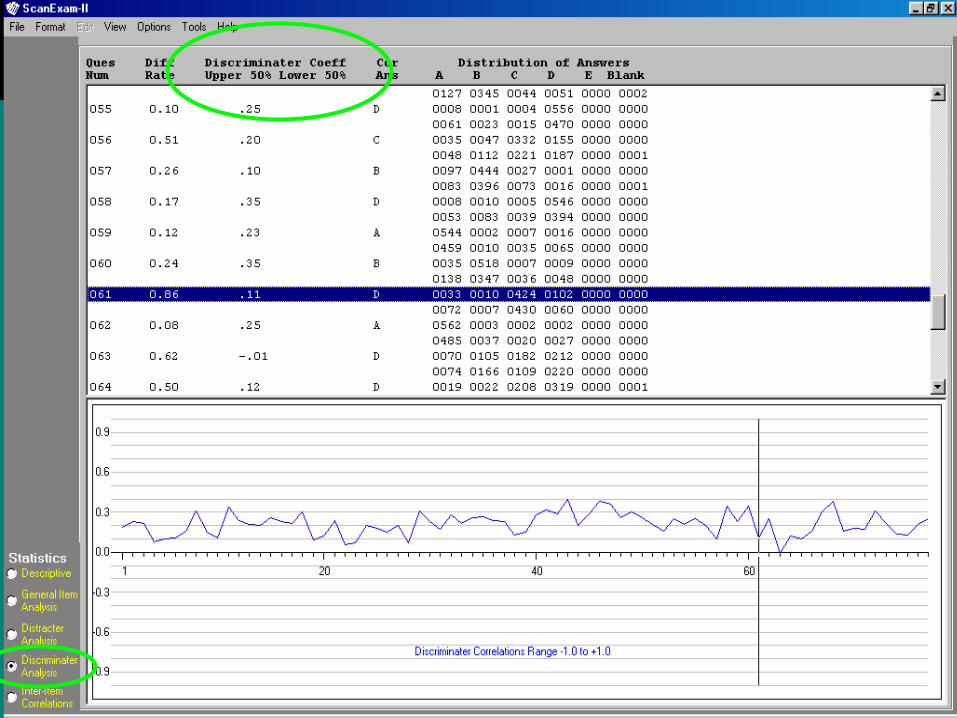
On one of my exams, item #61 hadhigh difficulty and a low correlation.Here is the distribution for this item.
A B C D.86 .12 162 976 D 105 17 854 162
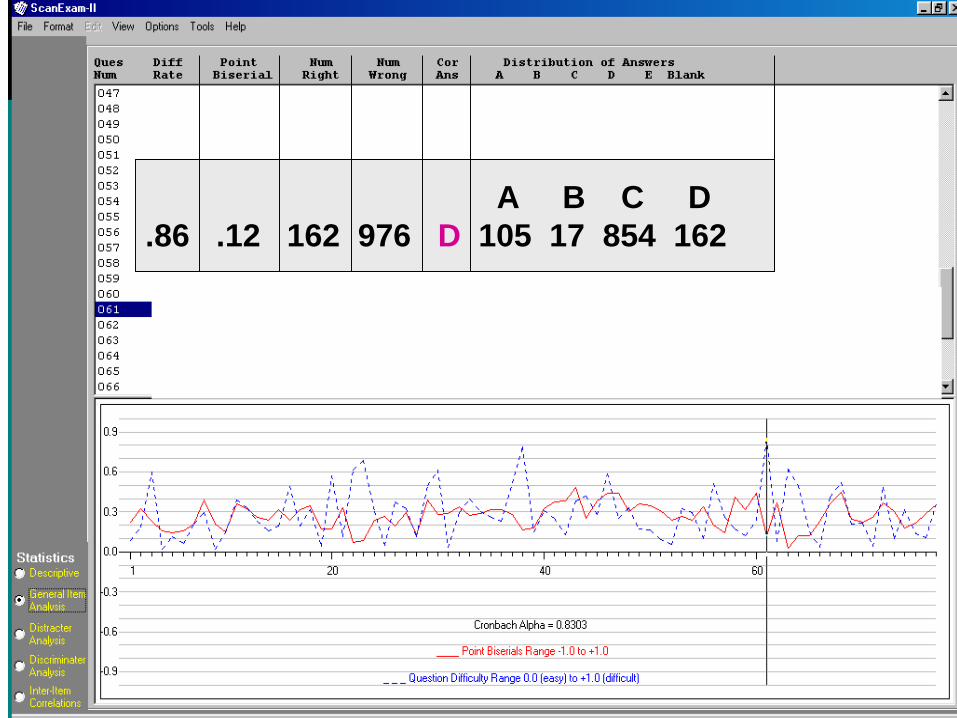
The actual item from the exam isshown in the next slide.
Correct answer is D
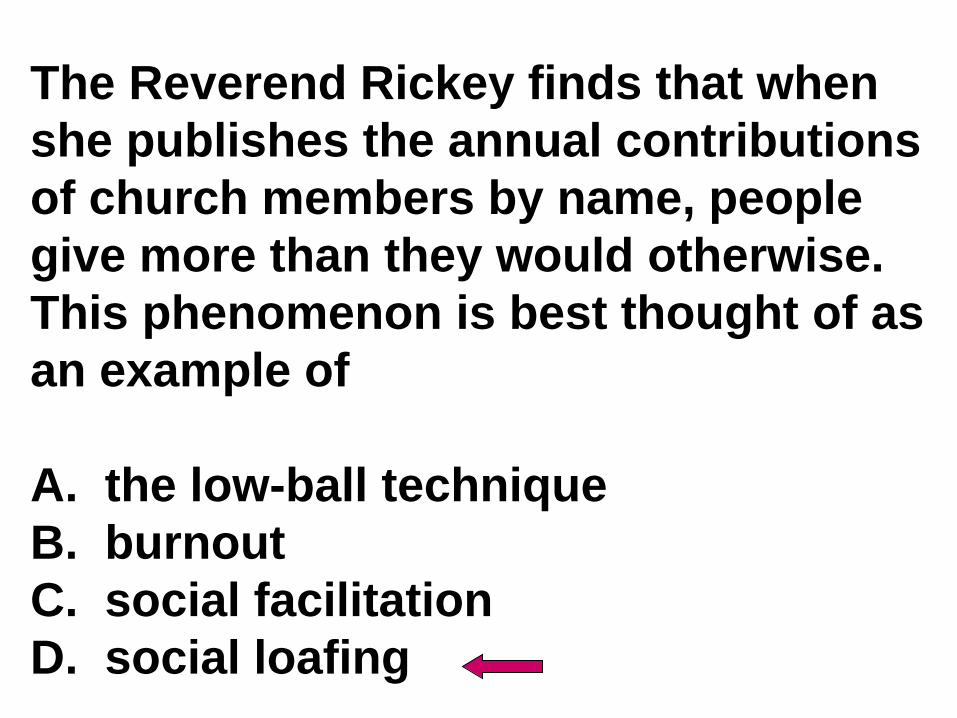
The Reverend Rickey finds that whenshe publishes the annual contributionsof church members by name, people give more than they would otherwise. This phenomenon is best thought of asan example of
A. the low-ball techniqueB. burnoutC. social facilitationD. social loafing
We can examine this item furtherby looking at the Discriminator
Analysis. On the following slide, wecompare the performance of the
top 50% of the class to the bottom 50% on this item only. We
then look at the top 30% andfinally at the top 10%
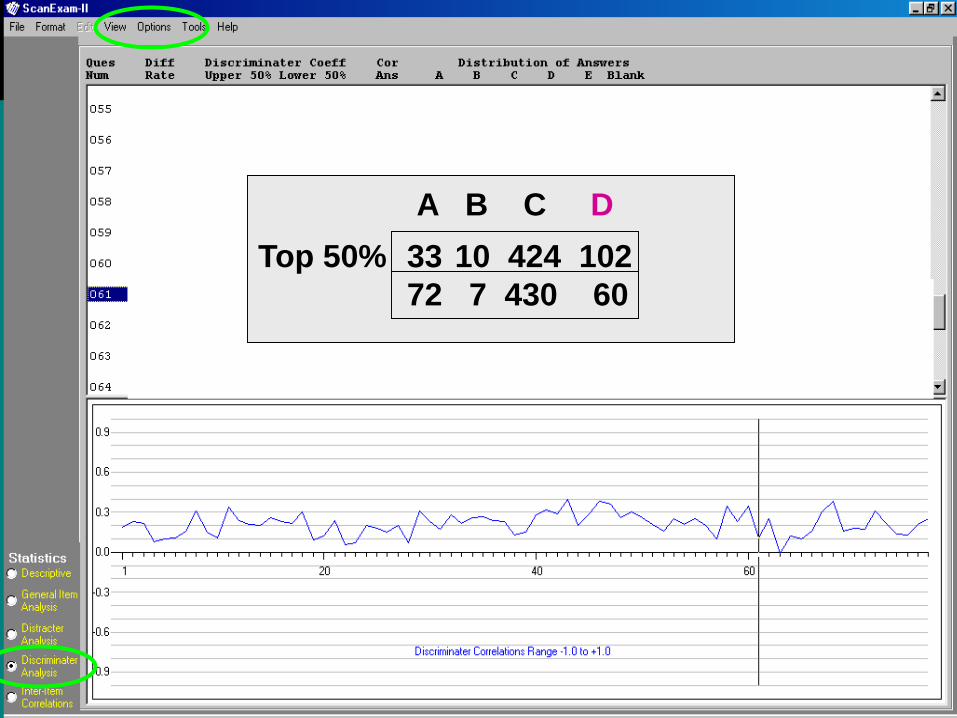
33 10 424 10272 7 430 60
A B C DTop 50%
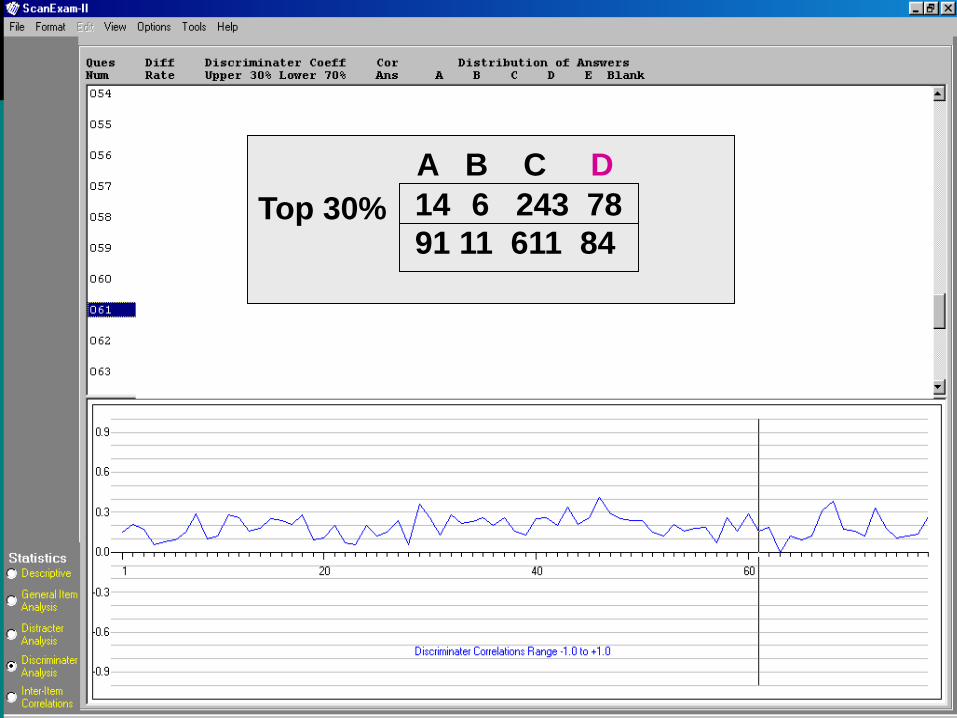
A B C DTop 30% 14 6 243 78
91 11 611 84
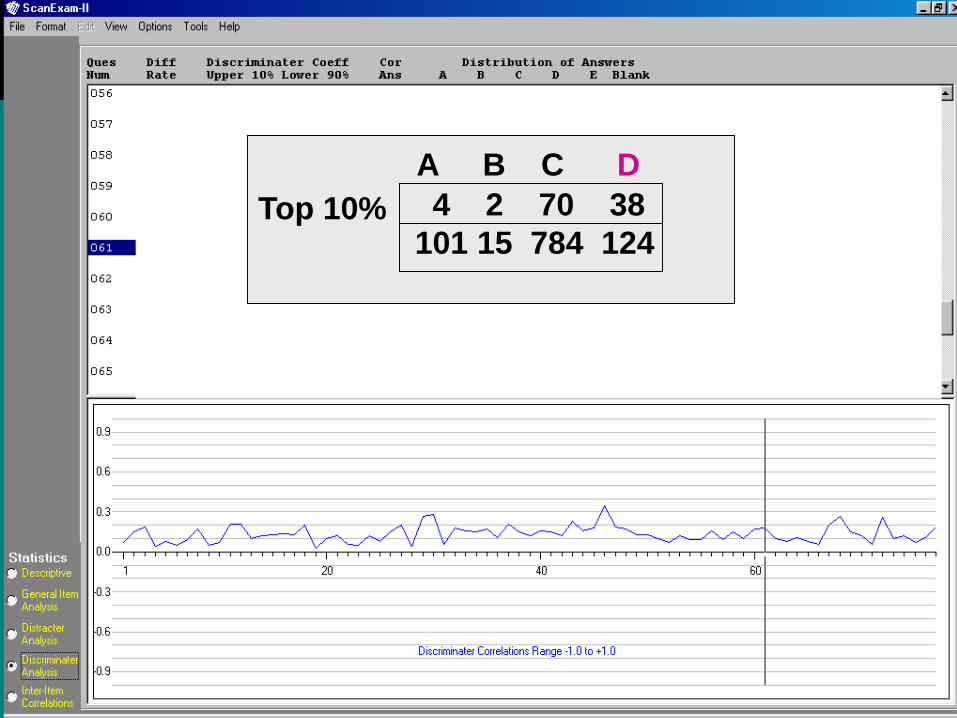
A B C DTop 10% 4 2 70 38
101 15 784 124
In each case, more people choose alternative “C” than the correct
answer, “D”. Even for the top 10%,twice as many choose “C”. Mostlikely, there is a problem with thisitem. You should delete the item,
or re-score.
In this second example, wesee that almost everyone in the
top 30% of the class gets the itemcorrect. Note that the point-biserial
correlation is positive and not near zero.
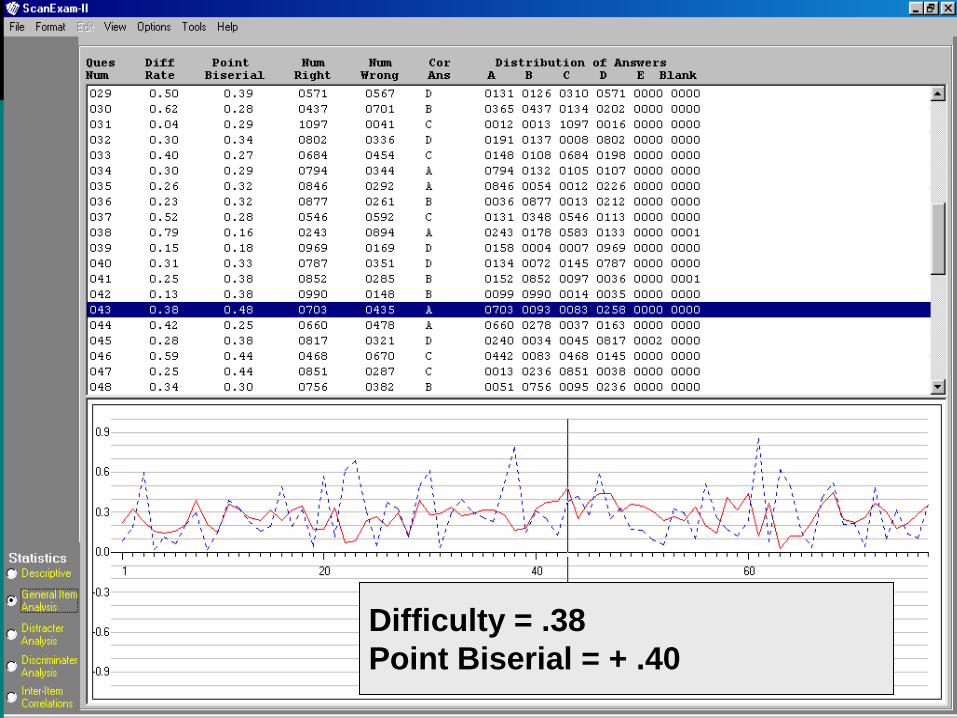
Difficulty = .38Point Biserial = + .40
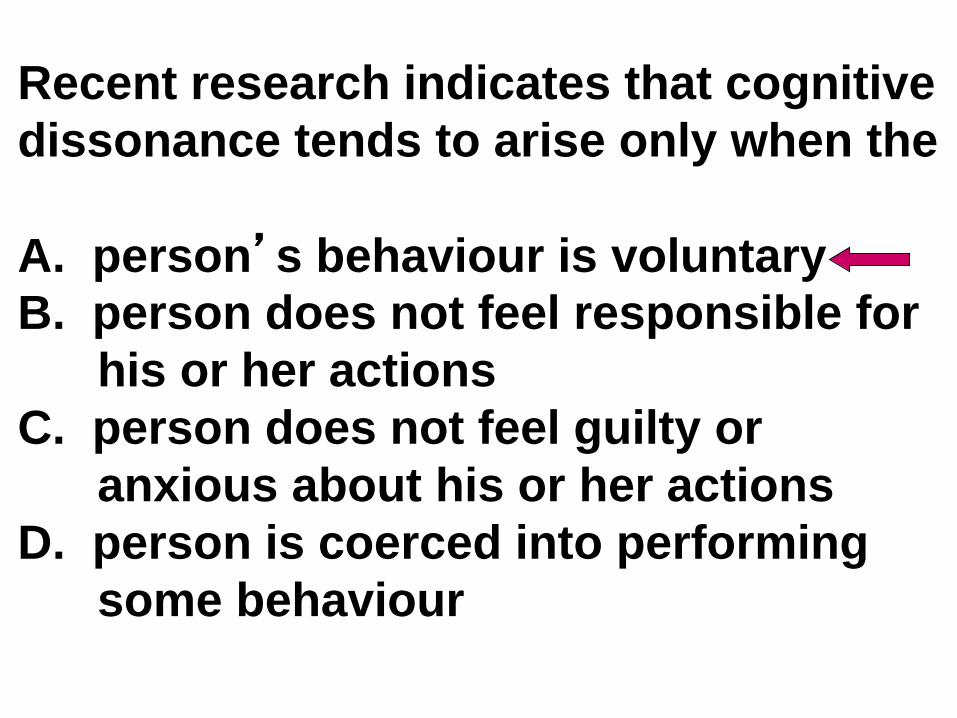
Recent research indicates that cognitivedissonance tends to arise only when the
A. person’s behaviour is voluntaryB. person does not feel responsible for
his or her actionsC. person does not feel guilty or
anxious about his or her actionsD. person is coerced into performing
some behaviour
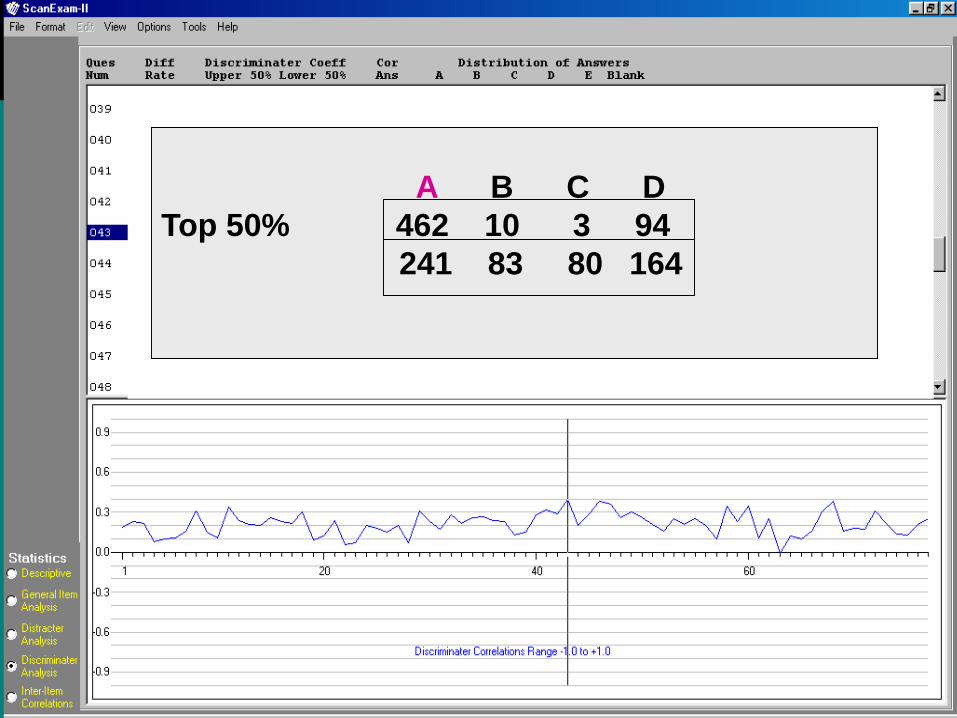
A B C DTop 50% 462 10 3 94
241 83 80 164
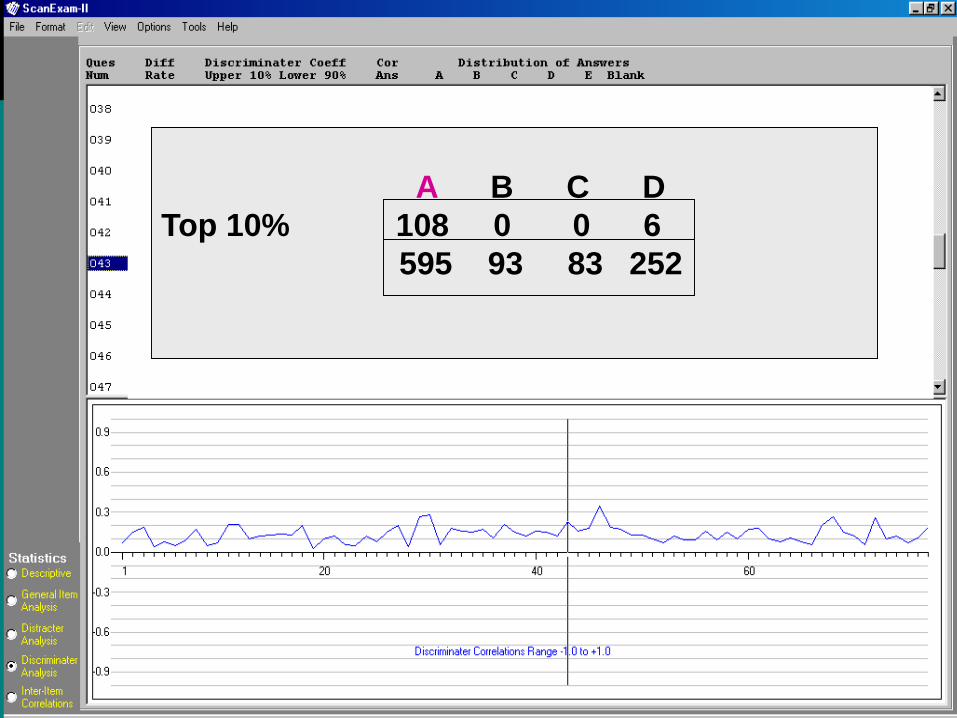
A B C DTop 10% 108 0 0 6
595 93 83 252
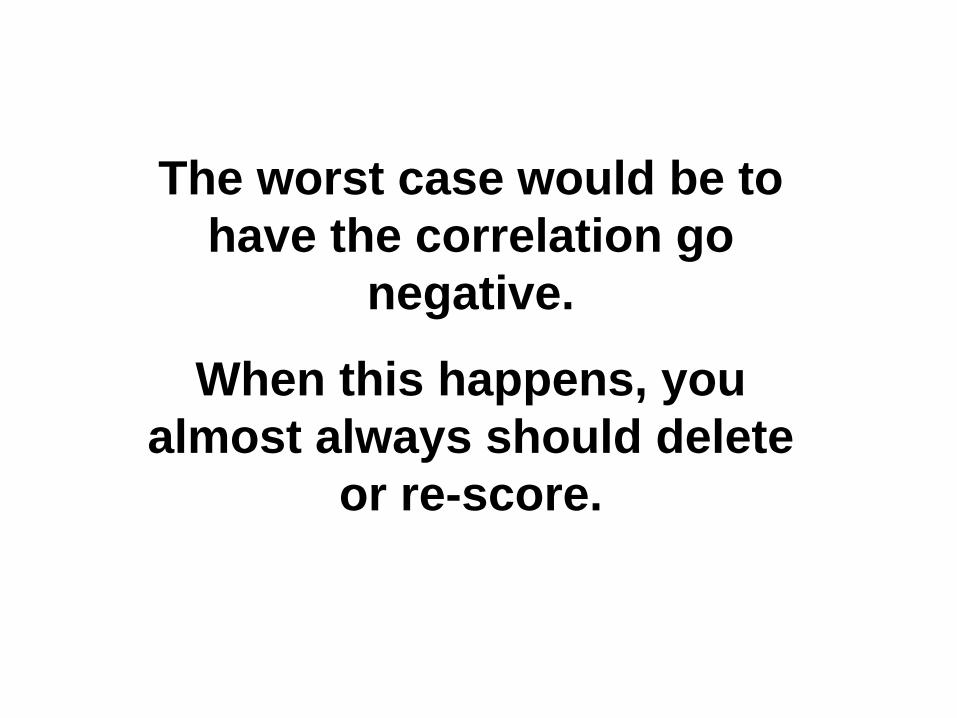
The worst case would be to have the correlation go
negative.
When this happens, you almost always should delete
or re-score.
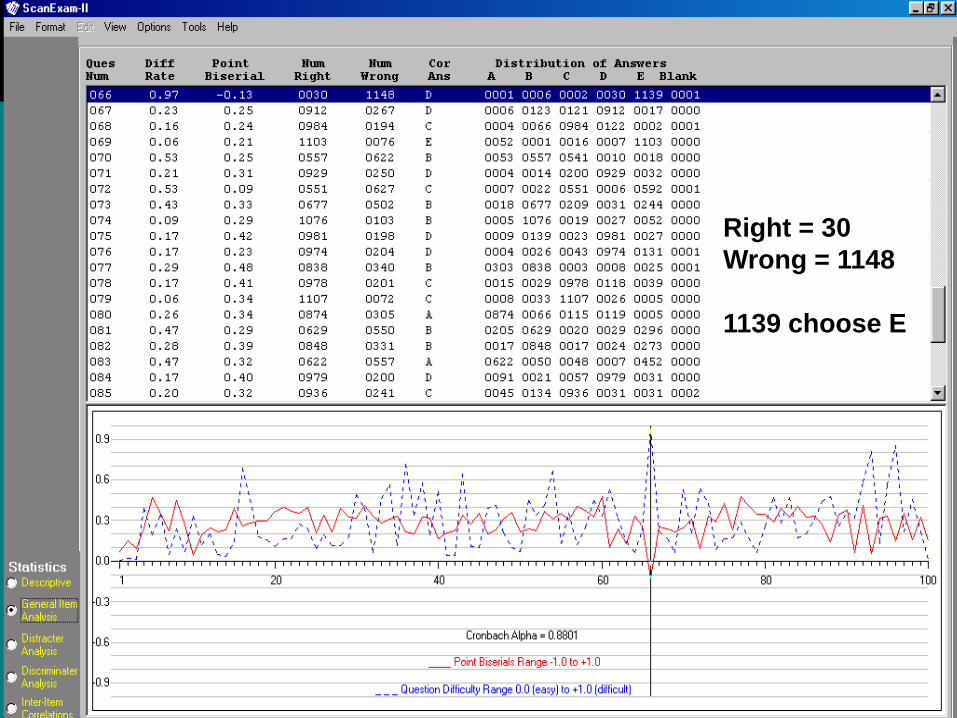
Right = 30Wrong = 1148
1139 choose E
Finally, it is useful to look at the Distractor Analysis. For any item,
this will show you the average grade on the exam for those students who choose each
alternative. This can help you to decide if you should re-score an
item.
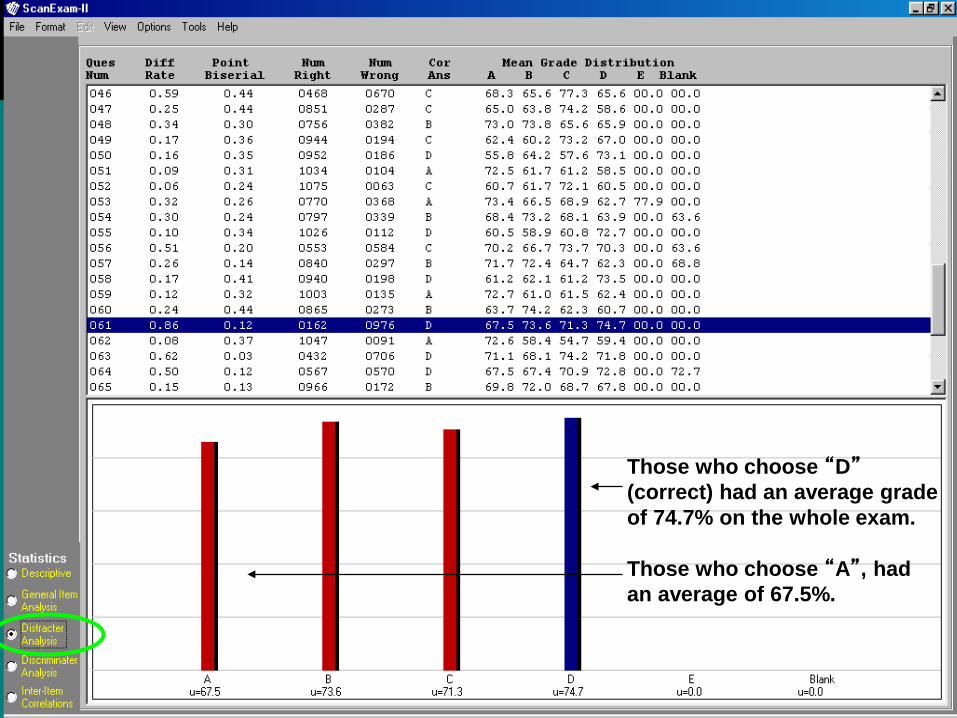
Those who choose “D”(correct) had an average grade of 74.7% on the whole exam.
Those who choose “A”, had an average of 67.5%.
Issues
1. Delete or re-score?2. Tolerance levels3. Item construction4. Grade inflation?
The Good, the Bad, & the Ugly
Interpreting the Results from Your Multiple Choice Test
Mike Atkinsonx 84644 (Psych)