Embed Size (px)
Citation preview

1
The Good Childhood Report 2016 The current state of children’s subjective well-being: overview, variations and trends over time
The Good Childhood Report 2016

2

It’s reassuring that the majority of children in this country are satisfied with how their lives are going, but we cannot turn our backs on the 10% of children who feel their lives have little meaning and purpose. This year’s report uncovers emerging trends that give great cause for concern, and we must come together to act on these and make changes so that every child in this country has a good quality of life.
In this year’s report, our fifth annual Good Childhood Report, we have analysed data on time trends to look in detail at how children’s well-being is changing over time. A growing gap between girls’ and boys’ happiness gives a clear signal that concerted action is needed to prevent things from getting worse.
At a time when children’s mental health is of increasing concern, this report highlights the links between well-being and mental health issues. As they get older, girls feel increasingly unhappy with their appearance and experience anxiety and depression
significantly more than boys. Our findings also continue to show the prevalence of bullying, with around half of all children having experienced bullying in the past month.
We are very proud of our groundbreaking research into children’s well-being, developed with the University of York. Our surveys of over 60,000 children have lifted the lid on important issues affecting children’s well-being, shaping the ways in which we can help children and young people to flourish. We will continue to support vulnerable children when they have nowhere left to turn, working hand-in-hand with children to make sure their voices are heard.
As a leading expert on children’s well-being, The Children’s Society knows how critical it is to speak to children and listen to what they have to say about their lives. For over a century, we have been showing children we are on their side and listening to what they tell us – and what we learn from this invaluable insight helps us to change the lives of vulnerable children and young people for the better. Understanding how children feel about their lives is a crucial part of the overall picture of the quality of life for children in this country. Children’s well-being is crucial, not just for their own lives, but for society as a whole.
Matthew Reed Chief Executive The Children’s Society
3
Foreword

4
The Good Childhood Report 2016 The current state of children’s subjective well-being: overview, variations and trends over time

Chapter 1 The current state of children’s subjective well-being: overview, variations and trends over time
Chapter 2
The relationship between subjective well-being and mental ill-health
Chapter 3
Children’s views of their local area
Chapter 4
A review of the factors associated with child subjective well-being
Chapter 5
Discussion
References
This report is the product of an ongoing collaboration between The Children’s Society and the University of York. The report summarises work conducted by the joint research team of Larissa Pople, The Children’s Society and Gwyther Rees, University of York.
7
23
37
51
61
66
5
Contents

6
The Good Childhood Report 2016 The current state of children’s subjective well-being: overview, variations and trends over time

7
The Good Childhood Report 2016 The current state of children’s subjective well-being: overview, variations and trends over time
The current state of children’s
subjective well-being: overview,
variations and trends
over time
Chapter 1
7

8
The Good Childhood Report 2016 The current state of children’s subjective well-being: overview, variations and trends over time
This is the fifth in a series of annual Good Childhood Reports that The Children’s Society has produced in partnership with the University of York as part of a groundbreaking research programme into children’s well-being. This series refreshes our understanding of how life is for our youngest citizens, from the viewpoint of children themselves. It provides the latest national statistics, trends and insights into the quality of children’s lives overall, and the aspects of life that matter the most to them.
This 2016 edition of the Good Childhood Report:
▪ Summarises the concepts that are central to our well-being research programme, and how these can be used to build up a picture of ‘flourishing’ for children and young people
▪ Reviews the latest trends in well-being over time, and the gender patterns that have emerged in recent years for some aspects of well-being
▪ Examines the links between specific domains of children’s well-being and different types of mental health issues
▪ Presents new analysis of local area differences in children’s well-being and the characteristics of local areas that appear to be linked to higher or lower levels of well-being.
What do we mean by well-being?
Well-being can mean different things to different people, but this need not undermine the value of the term. Other fundamental concepts in social research – health, poverty,
education – also mean different things to different people, but few would argue that these terms are ill-conceived. In our view, well-being may be best thought of as an umbrella term that encompasses different concepts and approaches – the ‘best’ being dependent on the circumstances in which it is used.
In some contexts – for example in the ONS’s Measuring National Well-being Programme (see Beardsmore and Siegler, 2014) and UNICEF’s report card series (see UNICEF 2007 and 2013) – well-being refers to ‘baskets’ of indicators that together build up a picture of the quality of people’s lives by combining measures of different domains. This approach tends to include both ‘objective’ indicators – eg measures of health, education and poverty – and ‘subjective’ ones – people’s own assessments of how their lives are going (see the box on this page for more detail). For children, this type of approach draws heavily on large-scale surveys of children such as Understanding Society, the Health-Behaviour of School Children, and the World Health Organisation’s PISA study.
Objective and subjective well-being
There are two common approaches to measuring children’s well-being:
One is to draw on objective social and economic indicators that are felt to contribute to children’s well-being, such as levels of poverty, health and educational attainment. Examples of these include the percentage of children who live in poverty, are born with low birth weight or are in post-compulsory education. A smaller number draw on self-reported data from children themselves to determine levels of health behaviours such as smoking, drinking and drug use.
The second subjective approach relates to children’s own evaluations of their lives as a whole, and different aspects of their lives.
There is value and merit in measuring both objective and subjective aspects of well-being, but it is on the latter – children’s own assessments of how their lives are going – that The Children’s Society has focused its research.
Chapter 1

9
The Good Childhood Report 2016 The current state of children’s subjective well-being: overview, variations and trends over time
1 See http://www2.warwick.ac.uk/fac/med/research/platform/wemwbs/2 In Wave 5 of the MCS using weighted data, the Pearson correlations with the bullying variable ‘How often do other
children hurt you or pick on you on purpose?’ were 0.374 for sadness, 0.223 for happiness and 0.226 for life satisfaction. The sadness correlation was significantly larger than the other two using a paired R test.
In other contexts, particularly in public health, well-being is often understood more narrowly as a contrasting concept to mental ill-health, with a focus on the experience of positive feelings and psychological well-being over a short timeframe. This approach – which is sometimes described as ‘emotional’ or ‘mental’ well-being – is taken by the Warwick-Edinburgh Mental Well-being Scale1 for children.
Our approach falls somewhere between these two. Our conceptualisation of well-being is narrower than the first approach as we focus on children’s subjective rather than objective well-being, but broader than that of the Warwick-Edinburgh Scale, for example, as we are interested in cognitive as well as emotional assessments of well-being, and ‘global’ evaluations of life as a whole as well as different ‘domains’ of well-being (see next section for more detail on these terms).
What do we mean by subjective well-being?
Subjective or ‘hedonic’ well-being is understood as having two components that are related but distinct: an affective component, which relates to the experience of positive and negative emotions at a particular point in time, and a cognitive element, which involves an evaluation of the quality of one’s life overall, or a particular aspect of life (eg relationships with family).
Children’s subjective well-being
Subjective well-being is about children’s own assessments of how their lives are going.
Subjective well-being consists of two key elements:
▪ Life satisfaction – which relates to the evaluations that children make about their lives at a cognitive level, and comprises judgements about life as a whole as well as judgements about different aspects of life (eg happiness with family relationships).
▪ The experience of positive and negative emotions at a particular point in time.
A related concept is psychological well-being, which is concerned with children’s sense of meaning, purpose and engagement.
We know from our own analysis that children’s experience of positive and negative emotions can vary from day to day – eg children are more likely to be happy at the weekend ¬– but their cognitive evaluations, also known as life satisfaction, are more enduring (The Children’s Society, 2013a). An added insight that we have gained recently through analysis of the Millennium Cohort Study (MCS) is that these three concepts – positive affect, negative affect and life satisfaction – have different relationships to other
outcomes, highlighting the value of measuring all three separately. For example, we found that the extent of recent experiences of being bullied is more strongly associated with a child’s feelings of sadness than with their feelings of happiness or their life satisfaction.
A different concept is psychological or ‘eudaimonic’ well-being. In our first major report on well-being in 2010, we highlighted two models of psychological well-being. The first, devised by Ryff (1989), comprises six components: self-acceptance, positive relations with others, autonomy, environmental mastery, purpose in life and personal growth. The second, proposed by Deci and Ryan (2000), consists of three key concepts: competence, autonomy and relatedness. In our research with children, we have found value in all of these concepts, most notably that relationships with others and a sense of autonomy are at the heart of children’s well-being. In 2013, we tested a set of questions about psychological well-being used by the ONS with adults, but these did not work particularly well as a scale (The Children’s Society, 2013a). More recently we tested a set of questions relating to Ryff’s six-dimensional model, and these have worked well (see section on flourishing on page 18).

10
The Good Childhood Report 2016 The current state of children’s subjective well-being: overview, variations and trends over time
20052007
20082009
2010
We run a national consultation of over 8,000 young people aged 14 and 15. They told us what they felt were the most important ingredients for them to have a good life and what things prevented this.
The pilot of our first well-being survey using young people’s responses to our 2005 survey, as well as a review of existing international work on children’s well-being takes place.
Our first well-being survey is carried out with a representative sample of over 7,000 children aged 10 to 15 in mainstream schools in England.
We run further consultations with younger children aged eight and nine years old and we also test additional questions on topics not covered in 2008.
The second well-being survey begins. This includes a representative sample of just under 6,000 children aged eight to 15 in mainstream schools in England. We also begin our quarterly Good Childhood Index surveys which sample 2,000 children aged 8 to 15.
Figure 1: Components of self-reported well-being
Reproduced from The Good Childhood Report 2013
Well-being
‘Hedonic’Subjective well-being
Life satisfactionPositive affect
Negative affect
‘Domain’ satisfactions
Affective Cognitive
‘Eudaimonic’Psychological
well-being
For example ▪ Self-acceptance ▪ Environmental mastery ▪ Positive relationships ▪ Autonomy ▪ Purpose in life ▪ Personal growth

11
The Good Childhood Report 2016 The current state of children’s subjective well-being: overview, variations and trends over time
Why and how have we focused on children’s subjective well-being?
Our approach to children’s well-being emerged for reasons of principle and practicality.
When we set up our research programme, we felt that children should be involved in the process of determining which aspects of life should be included in assessments of their well-being, and be the main protagonists in those assessments. This principle applies to adults as well, but children’s position in society is different to that of adults because they are not otherwise involved in the democratic process. That we should give children’s views due consideration in matters affecting them is also a sentiment at the heart of the UN Convention of the Rights of the Child, of which the UK is a signatory.
However, from a practical perspective we were also aware that data on children’s well-being that is rooted in their own accounts was lacking, so there
was a practical dimension to our programme in terms of filling this gap in the research.
For this reason, our well-being research programme got underway in 2005 with a national survey of 8,000 14 and 15 year olds which asked open-ended questions about what constitutes a good life for children. This was the first of many qualitative research projects we have undertaken over the last 11 years in which we have asked children to tell us – in their own words – what is most important in their lives. Since then, we have expanded our qualitative research to include a wider age range of children and specific groups of children whose views are often overlooked.
The most prominent theme running through children’s articulations of what signifies a good life was the fundamental importance of their relationships, with the three most common words being friends, family and bullying (The Children’s Society, 2006). Additionally, we discovered that a useful way to
think about the themes raised by children was a framework of three related components – self, relationships and environments.
This analysis of children’s responses to open-ended questions was the crucial first step in our well-being research programme, and has provided the framework for our subsequent survey research focused on well-being.
In 2008, after substantial piloting, testing and refinement of ideas (see The Children’s Society, 2015 for a full description), we carried out our first schools-based survey of a representative sample of 7,000 children aged 10 to 15. Since then, we have carried out three further national schools surveys in 2010/11, 2012 and 2013/14 involving, in total, over 11,000 different children aged 8 to 15 (see the timeline on pages 10 and 11 for more details).
These surveys, combined with pilot and other surveys that have included questions on well-being, mean that well over 60,000
2011
The second well-being survey ends. We carry out supplementary surveys of children and pupil referral units, to represent the views of children who are not covered in mainstream schools surveys.
2012
Participation in piloting of international Children’s Worlds survey, including, in England, qualitative work with children and a survey of over 1,100 children aged 12 to 13 takes place.
2013–14
The third schools-based well-being survey is undertaken with over 4,000 children in Years 4, 6, 8 and 10. This includes participation in the Children’s Worlds survey for the three younger age groups.
2016
The latest (and 15th) wave of our online Good Childhood Index survey is undertaken. These surveys have now included over 30,000 children and young people aged 8 to 17.

12
The Good Childhood Report 2016 The current state of children’s subjective well-being: overview, variations and trends over time
children have taken part in national surveys that ask about their well-being.
In 2010, we developed The Good Childhood Index – a measure of children’s well-being that comprises indicators of overall well-being and happiness with 10 aspects of children’s lives – and set up a regular household survey to monitor children’s well-being over time using this index. We have now completed 15 waves of this survey, involving 30,000 children aged 8 to 17.
Measuring children’s well-being
Our Good Childhood Index includes a five-item measure of overall life satisfaction , a single-item measure of happiness with life as a whole, and single-item measures of 10 aspects of children’s lives or ‘domains’. These 10 domains – family, friends, health, appearance, time use, the future, home, money/possessions, school and choice – emerged from statistical analysis of our 2008 survey, and the important finding that happiness with these aspects of life explained over half of the variation in children’s overall well-being. Figure 2 shows the latest figures for The Good Childhood Index – both the average scores and the proportion scoring below the midpoint, who we have described as having ‘low well-being’.
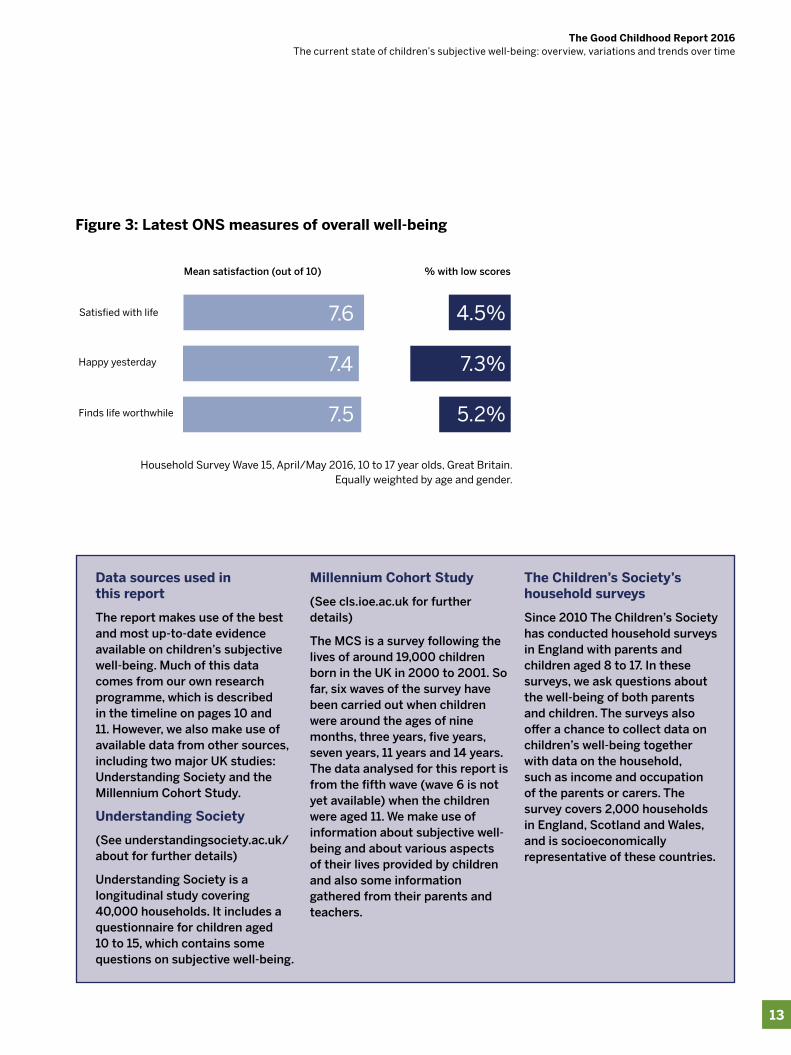
We also regularly ask children about three of the measures of overall well-being that were developed by the ONS as part of their Measuring National Well-being programme (and are the ONS data source for these for 10 to 15 year olds).
3 Based on Huebner’s Modified Students Life Satisfaction Scale. These questions have been validated for use in school settings for children aged from 7 or 8 – see Seligson J, Huebner ES, Valois RF. (2003). Preliminary validation of the Brief Multidimensional Students’ Life Satisfaction Scale. Social Indicators Research; 61: 121-145. The Children’s Society found the scale to be a reliable and stable measure of overall life satisfaction, and that the scale could be reduced from seven to five items without any substantial loss of reliability.
Mean satisfaction (out of 10) % with low scores
8.3Family
8.2
8.1
Health
Home
2.6%
3.5%
3.9%
7.9Friends
7.5
7.4
Time use
Money and things
6.8Future
7.1
7.1
7.2
Choice
Appearance
School
4.7%
4.5%
6.8%
7.1%
7.8%
9.5%
11.1%
Figure 2: Latest figures for The Good Childhood Index
Household Survey Wave 15, April/May 2016, 10 to 17 year olds, Great Britain.Equally weighted by age and gender.
13
The Good Childhood Report 2016 The current state of children’s subjective well-being: overview, variations and trends over time
Data sources used in this report
The report makes use of the best and most up-to-date evidence available on children’s subjective well-being. Much of this data comes from our own research programme, which is described in the timeline on pages 10 and 11. However, we also make use of available data from other sources, including two major UK studies: Understanding Society and the Millennium Cohort Study.
Understanding Society
(See understandingsociety.ac.uk/about for further details)
Understanding Society is a longitudinal study covering 40,000 households. It includes a questionnaire for children aged 10 to 15, which contains some questions on subjective well-being.
Millennium Cohort Study
(See cls.ioe.ac.uk for further details)
The MCS is a survey following the lives of around 19,000 children born in the UK in 2000 to 2001. So far, six waves of the survey have been carried out when children were around the ages of nine months, three years, five years, seven years, 11 years and 14 years. The data analysed for this report is from the fifth wave (wave 6 is not yet available) when the children were aged 11. We make use of information about subjective well-being and about various aspects of their lives provided by children and also some information gathered from their parents and teachers.
The Children’s Society’s household surveys
Since 2010 The Children’s Society has conducted household surveys in England with parents and children aged 8 to 17. In these surveys, we ask questions about the well-being of both parents and children. The surveys also offer a chance to collect data on children’s well-being together with data on the household, such as income and occupation of the parents or carers. The survey covers 2,000 households in England, Scotland and Wales, and is socioeconomically representative of these countries.
Figure 3: Latest ONS measures of overall well-being
Mean satisfaction (out of 10) % with low scores
7.4
Satisfied with life 7.6
7.5
Happy yesterday
Finds life worthwhile
4.5%
7.3%
5.2%
Household Survey Wave 15, April/May 2016, 10 to 17 year olds, Great Britain.Equally weighted by age and gender.

14
The Good Childhood Report 2016 The current state of children’s subjective well-being: overview, variations and trends over time
Time trends
For every Good Childhood Report we have published since the series began in 2012, we have drawn on available data from the British Household Panel Survey (BHPS) and its successor the Understanding Society survey to present trends in children’s well-being over time. Our analysis of long-term trends from the BHPS – which collected subjective well-being data from 11 to 15 year olds between 1994 and 2008 – showed a significant increase in children’s satisfaction with relationships with friends over this period, and a smaller increase in satisfaction with life as a whole between 2002 and 2008, as can be seen in Figure 4. However, these trends appeared to stall from 2009 onwards, as can be seen in the Understanding Society trends shown in Figure 6 on page 16.
Statistical testing
We have used a range of appropriate statistical tests to support the findings presented in this report. All comparisons highlighted in the report (eg gender differences) are based on accepted tests of statistical significance using a 99%
confidence level unless otherwise stated. Weighted data sets have been used for analysis of the Understanding Society survey and Millennium Cohort Study. Because this is a non-technical report we have avoided using technical language regarding these tests in the main text,
although some basic explanatory information is sometimes provided in footnotes and appendix. Further details on the technical aspects of the research are available from The Children’s Society’s Research Team (see contact details at the end of the report).
1996 1997 1998 1999 2000 2001 2002 2003 2004 2005 2006 2007 2008
Mea
n ha
pp
ines
s (0
to 1
0)
9.2
9.1
9.0
8.9
8.8
8.7
8.6
8.5
8.4
8.3
8.2
8.1
8.0
Friends
Life
Figure 4: Children’s satisfaction with life as a whole and relationships with friends, 1994 to 2008
British Household Panel Survey, 1994 to 2008, weighted data, three-year smoothed moving average.

15
The Good Childhood Report 2016 The current state of children’s subjective well-being: overview, variations and trends over time
We also found a long-term trend of divergence in satisfaction with appearance for boys and girls from 2002 onwards, with girls becoming increasingly unhappy with their appearance.
In The Good Childhood Report 2015, we focused entirely on four waves of data from the Understanding Society survey, highlighting an apparent decline in satisfaction with friendships between 2009 and 2013, and a corresponding increase in satisfaction with schoolwork over the same period.
In the current report, we extend this analysis further with the latest wave of Understanding Society data and a more detailed examination of gender differences.
Figure 6 shows trends in each of the six subjective well-being variables that are contained in Understanding Society, across five waves of the survey. The dotted lines above and below the main line show 99% confidence intervals. We compared the Wave 1 and Wave 5 values using a non-parametric trend test. On this basis:
▪ there has been an increase in happiness with school work and also marginally with school
▪ there has been a decrease in happiness with friends and also marginally with appearance
▪ there has been no significant change in happiness with family or life as a whole.
Figure 7 shows the trends separately for girls and boys. In terms of trends over time for each gender:
For girls there was:
▪ a significant increase in happiness with school work
▪ no significant change in happiness with family or school
▪ a significant decrease in happiness with appearance, friends and marginally with life as a whole.
For boys there was:
▪ a significant increase in happiness with school work and school
▪ no significant change in happiness with family, appearance and life as a whole
▪ a small decrease in happiness with friends
▪ thus there have been different trends for girls and boys over this five-year period.
Comparing girls and boys at each wave:
▪ School work: Girls were significantly happier than boys in all waves
▪ Appearance: Boys were significantly happier than girls in all waves
▪ Family: There were no significant gender differences in any wave
Figure 5: Gender differences in satisfaction with appearance, 2000 to 2008
2000 2001 2002 2003 2004 2005 2006 2007 2008
Gap = 0.3
Gap = 0.5
Mea
n ha
pp
ines
s (0
to 1
0)
7.7
7.6
7.5
7.4
7.3
7.2
7.1
7.0
6.9
6.8
6.7
Male Female
British Household Panel Survey, 1994 to 2008, weighted data, three-year smoothed moving average.

16
The Good Childhood Report 2016 The current state of children’s subjective well-being: overview, variations and trends over time
4 Statistical note: The analysis uses weightings provided in the Understanding Society dataset to ensure that the samples are as representative of the general population as possible. After applying weightings, a check was undertaken for any differences in age or gender profiles over the five waves that might affect the comparisons being made. There were no significant differences in either respect. Presentational note: All graphs use the same sized range of values (1.2) so that they can be visually compared. This is the minimum necessary range for the gender differences in appearance.
8.18 8.18 8.18 8.178.08
8.88.78.68.58.48.38.28.1
8.07.97.87.77.6
9.59.49.39.29.1
9.08.98.88.78.68.58.48.3
9.79.69.59.49.39.29.1
9.08.98.88.78.68.5
7.77.67.57.47.37.27.1
7.06.96.86.76.66.5
8.48.38.28.1
8.07.97.87.77.67.57.47.37.2
7.97.87.77.67.57.47.37.27.1
7.06.96.86.7
Wave 1 2009-10
Wave 5 2013-14
Wave 5 2013-14
Wave 5 2013-14
Wave 5 2013-14
Wave 5 2013-14
Wave 5 2013-14
Wave 2 2010-11
Wave 3 2011-12
Wave 4 2012-13
Mea
n ha
pp
ines
s (0
to 1
0)
Life as a whole
8.98 8.97 9.02 8.95 8.95
Mea
n ha
pp
ines
s (0
to 1
0)
Mea
n ha
pp
ines
s (0
to 1
0)
7.237.15 7.10 7.15
7.08
Mea
n ha
pp
ines
s (0
to 1
0)
7.73 7.72 7.85 7.82
7.87
7.23
7.40 7.45
7.55 7.48
Mea
n ha
pp
ines
s (0
to 1
0)
Mea
n ha
pp
ines
s (0
to 1
0)
Family
Friends Appearance
School School work
Wave 1 2009-10
Wave 2 2010-11
Wave 3 2011-12
Wave 4 2012-13
Wave 1 2009-10
Wave 2 2010-11
Wave 3 2011-12
Wave 4 2012-13
Wave 1 2009-10
Wave 2 2010-11
Wave 3 2011-12
Wave 4 2012-13
Wave 1 2009-10
Wave 2 2010-11
Wave 3 2011-12
Wave 4 2012-13
Wave 1 2009-10
Wave 2 2010-11
Wave 3 2011-12
Wave 4 2012-13
8.93 8.95
8.78 8.80
9.00
Figure 6: Trends in children’s subjective well-being, UK, 2009 to 20144
Source: Understanding Society survey, children aged 10 to 15, weighted (but confidence intervals do not take account of design effect).

17
The Good Childhood Report 2016 The current state of children’s subjective well-being: overview, variations and trends over time
Figure 7: Trends in children’s subjective well-being by gender, UK, 2009 to 2014
8.188.258.258.28 8.24
8.16
7.93
8.118.09 8.08
8.88.78.68.58.48.38.28.1
8.07.97.87.77.6
Wave 1 2009-10
Wave 2 2010-11
Wave 3 2011-12
Wave 4 2012-13
Wave 5 2013-14
Wave 5 2013-14
Wave 5 2013-14
Wave 5 2013-14
Wave 5 2013-14
Wave 5 2013-14
Mea
n ha
pp
ines
s (0
to 1
0)
Life as a whole
8.96
8.969.03
8.96
8.92
9.01
8.949.01
8.94
8.96
9.79.69.59.49.39.29.1
9.08.98.88.78.68.5
Wave 1 2009-10
Wave 2 2010-11
Wave 3 2011-12
Wave 4 2012-13
Mea
n ha
pp
ines
s (0
to 1
0)
Family
BoysGirls
8.958.89
8.96
8.918.80
9.04
8.72
8.93
8.95
8.76
9.59.49.39.29.1
9.08.98.88.78.68.58.48.3
Wave 1 2009-10
Wave 2 2010-11
Wave 3 2011-12
Wave 4 2012-13
Mea
n ha
pp
ines
s (0
to 1
0)
Friends
BoysGirls
7.55 7.577.457.43
7.50
6.90
6.566.72
6.876.78
7.77.67.57.47.37.27.1
7.06.96.86.76.66.5
Wave 1 2009-10
Wave 2 2010-11
Wave 3 2011-12
Wave 4 2012-13
Mea
n ha
pp
ines
s (0
to 1
0)
Appearance
7.70
7.89
7.777.66
7.81
7.767.84
7.927.78 7.82
8.48.38.28.1
8.07.97.87.77.67.57.47.37.2
Wave 1 2009-10
Wave 2 2010-11
Wave 3 2011-12
Wave 4 2012-13
Mea
n ha
pp
ines
s (0
to 1
0)
School
BoysGirls
BoysGirls
BoysGirls
BoysGirls
7.03
7.377.23
7.15
7.437.44
7.597.687.64 7.69
7.97.87.77.67.57.47.37.27.1
7.06.96.86.7
Wave 1 2009-10
Wave 2 2010-11
Wave 3 2011-12
Wave 4 2012-13
Mea
n ha
pp
ines
s (0
to 1
0)
School work
18
The Good Childhood Report 2016 The current state of children’s subjective well-being: overview, variations and trends over time
▪ Friends: Girls were significantly happier than boys in Waves 1 and 2 only
▪ School: There were no significant gender differences in any wave
▪ Life as a whole: Girls were marginally less happy than boys in Waves 2 to 4, and significantly less happy than boys in Wave 5.
Overall the combination of statistical testing and visual inspection of trends suggests a widening gender gap in terms of happiness with appearance, and with life as a whole. Girls are now less happy than boys in both these respects.
The widening gender gap in happiness with appearance is particularly striking. There has been no discernible trend in boys’ happiness with this aspect of life over the five waves, while girls’ happiness has dropped significantly. The gender gap in happiness with appearance has widened from 0.65 points out of 10 in Wave 1, to 1.01 points in Wave 5. This follows the trend of an increasing gender gap in this measure between 2000 and 2008 which we noted earlier.
Flourishing
As described in the box on page 9, there are two distinct approaches to understanding children’s well-being: a subjective or ‘hedonic’ approach and a psychological or
‘eudaimonic’ approach. There is value in considering different approaches to well-being because, although related, they capture distinctive concepts and, importantly, have different associations with other key factors. Thus, by combining measures of both subjective and psychological well-being, we are able to understand not only whether children feel happy with their lives, but also whether their lives have meaning and purpose. We can think of this as ‘flourishing’.
Drawing on data from a schools survey that we carried out as part of the Children’s Worlds international project, we looked at the relationship between a measure of life satisfaction and a measure of psychological well-being based on Ryff’s framework, described on page 9.
The measure of subjective well-being – specifically of life satisfaction – was based on four items, derived from Huebner (described in a footnote on page 12), that have been validated in an international research project as statistically useful (Casas, 2016):
▪ My life is going well
▪ My life is just right
▪ I have a good life
▪ The things in my life are excellent.
Children were asked to respond to each question on a scale from 0 to 10 (where 0 is ‘Not at all agree’ and 10 is ‘Totally agree’). The measure was created by adding
the responses to the four items and dividing by four to create a life satisfaction scale from 0 to 10.The measure of psychological well-being was based on six items that relate to the six components identified by Ryff (1989):
▪ I like being the way I am (self-acceptance)
▪ I am good at managing my daily responsibilities (environmental mastery)
▪ People are generally pretty friendly towards me (positive relations with others)
▪ I have enough choice about how I spend my time (autonomy)
▪ I feel that I am learning a lot at the moment (personal growth)
▪ I feel positive about my future (purpose in life).
Children were given the same response options as above, and a score was created by adding the responses to the six items and dividing by six to create a scale from 0 to 10.
Both measures had high statistical reliability.5 The correlation between the two measures was 0.78, which shows that although there was a fairly strong association between the two, there are also some differences between them. More detailed statistical analysis6 indicated that these two sets of items were capturing two different concepts.
5 Cronbach’s alpha was 0.97 for life satisfaction and 0.95 for psychological well-being.6 Confirmatory factor analysis.

19
The Good Childhood Report 2016 The current state of children’s subjective well-being: overview, variations and trends over time
We were interested to see how children scored on both of these measures in combination. Other research (eg Keyes, 2006) has argued that people can be defined as ‘flourishing’ if they are scoring reasonably highly on several different measures of self-reported well-being. In our sample of children aged around 12 years old in England, around 86% of children (6 out of every 7) scored at least 5 out of 10 (on or above the mid-point) on each of the measures individually. We can look at the percentages of children
Low psychological well-being
High psychological well-being
Low life satisfaction
10%Languishing
4%Unhappy but functioning well
High life satisfaction
4%Happy but not functioning well
82%Flourishing
Figure 8: Relationship between measures of subjective well-being and psychological well-being
Subjective well-being
% w
ho
had
bee
n b
ulli
ed in
th
e p
ast
mo
nth
Psychological well-being
Low High
70%
60%
50%
40%
30%
20%
10%
0%
65%
48%
58%
50%
Figure 9: Proportion of children bullied, by subjective and psychological well-being

20
The Good Childhood Report 2016 The current state of children’s subjective well-being: overview, variations and trends over time
who fall into different categories based on both measures. Using this approach, 82% of children can be said to be ‘flourishing’ – having reasonably high scores on both measures; 10% can be said to be ‘languishing’ – having low scores on both measures; and around 8% fall in between these two groups – having a high score on one measure and a low score on the other.
Links with bullying
We were interested to explore whether children who are ‘flourishing’, ‘languishing’ or falling into one of the other two quadrants shown are more or less likely to experience other significant factors in their lives. We used the example of bullying to illustrate how certain experiences appear to be linked with particular types of well-being. This builds on earlier findings (on page 9) showing that different components of subjective well-being – positive affect, negative affect and life satisfaction – have different relationships to other outcomes.
Around 51% of children in the sample had experienced at least one of two forms of bullying at school (either being hit or being socially excluded) in the past month. Experiences of being bullied were linked with both measures of well-being but were more strongly associated with subjective well-being than with psychological well-being. Figure 9 shows the percentage of children who had been bullied, comparing those who had low well-being on each measure. It can be seen that the gap in being bullied is much larger between those with low and high scores for subjective well-being than it is for those with low and high psychological well-being.
This suggests that it can be useful to distinguish between these two types of well-being.

21
The Good Childhood Report 2016 The current state of children’s subjective well-being: overview, variations and trends over time
Summary
▪ When we ask children about their happiness with life as a whole, and with specific aspects of their life, we find that the large majority of children in the UK respond relatively positively. Between 2% and 11% of children aged 10 to 17 years old are unhappy with their lives overall, or aspects of their lives, depending on the question being asked. This is a fairly consistent picture and replicates similar findings presented in successive Good Childhood Reports.
▪ By combining a new measure of psychological well-being with a measure of subjective well-being, we have created new estimates for ‘flourishing’. According to this measure, 82% of children aged 12 years old could be said to be ‘flourishing’, with reasonably high scores on both measures, and 10% could be said to be ‘languishing’, with low scores on both measures. Around 8% fall in between these two groups, with a high score on one measure and a low score on the other.
▪ The latest available evidence on trends over time shows that, between 2009 and 2014, there has been an increase in happiness with school work and school, and a decrease in happiness with friends and appearance.
▪ These time trends also reveal growing gender differences for some aspects of children’s well-being – most strikingly for appearance, with girls becoming increasingly unhappy. It’s important to consider this in the context of findings from last year’s Good Childhood Report, in which England ranked last out of 15 countries for happiness with appearance, and also had the most pronounced gender differences for this aspect of life of all participating countries.
21

22
The Good Childhood Report 2016 The current state of children’s subjective well-being: overview, variations and trends over time

23
The Good Childhood Report 2016 The current state of children’s subjective well-being: overview, variations and trends over time
The relationship between subjective
well-being and mental ill-health
Chapter 2
23

24
The Good Childhood Report 2016 The relationship between subjective well-being and mental ill-health
We know from previous analysis that low subjective well-being and mental ill-health are related concepts but not synonymous. An important illustration of their distinctiveness is that each is linked to other variables in rather different ways. For example, subjective well-being is more strongly related to factors pertaining to children’s relationships, while mental ill-health is more strongly associated with children’s behaviours (The Children’s Society, 2013a).
7 Using a validated self-report measure of mental health disorders – the Strengths and Difficulties Questionnaire.
Our latest analysis explores this topic further, and deepens our understanding of how different aspects of well-being and different types of mental health issues relate to each other and to factors such as age and gender.
The relationship between subjective well-being and mental ill-health
In previous editions of The Good Childhood Report (The Children’s Society, 2013a and 2015) we have discussed the relationship between subjective well-being and mental ill-health. Using data from the Understanding Society survey, we have shown that many children have low subjective well-being while not having identifiable mental health disorders.7 We have also shown that subjective well-being and mental ill-health show varying associations with other information about children’s lives. Mental ill-health scores are more closely related than subjective well-being scores to behaviours such as drinking alcohol and truanting. Subjective well-being scores are more closely related than mental ill-health scores to
aspects of relationships, such as feeling supported by family and frequency of talking to parents about things that matter.Here we build on this analysis, making use of data from the Understanding Society survey to explore:
▪ age and gender patterns in subjective well-being and mental ill-health
▪ the association between subjective well-being and mental ill-health at the same point in time
▪ the relationship between changes in subjective well-being and mental ill-health over time.
We use data from Waves 1, 3 and 5 of Understanding Society. This is because the questions about mental ill-health are only asked in odd-numbered waves. The survey covers a representative sample of households in the UK, and includes a sample of well over 3,000 children aged 10 to 15 per wave. These children answer a self-completion questionnaire.The questionnaire includes six questions about subjective well-being, asking children how happy they are with their: family, friends,
appearance, school work, school and life as a whole on a scale from 1 to 7 (where 1 indicates the most happy and 7 indicates the least happy). For ease of communication we have reorganised this data so that we can present scores on a scale from 0 to 10, where a higher score indicates higher subjective well-being.
The questionnaire also includes 25 questions which make up the child self-completion version of the Strengths and Difficulties Questionnaire (SDQ). This is a widely validated measure of mental health issues in children (Goodman et al, 1998). The SDQ consists of five sets of five questions that cover emotional symptoms, peer relationship problems, conduct disorders, hyperactivity/inattention disorders and pro-social behaviour. A score is calculated from 0 to 10 for each of these sets, with a higher score indicating greater problems. The first four scores are added together to create a ‘total difficulties score’. The fifth set (pro-social behaviour) does not contribute to this overall score and we do not consider this set
Chapter 2

25
The Good Childhood Report 2016 The relationship between subjective well-being and mental ill-health
8 It should be noted that some children will appear two or three times in this combined analysis as they will have participated in more than one wave. To avoid double-counting, the statistical test results reported in this section relate to Wave 5 only, but these are broadly consistent for Waves 1 and 3.
any further in the analysis. For consistency of interpretation we have divided the total difficulties score by four so that it is also on a scale from 0 to 10 with a higher score indicating greater difficulties. We refer to the SDQ scores as measures of mental-ill health or mental health issues. However, for precision it should be noted that the child self-completion SDQ scores should only be regarded as indicators of possible mental ill-health status, and do not represent a clinical diagnosis. We clarify this at key points in the discussion.
Age and gender patterns in subjective well-being and mental ill-health
First we look at how each of the measures described above varies with gender and with age. For this part of the analysis we have made use of combined data from Waves 1, 3 and 5 to maximise the sample size. The analysis for each wave has used weightings provided to make the data as representative as possible. We have calculated scores for each of the three waves, and then calculated an equally weighted average of these three scores.8
Figure 10 shows mean scores for subjective well-being and mental ill-health overall and by gender. We tested for gender differences in each of these scores. The results of statistical tests were as follows:In terms of subjective well-being:
▪ Girls were significantly happier than boys with their school work.
▪ Boys were significantly happier than girls with their appearance and with their lives as a whole.
▪ There was no significant difference in happiness with family, friends or school.
In terms of mental health issues:
▪ Girls had significantly greater emotional problems than boys.
▪ Boys had significantly greater problems with conduct and hyperactivity/inattention than girls.
▪ There was no significant difference in peer relationship problems or total difficulties score.
The last point is particularly important because it suggests that the difference between girls and boys in the four SDQ domain scores balances out when it comes to the overall total difficulties score. This suggests that it may be important to conduct detailed analysis separately by gender.
Figure 11 shows variations in mental ill-health scores by gender and age:
▪ Emotional problems increase with age for girls. There is a widening of the gender gap in this respect as children get older. The gap was not statistically significant at 10 years old, but was for all the older age groups. By the age of
15 the average score (out of 10) for girls was 3.7, compared with 2.2 for boys.
▪ The gaps for peer, conduct and hyperactivity/inattention problems narrow with age. Boys had significantly greater conduct and hyperactivity/inattention problems at the age of 10, but by the age of 13 these gender differences had disappeared.
▪ Boys had significantly higher total difficulties scores than girls at the age of 10, but by the age of 14 the situation was reversed.
Figure 12 shows age and gender patterns for the subjective well-being scores:
▪ Happiness with family, appearance, school and life as a whole decreases with age.
▪ At the ages of 10 and 11 girls were significantly happier than boys with their school work, but this gap narrows and is no longer statistically significant thereafter.
▪ At the ages of 10 and 11 there are no other statistically significant differences.
▪ By the age of 12 girls are significantly less happy with their appearance than boys, and the gaps widens up to the age of 14.
▪ At the ages of 14 and 15 girls are significantly less happy than boys with their life as a whole.

26
The Good Childhood Report 2016 The relationship between subjective well-being and mental ill-health
Emotional
Peer
Conduct
Hyperactivity
Total diculties
Family
Friends
Appearance
School work
School
Life
Female Male All
0 1 2 3 4 5 6 7 8 9 10
3.32.3
2.8
1.71.81.7
2.02.4
2.2
3.84.2
4.0
2.72.72.7
8.99.08.9
6.87.6
7.2
9.09.09.0
7.67.2
7.4
7.97.87.8
8.18.3
8.2
Figure 10: Subjective well-being and mental ill-health scores by gender

27
The Good Childhood Report 2016 The relationship between subjective well-being and mental ill-health
Figure 10: Subjective well-being and mental ill-health scores by gender Figure 11: Mental health issue scores by age and gender
5
4
3
2
1
0
10 11 12 13 14 15
Age
Em
oti
on
al p
rob
lem
s
Girls Boys All
5
4
3
2
1
0
10 11 12 13 14 15
Age
Pee
r p
rob
lem
s
Girls Boys All
5
4
3
2
1
0
10 11 12 13 14 15
Age
Co
nd
uct
pro
ble
ms
Girls Boys All
5
4
3
2
1
0
10 11 12 13 14 15
Age
To
tal d
i�cu
ltie
s
Girls Boys All
5
4
3
2
1
0
10 11 12 13 14 15
Age
Hyp
erac
tivi
ty/
inat
ten
tio
n
Girls Boys All

28
The Good Childhood Report 2016 The relationship between subjective well-being and mental ill-health
Figure 12: Subjective well-being scores by age and gender
10
9
8
7
6
5
10 11 12 13 14 15
Age
Fam
ily
Girls Boys All
10
9
8
7
6
5
10 11 12 13 14 15
Age
Fri
end
s
Girls Boys All
10
9
8
7
6
5
10 11 12 13 14 15
Age
Ap
pea
ran
ce
Girls Boys All
10
9
8
7
6
5
10 11 12 13 14 15
Age
Sch
oo
l
Girls Boys All
10
9
8
7
6
5
10 11 12 13 14 15
Age
Lif
e as
a w
ho
le
Girls Boys All
10
9
8
7
6
5
10 11 12 13 14 15
Age
Sch
oo
l wo
rk
Girls Boys All

29
The Good Childhood Report 2016 The relationship between subjective well-being and mental ill-health
In summary, the analysis presented so far indicates some important differences in both subjective well-being and mental ill-health according to age and gender. These differences need to be borne in mind in undertaking analysis of the relationship between the first two factors.
The association between subjective well-being and mental ill-health at the same point in time
We now turn to exploring the relationships between subjective well-being and mental health issues (at the same point in time). We have already shown in previous editions of The Good Childhood Report that, although there is a statistical relationship between these two issues they are not one and the same thing – ie the absence of mental health issues does not imply high subjective well-being.
Figure 13 extends our previous analysis by looking at the associations between different aspects of subjective well-being and different types of mental health issues in Wave 5 of Understanding Society. It shows statistical correlations ranging from -1 to +1 – a figure further away from zero indicates a stronger association. In the table all the correlations are negative, meaning that higher subjective well-being is associated with fewer mental health issues.
Some key points about the findings presented are as follows:
▪ Happiness with family and with school are roughly equally associated with all four categories of mental health issues.
▪ Happiness with friends is more strongly associated with peer problems than the other three categories of mental health issues.
▪ Happiness with appearance is most strongly associated with emotional problems.
▪ Happiness with school work is more strongly associated with ‘externalising’ problems (conduct and hyperactivity/inattention) than with ‘internalising’ problems (emotional and peer-related).
▪ Happiness with life as a whole is a little more strongly associated with ‘internalising’ problems, particular emotional, than ‘externalising’ problems.
▪ The aspect of subjective well-being most strongly associated with the total difficulties scores is happiness with school work.
▪ The largest correlation is between happiness with life as a whole and total difficulties, which equates to saying that either one statistically explains around 27% of the variation in the other.
Figure 12: Subjective well-being scores by age and gender
Figure 13: Correlations between subjective well-being and mental health issues
Life
Family
Friends
Appearance
School
School work
Emotional symptoms
0.46
0.24
0.26
0.43
0.24
0.28
0.36
0.19
0.39
0.26
0.29
0.23
0.34
0.27
0.21
0.20
0.25
0.36
0.30
0.21
0.18
0.22
0.25
0.43
0.51
0.32
0.35
0.39
0.36
0.45
Peerproblems
Conductproblems
Hyperactivity/inattention
Totaldi�culties
30
The Good Childhood Report 2016 The relationship between subjective well-being and mental ill-health
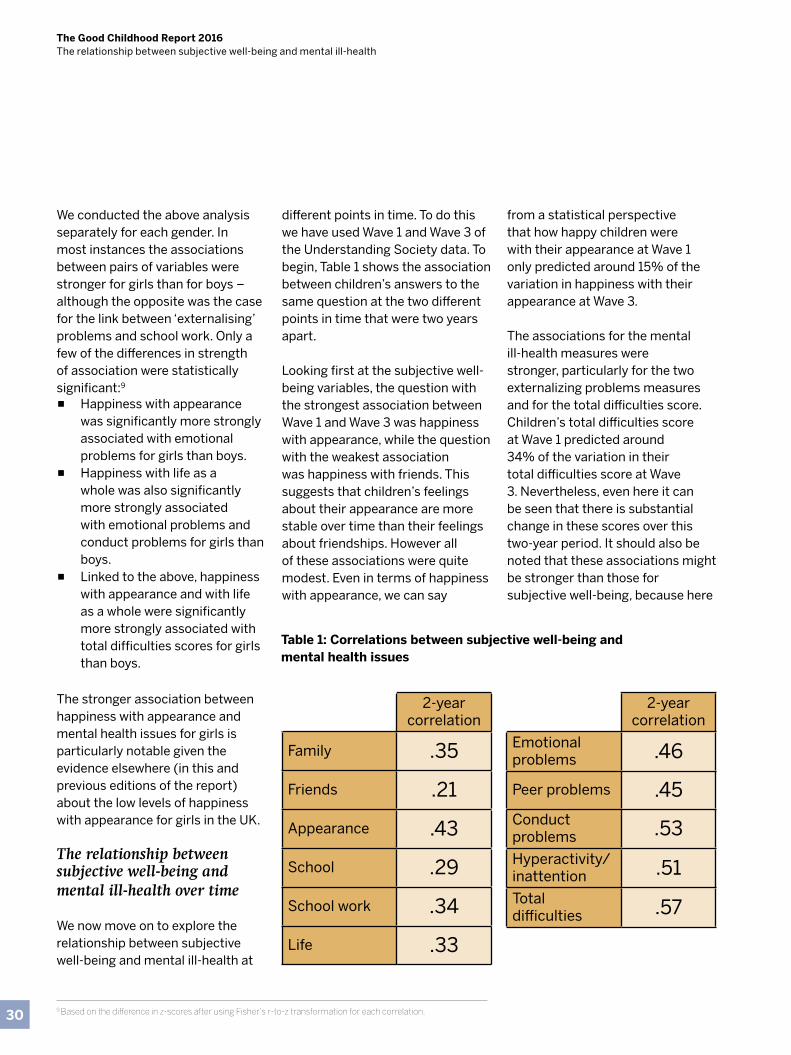
We conducted the above analysis separately for each gender. In most instances the associations between pairs of variables were stronger for girls than for boys – although the opposite was the case for the link between ‘externalising’ problems and school work. Only a few of the differences in strength of association were statistically significant:9
▪ Happiness with appearance was significantly more strongly associated with emotional problems for girls than boys.
▪ Happiness with life as a whole was also significantly more strongly associated with emotional problems and conduct problems for girls than boys.
▪ Linked to the above, happiness with appearance and with life as a whole were significantly more strongly associated with total difficulties scores for girls than boys.
The stronger association between happiness with appearance and mental health issues for girls is particularly notable given the evidence elsewhere (in this and previous editions of the report) about the low levels of happiness with appearance for girls in the UK. The relationship between subjective well-being and mental ill-health over time
We now move on to explore the relationship between subjective well-being and mental ill-health at
different points in time. To do this we have used Wave 1 and Wave 3 of the Understanding Society data. To begin, Table 1 shows the association between children’s answers to the same question at the two different points in time that were two years apart.
Looking first at the subjective well-being variables, the question with the strongest association between Wave 1 and Wave 3 was happiness with appearance, while the question with the weakest association was happiness with friends. This suggests that children’s feelings about their appearance are more stable over time than their feelings about friendships. However all of these associations were quite modest. Even in terms of happiness with appearance, we can say
from a statistical perspective that how happy children were with their appearance at Wave 1 only predicted around 15% of the variation in happiness with their appearance at Wave 3.
The associations for the mental ill-health measures were stronger, particularly for the two externalizing problems measures and for the total difficulties score. Children’s total difficulties score at Wave 1 predicted around 34% of the variation in their total difficulties score at Wave 3. Nevertheless, even here it can be seen that there is substantial change in these scores over this two-year period. It should also be noted that these associations might be stronger than those for subjective well-being, because here
9 Based on the difference in z-scores after using Fisher’s r-to-z transformation for each correlation.
2-year correlation
Family .35
Friends .21
Appearance .43
School .29
School work .34
Life .33
2-year correlation
Emotional problems .46
Peer problems .45Conduct problems .53Hyperactivity/inattention .51Total difficulties .57
Table 1: Correlations between subjective well-being and mental health issues

31
The Good Childhood Report 2016 The relationship between subjective well-being and mental ill-health
we are looking at measures made up of a number of questions compared to the single-item subjective well-being questions.
A different way of looking at the same information is to calculate the proportion of children who fall above or below a particular threshold score.
For example, in terms of subjective well-being, 11.6% of children in Wave 1 had low life satisfaction (a score on or above the mid-point on the seven point scale, where 1 indicates the most happy and 7 indicates the least happy). Just over a third (36%) of these children also had low life satisfaction in Wave 3. We cannot be sure that this means they also had low life satisfaction at intermediate points over the two-year period, but these statistics do suggest some persistence of low life satisfaction. In comparison, only 8.4% of children who did not have low life satisfaction at Wave 1 had low life satisfaction at Wave 3.Turning to the measures of mental health issues, around 42% of children who had a high total difficulties score of 19 or more at Wave 1 (indicating a high risk of a mental health disorder) also had a high score at Wave 3, compared to around 6% of children who did not have a high score at Wave 1.Overall there is a picture of some stability, but also substantial change both in subjective well-being measures and mental ill-health measures across this two-year period.
A question that has been relatively unexplored is to what extent children’s subjective well-being at one point in time might predict mental health issues at a later point in time, and vice versa. Analysis of this kind of relationship is complex. A very simple approach involves seeing the extent to which life satisfaction at Wave 1 predicts mental health issues in Wave 3. Taking this approach we find that the correlation between the two is around 0.32, suggesting that a child’s level of life satisfaction can predict around 10% of the variation in mental health issues two years later. It is also possible to look at the opposite relationship. Mental health issues at Wave 1 predicts around 8% of the variation in life satisfaction at Wave 3.
However this is not a good approach because we already know that subjective well-being and mental health issues are associated in Wave 1. So the fact that subjective well-being in Wave 1 predicts mental health issues in Wave 3 or vice versa may only be due to this association. In fact analysis that takes this into account shows that subjective well-being at Wave 1 is not very useful in predicting mental health issues at Wave 3 once mental health issues at Wave 1 are taken into account.10 The same applies the other way round for the predictive power of mental health problems at Wave 1.11
A different approach was used in a study of adults in the US (Keyes et al, 2010) which found that changes in levels of positive well-being over a 10-year period predicted the risk of mental illness. The analysis had access to a much richer set of measures of positive well-being than we currently do. However we have replicated the approach taken in that study with the data we have at our disposal from the Understanding Society survey.The two key pieces of information used in this analysis are shown in Figure 14.
The first part of the chart shows the proportion of children who exceeded the threshold total difficulties score (19 or more out of 32) at Wave 3, depending on whether they were below or above the threshold score at Wave 1. Over two-fifths (42%) of children who had high mental health issues at Wave 1 also did so at Wave 3, compared to only 6% of children who had low mental health issues at Wave 1.
The second part of the chart shows the percentage of mental health issues at Wave 3 for four groups of children, depending on their level of life satisfaction (low or high) at Wave 1 and Wave 3 (high is defined as a score below the mid-point of the seven point life satisfaction scale where 1 indicates the most happy and 7 indicates the leasthappy, and low is defined as a score on or above the mid-point). Only 1 in 20 children who had high life
10 Only adding 1% explanatory power in a regression model, once mental health at Wave 1 was introduced.11 Only adding 2% explanatory power in a regression model, once subjective well-being at Wave 1 was introduced.

32
The Good Childhood Report 2016 The relationship between subjective well-being and mental ill-health
Figure 14: Variations in mental health issues (Wave 3) according to mental health issues (Wave 1) and life satisfaction (Waves 1 and 3)
satisfaction at both points in timehad mental health issues at Wave 3, compared to well over half of children who had low life satisfaction at both points in time.
These statistics are based on analysing these two pieces of information separately and so they don’t take account of the relationship between mental health issues and life satisfaction over time. To do this we replicated the analysis12 of Keyes et al. to predict the odds of having high mental health issues at Wave 3,
simultaneously taking account both of mental health issue status at Wave 1 and levels of life satisfaction at Wave 1 and Wave 3. We also took account of age and gender. We found that the different categories of life satisfaction at Waves 1 and 3 still predicted the likelihood of having mental health issues at Wave 3, after taking account of mental health issues at Wave 1 and age and gender.
A straightforward way of viewing this approach is presented in Figure 15, which shows the same type of
statistics as in the lower half of Figure 14, but only includes children who did not reach the threshold score on the SDQ for indication of mental health issues at Wave 1.
0% 10% 20% 30% 40% 50% 60% 70% 80% 90% 100%
Low mental health issues (T1)
High mental health issues (T1)
High SWB (T1 and T2)
Low SWB (T1) to High SWB (T2)
High SWB (T1) to Low SWB (T2)
Low SWB (T1 and T2)
6.4%
41.6%
4.9%
15.1%
34.3%
56.9%
12 Using logistic regression analysis.

33
The Good Childhood Report 2016 The relationship between subjective well-being and mental ill-health
Figure 15: Variations in mental health issues (Wave 3) according to mental health issues (Wave 1) and life satisfaction (Waves 1 and 3) for children who did not have mental health issues at Wave 1
We checked whether these findings might be to do with ‘threshold effects’ in the total difficulties score by using the numerical score of total difficulties at Wave 1 rather than the binary low/high mental health issues variable. In this case, the group of children who had low life satisfaction at Wave 1 only did not have significantly higher mental health issues at Wave 3 than the group of children who had high life satisfaction at both waves. However, the remaining two groups did still have significantly higher mental health issues at Wave 3.
Some caution is needed because the numbers of children in some of these groups are quite small, but we replicated the analysis using data from Waves 3 and 5 with broadly the same results.In summary, this analysis – although only using a very simple single-item measure of subjective well-being – produces similar results to those found by Keyes et al. for adults in the US. This analysis suggests that subjective well-being levels over time, and changes in these levels, are significantly associated with risk of mental health issues, even after taking account of earlier mental health issues and other factors such as age and gender.
0% 10% 20% 30% 40% 50% 60% 70% 80% 90% 100%
High SWB (T1 and T2)
Low SWB (T1) to High SWB (T2)
High SWB (T1) to Low SWB (T2)
Low SWB (T1 and T2)
3.7%
9.1%
26.5%
40.5%

34
The Good Childhood Report 2016 The relationship between subjective well-being and mental ill-health
Summary
▪ Analysis of different types of mental health issues and different domains of well-being reveals that as girls get older, they are more likely than boys to be unhappy with their appearance and life as a whole, and more likely to experience emotional health problems such as anxiety and depression.
▪ There are associations between emotional problems and happiness with appearance and life as a whole, and these are strongest for girls.
▪ In contrast, boys are more likely than girls to be unhappy with their school work – but this is only the case when they are younger and these gender differences disappear from age 12 onwards. There is a similar pattern for conduct and hyperactivity/inattention problems, with boys more likely than girls to experience these problems at younger ages, and the gender differences disappearing at age 13.
▪ There are associations between conduct and hyperactivity/inattention issues and happiness with school work, which are strongest for boys.
▪ These findings help us to understand another key finding from our analysis: at age 10 boys are more likely than girls to have a mental health issue when all types are considered together, but by age 14 the situation is reversed.
▪ Analysis of the relationship between subjective well-being and mental health issues at two points in time (approximately two years apart) reveals that the odds of having mental health issues at the second time point are substantially higher for children with low well-being at both time points than for children with high well-being at both time points. This provides an additional justification for being concerned about, and measuring, children’s well-being.
34
35
The Good Childhood Report 2016 The relationship between subjective well-being and mental ill-health

36
The Good Childhood Report 2016 The relationship between subjective well-being and mental ill-health

37
The Good Childhood Report 2016 The current state of children’s subjective well-being: overview, variations and trends over time
Children’s views of their local area
Chapter 3
37

38
The Good Childhood Report 2016 Children’s views of their local area
Some of the clearest illustrations of the policy relevance of data on children’s well-being are geographical comparisons, whether within countries or between countries. In The Good Childhood Report 2015, we focused on the latter through an international study of children’s well-being, Children’s Worlds, which showed striking differences in patterns of well-being from country to country.
For example, we discovered that the age and gender patterns that we see in England in relation to particular aspects of children’s lives – including children’s feelings about school and appearance – are not replicated in every country. Clearly, the disparities that we become used to seeing in children’s well-being – such as the sharp decline in girls’ satisfaction with their appearance during adolescence – are not an unavoidable facet of being a specific age or gender, which means, importantly, that it is possible to do something about them.
In this year’s report, we turn our attention to the extent to which there are within-country geographical variations in children’s well-being. This will be of particular interest to those concerned with the role that local policy and practice can play in promoting children’s well-being. First of all, we look at whether there are regional differences in children’s well-being in our own data. We then go on to explore the characteristics of a local area that are most strongly related to children’s well-being.
This will help us to identify areas that may be achieving high levels of well-being for children despite challenging circumstances, and vice versa.
Local well-being surveys
This geographical analysis is an attempt to build more systematically on the individual local area analyses that The Children’s Society has been doing in partnership with a number of local authorities over the last four years.
We initiated our local well-being programme in 2012 with a well-being survey on the Isle of Wight involving almost 5,000 children and almost every school on the island (see The Children’s Society, 2013b). By drawing comparisons between the local area data generated by this survey and the national data that we had built up through the nationally representative schools and household surveys described on page 13, we were able to identify a number of aspects of children’s well-being warranting special attention. On the Isle of
Wight, our analysis suggested that children were experiencing family relationships and the local area positively compared to national averages. However, safety in schools and bullying appeared to be issues of specific concern, to which the council responded with a review of the island-wide bullying policy.
The Isle of Wight was the first of a number of local authorities to participate in our local well-being programme, and in each successive exploration of local well-being we have been able to highlight aspects of children’s well-being where there are local variations from what we have found in our national data – which can help inform changes to local policy and practice.
Our local area research has also generated a number of findings that add to the knowledge we have built through our national research – one such example is a more nuanced understanding of bullying. We have known for some time that bullying is a major concern for children and young people, and an important influence on their well-being (The Children’s Society, 2006 and
Chapter 3

39
The Good Childhood Report 2016Children’s views of their local area
2015; Rees et al, 2010a). Our local well-being research offered the opportunity to extend this analysis further as local areas were keen to better understand the types and locations of bullying that children most commonly experience. We therefore included a series of more detailed questions about bullying in our local well-being surveys, and these highlighted a number of key points.
One finding was that the most common forms of bullying are emotional and relational (eg name calling, being made fun of), which girls are more likely to experience, and these types of bullying are twice as commonplace as physical bullying, which boys are more likely to experience. Figure 16 is from the local well-being survey that we did in the Isle of Wight:
I was called nasty names
People madefun of me
80%
70%
60%
50%
40%
30%
20%
10%
0%I was hit, kicked
or pushedPeople took
my belongingsSomething else
67%61%
36%
19%16%
Figure 16: Types of bullying
Source: The Children’s Society 2013b, children aged 9 to 15. NB More than one response is possible, so percentages add up to more than 100%.

40
The Good Childhood Report 2016 Children’s views of their local area
In addition, and contrary to the preoccupation of many adults about the issue of cyber-bullying, we also discovered that the vast majority of bullying takes place at school. As can be seen in Figure 17, which refers to a local well-being survey we conducted in Portsmouth (The Children’s Society, 2014b), more than three quarters of children experiencing bullying said they had been bullied at school,
compared to around 1 in 10 children who said they had experienced bullying online and by text.
We also found higher levels of bullying amongst particular groups eg children receiving free school meals and children who have ‘a lot less’ and ‘a lot more’ spending money than their friends. This last finding demonstrates the importance of notions of equality
and fairness for children, and that greater wealth does not always equate to increased well-being. As can be seen from Figure 18 (from the local well-being survey that we did in the Isle of Wight), children who said that they had roughly the same amount of money as their friends were the least likely to say they had been bullied.
0% 20% 40% 60% 80% 100%
In school
Local area
Going to and from school
Online
Somewhere else
Through texting
78%
18%
17%
14%
12%
8%
Figure 17: Locations of bullying
Source: The Children’s Society 2014b, children aged 7 to 16. NB More than one response is possible, so percentages add up to more than 100%.

41
The Good Childhood Report 2016Children’s views of their local area
Another interesting finding to emerge from our local well-being research is the positive role that ethnic and cultural diversity seems to play in relation to some aspects of how children see themselves. In a local well-being survey we conducted in the London borough of Lewisham, we found notably higher levels of happiness with appearance amongst children in Lewisham in comparison to the national average. We were interested to see whether the ethnic diversity of Lewisham
might help explain children’s more positive feelings about their appearance. Interestingly, there were statistically significant differences according to ethnicity, with black children reporting higher levels of happiness with their appearance than children in other ethnic groups.
We extended this analysis further by running a logistic regression looking at the probability of scoring 10 out of 10 for happiness with appearance for different
ethnic groups, controlling for gender, free school meal status and age (whether children were at primary or secondary school). The predicted probabilities shown in Figure 19 are based on girls in secondary school not receiving free school meals. Figure 19 shows that Caribbean, African and Black Other children had a significantly higher probability of scoring 10 out of 10 for happiness with appearance than white children.
Figure 18: Spending money relative to friends, and experiences of bullying
Source: The Children’s Society 2013b, children aged 9 to 15. NB More than one response is possible, so percentages add up to more than 100%.
60%
50%
40%
30%
20%
10%
0%
43%
31% 28%35%
48%
A lot more A bit more About the same A bit less A lot less

42
The Good Childhood Report 2016 Children’s views of their local area
Figure 19: Happiness with appearance and ethnicity
White South EastAsian
Caribbean African Black:other
Other
Pre
dic
ted
pro
bab
ility
Full satisfaction with appearance
0.6
0.5
0.4
0.3
0.2
0.1
0.0
Source: unpublished research by The Children’s Society, children aged 7 to 15.
Geographical differences in children’s well-being
Building on the findings of our local well-being surveys, we wanted to examine whether there are geographical differences in children’s well-being at the regional level, drawing on data from 14 waves of our well-being household survey. For the purposes of this analysis, we focused on 10 to 15 year olds because the age range of respondents changed from 8 to 15
year olds for the first eight waves to 10 to 17 year olds from Wave 9 onwards. To filter out duplicate cases we also excluded children who were included in earlier waves of the survey.
We ran regressions in two stages: the first stage including age, gender and social class, the second stage introducing Government Office Region. Interestingly, the introduction of region added almost nothing to the explanatory power of any of the models. We conducted
this analysis for our multi-item measure of overall well-being (ie the Huebner score, similar to the one described on page 12), for the three ONS single-item measures of subjective well-being (ie happiness with life as a whole, happiness yesterday, and feeling life is worthwhile described on page 12) and also for our 10 Good Childhood Index domains. We could find no solid evidence of regional differences for any of these measures.

43
The Good Childhood Report 2016Children’s views of their local area
Figure 20: Child and parent subjective well-being by Index of Multiple Deprivation quintile
Local area deprivation and children’s well-being
Building on the analysis presented in the section above, we were keen to further probe the relationship between levels of deprivation in an area and children’s well-being. The latest wave of our household survey of 2,000 children and parents – which was conducted in March/April 2016 – presented the opportunity to explore the relationships between:
▪ indicators about the local area where children live
▪ children’s views and experiences of the local area
▪ children’s overall subjective well-being.
The Index of Multiple Deprivation (Department for Communities and Local Government, 2015) is a widely-used official measure of local deprivation within small geographical areas in England. It is based on 37 separate indicators grouped into seven domains: income; employment; health and disability; education, skills and training; crime; housing and services; and living environment. Each area has a score for each of these domains, plus an overall IMD score – higher scores indicate higher levels of deprivation. It is common to divide the list of local areas into ‘deciles’ (each containing 10% of areas) or ‘quintiles’ (each containing 20% of areas).
Figure 20 shows mean scores on the three measures of children’s subjective well-being introduced in Chapter 1, for each quintile of the Index of Multiple Deprivation. As can be seen, there was no link between the level of deprivation of the area where children lived and their subjective well-being, measured by happiness, life satisfaction or feeling that life is worthwhile. Also included in the chart is a measure of parents’ life satisfaction that we included in the survey. There was some (statistically significant) evidence of lower parent life satisfaction in areas with higher deprivation.
Least deprived
Happy Satisfied Worthwhile Parent
8
7
6
5
4
3
2
1
02nd least deprived Middle 2nd most deprived Most deprived

44
The Good Childhood Report 2016 Children’s views of their local area
We also looked at each of the domain scores of the IMD separately, but did not find a significant association between any of these measures and children’s subjective well-being. There were weak but statistically significant links between parent life satisfaction and six of the seven domain scores (the exception being the score for barriers to housing and services).
We checked this analysis using data from Wave 5 of the Millennium Cohort Study, which gathers information from a large sample of children born close to the millennium and their parents. In each country of the UK the sample is divided into advantaged and disadvantaged areas. We were able to compare child life satisfaction and parent life satisfaction between these two types of areas in each of the four countries of the UK. The results are shown in
Figure 21. In each country there was no significant difference in child life satisfaction between advantaged and disadvantaged areas. However in all four countries, parents in disadvantaged areas were significantly less satisfied with their lives than those in more advantaged areas.
The overall conclusion of this analysis is that children’s level of subjective well-being does not seem to be affected by the level of deprivation of the local area in which they live, but parent’s life satisfaction does, at least to some extent.
The above analysis relates to ‘objective’ indicators of the local area, derived from statistics and measures of things like the proportion of adults employed in the area, premature mortality and the quality of housing.
In our survey we also asked children about their views and experiences of their local area. We used nine questions (three sets of three) that we have previously tested (The Children’s Society, 2012) that cover children’s views of three aspects of the local area – facilities, safety/freedom and local adults. For each of these topics we summed children’s responses to the three questions asked and converted them to a score from 0 to 10, where a higher score means a more positive view.
We also asked a set of nine questions about children’s experiences of problems in their local area. We added up how many problems children reported to create a score from 0 to 9 where a higher score indicates a greater number of problems.
Local area questions asked of children
Please say how much you agree or disagree with each of the sentences:
Safety/freedom
▪ I have plenty of freedom in the area I live in.
▪ I feel safe when I am out in my local area during the day.
▪ I feel safe when I am out in my local area at night.
Facilities
▪ There are places for me to go in my area.
▪ There are lots of fun things to do where I live.
▪ There is nothing to do in my area.
Local adults
▪ Adults in my area listen to young people’s views.
▪ I like my neighbours.
▪ Adults in my area treat young people fairly.
ProblemsDo you think any of these things are a problem in the area where you live?
▪ Noisy neighbours (music/shouting)
▪ General noise from the street
▪ Cars driving too fast
▪ Rubbish
▪ Dog mess
▪ Graffiti/tagging
▪ Neighbours arguing
▪ Dangerous animals or dogs that are off their leads
▪ People drinking or taking drugs

45
The Good Childhood Report 2016Children’s views of their local area
Figure 21: Child and parent subjective well-being by local area type in the Millennium Cohort Study, Wave 5 (children aged around 11 years old)13
Child Parent
Advantaged Disadvantaged
England
10
9
8
7
6
5
4
3
2
1
0Child Parent
Advantaged Disadvantaged
Wales
10
9
8
7
6
5
4
3
2
1
0
Child Parent
Advantaged Disadvantaged
Scotland
10
9
8
7
6
5
4
3
2
1
0Child Parent
Advantaged Disadvantaged
Northern Ireland
10
9
8
7
6
5
4
3
2
1
0
8.4
8.48.0
8.68.5
8.4 8.4
8.8 8.7 8.88.3
8.48.3 8.37.9 7.9
13 In England there was a separate stratum for local areas with high proportions of minority ethnic populations. The mean subjective well-being scores in these areas were 8.6 for children and 8.0 for parents.

46
The Good Childhood Report 2016 Children’s views of their local area
There were significant associations between the scores for each of these four measures and children’s subjective well-being. Children who felt more positive about local facilities, safety and freedom in the local area and local adults – and who reported fewer problems in their local area – also had higher levels of happiness, life satisfaction and feeling that life was worthwhile. These findings are illustrated in Figure 22 and Figure 23.
As shown in Figure 22, children who rated their local area relatively highly for facilities, safety/freedom and local adults, had higher life satisfaction scores than children who rated their local area more poorly. The same patterns applied for feeling happy and finding life worthwhile (not shown in the chart).
Figure 23 shows children’s mean subjective well-being scores (happiness, life satisfaction and finding life worthwhile) according to how many of the list of nine local area problems they reported. Children who reported more problems tended to have significantly lower subjective well-being for all three measures.
Facilities Safety/Freedom Local adults
Low score High score
10
9
8
7
6
5
4
3
2
1
0
7.08.0
7.17.9
6.9
8.1
Figure 22: Mean life satisfaction scores for children according to their ratings of their local area
Figure 23: Mean well-being scores for children according to number of local area problems reported
None One Two Three
Happy Satisfied Worthwhile
10
9
8
7
6
5
4
3
2
1
0Four or more
7.5 7.6 7.6 7.4 7.6 7.5 7.3 7.5 7.4 7.2 7.5 7.47.0 7.2 7.0

47
The Good Childhood Report 2016Children’s views of their local area
The table adjacent shows associations between the nine local area problems and the three measures of children’s well-being. Noisy neighbours and people drinking or taking drugs were the two local area problems with the strongest associations to the two measures of subjective well-being.
As an example, Figure 24 shows the different mean scores for the three well-being measures according to whether children reported having a problem with ‘noisy neighbours’.
Table 2: Effect sizes (eta2*100) for associations between specific local area problems and child SWB
Satisfied Happy Worthwhile
Noisy neighbours (music/shouting) 1.4 1.1 0.7
People drinking or taking drugs 1.1 1.0 1.6
General noise from the street 0.9 0.7 0.5
Graffiti/tagging 0.9 0.5 0.8
Rubbish 0.7 0.6 1.1
Neighbours arguing 0.8 0.4 0.8
Cars driving too fast ns ns ns
Dog mess ns ns ns
Dangerous animals/dogs off leads ns ns ns

48
The Good Childhood Report 2016 Children’s views of their local area
In summary, children’s views of facilities, safety/freedom and adults in their local area and the number of problems they reported in their local area were all associated with their subjective well-being.
We checked these findings, controlling for children’s age and gender and household income. Each of the four measures of the
local area still made a significant contribution to predicting children’s subjective well-being once these other factors were taken into account. When all four measures (and age, gender and income) were considered at once, the scores for facilities, safety/freedom and local adults all made a significant contribution to explaining variations in children’s subjective well-being, but the number of problems in
the local area did not. To provide an example of the associations: gender, age and household income explained around 6% of the variation in life satisfaction, yet by including children’s scores for local facilities, safety/freedom and local adults it was possible to explain an additional 21% of the variation in life satisfaction.
These findings do not show that the characteristics of the local area cause the variations in children’s subjective well-being. It is possible that other factors which we have not been able to take into account can explain the patterns observed. It is also possible that children with higher subjective well-being tend to rate their local area more positively. However, we found that children’s ratings of their local area were also statistically associated with their parent’s life satisfaction, after controlling for household income and the IMD score, which casts some doubt on this hypothesis.
Overall, the analysis presented in this section suggests that objective measures of local areas are not related to children’s subjective well-being, but that children’s own views and experiences of their local area are.
Figure 24: Mean well-being scores for children according to whether they reported ‘noisy neighbours’
Happy Satisfied Worthwile
No noisy neighbours Noisy neighbours
9
8
7
6
5
4
3
2
1
0
7.4
6.8
7.67.1
7.57.1
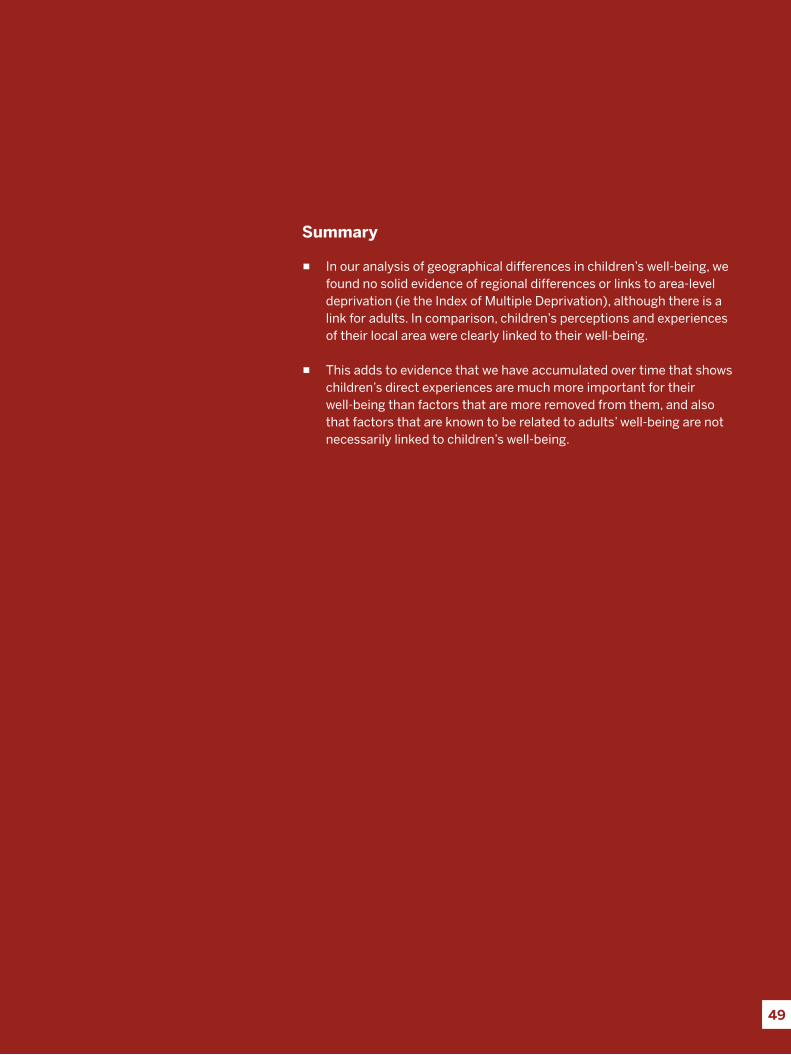
49
The Good Childhood Report 2016 The current state of children’s subjective well-being: overview, variations and trends over time
Summary
▪ In our analysis of geographical differences in children’s well-being, we found no solid evidence of regional differences or links to area-level deprivation (ie the Index of Multiple Deprivation), although there is a link for adults. In comparison, children’s perceptions and experiences of their local area were clearly linked to their well-being.
▪ This adds to evidence that we have accumulated over time that shows children’s direct experiences are much more important for their well-being than factors that are more removed from them, and also that factors that are known to be related to adults’ well-being are not necessarily linked to children’s well-being.
49

50
The Good Childhood Report 2016 The current state of children’s subjective well-being: overview, variations and trends over time

51
The Good Childhood Report 2016 The current state of children’s subjective well-being: overview, variations and trends over time
A review of the factors associated
with children’s subjective well-being
Chapter 4
51

52
The Good Childhood Report 2016 A review of the factors associated with children’s subjective well-being
In the previous section we reported that:
▪ Children’s subjective well-being was not associated with objective social indicators about their local area, although their parents’ subjective well-being was at least to some extent
▪ Children’s subjective well-being was associated with their subjective views and self-reported experiences of their local area.
In this section we discuss how these broad findings fit into the wider pattern of factors associated with child subjective well-being.
The family
In our first survey report from this research programme (Rees et al, 2010a) we reported some important findings on the relationship between child subjective well-being and family factors. We found a weak relationship between family structure and life satisfaction. Children living with both birth parents had higher life satisfaction than those living with a lone parent, with children living in a stepfamily somewhere in the middle. However,
family structure only explained around 2% of the variation in children’s life satisfaction. In comparison, a single question about whether children felt their family got along well together explained around 20% of the variation. This is clearly illustrated in Figure 25, which is reproduced from that report.
Agree Neither Disagree
Both birth parents Step family Lone parent
Ove
rall
sub
ject
ive
wel
l-b
ein
g (
0 t
o 1
0)
‘My family gets along well together’
9
8
7
6
5
4
3
2
1
0
8.1 7.9 7.7
6.9 6.8 6.9
6.0 5.9 5.9
Figure 25: Family structure, family harmony and subjective well-being
Chapter 4
The analysis presented in the previous section about local area factors and children’s subjective well-being is part of a consistent picture that we have gradually been building over the past few years through our own surveys and analysis of other data.

53
The Good Childhood Report 2016A review of the factors associated with children’s subjective well-being
This was an early indication that children’s experiences were much more important for their subjective well-being than the kinds of objective social indicators often employed in social research.
Household poverty and deprivation
In 2011 we published findings from one of our household surveys that gathered data from parents on household income and from
children and parents on their subjective well-being. We found that children in families with lower household income did have significantly lower subjective well-being. However, income explained less than 3% of the variation in child subjective well-being. Additional analysis we have undertaken for this report indicates that, in the same survey, income explained over 7% of the variation in adult subjective well-being (using identical questions to those
asked of children). These patterns are illustrated in Figure 26, where it can be seen that the decline in subjective well-being with lower income is much greater for parents than for children.
Figure 26: Household and child and adult subjective well-being
Highest 20% 2nd highest 20% Mid 20% 2nd lowest 20% Lowest 20%
Child Parent
10
9
8
7
6
5
4
3
2
1
0
7.1
6.4
7.1
6.05.7
6.8 6.66.3
5.05.3
Ove
rall
sub
ject
ive
wel
l-b
ein
g (
0 t
o 1
0)
Household income band (quintiles)
Household Survey, Wave 3.

54
The Good Childhood Report 2016 A review of the factors associated with children’s subjective well-being
It might appear from the previous findings that household economic factors do not have a substantial influence on child subjective well-being. However, research we published in 2012 demonstrated that is not the case. The research, conducted in partnership with the University of York (Main and Pople, 2012), described the development of a child-centred material deprivation index. This index was devised in consultation with children and included items which they identified as important for them to have a ‘normal kind of
life’. The final index had 10 items, such as weekly pocket money and ‘the right kind of clothes to fit in with other children your age’. Children were asked if they had each item and their answers were used to calculate a score from 0 to 10 where a higher score indicated greater material deprivation. We verified that children were able to report reliably on the items by also gathering information from parents which indicated that they broadly agreed with children’s self-report on this issue.
We found that this index could explain around 10% of the variation in subjective well-being (after controlling for other factors such as gender, age, family type, number of adults in paid work). Thus a reliable child-reported material deprivation index can explain much more about variations in child subjective well-being than a traditional measure of household income. The differences in child subjective well-being according to material deprivation can be seen in Figure 27.
Figure 27: Material deprivation and child subjective well-being
None
Ove
rall
sub
ject
ive
wel
l-b
ein
g (
0 t
o 1
0)
One Two Three or four Five or more
Material deprivation: Number of items lacked (out of 10)
10
9
8
7
6
5
4
3
2
1
0
7.6 7.4
6.86.3
5.5
School survey, 2010, age 8 to 15.

55
The Good Childhood Report 2016A review of the factors associated with children’s subjective well-being
A further striking finding from our research programme was the relationship between children’s answers to a question about how much money they had compared to their friends and their subjective well-being. Perhaps not surprisingly, children who had ‘a lot less’ than their friends had the lowest well-being. But the group of children who had the highest mean well-being were not those who had more than their friends, but those who had ‘about the same’.
We were concerned that this finding may have been a one-off,
or attributable to a confusion about question wording. However we found a similar pattern in a later survey using a different question wording; and data from the Millennium Cohort Study from children aged 11 years old also indicates that children who said that, compared to their friends, their family had ‘about the same’ amount of money had higher mean life satisfaction (8.5 out of 10) than children who said their families were richer (8.3 out of 10). Children who said their families were poorer had much lower life satisfaction (7.1 out of 10).
Other family indicators
The above two sections have presented findings from our past research which show that quality of family relationships matters much more for children’s sense of well-being than the family structure they live in; and that children’s direct experience of material deprivation matters much more than household income.
Other recent analysis (Rees and Bradshaw, 2015) extends this picture, making use of data from the Millennium Cohort Study. This
Figure 28: Money compared to friends and child subjective well-being
School survey, 2010, age 10 to 15.
A lot less
Ove
rall
sub
ject
ive
wel
l-b
ein
g (
0 t
o 1
0)
A bit less About the same A bit more A lot more
Compared to your friends how much money do you usually have to spend for yourself?
10
9
8
7
6
5
4
3
2
1
0
6.2
7.17.6
7.3 7.4

56
The Good Childhood Report 2016 A review of the factors associated with children’s subjective well-being
analysis considered a wide range of information provided by parents and the associations with child subjective well-being. This provides an important new perspective because most prior research on child subjective well-being has relied solely on information gathered from children about the context of their lives. The findings indicate that some factors – such as family structure, family financial status and parental well-being – were significantly associated with child subjective well-being at the age of 11. However the explanatory power of these factors was again rather weak, and some factors which have often been shown to have important associations with other child outcomes (such as parental education), did not have any link with child subjective well-being at all. In a second stage of the analysis, some information reported by the child was introduced into the analysis about experiences of being bullied, conflict with friends and children’s feelings of safety in the local area. These factors were much more strongly associated with child subjective well-being than the parent-reported information.
Given the comprehensive nature of the range of parent-reported variables considered in the above analysis, there is now a fairly clear broad finding that efforts to understand variations in child
subjective well-being should focus more on children’s own experiences of life than on traditional social indicators.
The national level
At the other end of the spectrum, recent research on international variations in child subjective well-being has also provided new insights into the extent to which social indicators can explain variations in well-being. The findings from Wave 2 of the international Children’s Worlds survey (Rees and Main, 2015), which we included in last year’s report, found that that the highest levels of life satisfaction in a sample of 15 countries across four continents were in Romania and Colombia. England was in the bottom half of the rankings and children in South Korea tended to have the lowest life satisfaction.
Further analysis of this data (Bradshaw and Rees, 2015) showed little or no association between mean life satisfaction scores for different countries and a wide range of social indicators including GDP, Gini coefficients of inequality, youth unemployment etc. This is a different finding to that for adults, where considerable progress has been made in explaining international variations in subjective well-being using macro data (Helliwell et al, 2015).
This analysis has been strengthened by analysis (Rees, 2016) of recently published data on child life satisfaction in Europe (Inchley et al, 2016) linked with Gallup World Poll data on adult life satisfaction from the World Happiness Report (Helliwell et al, 2015) and Gross National Income (GNI). This analysis clearly shows:
▪ that there is little or no relationship at a country level in Europe between levels of child and adult subjective well-being (Figure 29)
▪ there is a much stronger relationship between GNI and adult subjective well-being (Figure 30) than there is between GNI and child subjective well-being (Figure 31).14
14 Please note that similar analysis using an earlier wave of HBSC data (Levin et al., 2011) did find a significant association between GDP and mean life satisfaction of children aged 13 years old. This was with a smaller sample of countries, and the inclusion of new countries such as Albania, Armenia and Moldova in the most recent wave of the survey appears to partly account for the different finding of our analysis.

57
The Good Childhood Report 2016A review of the factors associated with children’s subjective well-being
95.0 –
R²
Lin
ear
= 0
.00
5
90.0 –
85.0 –
80.0 –
Ch
ild
life
sat
isfa
ctio
n
Adult life satisfaction
– – – –
4.000 5. 000 6.000 7.000
–
8.000
ALB
MOL NET
AUS
FIN DEN
NORSUI
ICEISRIRE
ESPSVN
MAL
ITAGBR SWE
LUX
GER
FRA
CZE
LITCRO
EST
ROM
GRE
BUL
UKR LAT
HUN
POR
RUS
SVK
POLMKD
ARM
8 –
R²
Lin
ear
= 0
.677
7 –
6 –
Mea
n a
du
lt li
fe s
atis
fact
ion
GNI per capita
4 – – – – –
0 20000 40000 60000
ALB
MOL
NET
AUS
FINDEN NORSUIICE
ISR
IRE
ESP
SVN
MAL
LIT
ITA
GBR
SWE
LUX
GER
FRACZE
CRO
EST
ROM
GRE
BUL
UKR
LATHUN
POR
RUS
SVK
POL
MKD
ARM
Figure 29: The relationship between child and adult subjective well-being in European countries
Figure 30: The relationship between adult life satisfaction and national wealth in European countries

58
The Good Childhood Report 2016 A review of the factors associated with children’s subjective well-being
Figure 31: The relationship between child life satisfaction and national wealth in European countries
R2
lin
ear
≈ 0
80.0 –
85.0 –
90.0 –
95.0 –
Ch
ild
life
sat
isfa
ctio
n
GNI per capita
4 – – – – –
0 20000 40000 60.000
ALB
MOL
NET
AUS
FIN DEN NORSUI
ICE
ISRIRE
ESP
SVN
MALLIT
ITAGBR SWE
LUXGERFRA
CZE
CRO
EST
ROM
GRE
BUL
UKR LAT
HUN
POR
RUSSVK
POLMKD
ARM
59
The Good Childhood Report 2016 The current state of children’s subjective well-being: overview, variations and trends over time
Summary
This brief review of a range of findings about factors affecting children’s (and adults’) subjective well-being at various levels highlights two simple but important points:
1. The factors that are associated with children’s subjective well-being are not the same as those associated with adult subjective well-being.
2. Objective social indicators are much less helpful in explaining why children’s subjective well-being varies than children’s self-reported experiences of life.
These two findings, taken together, have substantial implications for the study of subjective well-being and its use for policy purposes. Subjective well-being is increasingly becoming recognised as a potentially important indicator of how a society is doing, and has been proposed as a compliment to more traditional measures of societal progress such as GDP (Stiglitz et al, 2010). If subjective well-being research is ultimately to influence policy, it is vital that findings are generated which help policy-makers understand the determinants of subjective well-being. Although there have been advances in data on child subjective well-being over the past few years this still lags well behind the wealth of data and findings on adults’ subjective well-being. The two broad conclusions above indicate that it is vital that we understand the distinctive nature of the factors associated with children’s subjective well-being. If we do not, and if findings on adults’ subjective well-being do inform policy, then there is a clear risk that policy measures may not address the needs of children, or even that they could be detrimental to children’s well-being while promoting that of adults.
59
60
The Good Childhood Report 2016 The current state of children’s subjective well-being: overview, variations and trends over time

61
The Good Childhood Report 2016 The current state of children’s subjective well-being: overview, variations and trends over time
Discussion
Chapter 5
61

62
The Good Childhood Report 2016 Discussion
Time trends in subjective well-being
Based on the best data available, the average life satisfaction of children aged 11 to 15 in the UK increased a little between 2000 and 2008. However over the period from 2009 to 2014 there is evidence of a slight decrease (for children aged 10 to 15). There is also evidence of trends in children’s satisfaction with particular aspects of their lives. Children became more satisfied with their friendships between 2000 and 2008 – but this trend has reversed significantly over the 2009 to 2014 period. On the other hand, over the most recent five-year period, children’s average satisfaction with their school work has increased significantly.
In addition, we see a continuation of a trend (noted in previous reports) regarding gender differences in children’s satisfaction with their appearance. Between 2009 and 2014 boys’ satisfaction with this aspect of their lives was stable (slightly increased). Over the same period, girls’ satisfaction with their appearance dropped significantly. This seems to be a long-term trend: in 2000, the gender gap in satisfaction with appearance was 3% (ie 0.3 on a scale from 0 to 10); by 2008, the gap had increased to 5%; and by 2013–14 (the latest figures available) it had increased further to 10%. This finding should be viewed within the context of the international comparisons
we published in last year’s report, which showed that England had the largest gender gap in children’s satisfaction (at the age of 12) with their appearance among a sample of 16 countries. Notably, in countries such as Colombia, Nepal and Ethiopia, there was no difference between boys and girls in this respect. There has also been evidence in recent years of a gender gap in overall life satisfaction: in 2009–10, there was no difference in overall life satisfaction between girls and boys; in 2013–14 there was a 3% gap with mean life satisfaction ratings out of 10 being 7.93 for girls aged 10 to 15 in the UK compared to 8.25 for boys.
These time trends provide important insights into the quality of life of children in the UK and confirm the value of monitoring children’s subjective well-being over time. There is a particular need to understand more about the reasons for the consistent ongoing trend in the UK of girls’ decreasing satisfaction with their appearance.
Flourishing
The main focus of this report is on children’s cognitive subjective well-being – that is their satisfaction with their lives as a whole and with specific aspects of their lives. However an ongoing aim of the research programme has also been to develop measures of children’s psychological well-being. This is a concept that refers to a sense of
personal growth and development. It is important to clarify that this is a measure of positive functioning and is not simply the opposite of a measure of mental ill-health. In Chapter 1 we reported on the development and validation of a new set of questions about this concept. We combine measures of children’s life satisfaction and psychological well-being to create an overall measure of ‘flourishing’ – meaning high life satisfaction and high psychological well-being. We estimate that over four-fifths of children aged 12 in England can be viewed as ‘flourishing’, while around 1 in 10 are ‘languishing’ – having low life satisfaction and low psychological well-being – and the remainder lie somewhere in between these two categories.
Now that we have a good measure of psychological well-being, as well as life satisfaction, a future direction for research is to explore the extent to which these two aspects of well-being are related to other issues in children’s lives. As an example, in this report we show that children’s recent experiences of being bullied are more strongly linked with their life satisfaction than with their psychological well-being. This indicates that there is some value in distinguishing between these different aspects of children’s overall sense of subjective and psychological well-being, and points to a potentially fruitful direction for future research.
Chapter 5

63
The Good Childhood Report 2016Discussion
Subjective well-being and mental ill-health
In Chapter 2 we summarised some new analysis exploring the relationship between children’s subjective well-being and mental ill-health. We have shown in previous reports (and it has been confirmed by other research with adults) that these are distinct concepts and that it is quite possible to have high subjective well-being while having mental health issues, or to have low subjective well-being without meeting the criteria for mental ill-health.
We show that there are different patterns for subjective well-being and mental ill-health by age and gender. For mental ill-health, there is an increase in emotional problems for girls, and a growing gender gap, between the ages of 10 and 15. Over the same age range there is a closing of the gender gap for conduct problems and hyperactivity/inattention (which are higher in boys than girls at the age of 10). These contrasting trends balance each other out so that there is relatively little age or gender difference in children’s ‘total difficulties’ (a measure of overall mental ill-health). Meanwhile, for subjective well-being there are decreasing scores between the ages of 10 and 15 for satisfaction with family, appearance, school and life as a whole. There is also an increasing gender gap in satisfaction with appearance between the ages of 10 and 15 (as
highlighted in previous reports and above). These differing age and gender patterns for measures of mental ill-health and subjective well-being support the idea of these being two different views on children’s overall well-being.
The analysis also explores the relationships between different components of mental ill-health and subjective well-being in more detail. For example, satisfaction with appearance is most strongly related with the emotional problems component of the mental ill-health measure; satisfaction with school work is more closely linked with conduct problems and hyperactivity/inattention. Of the different aspects of subjective well-being, satisfaction with school work was the most strongly related with the overall ‘total difficulties’ measure of mental ill-health, and satisfaction with family was the least strongly related. These findings highlight the complexity of the relationship between subjective well-being and mental ill-health.
Finally on this topic, we explore the relationship between subjective well-being and mental ill-health over time. We present new analysis that shows changes in subjective well-being over a two-year period are associated with different levels of children’s mental health issues at the end of that period, even after taking into account the level of mental health issues at the start of the period. For example, looking only at children who do not reach
the threshold for mental health issues at the start of the two-year period, more than 1 in 4 (26.5%) children who experienced a change from ‘high’ to ‘low’ life satisfaction over the two years exceeded the threshold for mental health issues at the end of the period, compared to less than 1 in 25 (3.7%) children whose life satisfaction remained ‘high’. A practical outcome of this finding is that monitoring children’s subjective well-being may be a way of identifying those at risk of mental ill-health, in addition to potentially identifying a range of other issues in children’s lives which we have highlighted in previous reports.
Our analysis is limited by the available measures of subjective well-being in the data set we used, and the long time-gap between the two waves of data. There is a need for survey research that includes better measures of subjective well-being, alongside validated mental ill-health measures, over shorter time periods in order to understand more about the connections between changes in the two aspects.
Children’s views of their local area
There is relatively little research on how the area in which children live affects their perceived quality of life. In Chapter 3 we present some analysis that addresses this gap.
We have been able to combine data on children’s subjective well-being from our ongoing household survey

64
The Good Childhood Report 2016 Discussion
with objective data about children’s locality from a range of official data sources. In particular we focus on the links between measures of local area deprivation and children’s subjective well-being. We find little evidence that children living in areas categorised as having higher levels of deprivation had lower subjective well-being, although it does appear that children’s parents had somewhat lower life satisfaction in these types of areas. We find a similar pattern in some analysis of data from the Millennium Cohort Survey (children aged 11). This is not a definitive finding, as other factors may be masking the relationship between local area deprivation and child subjective well-being, but suggests an important area for future research.
On the other hand we were also able to relate children’s own evaluations of their local area with their subjective well-being – and here we found significant links. Children who rated their local area more highly in terms of facilities, safety and freedom and their experiences of local adults had significantly higher subjective well-being. Additionally, where children identified more problems in their local area – such as noise, alcohol and drug use, graffiti and rubbish – they tended to have lower subjective well-being. Interestingly we also found that children’s evaluations of all these different aspects of their local area were also associated with their parents’ life
satisfaction. This gives us some confidence in the value of asking children about these types of issues.
We have now developed tried-and-tested measures of children’s evaluations of their local areas and shown that they are significantly linked with their life satisfaction. These measures may be valuable for local areas who wish to monitor and improve the quality of life for children (and also their parents).
A broader review of the factors associated with child subjective well-being
The findings on local area discussed above reflect an evolving, consistent picture of the types of factors that explain variations in children’s subjective well-being. For the local area we found that children’s own evaluations and experiences of their locality were much more closely linked with their subjective well-being than traditional ‘objective’ social indicators were.
In previous reports we have discussed the same patterns across a number of dimensions of children’s lives, and we summarise some of these previous findings in Chapter 4. Children’s reports of the quality of family relationships explain much more of the variation in their subjective well-being than categorisations of their family structure (eg lone parent, etc). Children’s reports on experienced
material deprivation (based on a child-centred measure that we developed in collaboration with the University of York) explain much more about their subjective well-being than traditional measures such as household income do. Household income has a stronger link with adults’ subjective well-being than child subjective well-being. And in international analysis, measures of national wealth appear to explain very little of the variation in child subjective well-being, while explaining quite a lot of the variation in adult subjective well-being. In fact, at an international level we have so far found no statistical evidence of a link between children’s and adults’ subjective well-being. For example, Sweden ranks relatively highly among European countries for adult life satisfaction while being in the lower half of the rankings for child life satisfaction. Meanwhile, Romania ranks highly for child life satisfaction (see also last year’s report) while being in the lower half of the rankings for adult life satisfaction.
This consistent set of findings points to two conclusions that have practical implications for all those concerned with children’s quality of life. First, it is clear that we cannot assume that the factors which affect adults’ subjective well-being also affect children’s subjective well-being in the same way. Second, if we want to understand variations in children’s subjective well-being it is essential to also

65
The Good Childhood Report 2016Discussion
gather information directly from them about their lives, rather than rely on traditional socio-economic variables such as family structure, household income, local area deprivation indexes or GDP per capita.
Among policymakers there is a growing interest in the potential for measures of population subjective well-being to provide important information that can guide their decision-making and priorities. Although this is still a relatively new field of research, there are now some valuable policy-relevant findings being generated about adult subjective well-being. For example, there is evidence of the long-term negative impact of experiencing a redundancy (Clark et al, 2007), which might inform employment and economic policies. There is also evidence of lower adult subjective well-being due to daytime aircraft noise near the flight paths of major airports (Lawton and Fujiwara, 2016), which might inform future policy decisions on planning and transport. At the moment there is still a relative shortage of data on child subjective well-being. Now that we know the factors that affect child and adult subjective well-being are not the same, it is vital that we close this data gap. Closing this gap will allow information on children’s experiences and subjective well-being to be considered alongside information on adults’ subjective well-being by national and local
decision-makers and policymakers. If we do not achieve this there is a real risk that local and national policy developments will reflect the concerns and needs of adults, but not of children.

References
Beardsmore R and Siegler V (2014) Measuring National Well-being – Exploring the Well-being of Children in the UK. Office for National Statistics.Bradshaw J and Keung A (2011) Trends in child subjective well-being in the UK, Journal of Children’s Services, 6, 1, 4-17.Bradshaw, J. and Rees, G. (2015) Child well-being in the macro context. 5th Conference of the International Society for Child Indicators, University of Cape Town, Cape Town, South Africa, 3 September 2015Casas (2016) Analysing the Comparability of 3 Multi-Item Subjective Well-Being Psychometric Scales Among 15 Countries Using Samples of 10 and 12-Year-Olds. Child Indicators Research. http://doi.org/10.1007/s12187-015-9360-0Clark, A. E., Diener, E., Georgellis, Y., and Lucas, R. E. (2007). Lags and Leads in Life Satisfaction: A Test of the Baseline Hypothesis. CEP Discussion Paper No 836. London: Centre for Economic Performance, LSE.Deci, E L, and Ryan, R M (2000). The “what” and “why” of goal pursuits: Human needs and the self-determination of behavior. Psychological Inquiry, 11, 227-268.Department for Communities and Local Government (2015) The English Indices of Deprivation 2015: Research report, LondonGoodman R, Meltzer H, Bailey V (1998) The Strengths and Difficulties Questionnaire: A pilot study on the validity of the self-report version. European Child and Adolescent Psychiatry, 7, 125- 130Helliwell J, Layard R, and Sachs J (eds.) 2015, World Happiness Report. The Earth Institute, Columbia University.Inchley, J et al. (2016). Growing up unequal: gender and socioeconomic differences in young people’s health and well-being. World Health Organization Regional Office for Europe Copenhagen, Denmark.Keyes C L M (2006) Mental health in adolescence: Is America’s youth flourishing? American Journal of Orthopsychiatry, 76(3), 395–402. doi:10.1037/0002-9432.76.3.395Keyes, C L M, Dhingra S S and Simoes E J (2010) Change in level of positive mental health as a predictor of future risk of mental illness. American Journal of Public Health, 100(12), 2366–2371. Lawton, R. and Fujiwara, D. (2016). Living with aircraft noise: Airport proximity, aviation noise and subjective well-being in England. Transportation Research Part D: Transport and Environment, 42: 104–118. DOI: 10.1016/j.trd. 2015.11.002Levin, K. et al. (2011) National income and income inequality, family affluence and life satisfaction among 13 year old boys and girls: A multilevel study in 35 countries. Social Indicators Research, 104: 179-194.Main, G. and Pople, L. (2011) Missing out: A child-centred analysis of material deprivation and subjective well-being. London: The Children’s Society.Rees G. (2016) Gender inequalities in children’s lives and subjective well-being: An international comparison. APPAM International Conference – Inequalities: Addressing the Growing Challenge for Policymakers Worldwide, London, 14th June 2016.Rees, G and Bradshaw, J (2015) Explaining variation in children’s subjective well-being using Wave 5 of the Millennium Cohort Study. Centre for Longitudinal Studies Cohort Studies Research Conference 2015, Institute of Education, London, 16 March 2015.Rees G and Main G (eds) (2015) Children’s views on their lives and well-being in 15 countries: An initial report on the Children’s Worlds survey, 2013-14. York, UK: Children’s Worlds Project (ISCWeB)Rees G, Bradshaw J, Goswami H and Keung A (2010a) Understanding Children’s Well-being: A national survey of young people’s well-being. London: The Children’s SocietyRees G, Goswami H and Bradshaw J (2010b) Developing an Index of Children’s Subjective Well-Being in England. London: The Children’s SocietyRees G, Pople L and Goswami H (2011) Links between family economic factors and children’s subjective well-being: Initial findings from Wave 2 and Wave 3 quarterly surveys. London: The Children’s SocietyRyff, C. D. (1989). Happiness is everything, or is it? Explorations on the meaning of psychological well-being. Journal of Personality and Social Psychology, 57(6), 1069.Stiglitz J E, Sen, A and Fitoussi J P (2010). Report by the Commission on the Measurement of Economic Performance and Social Progress. OECD.The Children’s Society (2006) Good Childhood? A Question for Our Times. London: The Children’s SocietyThe Children’s Society (2008) Happy and they know it - Developing a well-being framework based on young people consultation. London: The Children’s Society.The Children’s Society (2009). The Good Childhood Inquiry: What children told us. London: The Children’s Society.The Children’s Society (2012) The Good Childhood Report 2012. London: The Children’s Society.The Children’s Society (2013a) The Good Childhood Report 2013. London: The Children’s Society.The Children’s Society (2013b) Isle of Wight survey of children and young people, 2012. London: The Children’s Society.The Children’s Society (2014a) The Good Childhood Report 2014. London: The Children’s Society.The Children’s Society (2014b) Portsmouth survey of children and young people 2014, London: The Children’s Society. The Children’s Society (2015) The Good Childhood Report 2015. London: The Children’s Society.UNICEF (2007) Child poverty in perspective: An overview of child well-being in rich countries, Innocenti Report Card 7. UNICEF: FlorenceUNICEF Office of Research (2013) Child Well-Being in Rich Countries: A Comparative Overview (Innocenti Report Card 11). Florence: UNICEF Office of Research
66

67
The Good Childhood Report 2016 The current state of children’s subjective well-being: overview, variations and trends over time

It is a painful fact that many children and young people in Britain today are still suffering extreme hardship, abuse and neglect. Too often
their problems are ignored and their voices unheard. Now it is time to listen and to act.
The Children’s Society is a national charity that runs local services,
helping children and young people when they are at their most vulnerable, and have nowhere left to turn.
We also campaign for changes to laws affecting children and young people, to stop the mistakes of the past being repeated in the future.
Our supporters around the country fund our services and join our campaigns to show children and young people they are on their side.
childrenssociety.org.uk@ChildSocPol© The Children’s Society 2016. The copyright of all material appearing in this publication belongs to The Children’s Society. It may not be reproduced, duplicated or copied by any means without our prior written consent. All images posed by models. Images on pages 1, 2, 22, 35, 50, 60 & 67 © Laura McCluskey. Images on pages 4,6 & 36 © Zoe Childerley
Charity Registration No. 221124
For more information on this report, please contact:
Larissa Pople The Children’s Society e: [email protected] t: 020 7841 4645
PCR090/0816