Embed Size (px)
Citation preview
1
The Good Childhood 2015 The subjective well-being of children in the UK
The Good Childhood Report 2015
2
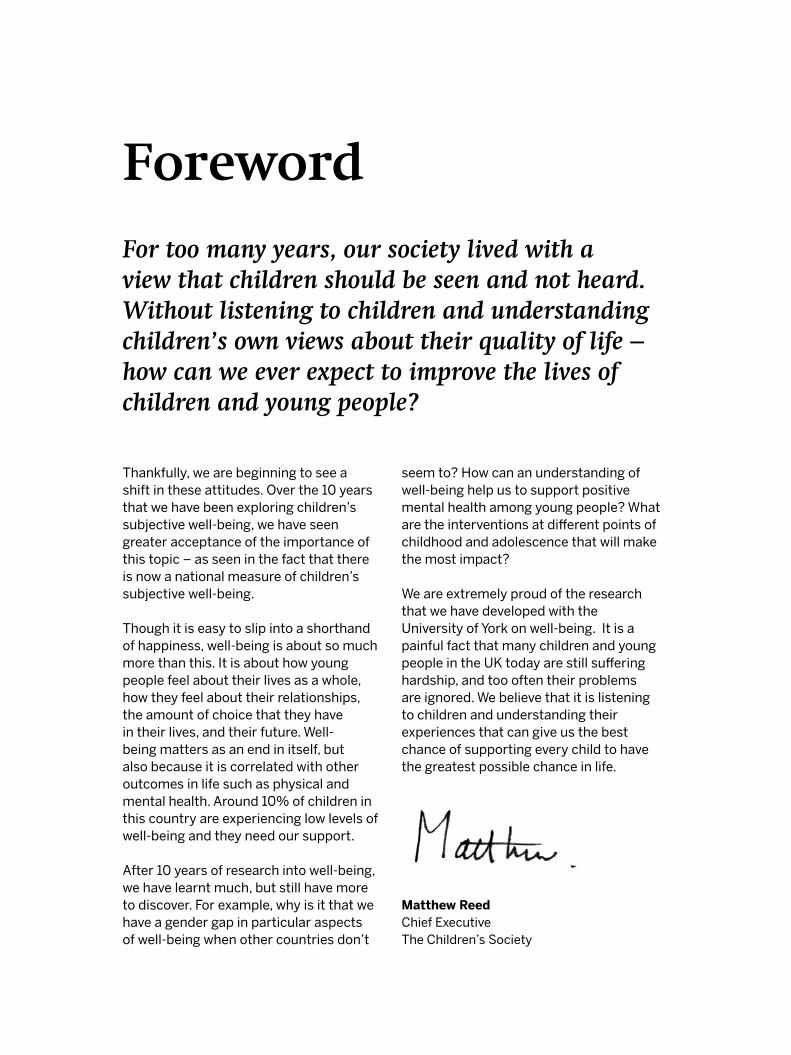
Thankfully, we are beginning to see a shift in these attitudes. Over the 10 years that we have been exploring children’s subjective well-being, we have seen greater acceptance of the importance of this topic – as seen in the fact that there is now a national measure of children’s subjective well-being.
Though it is easy to slip into a shorthand of happiness, well-being is about so much more than this. It is about how young people feel about their lives as a whole, how they feel about their relationships, the amount of choice that they have in their lives, and their future. Well-being matters as an end in itself, but also because it is correlated with other outcomes in life such as physical and mental health. Around 10% of children in this country are experiencing low levels of well-being and they need our support.
After 10 years of research into well-being, we have learnt much, but still have more to discover. For example, why is it that we have a gender gap in particular aspects of well-being when other countries don’t
seem to? How can an understanding of well-being help us to support positive mental health among young people? What are the interventions at different points of childhood and adolescence that will make the most impact?
We are extremely proud of the research that we have developed with the University of York on well-being. It is a painful fact that many children and young people in the UK today are still suffering hardship, and too often their problems are ignored. We believe that it is listening to children and understanding their experiences that can give us the best chance of supporting every child to have the greatest possible chance in life.
ForewordFor too many years, our society lived with a view that children should be seen and not heard. Without listening to children and understanding children’s own views about their quality of life – how can we ever expect to improve the lives of children and young people?
Matthew Reed Chief Executive The Children’s Society
4
The Good Childhood 2015 The subjective well-being of children in the UK
Contents
Chapter 1_________________________ A decade of research into the subjective well-being of children
Chapter 2_________________________Comparing children’s subjective well-being in England and other countries
Chapter 3_________________________ Discussion
References_________________________
This report is the product of an ongoing collaboration between The Children’s Society and the University of York. The report summarises work conducted by the joint research team of Larissa Pople, The Children’s Society and Gwyther Rees, Gill Main and Jonathan Bradshaw, University of York.
7
31
59
66
6
The Good Childhood 2015 The subjective well-being of children in the UK
7
The Good Childhood 2015 The subjective well-being of children in the UK
Chapter 1: A decade of research into the subjective well-being of children
8
The Good Childhood 2015 The subjective well-being of children in the UK
This is the fourth annual Good Childhood Report. It is based on The Children’s Society’s ongoing research on children’s subjective well-being, undertaken in collaboration with the University of York, which is the most extensive programme of national research on children’s subjective well-being globally. The purpose of this series of reports is to provide the best available up-to-date information about the perspectives of children in the UK on their lives and well-being.
Introduction
1 eg the UNDP’s Human Development Index, and UNICEF’s State of the World’s Children and report card series on children’s well-being2 UNICEF (2007) and UNICEF Office of Research (2013). See also Bradshaw et al (2007)3 For adults, eg see The World Happiness Report 2015 and children eg see The Good Childhood Report 2013
This edition of the report also marks the 10th anniversary of the research programme. It:
▪ reviews the progress that has been made in understanding children’s subjective well-being in the UK through the programme over the last decade
▪ summarises the latest national statistics and trends
▪ presents important new findings that compare the lives and well-being of children in England with those of 14 other countries.
What is well-being?
Although the term ‘well-being’ is used in varying contexts to mean rather different things, there is a broad consensus that it refers to the quality of people’s lives. There are two principal ways of measuring well-being – objectively, based on indicators about people’s lives, and subjectively, using people’s own assessments of their lives. Objective measures of well-being, and indexes of well-being that are composed mainly of objective measures,
abound.1 There is much less information on people’s subjective well-being and, in the past, approaches to measuring subjective well-being in different contexts have been less consistent and, thus, less comparable, although this has changed in recent years.
Research into children’s well-being has lagged behind that of adults, but the last decade has seen a number of key developments, including the publication of a series of UNICEF ‘report cards’ comparing children’s well-being internationally.2 The first of these to include subjective well-being measures was published in 2007. The figures were then updated in 2013, and both reports drew substantial media coverage in the UK because they showed that children in the UK were not faring as well as children in comparable countries.
In 2011, the Office for National Statistics (ONS) launched its Measuring National Well-being Programme with the aim of generating a set of objective and subjective measures that could
monitor the well-being of the nation. The ONS Measuring National Well-being Programme includes measures of children’s well-being, and these draw heavily on the Understanding Society survey and The Children’s Society’s own data (see later sections).
What is subjective well-being?
Subjective well-being is about people’s own assessments of how their lives are going. It consists of two key elements. The first – life satisfaction – relates to the evaluations that people make about their lives at a cognitive level, and comprises ‘global’ judgements about life as a whole as well as judgements about different aspects of life or ‘domains’ (eg happiness with family relationships). The second element relates to the experience of positive and negative emotions – or ‘affect’ – at a particular point in time. As would be expected, measures of life satisfaction have been shown to be relatively stable, while measures of emotions vary more from day- to-day.3
9
The Good Childhood 2015 The subjective well-being of children in the UK
4 The Good Childhood Report 20135 Stiglitz et al (2009)
The ONS core measures of subjective well-being consist of questions relating to all of these concepts: a question on overall life satisfaction, questions about ‘affect’, and a ‘eudaimonic’ question about whether life feels worthwhile. The Children’s Society provides the data for children aged 10 to 15 for these questions.
The Children’s Society has been exploring children’s subjective well-being for the past decade in partnership with the University of York. Over the course of those 10 years, subjective well-being research has changed beyond recognition, attracting growing interest from many quarters, including at the national and international level.
The idea that people’s feelings about their quality of life are fundamentally important to society is not new, but many people have questioned whether these feelings could be measured. There is now a substantial body of evidence to show that they can be. In a review of subjective well-being research in 2009, the influential Commission on the Measurement of Economic Performance and Social Progress,5 led by three economists – Stiglitz, Sen and Fittoussi – concluded that ‘it is possible to collect meaningful and reliable data on subjective well-being’, and to use this data to inform policy making.
Observing that many OECD countries collect subjective well-being data in at least one of their
major social surveys – and in an attempt to bring consistency to these measures – the OECD subsequently produced Guidelines on Measuring Subjective Well-being for national statistics offices. In a related development, and in support of a United Nations High Level Meeting on Happiness and Well-being, The World Happiness Report was first published in 2012, reporting on the subjective well-being of people the world over. This publication is now in its third edition and has an estimated readership of 1.5 million. People’s subjective well-being has become a topic of widespread – and growing – interest. However, discussion of children’s subjective well-being has been notable by its absence.
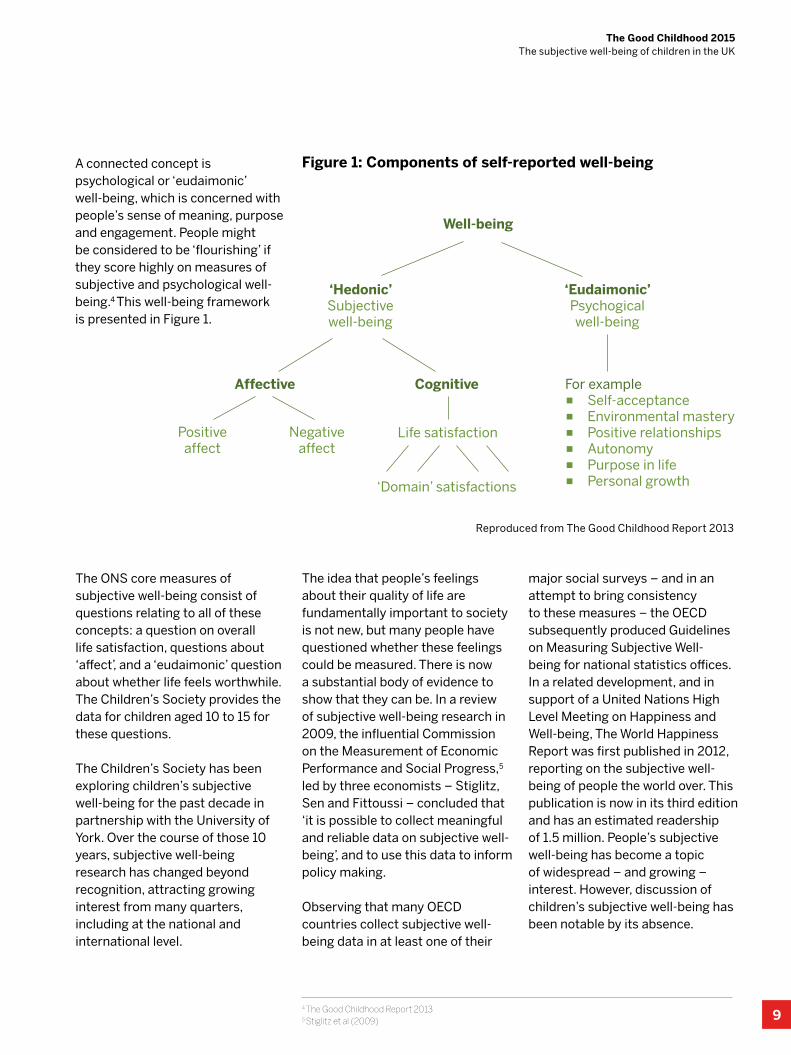
Figure 1: Components of self-reported well-being
Reproduced from The Good Childhood Report 2013
Well-being
‘Hedonic’Subjective well-being
Life satisfactionPositive affect
Negative affect
‘Domain’ satisfactions
Affective Cognitive
‘Eudaimonic’Psychogical well-being
For example
▪ Self-acceptance
▪ Environmental mastery
▪ Positive relationships
▪ Autonomy
▪ Purpose in life
▪ Personal growth
A connected concept is psychological or ‘eudaimonic’ well-being, which is concerned with people’s sense of meaning, purpose and engagement. People might be considered to be ‘flourishing’ if they score highly on measures of subjective and psychological well-being.4 This well-being framework is presented in Figure 1.
10
The Good Childhood 2015 The subjective well-being of children in the UK
In the UK, the British Household Panel Survey started asking children aged 11 to 15 a small number of questions about their subjective well-being in 1994 onwards6 and, more recently, other surveys such as the Understanding Society survey and the Millennium Cohort Study have asked children the same set of same questions. The data from these large-scale social surveys are an invaluable source of information on children’s subjective well-being. However, they are limited in scope. The Children’s Society’s research programme – the most extensive programme of research into children’s subjective well-being globally – has been able to add important insights to our understanding of children’s well-being (which are summarised in later sections of this report). Indeed, The Children’s Society is the only non-governmental source of data to be included in the ONS wheel of measures of children’s well-being.7
So why does children’s subjective well-being matter? At the most fundamental level, it hardly needs arguing that children’s quality of life is a major concern for society, and a very important way of finding out whether children are experiencing a good quality of life is to ask them. Sometimes this will relate to informal, everyday conversations with children. When parents, teachers, practitioners and others ask children what is important in their lives, what aspects of their life are going well and if there is anything that they would change – they are asking about subjective well-being.
However, there is also value in asking these questions systematically through surveys that are representative of local or national populations. Surveys of children’s subjective well-being make it possible to ask large numbers of children about the
aspects of their lives that we know matter to them most. They allow us to identify the issues that are important at the individual, group or population level, and to find explanations for differences in well-being between individuals or groups of children. They can also form the basis of comparisons between children in different countries or children in the same country at different points in time, which can give us important insights into aspects of well-being that might be amenable to change. Quantitative approaches are only one aspect of research into children’s well-being but they are invaluable at the population level and when decisions about policy and spending are being made. They also provide a counterweight to measures that have tended to dominate discussions of children’s lives, such as educational attainment, which is important but only part of the picture. As argued in the World Happiness Report 2015:8
20052007
20082009
2010
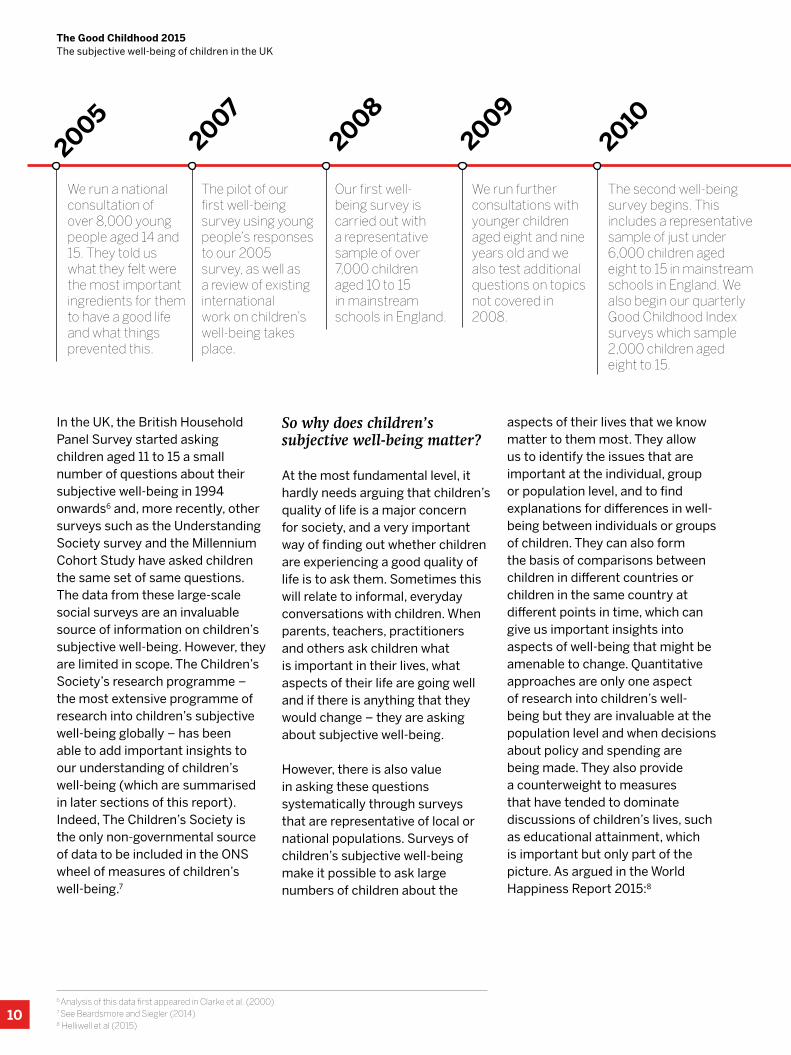
We run a national consultation of over 8,000 young people aged 14 and 15. They told us what they felt were the most important ingredients for them to have a good life and what things prevented this.
The pilot of our first well-being survey using young people’s responses to our 2005 survey, as well as a review of existing international work on children’s well-being takes place.
Our first well-being survey is carried out with a representative sample of over 7,000 children aged 10 to 15 in mainstream schools in England.
We run further consultations with younger children aged eight and nine years old and we also test additional questions on topics not covered in 2008.
The second well-being survey begins. This includes a representative sample of just under 6,000 children aged eight to 15 in mainstream schools in England. We also begin our quarterly Good Childhood Index surveys which sample 2,000 children aged eight to 15.
6 Analysis of this data first appeared in Clarke et al. (2000) 7 See Beardsmore and Siegler (2014) 8 Helliwell et al (2015)
11
The Good Childhood 2015 The subjective well-being of children in the UK
There are many practical applications to carrying out well-being research with children. For example, The Children’s Society has been working with local authorities to explore children’s well-being at a local level and this has yielded valuable, and sometimes unexpected, insights into the issues that children in a particular area, or school, may be facing.9 This knowledge enriches what is already known about a local population and can guide priorities and planning. There are also practical
applications at the national level. As understanding of and confidence in subjective well-being measures grows, national and local governments are increasingly making use of research into the well-being of their populations to guide policy development and service provision. In the UK, this has led to the establishment of an independent ‘What Works Centre for Well-being’ to explore policies that promote people’s well-being.
But well-being research is of use beyond local and national governments. Our research programme has generated a whole host of insights into the drivers of children’s well-being that are of great interest to parents, professionals and children themselves. The seriousness with which we need to take the issue of bullying, to give one example, or the fact that the quality of family relationships are several times more important for well-being than family structure to give another. We have also explored ‘ways to well-being’
– activities that children can do themselves that are linked to greater well-being – which confirm the importance of spending time with friends and family and of physical activity, while also helping to quell some of our fears about children’s use of technology.
The programme
In 2005, The Children’s Society initiated a programme of research into children’s well-being to address the fact that the debate about children’s well-being in the UK and internationally was not adequately representing children’s views and experiences. Children’s well-being was being discussed primarily in relation to adult concerns, which focused on negative behaviours (eg drinking and drug use) and on their future well-being – or ‘well-becoming’ – as productive members of society (eg educational attainment). The decision to begin the research programme was made with the hope of bringing some balance to the tone of this debate.
20112012
2013–14
2015
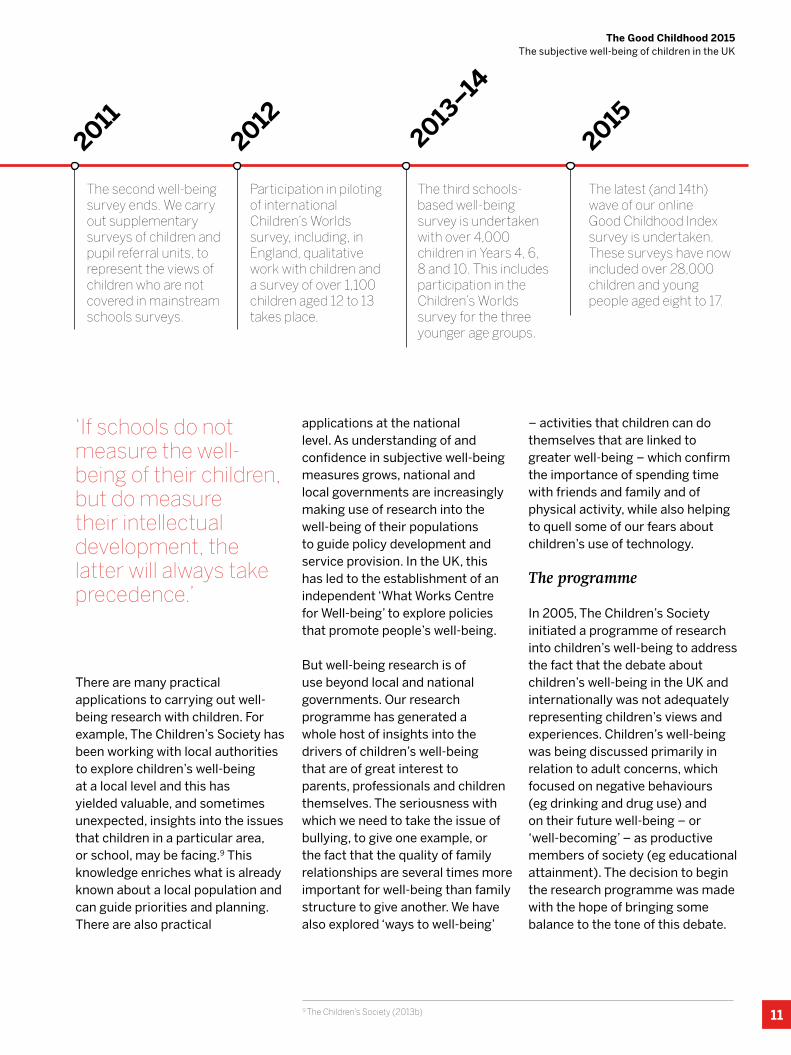
The second well-being survey ends. We carry out supplementary surveys of children and pupil referral units, to represent the views of children who are not covered in mainstream schools surveys.
Participation in piloting of international Children’s Worlds survey, including, in England, qualitative work with children and a survey of over 1,100 children aged 12 to 13 takes place.
The third schools-based well-being survey is undertaken with over 4,000 children in Years 4, 6, 8 and 10. This includes participation in the Children’s Worlds survey for the three younger age groups.
The latest (and 14th) wave of our online Good Childhood Index survey is undertaken. These surveys have now included over 28,000 children and young people aged eight to 17.
‘If schools do not measure the well-being of their children, but do measure their intellectual development, the latter will always take precedence.’
9 The Children’s Society (2013b)
12
The Good Childhood 2015 The subjective well-being of children in the UK
That is:
▪ to understand children’s perspectives and priorities as well as adults’
▪ to focus on children’s well-being as children as well as on their well-becoming
▪ to consider positive aspects of children’s lives rather than just negative behaviours.
We therefore began our research programme10 in 2005 by asking children for their views about well-being (see next section for further details). Following this initial work, in 2007 we formed a partnership with Professor Jonathan Bradshaw11 at University of York to develop a survey of children’s subjective well-being in England. The first wave of this (school) survey – which used the findings from our 2005 survey as an organising framework – was undertaken in 2008 and we published our findings in January 2010 in a report, Understanding Children’s Well-being. Since that time we have continued to undertake national schools-based surveys, have initiated a regular online survey of children and their parents, have undertaken well-being surveys and consultations in several different local authorities, and have been part of the first cross-national survey of children’s subjective well-being and daily lives – Children’s Worlds (see Chapter 2). In total, around 60,000 children in the UK have participated in the research programme. A summary of key activities is provided in the timeline on pages 10 and 11.
Through the above activities, the programme has systematically addressed a series of critical and under-explored questions in relation to children’s subjective well-being:1. What does subjective well-
being mean from children’s perspectives?
2. Can we measure children’s subjective well-being and, if so, how?
And based on the answers to the above questions from the initial stages of the programme:3. What are the levels of children’s
subjective well-being in England (overall and within different sub-groups)?
4. Are there trends in children’s subjective well-being in England over time?
5. Why does children’s subjective well-being vary and how might it be improved?
In the remainder of this chapter we will briefly summarise findings on these key questions from the research programme as a whole, providing updated statistics from recent surveys.
What does subjective well-being mean from children’s perspectives?
As discussed earlier we started the research programme in 2005 by gathering the perspectives of over 8,000 children aged 14 and 15 on the ingredients and barriers to children having a good life through asking two open-ended
questions at the end of a survey questionnaire. We subsequently extended the scope of our qualitative research to cover a much wider age range and to include specific minority groups of children; and we have continued to consult with children throughout the last decade of research.
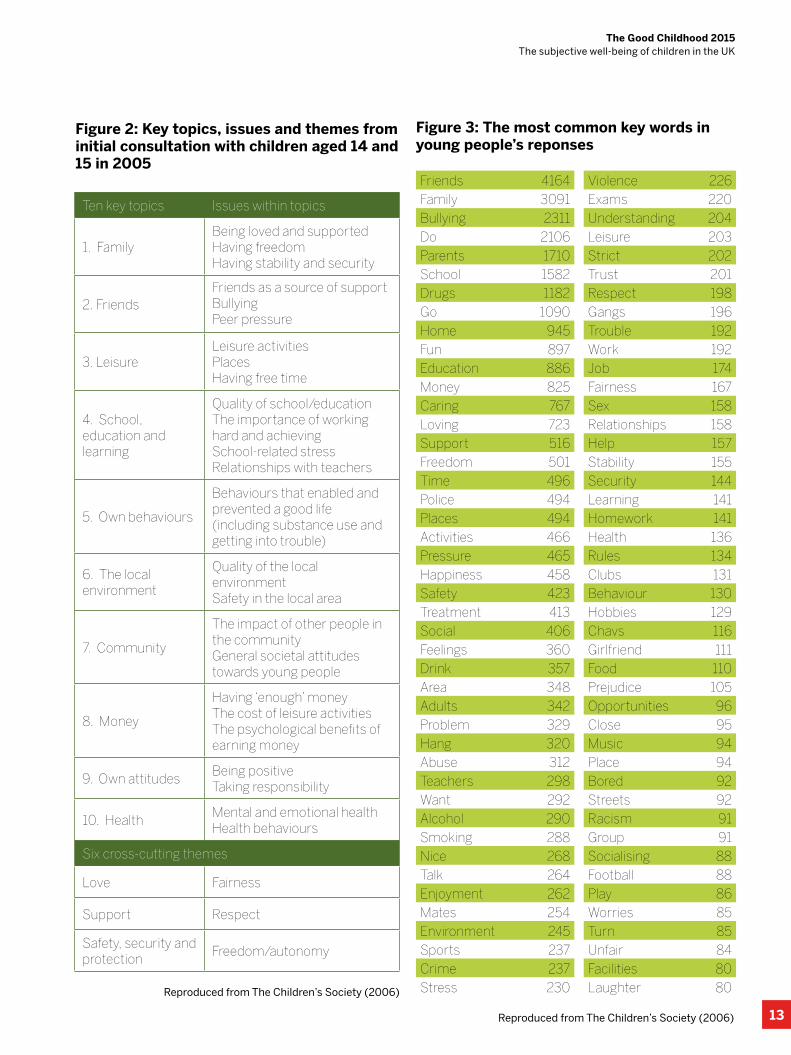
The initial consultation exercise with 14 to 15 year olds identified 10 key topics and six cross-cutting themes12 which are reproduced in Figure 2. These topics and themes were reflected in an analysis of the most commonly occurring words in children’s responses, which included ‘friends’, ‘family’, ‘bullying’, ‘parents’, ‘school’, ‘drugs’, ‘home’, ‘fun’, ‘education’ and ‘money’.Our subsequent consultation with a wider range of children13 confirmed the importance of the above issues and also identified additional themes. For example younger children additionally highlighted:
▪ relationships with siblings and extended family, and the importance of pets
▪ spending time and doing things with family
▪ aspects of play including toys and spending time outdoors.
10In 2005 we also worked jointly with University of Wales, Bangor on a report on the spiritual health and well-being of urban young people (Rees, Francis & Robbins, 2005) for The Commission on Urban Life and Faith11 One of the lead authors of the UNICEF report cards mentioned above. He and colleagues at the University of York had begun to publish a series of books on child well-being beginning with Bradshaw, J. (eds.) (2001) Poverty: The Outcomes For Children, Family Policy Studies Centre: London 12 Published in ‘Good Childhood: A question for our times?’ (the launch report for The Good Childhood Inquiry) in 200613 See ‘Happy and they know it? Developing a well-being framework based on children and young people consultation’
13
The Good Childhood 2015 The subjective well-being of children in the UK
Ten key topics Issues within topics
1. FamilyBeing loved and supportedHaving freedomHaving stability and security
2. FriendsFriends as a source of supportBullyingPeer pressure
3. LeisureLeisure activitiesPlacesHaving free time
4. School, education and learning
Quality of school/educationThe importance of working hard and achievingSchool-related stressRelationships with teachers
5. Own behaviours
Behaviours that enabled and prevented a good life (including substance use and getting into trouble)
6. The local environment
Quality of the local environmentSafety in the local area
7. Community
The impact of other people in the communityGeneral societal attitudes towards young people
8. Money
Having ‘enough’ moneyThe cost of leisure activitiesThe psychological benefits of earning money
9. Own attitudesBeing positiveTaking responsibility
10. HealthMental and emotional healthHealth behaviours
Six cross-cutting themes
Love Fairness
Support Respect
Safety, security and protection
Freedom/autonomy
Figure 2: Key topics, issues and themes from initial consultation with children aged 14 and 15 in 2005
Figure 3: The most common key words in young people’s reponses
Friends 4164Family 3091Bullying 2311Do 2106Parents 1710School 1582Drugs 1182Go 1090Home 945Fun 897Education 886Money 825Caring 767Loving 723Support 516Freedom 501Time 496Police 494Places 494Activities 466Pressure 465Happiness 458Safety 423Treatment 413Social 406Feelings 360Drink 357Area 348Adults 342Problem 329Hang 320Abuse 312Teachers 298Want 292Alcohol 290Smoking 288Nice 268Talk 264Enjoyment 262Mates 254Environment 245Sports 237Crime 237Stress 230
Violence 226Exams 220Understanding 204Leisure 203Strict 202Trust 201Respect 198Gangs 196Trouble 192Work 192Job 174Fairness 167Sex 158Relationships 158Help 157Stability 155Security 144Learning 141Homework 141Health 136Rules 134Clubs 131Behaviour 130Hobbies 129Chavs 116Girlfriend 111Food 110Prejudice 105Opportunities 96Close 95Music 94Place 94Bored 92Streets 92Racism 91Group 91Socialising 88Football 88Play 86Worries 85Turn 85Unfair 84Facilities 80Laughter 80Reproduced from The Children’s Society (2006)
Reproduced from The Children’s Society (2006)
14
The Good Childhood 2015 The subjective well-being of children in the UK
We also recognised that the material we had gathered could fit into a framework based on three related components – self, relationships and environments. For example, children’s experience of school encompasses all three of these components – school is a place where they learn and develop, where they relate to friends, peers and teachers and also a physical environment.
RelationshipsRelationships are at the heart of children’s well-being. When children talk about what is important in their lives, they highlight their need for love, support, respect, fairness, freedom and safety – concepts that are central to what it means to be human, social beings. Children list these qualities primarily in relation to family and friends, but they value them in all of their relationships, in their homes, schools, communities and beyond.
The words that they use caution against prioritising form over substance. Family and friends are fundamental, but more important than a particular family structure or a specific number of friends are relationships that are good quality – eg that are loving, supportive, respectful, and strike a balance between safety and freedom.
Children’s priorities are refreshing because they challenge often polarised narratives that focus, on the one hand, on the need to protect children – eg from
predatory adults or excessive materialism – and, on the other hand, on the need to be protected from children – eg from ‘yobs’ or ‘feral’ children. In children’s own accounts, safety is an essential component of well-being but so too is having the opportunity to make decisions for themselves and have a reasonable level of freedom. In short, children are more balanced and nuanced than many adults give them credit for, and sometimes more so than adults themselves.
Another key aspect of relationships, and the most common response to our question about what prevents a good life, is bullying. Our research programme has shown that children’s experiences of bullying are significant for well-being, and should always be taken seriously.
The centrality of relationships emerges from discussions with adults too, and is fundamental to the way that subjective well-being is conceptualised. Nonetheless, children do not necessarily describe the ‘ingredients’ of good relationships in the same way as adults, and the words that children use do not always sit comfortably with the terminology of public policy. This does not mean that they have no messages for policy and practice, rather that we may have to think differently about these and consider for example, what types of policies promote love, fairness, support and respect.
Self When asked what is most important in their lives, children are remarkably self-analytical, as can be seen from Figure 2. A key theme for children in our 2005 survey was their mental and physical health, especially the former, and the ways in which stress, worry and anxiety could have a negative impact on their well-being. In this survey, children also acknowledged that their own attitudes and behaviour could affect their well-being, and emphasised that they need to take responsibility for their own quality of life.
These themes relate to children’s feelings about their appearance and confidence, topics that we have found in our research programme to be of great significance to children in the UK, especially secondary school age girls, whose happiness with these aspects of life are markedly lower than their peers in other countries (see later sections in Chapter 2).
In a more practical sense, children also talk about time use – how they spend their free time, and the importance of spending time with friends and family, and doing activities that they enjoy – and we know from our research programme that these aspects of life have important links to well-being.14 Children also acknowledge the value of both formal and informal learning activities and the sense of achievement that can be felt when they master new skills.15
14 See Rees et al (2010b) and Abdallah et al (2014)15 See The Children’s Society (2006) and Abdallah et al (2014)
15
The Good Childhood 2015 The subjective well-being of children in the UK
Children’s emphasis on their ‘inner worlds’ and their recognition of the value of both informal and formal learning show that they are concerned both with their well-being in the here and now, and their future well-being or ‘well-becoming’. It is perhaps no surprise then that in our research programme we have found children’s feelings about the future to be a key aspect of their well-being.
EnvironmentsThe environments that children talk about the most are their homes, schools and local areas. These are the sites where children live out day-to-day lives, and where their physical and emotional worlds coincide. We have already talked about the fundamental role of children’s relationships – with family, friends, teachers, neighbours and others within their communities – but surprisingly important too are the physical aspects of these environments. In our conversations with children – and regardless of whether they are talking about the school toilets, the local playground or the streets around their homes – they consistently highlight the need for physical spaces that are safe, clean and pleasant. Our research programme confirms that children’s happiness with their environments is related to their overall well-being.
Money is another important external influence on children’s lives, and one of the key topics emerging from the 2005 survey.
However, children’s comments about their material worlds do not reflect the excessive materialism that some adult commentaries imply. Children acknowledge that material items are important, but they see them as secondary to relationships, and they tend to talk about money and possessions in relative terms – eg having ‘enough’ or ‘the same amount’ as – rather than ‘more’ than – others so that they fit in and are not excluded from the things that others can do.
Can we measure children’s subjective well-being and, if so, how?
The themes and frameworks discussed in this section, derived from what children told us, have been central to the development of the research programme, which has, for example, generated evidence on most of the issues identified in Figure 2 above.
The second task for the research programme was to test the extent to which it was possible to use self-report survey questions to gather valid, reliable and stable data from children on the topics identified above. Because the concept of subjective well-being can seem rather abstract it is understandable that people may have doubts about whether it is possible to gather meaningful information about it, from adults or children. In any case, it is vital for any new field of research to critically evaluate the questions and measures being used.
Based on the themes identified from the initial qualitative work described above, we searched for suitable questions, and sets of questions, that had already been tested and validated for use with children. Primarily the questions we identified had been developed in other countries (particularly the US and Australia) and there were some gaps where we were not able to identify any previously-used questions at all. We developed new questions to fill these gaps.
We used this work to prepare a first draft of a questionnaire for children which was tested, modified and refined through two phases of small-scale piloting and one phase of cognitive testing (undertaken for us by Ipsos Mori) with children aged between 10 and 15 years old in late 2007 and early 2008. The results were encouraging – indicating that children in this age range generally understood, and were comfortable with, the types of questions we were asking.
Based on the learning from this phase, we finalised two versions of a questionnaire (for children aged 10 to 11 in primary school and children aged 12 to 15 in secondary schools). At this stage we focused exclusively on cognitive subjective well-being – ie children’s level of satisfaction with their lives as a whole and particular aspects of their lives.
16
The Good Childhood 2015 The subjective well-being of children in the UK
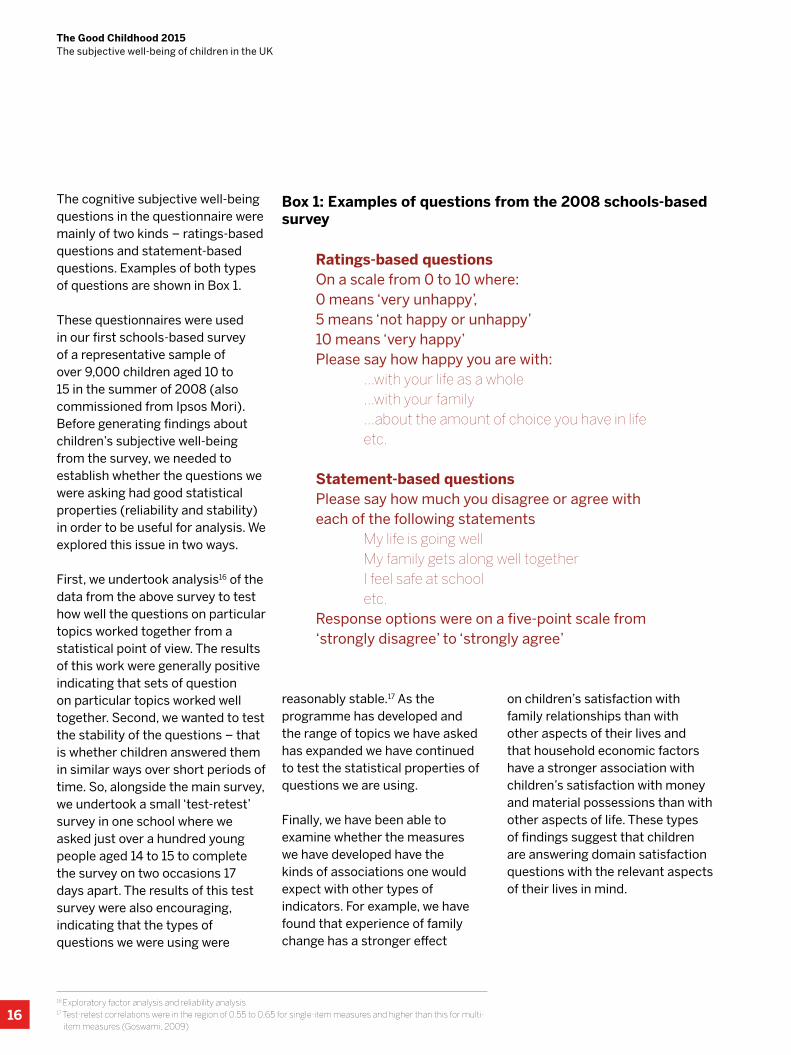
Ratings-based questionsOn a scale from 0 to 10 where:0 means ‘very unhappy’, 5 means ‘not happy or unhappy’ 10 means ‘very happy’Please say how happy you are with: ...with your life as a whole ...with your family ...about the amount of choice you have in life etc.
Statement-based questionsPlease say how much you disagree or agree with each of the following statements My life is going well My family gets along well together I feel safe at school etc.Response options were on a five-point scale from ‘strongly disagree’ to ‘strongly agree’
Box 1: Examples of questions from the 2008 schools-based survey
The cognitive subjective well-being questions in the questionnaire were mainly of two kinds – ratings-based questions and statement-based questions. Examples of both types of questions are shown in Box 1.
These questionnaires were used in our first schools-based survey of a representative sample of over 9,000 children aged 10 to 15 in the summer of 2008 (also commissioned from Ipsos Mori). Before generating findings about children’s subjective well-being from the survey, we needed to establish whether the questions we were asking had good statistical properties (reliability and stability) in order to be useful for analysis. We explored this issue in two ways.
First, we undertook analysis16 of the data from the above survey to test how well the questions on particular topics worked together from a statistical point of view. The results of this work were generally positive indicating that sets of question on particular topics worked well together. Second, we wanted to test the stability of the questions – that is whether children answered them in similar ways over short periods of time. So, alongside the main survey, we undertook a small ‘test-retest’ survey in one school where we asked just over a hundred young people aged 14 to 15 to complete the survey on two occasions 17 days apart. The results of this test survey were also encouraging, indicating that the types of questions we were using were
reasonably stable.17 As the programme has developed and the range of topics we have asked has expanded we have continued to test the statistical properties of questions we are using.
Finally, we have been able to examine whether the measures we have developed have the kinds of associations one would expect with other types of indicators. For example, we have found that experience of family change has a stronger effect
on children’s satisfaction with family relationships than with other aspects of their lives and that household economic factors have a stronger association with children’s satisfaction with money and material possessions than with other aspects of life. These types of findings suggest that children are answering domain satisfaction questions with the relevant aspects of their lives in mind.
16 Exploratory factor analysis and reliability analysis17 Test-retest correlations were in the region of 0.55 to 0.65 for single-item measures and higher than this for multi- item measures (Goswami, 2009)
17
The Good Childhood 2015 The subjective well-being of children in the UK
We have also found that children’s subjective well-being has a moderate association with measures of mental health problems – suggesting that there is a link between the two things but that they are nevertheless distinct, as would be expected from the conceptualisation of subjective well-being (see further discussion at the end of this chapter).
In summary, through the course of the research programme, we have built up evidence that the types of well-being questions we are asking children are understandable to them, are interpreted as addressing the intended topics, and have good statistical properties, being reliable, stable and having expected associations with other measures and factors.
What are the levels of children’s subjective well-being?
Overall levels of subjective well-beingOur first report on findings from the 2008 schools survey found that the mean life satisfaction score for children aged 10 to 15 in England was around 7.3 out of 10 and that around 10% of children in that age group could be defined as having low well-being.18 These patterns have been broadly confirmed by our subsequent research with mean subjective well-being scores tending to vary between seven and eight out of 10 and the percentages of children with low subjective well-being tending to vary between 5% and 10% depending on the exact measure of subjective well-being used and the age group surveyed.
The latest waves (2013-2015) of our online survey provide up-to-date figures on the well-being of children and young people in England, Wales and Scotland.
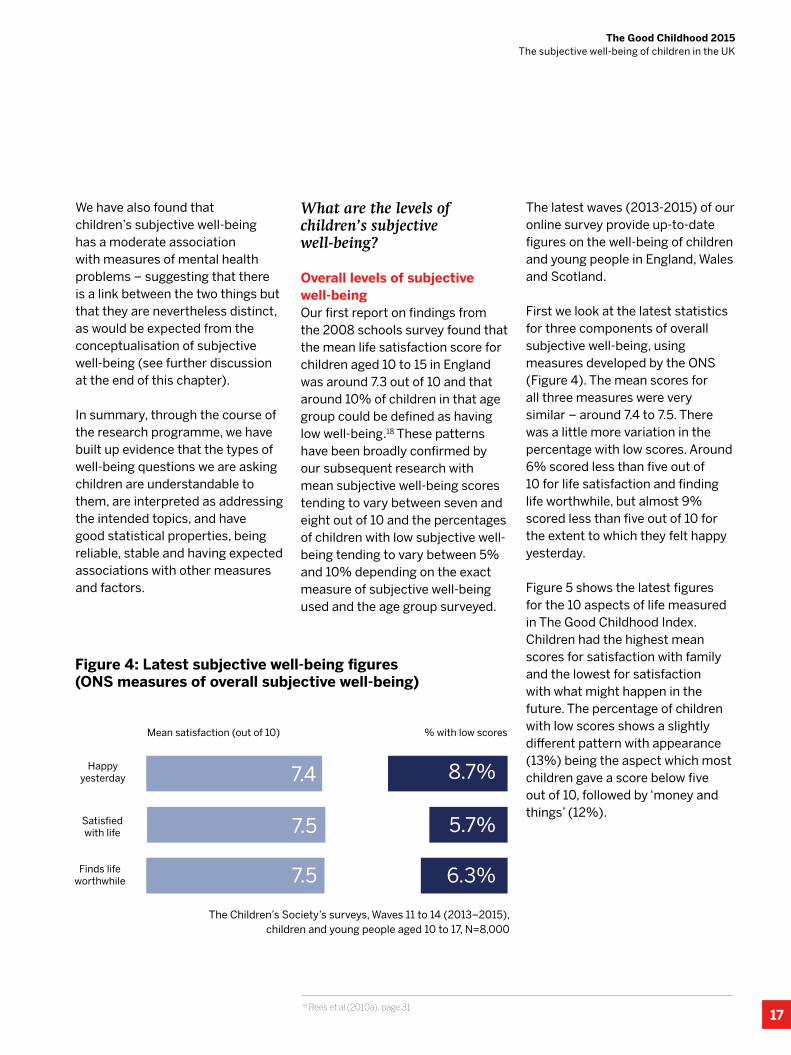
First we look at the latest statistics for three components of overall subjective well-being, using measures developed by the ONS (Figure 4). The mean scores for all three measures were very similar – around 7.4 to 7.5. There was a little more variation in the percentage with low scores. Around 6% scored less than five out of 10 for life satisfaction and finding life worthwhile, but almost 9% scored less than five out of 10 for the extent to which they felt happy yesterday.
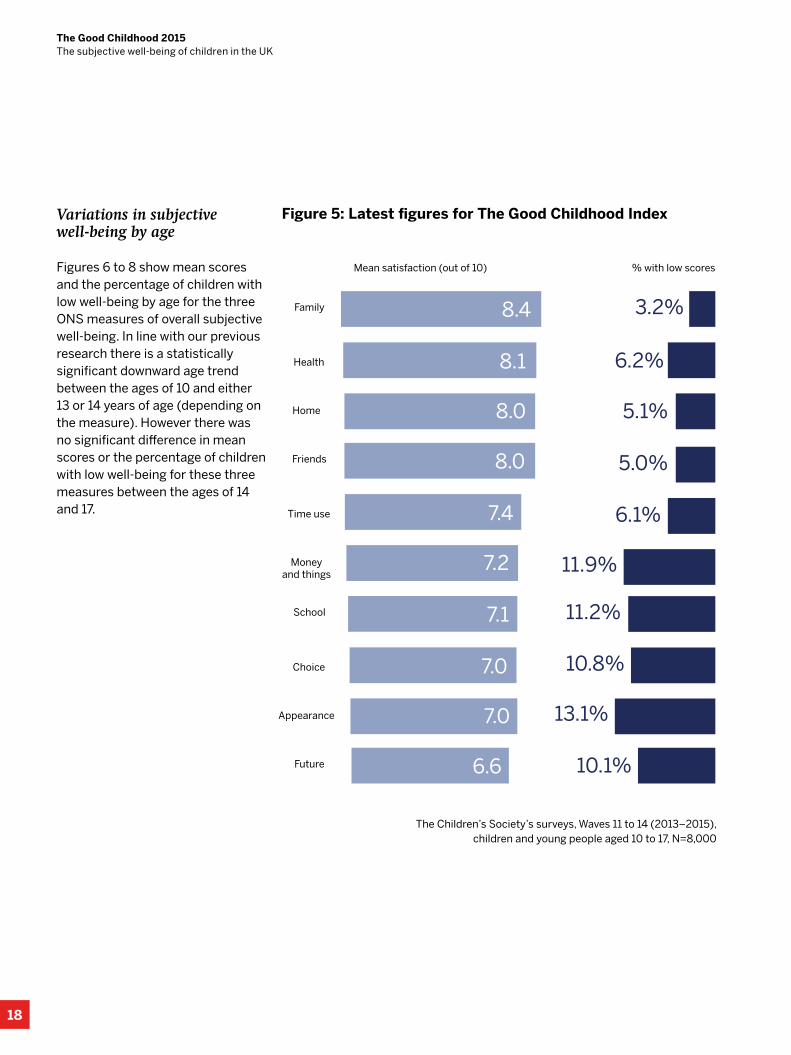
Figure 5 shows the latest figures for the 10 aspects of life measured in The Good Childhood Index. Children had the highest mean scores for satisfaction with family and the lowest for satisfaction with what might happen in the future. The percentage of children with low scores shows a slightly different pattern with appearance (13%) being the aspect which most children gave a score below five out of 10, followed by ‘money and things’ (12%).
18 Rees et al (2010a), page 31
Mean satisfaction (out of 10) % with low scores
7.4Happy
yesterday
7.5
7.5
Satisfied with life
Finds life worthwhile
8.7%
5.7%
6.3%
Figure 4: Latest subjective well-being figures (ONS measures of overall subjective well-being)
The Children’s Society’s surveys, Waves 11 to 14 (2013–2015), children and young people aged 10 to 17, N=8,000
18
The Good Childhood 2015 The subjective well-being of children in the UK
Mean satisfaction (out of 10) % with low scores
8.4Family
8.1
8.0
Health
Home
3.2%
6.2%
5.1%
8.0Friends
7.4
7.2
Time use
Money and things
7.1School
7.0
7.0
Choice
Appearance
6.6Future
6.1%
5.0%
11.9%
11.2%
10.8%
13.1%
10.1%
The Children’s Society’s surveys, Waves 11 to 14 (2013–2015), children and young people aged 10 to 17, N=8,000
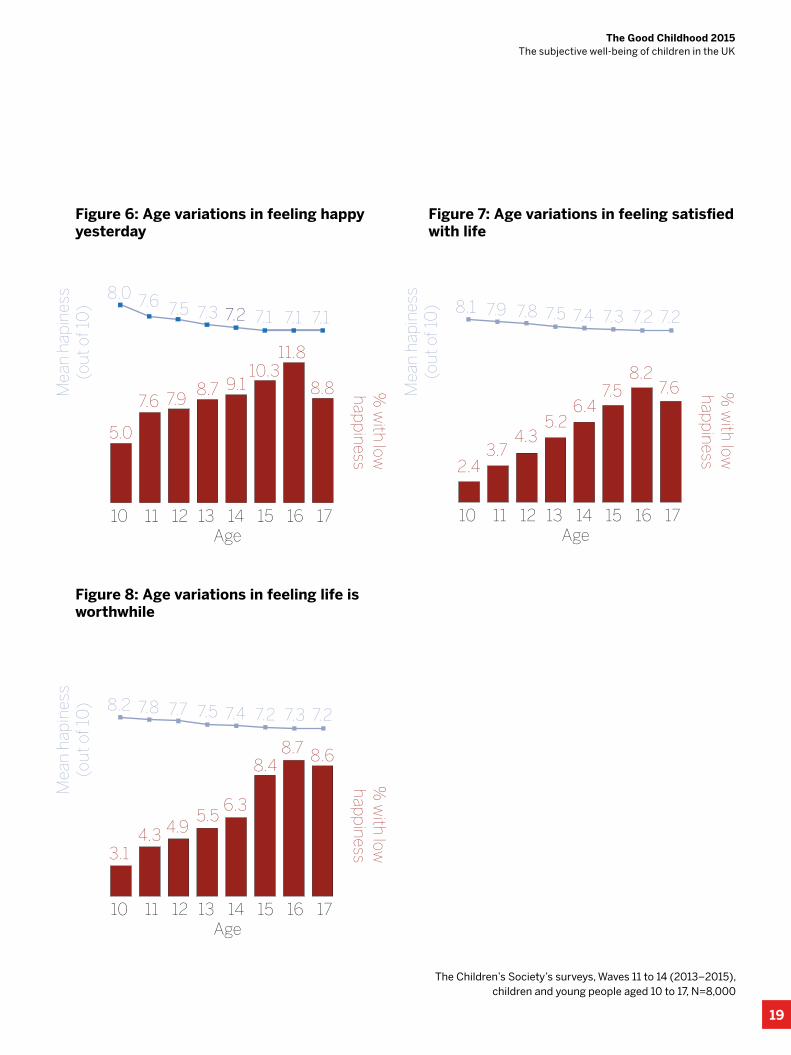
Variations in subjective well-being by age
Figures 6 to 8 show mean scores and the percentage of children with low well-being by age for the three ONS measures of overall subjective well-being. In line with our previous research there is a statistically significant downward age trend between the ages of 10 and either 13 or 14 years of age (depending on the measure). However there was no significant difference in mean scores or the percentage of children with low well-being for these three measures between the ages of 14 and 17.
Figure 5: Latest figures for The Good Childhood Index
19
The Good Childhood 2015 The subjective well-being of children in the UK
The Children’s Society’s surveys, Waves 11 to 14 (2013–2015), children and young people aged 10 to 17, N=8,000
Figure 6: Age variations in feeling happy yesterday
Figure 8: Age variations in feeling life is worthwhile
Figure 7: Age variations in feeling satisfied with life
Mea
n ha
pin
ess
(out
of 1
0)
10 11 12 13 14 15 16 17Age
8.0 7.6 7.5 7.3 7.2 7.1 7.1 7.1
% w
ith low
happ
iness5.0
7.6 7.98.7 9.1
10.311.8
8.8 Mea
n ha
pin
ess
(out
of 1
0)
10 11 12 13 14 15 16 17Age
8.1 7.9 7.8 7.5 7.4 7.3 7.2 7.2
% w
ith low
happ
iness
2.43.7
4.35.2
6.47.5
8.27.6
Mea
n ha
pin
ess
(out
of 1
0)
10 11 12 13 14 15 16 17Age
8.2 7.8 7.7 7.5 7.4 7.2 7.3 7.2
% w
ith low
happ
iness3.14.3 4.9
5.56.3
8.48.7 8.6
20
The Good Childhood 2015 The subjective well-being of children in the UK
There was a similar pattern for the items in The Good Childhood Index. Generally, as with the overall subjective well-being measures, there were significant downward age trends between the age of 10 and 14 for all nine items but no significant difference from 14 to 17 years of age (except that 17 year olds were significantly less satisfied with their material situation and time use than 14 year olds).
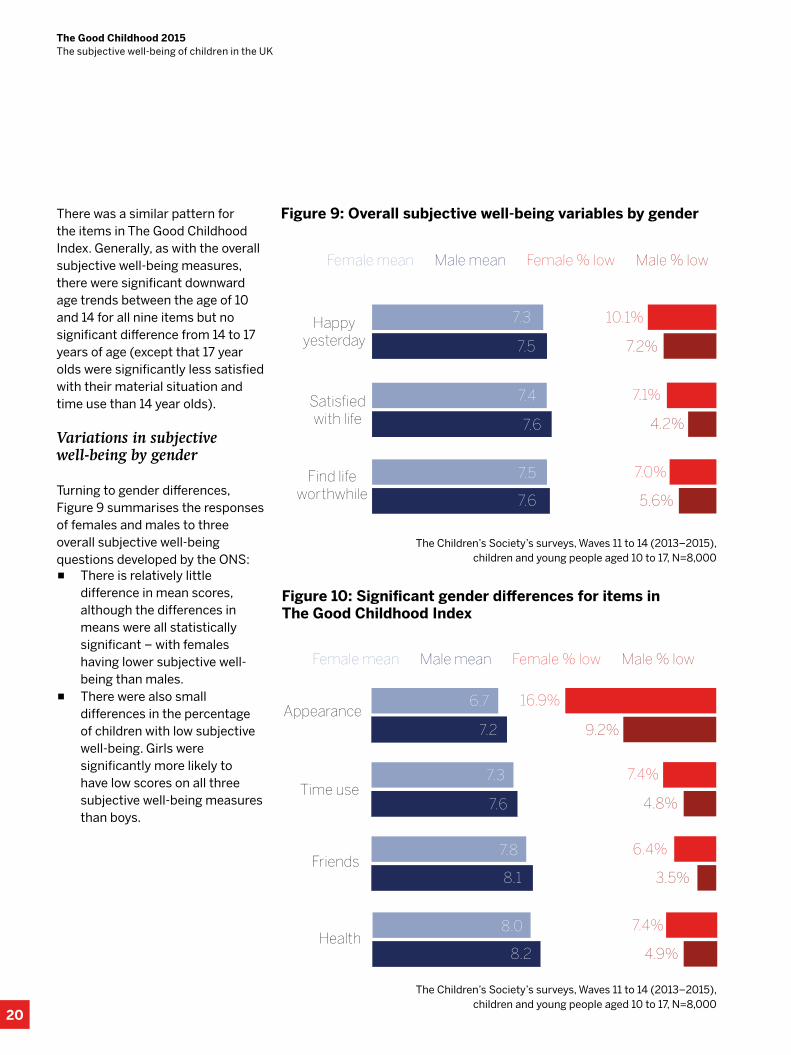
Variations in subjective well-being by gender
Turning to gender differences, Figure 9 summarises the responses of females and males to three overall subjective well-being questions developed by the ONS:
▪ There is relatively little difference in mean scores, although the differences in means were all statistically significant – with females having lower subjective well-being than males.
▪ There were also small differences in the percentage of children with low subjective well-being. Girls were significantly more likely to have low scores on all three subjective well-being measures than boys.
Figure 9: Overall subjective well-being variables by gender
Figure 10: Significant gender differences for items in The Good Childhood Index
Happyyesterday
Satisfied with life
Find life worthwhile
Female mean Male mean Female % low Male % low
7.3
7.5
7.4
7.6
7.5
7.6
10.1%
7.1%
7.0%
7.2%
4.2%
5.6%
Appearance
Time use
Friends
Female mean Male mean Female % low Male % low
6.7
7.2
7.3
7.6
7.8
8.1
16.9%
7.4%
6.4%
9.2%
4.8%
3.5%
Health8.0
8.2
7.4%
4.9%
The Children’s Society’s surveys, Waves 11 to 14 (2013–2015), children and young people aged 10 to 17, N=8,000
The Children’s Society’s surveys, Waves 11 to 14 (2013–2015), children and young people aged 10 to 17, N=8,000
21
The Good Childhood 2015 The subjective well-being of children in the UK
There were also significant gender differences, in terms of mean scores and the percentage of children with low well-being, for four items in The Good Childhood Index – appearance, time use, friends and health (Figure 10). In all four cases, males were more satisfied than females. The difference for satisfaction with appearance was the largest. The mean score for males was 7.2, compared to 6.7 for females, and almost twice as many females (17%) as males (9%) had low satisfaction with their appearance. This is in line with previous findings and is one of the topics on which we present important new findings based on international comparisons in Chapter 2.
There were smaller and more marginally significant gender differences for home and money/things – in both cases males had slightly higher satisfaction than females. For the remaining four aspects covered in The Good Childhood Index – family, choice, the future and school – there was no significant gender difference.
Are there trends in children’s subjective well-being over time?
Clearly the extent to which children’s subjective well-being varies over time is an important issue from a research viewpoint and may carry important messages from a practical and policy perspective.
In The Good Childhood Report 2012 we presented findings from the first five of our Good Childhood Index surveys and showed that across a period of a year or so the mean scores for overall subjective well-being and satisfaction with different aspects of life covered in the Index were remarkably stable. However, we have also been able to analyse longer-term trends using data from the British Household Panel Survey (BHPS) and its successor, the Understanding Society survey. The questions asked about subjective well-being in those surveys are rather limited but the data set has the advantage of covering a long time scale stretching back to 1994. Our analysis of long-term trends up to 2011, published in The Good Childhood Report 2014, suggested that there had been a significant increase in the life satisfaction of children aged 11 to 15 in the UK between 1994 and 2007 but that that trend had ceased in the period from 2007 to 2011.
The Good Childhood Report 2014 also used the BHPS and the Understanding Society survey to explore trends over the period from 1994 to 2011 in children’s satisfaction with four aspects of their lives – school work, friends, family and appearance. The analysis found that:
▪ children’s satisfaction with family had been relatively stable
▪ there had been an increase in children’s satisfaction with friends between 1995 and 2007 but this trend appears to have
been reversed up to 2011
▪ children’s satisfaction with school work had increased a little between 2001 and 2011, although it was stable in the most recent few years of that period – girls’ satisfaction with this aspect of life had been fairly consistently higher than boys’ during the period from 2003 to 2011
▪ there was no clear overall trend in children’s satisfaction with appearance, but from a position of approximate equality in 2002, there had been a divergence in mean levels of satisfaction for boys and girls. Boys’ mean scores increased between 2002 and 2011 while girls’ mean scores dropped.
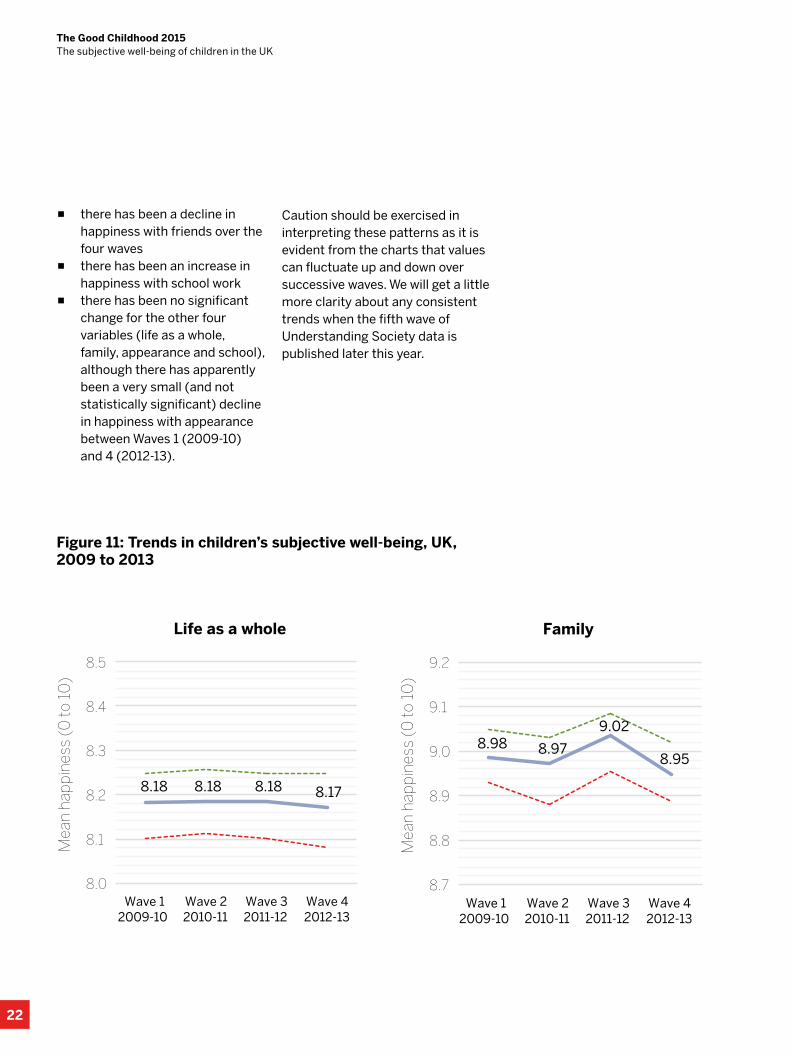
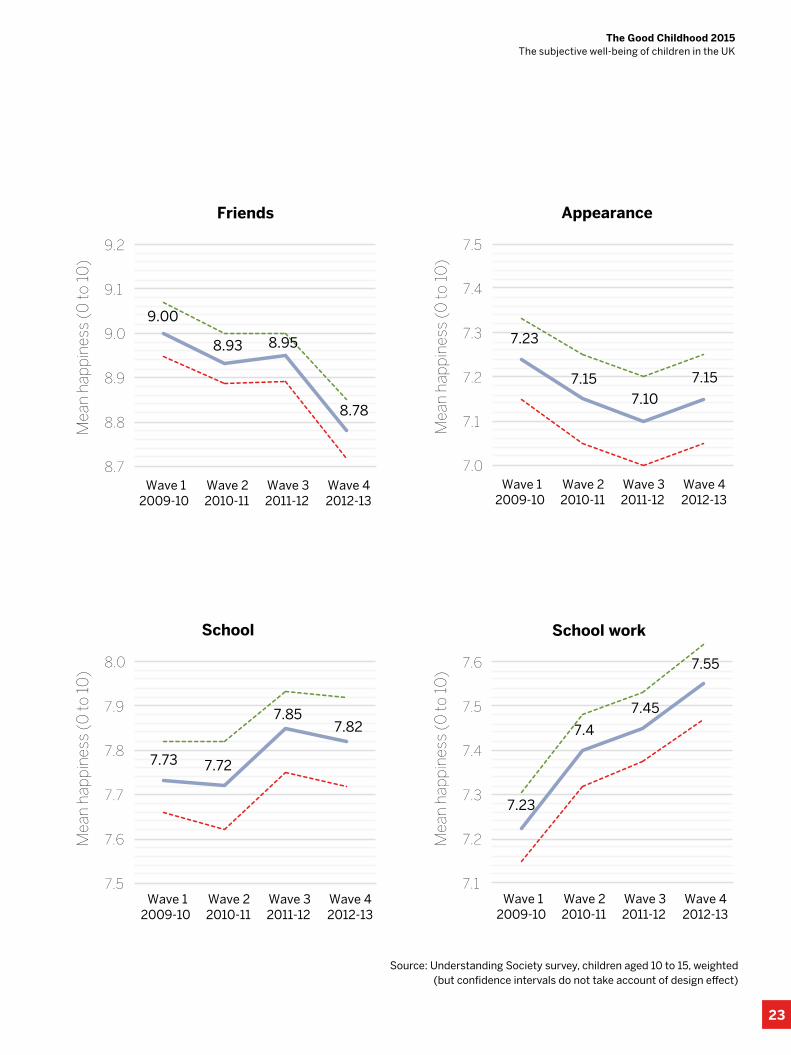
For the current report we have been able to utilise newly-available data from the Understanding Society survey to analyse recent trends in the six indicators19 of children’s subjective well-being included in that survey. Figure 11 shows mean scores for the first four waves of the survey (2009-10 to 2012-13). The blue line shows the mean scores for each wave. The dotted green and red lines show approximate upper and lower 99% confidence intervals.20 Please note that the vertical axis for charts is based on the range of values within each chart, is different for each chart and only shows a small proportion of the range of possible values which is from zero to ten. The variations across waves are all quite small. However the charts suggest that:
19 The data for each indicator was originally on a seven-point scale where higher values represented lower happiness. The mean scores have been reversed and rescaled from 0 to 10 for ease of interpretation and comparability with other statistics presented in this report.20 These may be under-estimates as they use the cross-sectional weighting but don’t take account of the design effect of the survey
22
The Good Childhood 2015 The subjective well-being of children in the UK
▪ there has been a decline in happiness with friends over the four waves
▪ there has been an increase in happiness with school work
▪ there has been no significant change for the other four variables (life as a whole, family, appearance and school), although there has apparently been a very small (and not statistically significant) decline in happiness with appearance between Waves 1 (2009-10) and 4 (2012-13).
Caution should be exercised in interpreting these patterns as it is evident from the charts that values can fluctuate up and down over successive waves. We will get a little more clarity about any consistent trends when the fifth wave of Understanding Society data is published later this year.
Figure 11: Trends in children’s subjective well-being, UK, 2009 to 2013
8.18 8.18 8.18 8.17
8.0
8.1
8.2
8.3
8.4
8.5
Wave 1 2009-10
Wave 2 2010-11
Wave 3 2011-12
Wave 4 2012-13
Mea
n ha
pp
ines
s (0
to 1
0)
Life as a whole
8.98 8.97
9.02
8.95
Mea
n ha
pp
ines
s (0
to 1
0)
8.7
8.8
8.9
9.0
9.1
9.2
8.7
8.8
8.9
9.0
9.1
9.2
Mea
n ha
pp
ines
s (0
to 1
0)
7.23
7.15 7.10
7.15
7.0
7.1
7.2
7.3
7.4
7.5
Mea
n ha
pp
ines
s (0
to 1
0)
7.73 7.72
7.857.82
7.5
7.6
7.7
7.8
7.9
8.0
7.23
7.4
7.45
7.55
7.1
7.2
7.3
7.4
7.5
7.6
Mea
n ha
pp
ines
s (0
to 1
0)
Mea
n ha
pp
ines
s (0
to 1
0)
Family
Friends Appearance
School School work
Wave 1 2009-10
Wave 2 2010-11
Wave 3 2011-12
Wave 4 2012-13
Wave 1 2009-10
Wave 2 2010-11
Wave 3 2011-12
Wave 4 2012-13
Wave 1 2009-10
Wave 2 2010-11
Wave 3 2011-12
Wave 4 2012-13
Wave 1 2009-10
Wave 2 2010-11
Wave 3 2011-12
Wave 4 2012-13
Wave 1 2009-10
Wave 2 2010-11
Wave 3 2011-12
Wave 4 2012-13
8.93 8.95
8.78
9.00
23
The Good Childhood 2015 The subjective well-being of children in the UK
8.18 8.18 8.18 8.17
8.0
8.1
8.2
8.3
8.4
8.5
Wave 1 2009-10
Wave 2 2010-11
Wave 3 2011-12
Wave 4 2012-13
Mea
n ha
pp
ines
s (0
to 1
0)
Life as a whole
8.98 8.97
9.02
8.95
Mea
n ha
pp
ines
s (0
to 1
0)
8.7
8.8
8.9
9.0
9.1
9.2
8.7
8.8
8.9
9.0
9.1
9.2
Mea
n ha
pp
ines
s (0
to 1
0)
7.23
7.15 7.10
7.15
7.0
7.1
7.2
7.3
7.4
7.5
Mea
n ha
pp
ines
s (0
to 1
0)
7.73 7.72
7.857.82
7.5
7.6
7.7
7.8
7.9
8.0
7.23
7.4
7.45
7.55
7.1
7.2
7.3
7.4
7.5
7.6
Mea
n ha
pp
ines
s (0
to 1
0)
Mea
n ha
pp
ines
s (0
to 1
0)
Family
Friends Appearance
School School work
Wave 1 2009-10
Wave 2 2010-11
Wave 3 2011-12
Wave 4 2012-13
Wave 1 2009-10
Wave 2 2010-11
Wave 3 2011-12
Wave 4 2012-13
Wave 1 2009-10
Wave 2 2010-11
Wave 3 2011-12
Wave 4 2012-13
Wave 1 2009-10
Wave 2 2010-11
Wave 3 2011-12
Wave 4 2012-13
Wave 1 2009-10
Wave 2 2010-11
Wave 3 2011-12
Wave 4 2012-13
8.93 8.95
8.78
9.00
Source: Understanding Society survey, children aged 10 to 15, weighted (but confidence intervals do not take account of design effect)
24
The Good Childhood 2015 The subjective well-being of children in the UK
Why does children’s subjective well-being vary and how might it be improved?
A central focus for research on subjective well-being has been to try to understand why people’s subjective well-being varies. This is evidently key to finding ways to improve the level of subjective well-being of individuals or the population as a whole. Research on adults’ subjective well-being has found that: socio-demographic and economic factors explain only a small amount of the variation;21 genetics and personality are important explanatory factors but still leave a substantial amount of variation unexplained;22 life events can have an impact on subjective well-being although this can sometimes be short-lived;23 and that people’s own behaviours and choices can raise or lower their level of subjective well-being.24
As with other areas of subjective well-being research, work on children’s subjective well-being has lagged behind that of adults. When we started the research programme in 2005 there was very limited evidence available on most of the above issues in relation to children. Our research has helped to fill this gap through exploring the link between children’s subjective well-being and the factors discussed above – demographics, economics, personality, life events, behaviour – as well as other issues that had been identified through our consultations with children.
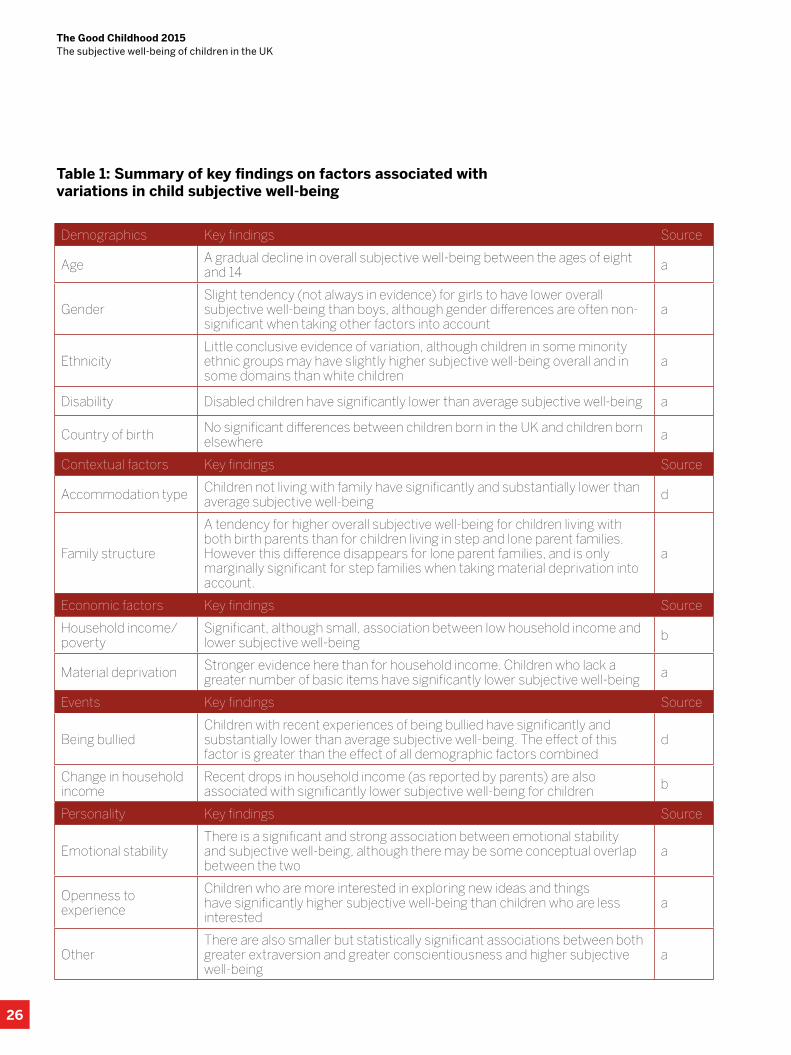
Table 1 provides a brief summary of a range of findings from the research programme about associations of various factors with children’s overall subjective well-being (primarily with life satisfaction). These are all factors that have been found to be statistically significant when controlling for a range of socio-economic factors (such as age, gender, family structure and family economic status).
The overall conclusions that can be drawn from these summaries are quite similar to those from research on adults described above:
▪ Demographic variables such as age, gender and ethnicity explain relatively little of the variation in children’s subjective well-being. However the finding on disabled children highlights the important point that, despite this general picture, subjective well-being may nevertheless be substantially lower than average for some sub-groups of children.
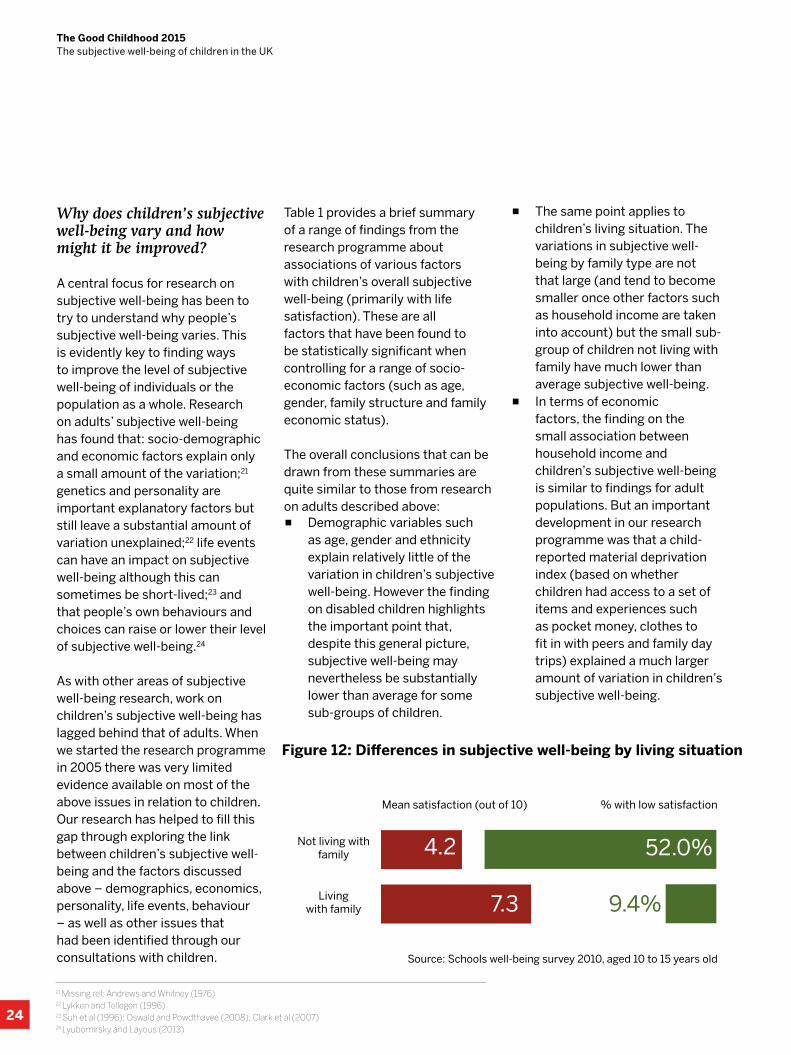
▪ The same point applies to children’s living situation. The variations in subjective well-being by family type are not that large (and tend to become smaller once other factors such as household income are taken into account) but the small sub-group of children not living with family have much lower than average subjective well-being.
▪ In terms of economic factors, the finding on the small association between household income and children’s subjective well-being is similar to findings for adult populations. But an important development in our research programme was that a child-reported material deprivation index (based on whether children had access to a set of items and experiences such as pocket money, clothes to fit in with peers and family day trips) explained a much larger amount of variation in children’s subjective well-being.
Figure 12: Differences in subjective well-being by living situation
Mean satisfaction (out of 10) % with low satisfaction
4.2Not living with family 52.0%
7.3Living with family 9.4%
Source: Schools well-being survey 2010, aged 10 to 15 years old
21 Missing ref: Andrews and Whitney (1976)22 Lykken and Tellegen (1996) 23 Suh et al (1996); Oswald and Powdthavee (2008); Clark et al (2007) 24 Lyubomirsky and Layous (2013)
25
The Good Childhood 2015 The subjective well-being of children in the UK
Figure 12: Differences in subjective well-being by living situation
Source: Schools well-being survey 2010, aged 10 to 15 years old
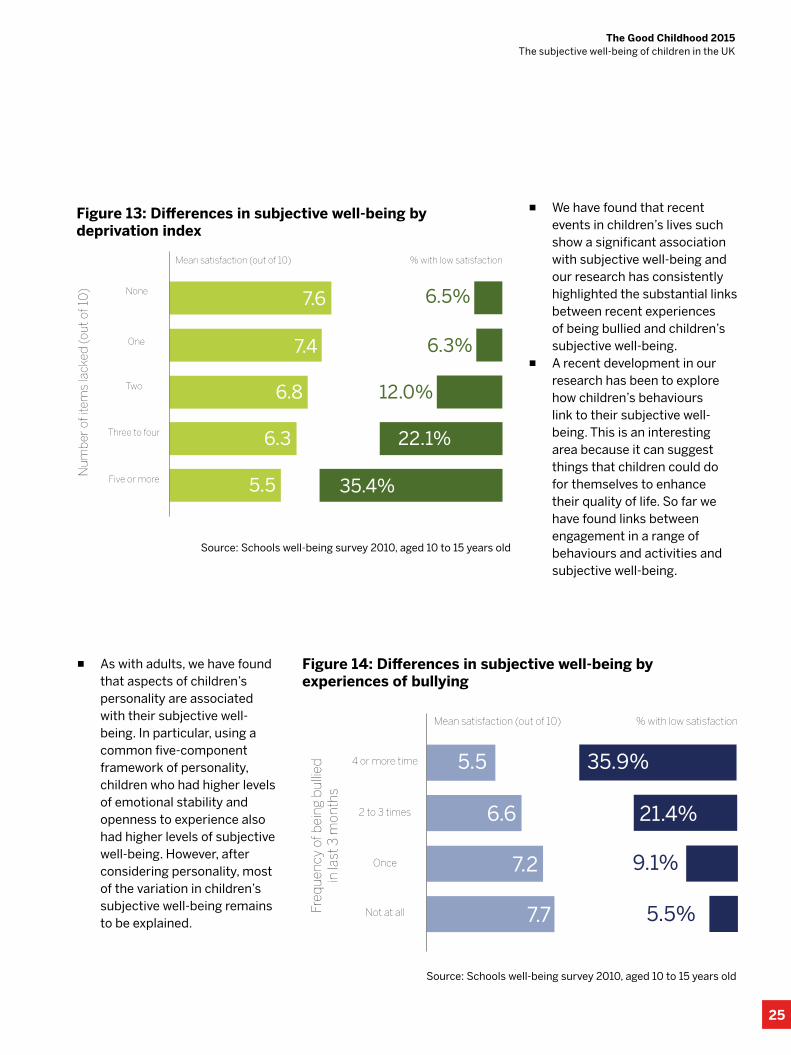
▪ As with adults, we have found that aspects of children’s personality are associated with their subjective well-being. In particular, using a common five-component framework of personality, children who had higher levels of emotional stability and openness to experience also had higher levels of subjective well-being. However, after considering personality, most of the variation in children’s subjective well-being remains to be explained.
▪ We have found that recent events in children’s lives such show a significant association with subjective well-being and our research has consistently highlighted the substantial links between recent experiences of being bullied and children’s subjective well-being.
▪ A recent development in our research has been to explore how children’s behaviours link to their subjective well-being. This is an interesting area because it can suggest things that children could do for themselves to enhance their quality of life. So far we have found links between engagement in a range of behaviours and activities and subjective well-being.
Figure 13: Differences in subjective well-being by deprivation index
Mean satisfaction (out of 10)
Num
ber
of i
tem
s la
cked
(out
of 1
0)
% with low satisfaction
7.6None
7.4
6.8
One
Two
6.5%
6.3%
12.0%
6.3Three to four 22.1%
5.5Five or more 35.4%
Source: Schools well-being survey 2010, aged 10 to 15 years old
Figure 14: Differences in subjective well-being by experiences of bullying
Mean satisfaction (out of 10) % with low satisfaction
5.54 or more time 35.9%
6.62 to 3 times 21.4%
7.2Once 9.1%
7.7Not at all 5.5%Freq
uenc
y of
bei
ng b
ullie
d
in la
st 3
mon
ths
26
The Good Childhood 2015 The subjective well-being of children in the UK
Table 1: Summary of key findings on factors associated with variations in child subjective well-being
Demographics Key findings Source
Age A gradual decline in overall subjective well-being between the ages of eight and 14 a
GenderSlight tendency (not always in evidence) for girls to have lower overall subjective well-being than boys, although gender differences are often non-significant when taking other factors into account
a
EthnicityLittle conclusive evidence of variation, although children in some minority ethnic groups may have slightly higher subjective well-being overall and in some domains than white children
a
Disability Disabled children have significantly lower than average subjective well-being a
Country of birth No significant differences between children born in the UK and children born elsewhere a
Contextual factors Key findings Source
Accommodation type Children not living with family have significantly and substantially lower than average subjective well-being d
Family structure
A tendency for higher overall subjective well-being for children living with both birth parents than for children living in step and lone parent families. However this difference disappears for lone parent families, and is only marginally significant for step families when taking material deprivation into account.
a
Economic factors Key findings Source
Household income/poverty
Significant, although small, association between low household income and lower subjective well-being b
Material deprivation Stronger evidence here than for household income. Children who lack a greater number of basic items have significantly lower subjective well-being a
Events Key findings Source
Being bulliedChildren with recent experiences of being bullied have significantly and substantially lower than average subjective well-being. The effect of this factor is greater than the effect of all demographic factors combined
d
Change in household income
Recent drops in household income (as reported by parents) are also associated with significantly lower subjective well-being for children b
Personality Key findings Source
Emotional stabilityThere is a significant and strong association between emotional stability and subjective well-being, although there may be some conceptual overlap between the two
a
Openness to experience
Children who are more interested in exploring new ideas and things have significantly higher subjective well-being than children who are less interested
a
OtherThere are also smaller but statistically significant associations between both greater extraversion and greater conscientiousness and higher subjective well-being
a
27
The Good Childhood 2015 The subjective well-being of children in the UK
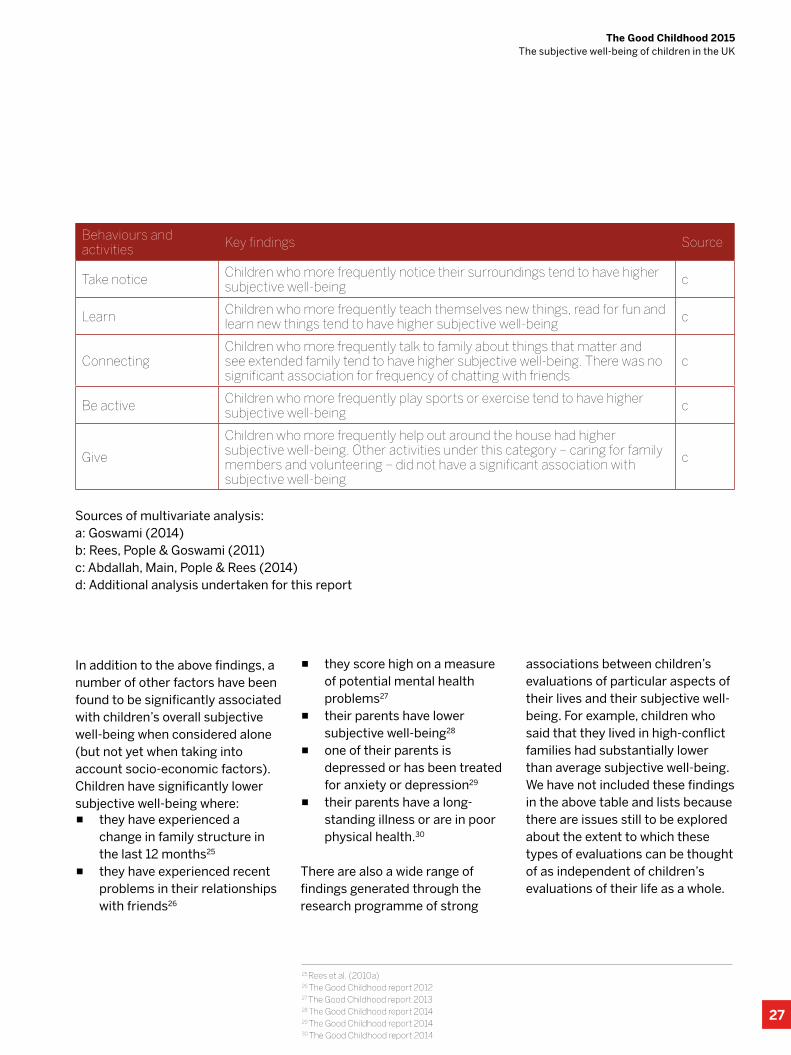
Behaviours and activities Key findings Source
Take notice Children who more frequently notice their surroundings tend to have higher subjective well-being c
Learn Children who more frequently teach themselves new things, read for fun and learn new things tend to have higher subjective well-being c
ConnectingChildren who more frequently talk to family about things that matter and see extended family tend to have higher subjective well-being. There was no significant association for frequency of chatting with friends
c
Be active Children who more frequently play sports or exercise tend to have higher subjective well-being c
Give
Children who more frequently help out around the house had higher subjective well-being. Other activities under this category – caring for family members and volunteering – did not have a significant association with subjective well-being
c
In addition to the above findings, a number of other factors have been found to be significantly associated with children’s overall subjective well-being when considered alone (but not yet when taking into account socio-economic factors). Children have significantly lower subjective well-being where:
▪ they have experienced a change in family structure in the last 12 months25
▪ they have experienced recent problems in their relationships with friends26
▪ they score high on a measure of potential mental health problems27
▪ their parents have lower subjective well-being28
▪ one of their parents is depressed or has been treated for anxiety or depression29
▪ their parents have a long-standing illness or are in poor physical health.30
There are also a wide range of findings generated through the research programme of strong
associations between children’s evaluations of particular aspects of their lives and their subjective well-being. For example, children who said that they lived in high-conflict families had substantially lower than average subjective well-being. We have not included these findings in the above table and lists because there are issues still to be explored about the extent to which these types of evaluations can be thought of as independent of children’s evaluations of their life as a whole.
Sources of multivariate analysis:a: Goswami (2014)b: Rees, Pople & Goswami (2011)c: Abdallah, Main, Pople & Rees (2014)d: Additional analysis undertaken for this report
25 Rees et al. (2010a)26 The Good Childhood report 201227 The Good Childhood report 201328 The Good Childhood report 201429 The Good Childhood report 201430 The Good Childhood report 2014
28
The Good Childhood 2015 The subjective well-being of children in the UK
Subjective well-being, flourishing and mental health One other issue that has been a point of focus for the programme has been to attempt to clarify the scope of subjective well-being and related concepts such as ‘flourishing’ and mental health.
FlourishingAs discussed earlier, various people have proposed the use of the word ‘flourishing’ in relation to the concept of people’s well-being or quality of life. One potential use of this term is to link together people’s subjective well-being (ie life and domain satisfaction and moods and emotions) with their psychological well-being (incorporating aspects such as autonomy, competence and purpose in life). In this sense people are described as ‘flourishing’ if they have positive levels of both subjective and psychological well-being – that is they are relatively satisfied with their lives and
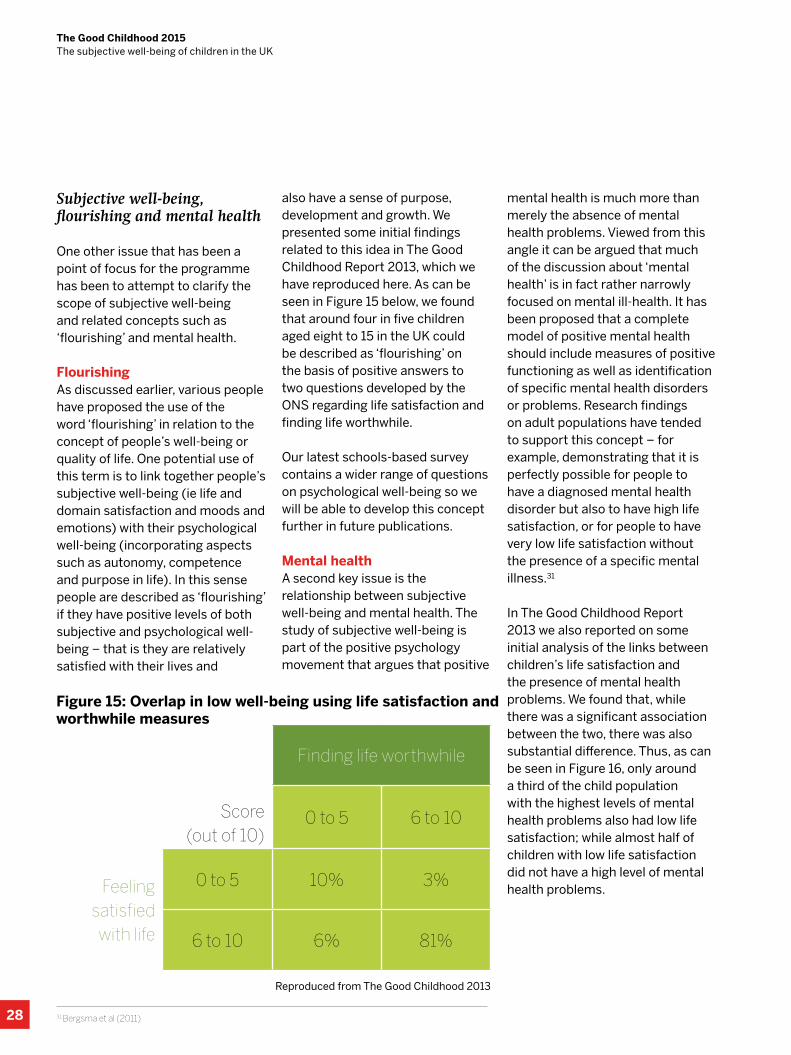
also have a sense of purpose, development and growth. We presented some initial findings related to this idea in The Good Childhood Report 2013, which we have reproduced here. As can be seen in Figure 15 below, we found that around four in five children aged eight to 15 in the UK could be described as ‘flourishing’ on the basis of positive answers to two questions developed by the ONS regarding life satisfaction and finding life worthwhile.
Our latest schools-based survey contains a wider range of questions on psychological well-being so we will be able to develop this concept further in future publications.
Mental healthA second key issue is the relationship between subjective well-being and mental health. The study of subjective well-being is part of the positive psychology movement that argues that positive
mental health is much more than merely the absence of mental health problems. Viewed from this angle it can be argued that much of the discussion about ‘mental health’ is in fact rather narrowly focused on mental ill-health. It has been proposed that a complete model of positive mental health should include measures of positive functioning as well as identification of specific mental health disorders or problems. Research findings on adult populations have tended to support this concept – for example, demonstrating that it is perfectly possible for people to have a diagnosed mental health disorder but also to have high life satisfaction, or for people to have very low life satisfaction without the presence of a specific mental illness.31
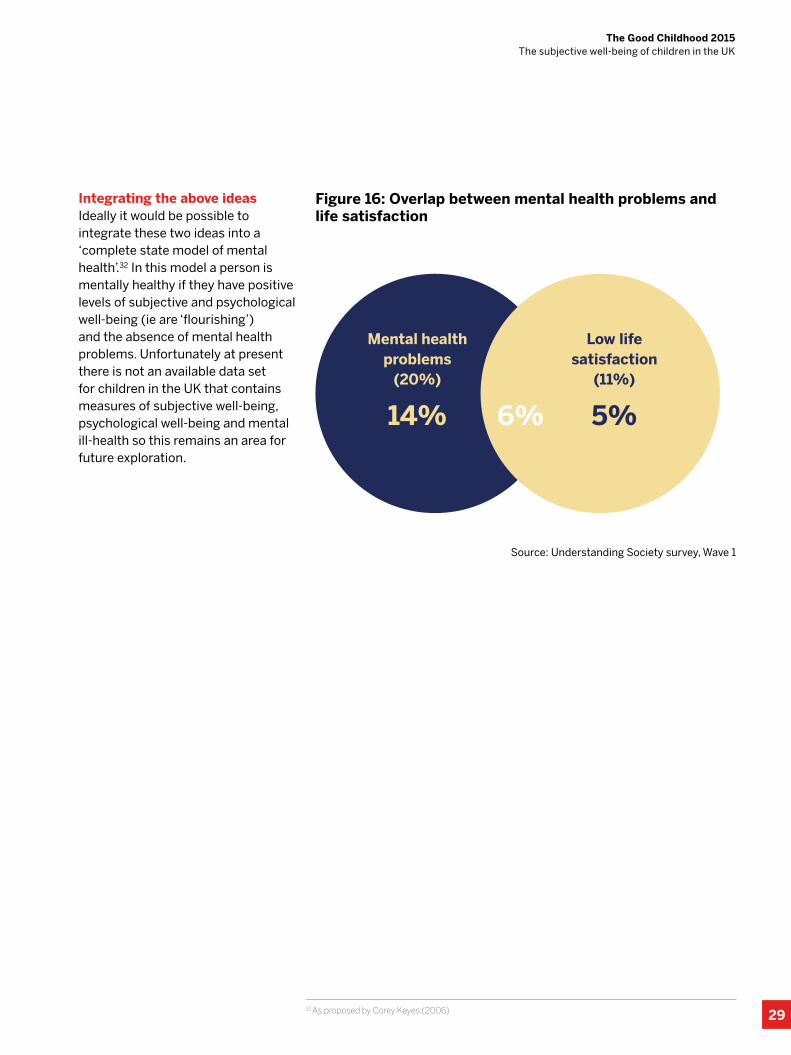
In The Good Childhood Report 2013 we also reported on some initial analysis of the links between children’s life satisfaction and the presence of mental health problems. We found that, while there was a significant association between the two, there was also substantial difference. Thus, as can be seen in Figure 16, only around a third of the child population with the highest levels of mental health problems also had low life satisfaction; while almost half of children with low life satisfaction did not have a high level of mental health problems.
Score (out of 10)
Finding life worthwhile
0 to 5 6 to 10
Feeling satisfied with life
0 to 5 10% 3%
6 to 10 6% 81%
Figure 15: Overlap in low well-being using life satisfaction and worthwhile measures
Reproduced from The Good Childhood 2013
31 Bergsma et al (2011)
29
The Good Childhood 2015 The subjective well-being of children in the UK
Integrating the above ideasIdeally it would be possible to integrate these two ideas into a ‘complete state model of mental health’.32 In this model a person is mentally healthy if they have positive levels of subjective and psychological well-being (ie are ‘flourishing’) and the absence of mental health problems. Unfortunately at present there is not an available data set for children in the UK that contains measures of subjective well-being, psychological well-being and mental ill-health so this remains an area for future exploration.
Mental health problems
(20%)
14%
Low life satisfaction
(11%)
5%6%
Source: Understanding Society survey, Wave 1
Figure 16: Overlap between mental health problems and life satisfaction
32 As proposed by Corey Keyes (2006)
30
The Good Childhood 2015 The subjective well-being of children in the UK
31
The Good Childhood 2015 The subjective well-being of children in the UK
Chapter 2: Comparing children’s subjective well-being in England and other countries
32
The Good Childhood 2015 Comparing children’s subjective well-being in England and other countries
In this chapter we summarise findings on children’s subjective well-being in England, in comparison with 14 other countries around the world, drawn from the Children’s Worlds study. The findings provide very important new insights into the levels of children’s subjective well-being in England and further our understanding of the extent to which findings from our ongoing research programme, such as age and gender variations, are similar or different to those seen among children in other countries.
Introduction
33 In some countries, the survey was only conducted in one region – see the comparative international report below for further details.34 http://www.isciweb.org/_Uploads/dbsAttachedFiles/ChildrensWorlds2015-FullReport-Final.pdf35 Further details are available in the above research report.36 A separate report on the 8-years-old survey will be published later in 2015.
The Children’s Worlds project
Children’s Worlds is an international research study of children’s lives and well-being. In last year’s Good Childhood Report we presented some initial findings from the first (pilot) wave of the survey undertaken in 2011 to 2012. Here, we focus on key comparative findings from the second wave of the survey which has so far been undertaken with over 53,000 children aged around eight, 10 and 12 years of age in 15 countries33 in four continents – Algeria, Colombia, Estonia, Ethiopia, Germany, Israel, Nepal, Norway, Poland, Romania, South Africa, South Korea, Spain, Turkey and England. Full details about the survey are contained in the first comparative research report from this wave of the project, which is available on the Children’s Worlds project website.34
The survey in England
The survey in England was funded
jointly by the Jacobs Foundation and The Children’s Society. The overall design, management and analysis of the survey was undertaken by researchers at the Social Policy Research Unit, University of York. Survey recruitment and administration was conducted by the Research Bods survey agency. Ethical approval for the study was obtained from an ethics committee at the University of York.
The survey consisted of a nationally representative sample of children in years 6 (eight to nine years old), 8 (10 to 11 years old) and 10 (12 to 13 years old) in mainstream schools in England. For both the primary school and secondary school samples a full list of schools in England was obtained and was divided into five strata based on the proportion of children eligible for free school meals. Samples of schools were drawn from each stratum with probabilities proportional to size (the number
of pupils in the relevant school year in the school). Within selected schools one non-streamed class group was randomly selected to participate in the survey. Children participated in the survey via an online questionnaire. There were three different versions of the questionnaire – one for each age group. Details of the questionnaire content are provided in the next section. The survey was conducted from November 2013 to April 2014.
The data obtained was submitted to standard data checking and cleaning processes agreed for the Children’s Worlds survey.35 Following this process the final data set for England consisted of 3,430 questionnaires across the three age groups. Because the questionnaire for eight year olds differed substantially from the versions for 10 and 12 year olds the initial international comparative report only focused on the older two age groups.36 In this chapter we follow that approach and look only at the findings for children in
33
The Good Childhood 2015 Comparing children’s subjective well-being in England and other countries
37 In England the word ‘happy’ was used rather than ‘satisfied’ based on previous testing which indicated that the two words were regarded as interchangeable by children and that ‘happy’ was easier to read.
school years 6 and 8 in England. The final sample sizes for years 6 and 8 were 979 children and 1,317 children respectively. In both age groups around 51% of children were male and 49% were female.
The survey questionnaires
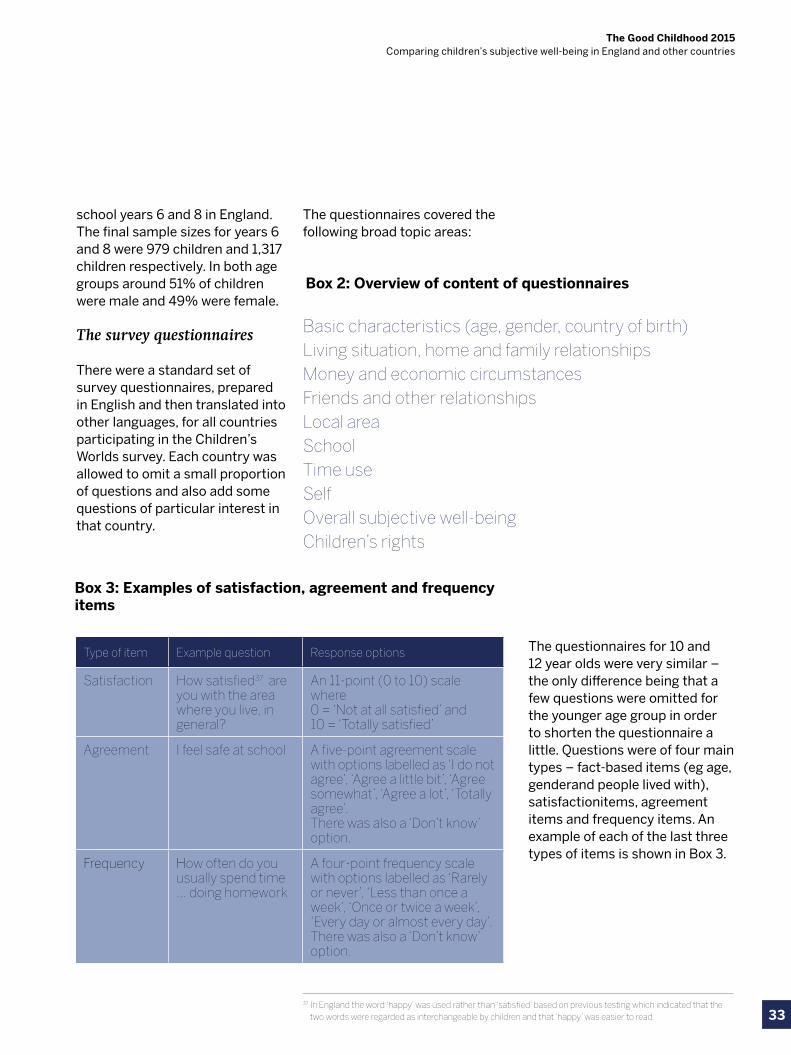
There were a standard set of survey questionnaires, prepared in English and then translated into other languages, for all countries participating in the Children’s Worlds survey. Each country was allowed to omit a small proportion of questions and also add some questions of particular interest in that country.
The questionnaires covered the following broad topic areas:
The questionnaires for 10 and 12 year olds were very similar – the only difference being that a few questions were omitted for the younger age group in order to shorten the questionnaire a little. Questions were of four main types – fact-based items (eg age, genderand people lived with), satisfactionitems, agreement items and frequency items. An example of each of the last three types of items is shown in Box 3.
Basic characteristics (age, gender, country of birth)Living situation, home and family relationshipsMoney and economic circumstancesFriends and other relationshipsLocal areaSchoolTime use SelfOverall subjective well-beingChildren’s rights
Box 2: Overview of content of questionnaires
Box 3: Examples of satisfaction, agreement and frequency items
Type of item Example question Response options
Satisfaction How satisfied37 are you with the area where you live, in general?
An 11-point (0 to 10) scale where 0 = ‘Not at all satisfied’ and 10 = ‘Totally satisfied’
Agreement I feel safe at school A five-point agreement scale with options labelled as ‘I do not agree’, ‘Agree a little bit’, ‘Agree somewhat’, ‘Agree a lot’, ‘Totally agree’. There was also a ‘Don’t know’ option.
Frequency How often do you usually spend time ... doing homework
A four-point frequency scale with options labelled as ‘Rarely or never’, ‘Less than once a week’, ‘Once or twice a week’, ‘Every day or almost every day’.There was also a ‘Don’t know’ option.
34
The Good Childhood 2015 Comparing children’s subjective well-being in England and other countries
The purpose of this chapterThe purpose of this chapter is to provide an overview of the findings from the England survey, making comparisons with the other countries participating in the survey.
The findings are presented in topic-based sections, as indicated in the list in Box 2. Each section follows the same format, being divided into two sub-sections – the first providing overview statistics for England and discussing age group and gender variations; and the second discussing international comparisons – looking specifically at the ways in which the findings in England are similar or differ from those for other countries.
The chapter concludes with some overview statistics and a summary of the key points from the analysis. The implications of the findings in relation to the well-being of children in England are discussed in the final chapter of the report.
Presentation of statisticsInevitably, in all countries participating in the survey, there were differences between the planned survey and the final survey achieved. This could be due to variation in school class sizes, absence or non-participation of some children in the selected class, and difficulties recruiting schools, overall or in particular strata. So, for each country, weightings were calculated to correct for these
factors and to make the findings as representative as possible of the broader population of children. All data reported in this chapter is weighted on this basis. Where summary statistics are presented for both age groups combined the data is also equally weighted by age group. In addition, where pooled summary statistics are presented for the other 14 countries, these are weighted equally by country. Statistical analysis took into account the design of the survey (weighting, stratification and clustering). All findings identified as statistically significant relate to a p-value of less than 0.01 (99% confidence).
Percentages in tables and figures are rounded to the nearest whole percentage so totals may not add up to exactly 100%.
Some of the analysis relates to children with ‘low satisfaction’ on a particular aspect of life. This means a response of four or lower on the 11-point scale used for satisfaction questions (see Box 3).
Making international comparisonsIt is important to acknowledge that making international comparisons of children’s lives and well-being can be challenging. First, there are issues regarding possible differences in the way people respond to subjective questions. This issue is discussed further later in this chapter. Second, it
is important to view the findings within the context of social, economic and cultural differences between countries. For example, the UK had the third highest (after Norway and Germany) per capita GDP among the 15 countries included in this phase of the survey and this will have a bearing on some of the differences observed. These types of issues should be borne in mind in reading the findings in this chapter, and are discussed more fully in the international comparative report.
Family and home
Overview statistics for EnglandThe questionnaire included five agreement questions about family and home life and four satisfaction questions. (There were also three questions about frequency of doing things with family, but these are discussed in the time use section).Children’s responses to the agreement questions are shown in Table 2. There were fairly high levels of agreement with all five items. It is encouraging that over three-quarters (77%) of children said that they felt totally safe at home. The lowest level of agreement related to having a quiet place to study at home – more than one in five (21%) of children agreed ‘not at all’ or ‘a little’ with this statement.
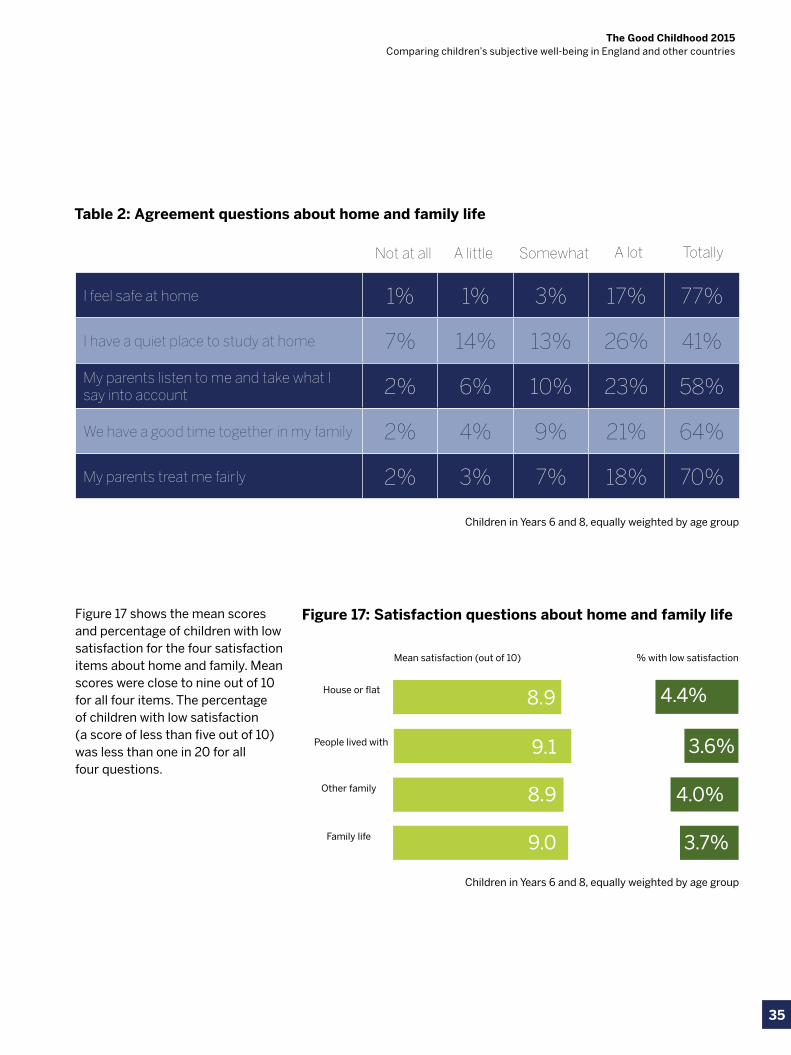
35
The Good Childhood 2015 Comparing children’s subjective well-being in England and other countries
Figure 17 shows the mean scores and percentage of children with low satisfaction for the four satisfaction items about home and family. Mean scores were close to nine out of 10 for all four items. The percentage of children with low satisfaction (a score of less than five out of 10) was less than one in 20 for all four questions.
I feel safe at home 1% 1% 3% 17% 77%
I have a quiet place to study at home 7% 14% 13% 26% 41%
My parents listen to me and take what I say into account 2% 6% 10% 23% 58%
We have a good time together in my family 2% 4% 9% 21% 64%
My parents treat me fairly 2% 3% 7% 18% 70%
Not at all A little Somewhat A lot Totally
Table 2: Agreement questions about home and family life
Figure 17: Satisfaction questions about home and family life
Mean satisfaction (out of 10) % with low satisfaction
8.9House or flat
9.1
8.9
People lived with
Other family
4.4%
3.6%
4.0%
9.0Family life 3.7%
Children in Years 6 and 8, equally weighted by age group
Children in Years 6 and 8, equally weighted by age group
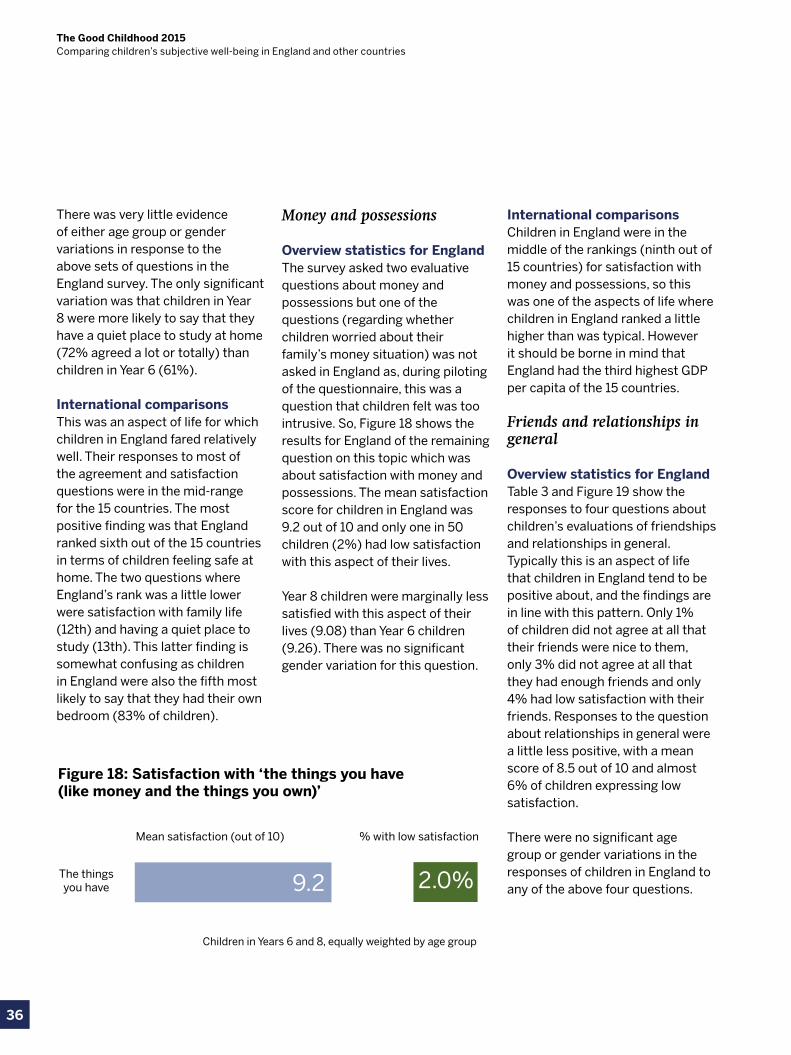
36
The Good Childhood 2015 Comparing children’s subjective well-being in England and other countries
There was very little evidence of either age group or gender variations in response to the above sets of questions in the England survey. The only significant variation was that children in Year 8 were more likely to say that they have a quiet place to study at home (72% agreed a lot or totally) than children in Year 6 (61%).
International comparisonsThis was an aspect of life for which children in England fared relatively well. Their responses to most of the agreement and satisfaction questions were in the mid-range for the 15 countries. The most positive finding was that England ranked sixth out of the 15 countries in terms of children feeling safe at home. The two questions where England’s rank was a little lower were satisfaction with family life (12th) and having a quiet place to study (13th). This latter finding is somewhat confusing as children in England were also the fifth most likely to say that they had their own bedroom (83% of children).
Money and possessions
Overview statistics for EnglandThe survey asked two evaluative questions about money and possessions but one of the questions (regarding whether children worried about their family’s money situation) was not asked in England as, during piloting of the questionnaire, this was a question that children felt was too intrusive. So, Figure 18 shows the results for England of the remaining question on this topic which was about satisfaction with money and possessions. The mean satisfaction score for children in England was 9.2 out of 10 and only one in 50 children (2%) had low satisfaction with this aspect of their lives.
Year 8 children were marginally less satisfied with this aspect of their lives (9.08) than Year 6 children (9.26). There was no significant gender variation for this question.
International comparisonsChildren in England were in the middle of the rankings (ninth out of 15 countries) for satisfaction with money and possessions, so this was one of the aspects of life where children in England ranked a little higher than was typical. However it should be borne in mind that England had the third highest GDP per capita of the 15 countries.
Friends and relationships in general
Overview statistics for EnglandTable 3 and Figure 19 show the responses to four questions about children’s evaluations of friendships and relationships in general. Typically this is an aspect of life that children in England tend to be positive about, and the findings are in line with this pattern. Only 1% of children did not agree at all that their friends were nice to them, only 3% did not agree at all that they had enough friends and only 4% had low satisfaction with their friends. Responses to the question about relationships in general were a little less positive, with a mean score of 8.5 out of 10 and almost 6% of children expressing low satisfaction.
There were no significant age group or gender variations in the responses of children in England to any of the above four questions.
Figure 18: Satisfaction with ‘the things you have (like money and the things you own)’
Mean satisfaction (out of 10) % with low satisfaction
9.2The things you have 2.0%
Children in Years 6 and 8, equally weighted by age group
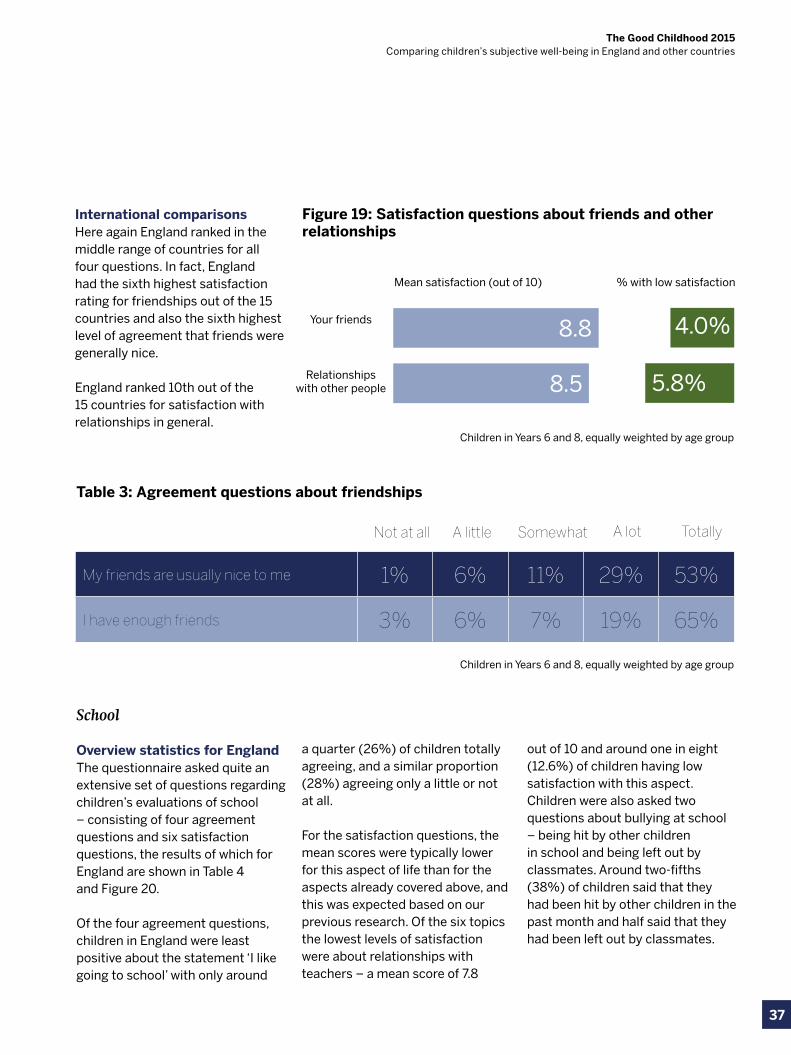
37
The Good Childhood 2015 Comparing children’s subjective well-being in England and other countries
School
Overview statistics for EnglandThe questionnaire asked quite an extensive set of questions regarding children’s evaluations of school – consisting of four agreement questions and six satisfaction questions, the results of which for England are shown in Table 4 and Figure 20.
Of the four agreement questions, children in England were least positive about the statement ‘I like going to school’ with only around
a quarter (26%) of children totally agreeing, and a similar proportion (28%) agreeing only a little or not at all.
For the satisfaction questions, the mean scores were typically lower for this aspect of life than for the aspects already covered above, and this was expected based on our previous research. Of the six topics the lowest levels of satisfaction were about relationships with teachers – a mean score of 7.8
out of 10 and around one in eight (12.6%) of children having low satisfaction with this aspect.Children were also asked two questions about bullying at school – being hit by other children in school and being left out by classmates. Around two-fifths (38%) of children said that they had been hit by other children in the past month and half said that they had been left out by classmates.
Table 3: Agreement questions about friendships
Children in Years 6 and 8, equally weighted by age group
My friends are usually nice to me 1% 6% 11% 29% 53%
I have enough friends 3% 6% 7% 19% 65%
Not at all A little Somewhat A lot Totally
Mean satisfaction (out of 10) % with low satisfaction
8.8Your friends 4.0%
8.5Relationships
with other people 5.8%
Figure 19: Satisfaction questions about friends and other relationships
Children in Years 6 and 8, equally weighted by age group
International comparisonsHere again England ranked in the middle range of countries for all four questions. In fact, England had the sixth highest satisfaction rating for friendships out of the 15 countries and also the sixth highest level of agreement that friends were generally nice.
England ranked 10th out of the 15 countries for satisfaction with relationships in general.
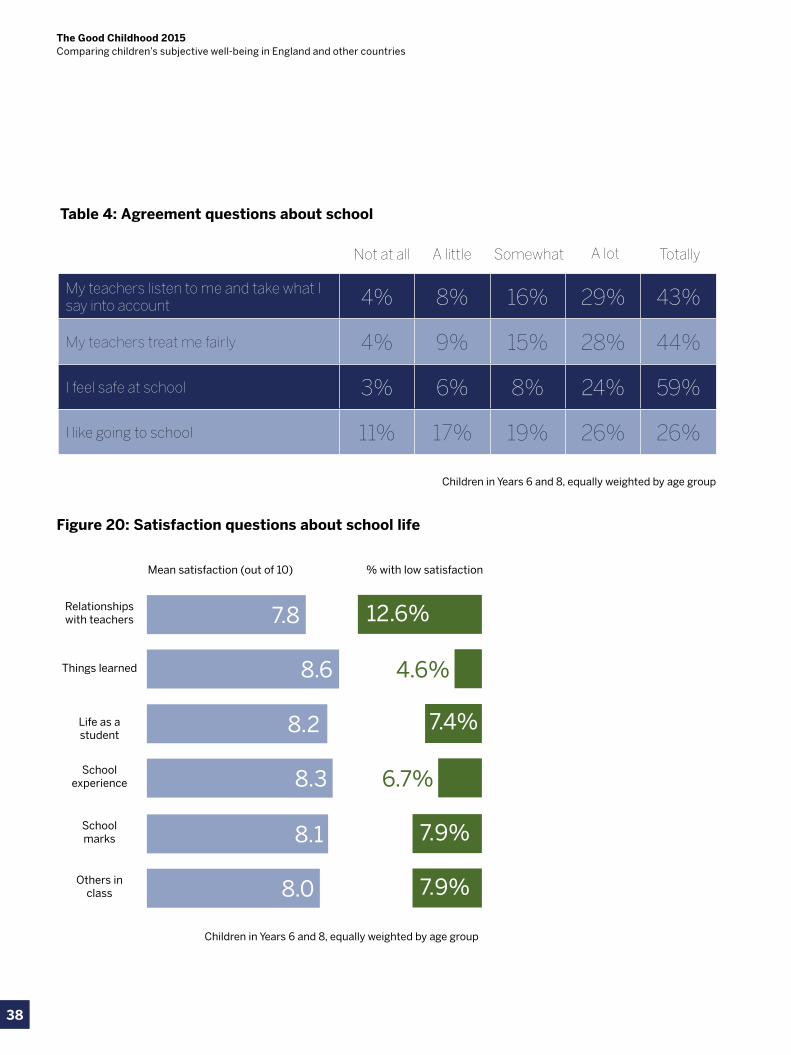
38
The Good Childhood 2015 Comparing children’s subjective well-being in England and other countries
Figure 20: Satisfaction questions about school life
Mean satisfaction (out of 10) % with low satisfaction
7.8Relationships with teachers 12.6%
8.6Things learned 4.6%
8.2Life as a student
7.4%
8.3School
experience 6.7%
8.1School marks 7.9%
8.0Others in
class 7.9%
Children in Years 6 and 8, equally weighted by age group
Table 4: Agreement questions about school
Children in Years 6 and 8, equally weighted by age group
My teachers listen to me and take what I say into account 4% 8% 16% 29% 43%
My teachers treat me fairly 4% 9% 15% 28% 44%
I feel safe at school 3% 6% 8% 24% 59%
I like going to school 11% 17% 19% 26% 26%
Not at all A little Somewhat A lot Totally
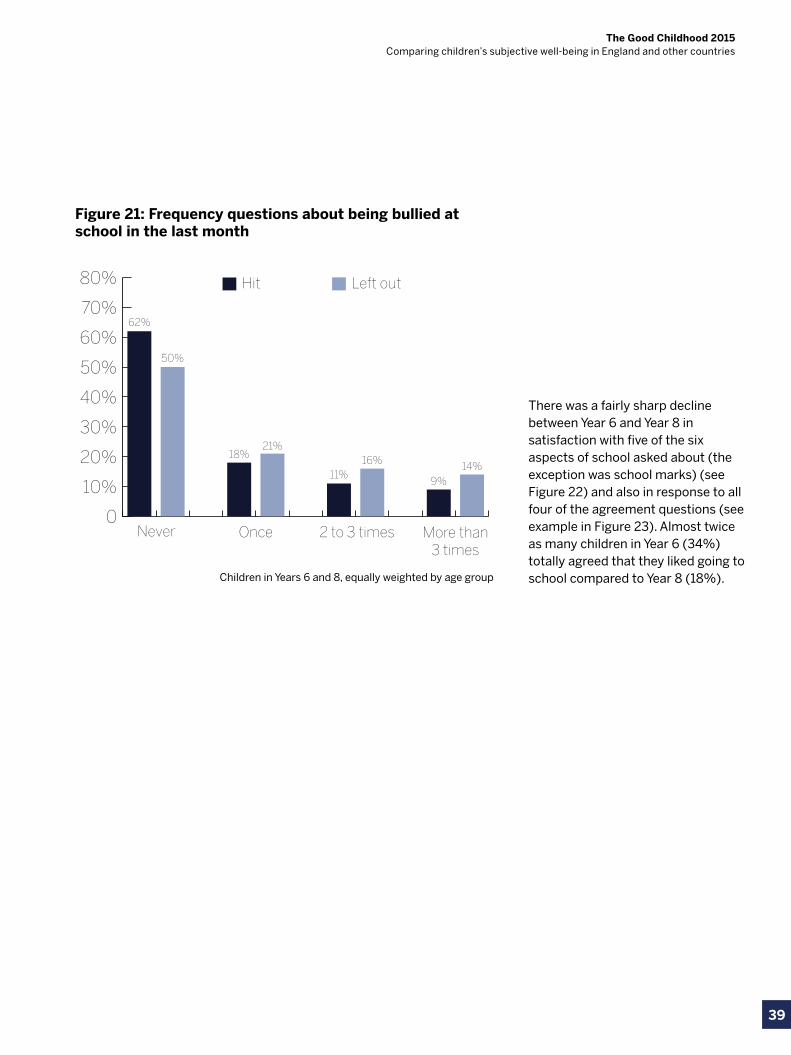
39
The Good Childhood 2015 Comparing children’s subjective well-being in England and other countries
0
10%
20%
30%
40%
50%
60%
70%
80% Hit Left out
Never Once 2 to 3 times More than 3 times
62%
50%
18%21%
11%16%
9%14%
Figure 21: Frequency questions about being bullied at school in the last month
Children in Years 6 and 8, equally weighted by age group
There was a fairly sharp decline between Year 6 and Year 8 in satisfaction with five of the six aspects of school asked about (the exception was school marks) (see Figure 22) and also in response to all four of the agreement questions (see example in Figure 23). Almost twice as many children in Year 6 (34%) totally agreed that they liked going to school compared to Year 8 (18%).
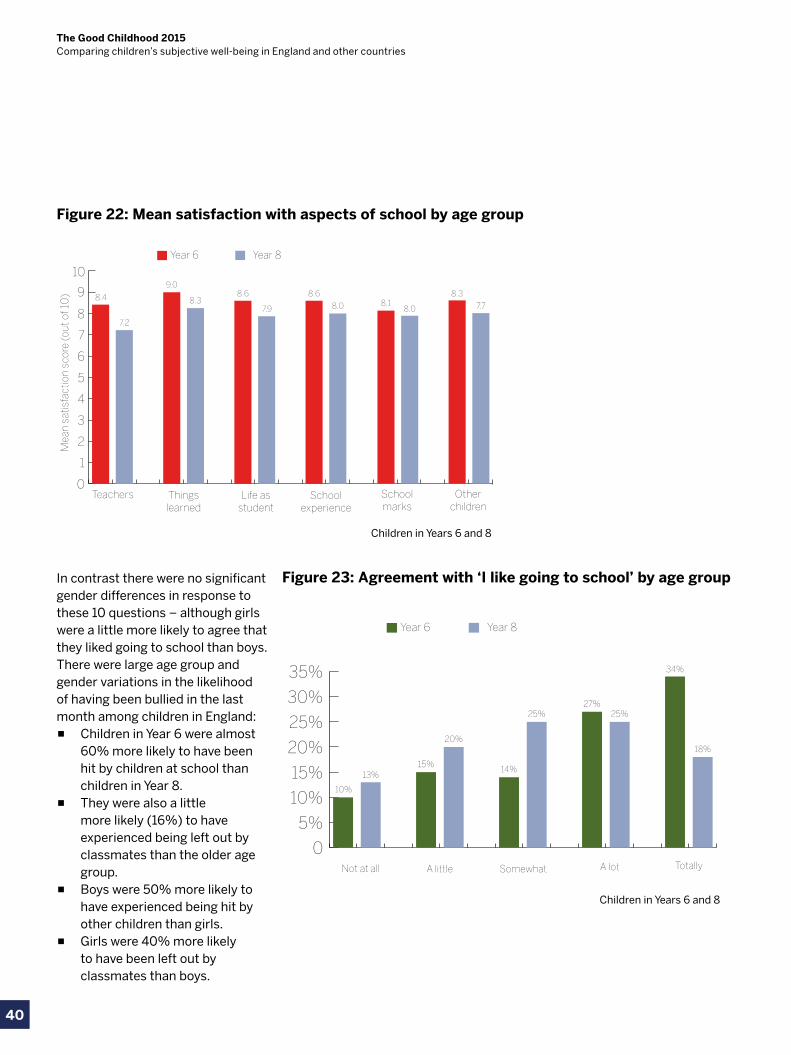
40
The Good Childhood 2015 Comparing children’s subjective well-being in England and other countries
Figure 22: Mean satisfaction with aspects of school by age group
0
1
2
3
4
5
6
7
8
9
10
Year 6 Year 8
Teachers Things learned
Life as student
School experience
School marks
Other children
Mea
n sa
tisfa
ctio
n sc
ore
(out
of 1
0) 8.4
7.2
9.0
8.38.6
7.9
8.6
8.0 8.18.0
8.3
7.7
Figure 23: Agreement with ‘I like going to school’ by age group
Year 6 Year 8
Not at all A little Somewhat A lot Totally
0
5%
10%
15%
20%
25%
30%
35%
10%
13%15%
20%
14%
25%27%
25%
34%
18%
In contrast there were no significant gender differences in response to these 10 questions – although girls were a little more likely to agree that they liked going to school than boys.There were large age group and gender variations in the likelihood of having been bullied in the last month among children in England:
▪ Children in Year 6 were almost 60% more likely to have been hit by children at school than children in Year 8.
▪ They were also a little more likely (16%) to have experienced being left out by classmates than the older age group.
▪ Boys were 50% more likely to have experienced being hit by other children than girls.
▪ Girls were 40% more likely to have been left out by classmates than boys.
Children in Years 6 and 8
Children in Years 6 and 8
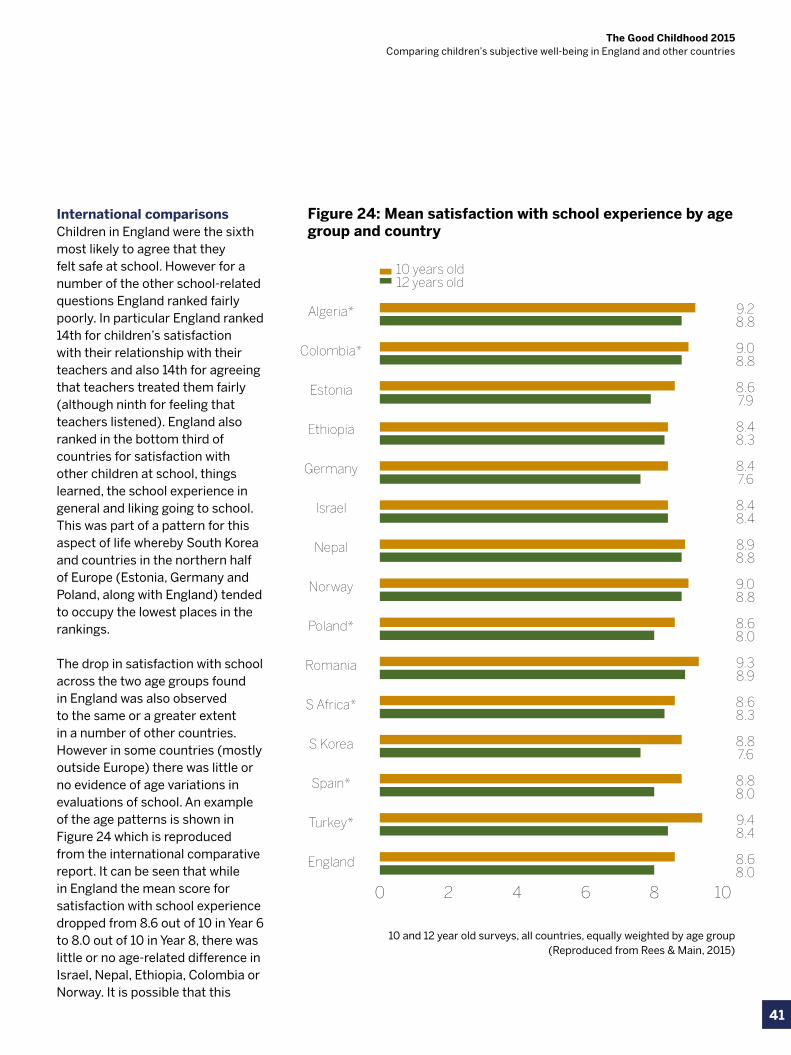
41
The Good Childhood 2015 Comparing children’s subjective well-being in England and other countries
International comparisonsChildren in England were the sixth most likely to agree that they felt safe at school. However for a number of the other school-related questions England ranked fairly poorly. In particular England ranked 14th for children’s satisfaction with their relationship with their teachers and also 14th for agreeing that teachers treated them fairly (although ninth for feeling that teachers listened). England also ranked in the bottom third of countries for satisfaction with other children at school, things learned, the school experience in general and liking going to school. This was part of a pattern for this aspect of life whereby South Korea and countries in the northern half of Europe (Estonia, Germany and Poland, along with England) tended to occupy the lowest places in the rankings.
The drop in satisfaction with school across the two age groups found in England was also observed to the same or a greater extent in a number of other countries. However in some countries (mostly outside Europe) there was little or no evidence of age variations in evaluations of school. An example of the age patterns is shown in Figure 24 which is reproduced from the international comparative report. It can be seen that while in England the mean score for satisfaction with school experience dropped from 8.6 out of 10 in Year 6 to 8.0 out of 10 in Year 8, there was little or no age-related difference in Israel, Nepal, Ethiopia, Colombia or Norway. It is possible that this
Figure 24: Mean satisfaction with school experience by age group and country
10 and 12 year old surveys, all countries, equally weighted by age group(Reproduced from Rees & Main, 2015)
0 2 4 6 8 10
Algeria*
Colombia*
Estonia
Ethiopia
Germany
Israel
Nepal
Norway
Poland*
Romania
S Africa*
S Korea
Spain*
Turkey*
England
10 years old12 years old
Mean satisfaction (out of 10)
9.28.8
9.08.8
8.67.9
8.48.3
8.47.6
8.48.4
8.98.8
9.08.8
8.68.0
9.38.9
8.68.3
8.87.6
8.88.0
9.48.4
8.68.0
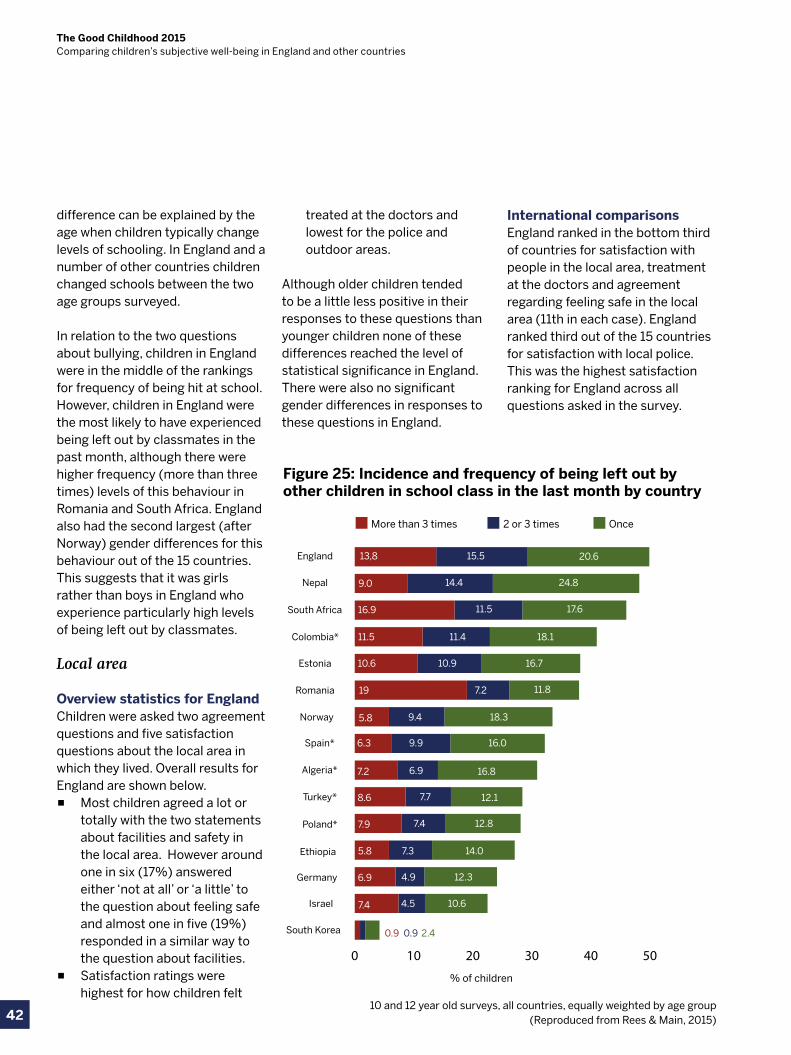
42
The Good Childhood 2015 Comparing children’s subjective well-being in England and other countries
difference can be explained by the age when children typically change levels of schooling. In England and a number of other countries children changed schools between the two age groups surveyed.
In relation to the two questions about bullying, children in England were in the middle of the rankings for frequency of being hit at school. However, children in England were the most likely to have experienced being left out by classmates in the past month, although there were higher frequency (more than three times) levels of this behaviour in Romania and South Africa. England also had the second largest (after Norway) gender differences for this behaviour out of the 15 countries. This suggests that it was girls rather than boys in England who experience particularly high levels of being left out by classmates.
Local area
Overview statistics for EnglandChildren were asked two agreement questions and five satisfaction questions about the local area in which they lived. Overall results for England are shown below.
▪ Most children agreed a lot or totally with the two statements about facilities and safety in the local area. However around one in six (17%) answered either ‘not at all’ or ‘a little’ to the question about feeling safe and almost one in five (19%) responded in a similar way to the question about facilities.
▪ Satisfaction ratings were highest for how children felt
treated at the doctors and lowest for the police and outdoor areas.
Although older children tended to be a little less positive in their responses to these questions than younger children none of these differences reached the level of statistical significance in England. There were also no significant gender differences in responses to these questions in England.
International comparisonsEngland ranked in the bottom third of countries for satisfaction with people in the local area, treatment at the doctors and agreement regarding feeling safe in the local area (11th in each case). England ranked third out of the 15 countries for satisfaction with local police. This was the highest satisfaction ranking for England across all questions asked in the survey.
Figure 25: Incidence and frequency of being left out by other children in school class in the last month by country
0 10 20 30 40 50
Norway
Colombia*
Poland*
Nepal
Turkey*
Romania
Ethiopia
South Africa
Spain*
Algeria*
Germany
Israel
South Korea
England
Estonia
13,8
9.0
16.9
11.5
10.6
19
5.8
6.3
8.6
7.9
5.8
6.9
7.4
0.9
7.2
15.5
14.4
11.5
11.4
10.9
7.2
9.4
9.9
7.7
7.4
7.3
4.9
4.5
46.6
6.9
20.6
24.8
17.6
18.1
16.7
11.8
18.3
16.0
12.1
12.8
14.0
12.3
10.6
36
16.8
% of children
More than 3 times 2 or 3 times Once
0.9 2.4
10 and 12 year old surveys, all countries, equally weighted by age group(Reproduced from Rees & Main, 2015)
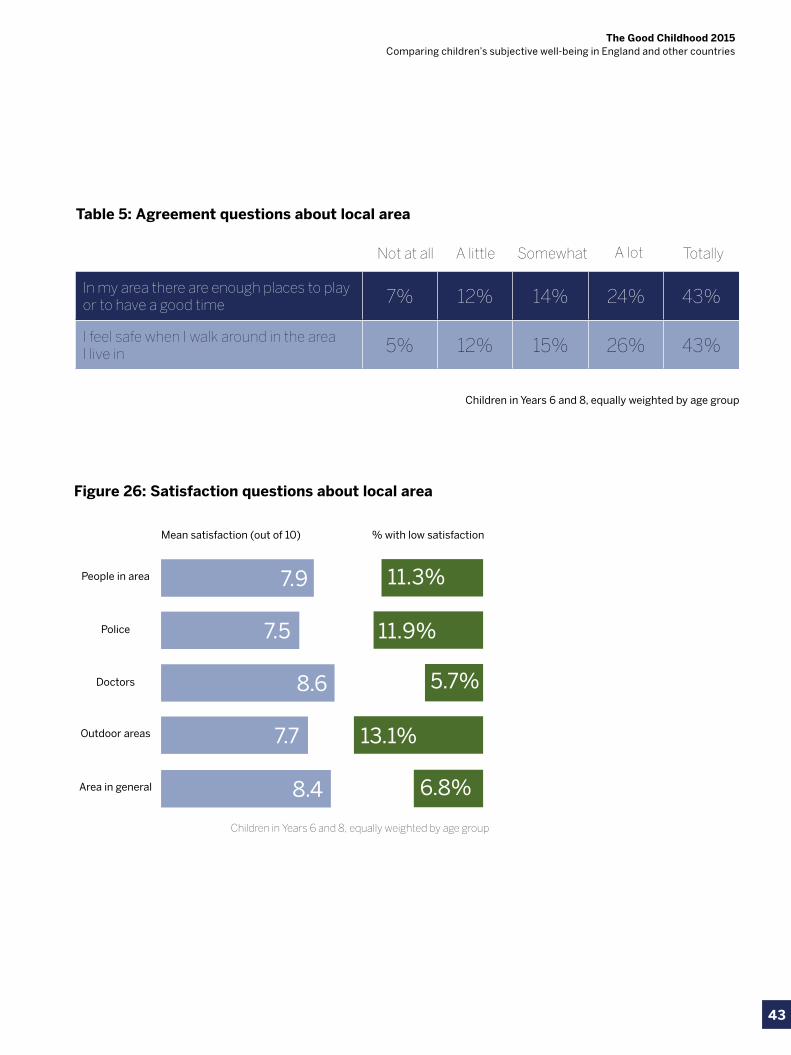
43
The Good Childhood 2015 Comparing children’s subjective well-being in England and other countries
Table 5: Agreement questions about local area
Children in Years 6 and 8, equally weighted by age group
In my area there are enough places to play or to have a good time 7% 12% 14% 24% 43%
I feel safe when I walk around in the area I live in 5% 12% 15% 26% 43%
Figure 26: Satisfaction questions about local area
Mean satisfaction (out of 10) % with low satisfaction
7.9People in area 11.3%
7.5Police 11.9%
8.6Doctors 5.7%
7.7Outdoor areas 13.1%
8.4Area in general 6.8%
Children in Years 6 and 8, equally weighted by age group
Not at all A little Somewhat A lot Totally
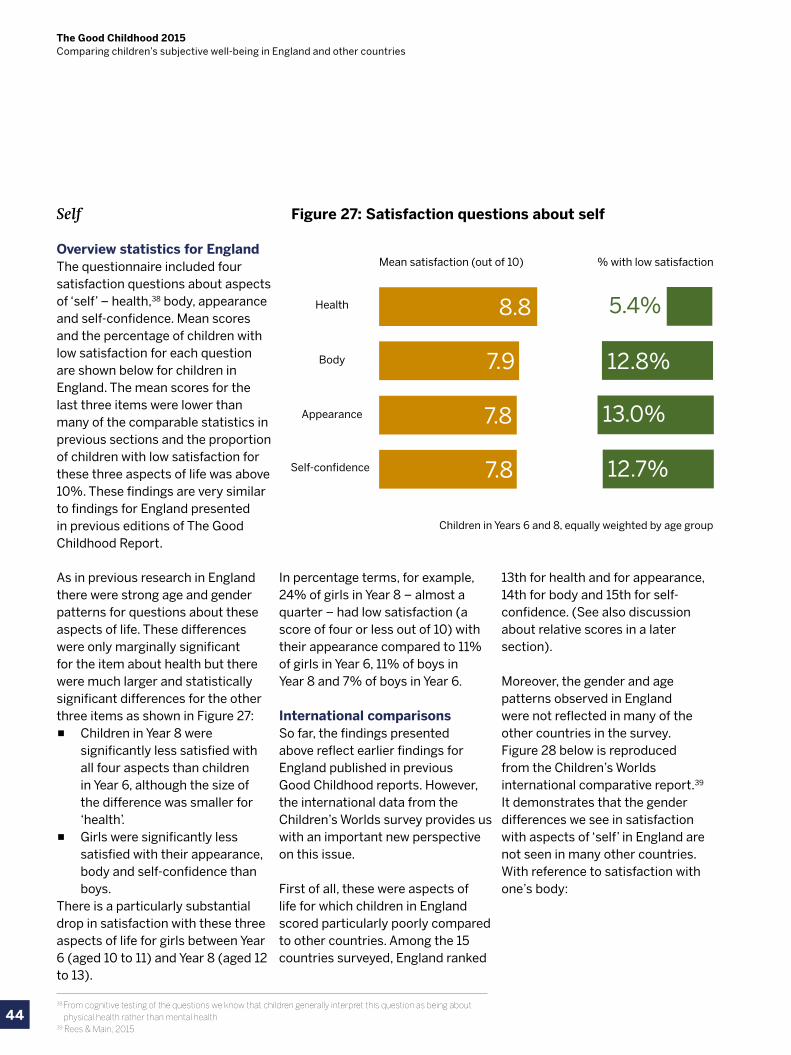
44
The Good Childhood 2015 Comparing children’s subjective well-being in England and other countries
As in previous research in England there were strong age and gender patterns for questions about these aspects of life. These differences were only marginally significant for the item about health but there were much larger and statistically significant differences for the other three items as shown in Figure 27:
▪ Children in Year 8 were significantly less satisfied with all four aspects than children in Year 6, although the size of the difference was smaller for ‘health’.
▪ Girls were significantly less satisfied with their appearance, body and self-confidence than boys.
There is a particularly substantial drop in satisfaction with these three aspects of life for girls between Year 6 (aged 10 to 11) and Year 8 (aged 12 to 13).
In percentage terms, for example, 24% of girls in Year 8 – almost a quarter – had low satisfaction (a score of four or less out of 10) with their appearance compared to 11% of girls in Year 6, 11% of boys in Year 8 and 7% of boys in Year 6.
International comparisonsSo far, the findings presented above reflect earlier findings for England published in previous Good Childhood reports. However, the international data from the Children’s Worlds survey provides us with an important new perspective on this issue.
First of all, these were aspects of life for which children in England scored particularly poorly compared to other countries. Among the 15 countries surveyed, England ranked
13th for health and for appearance, 14th for body and 15th for self- confidence. (See also discussion about relative scores in a later section).
Moreover, the gender and age patterns observed in England were not reflected in many of the other countries in the survey. Figure 28 below is reproduced from the Children’s Worlds international comparative report.39 It demonstrates that the gender differences we see in satisfaction with aspects of ‘self’ in England are not seen in many other countries. With reference to satisfaction with one’s body:
Figure 27: Satisfaction questions about self
Mean satisfaction (out of 10) % with low satisfaction
8.8Health 5.4%
7.9Body 12.8%
7.8Appearance 13.0%
7.8Self-confidence 12.7%
Children in Years 6 and 8, equally weighted by age group
Self
Overview statistics for EnglandThe questionnaire included four satisfaction questions about aspects of ‘self’ – health,38 body, appearance and self-confidence. Mean scores and the percentage of children with low satisfaction for each question are shown below for children in England. The mean scores for the last three items were lower than many of the comparable statistics in previous sections and the proportion of children with low satisfaction for these three aspects of life was above 10%. These findings are very similar to findings for England presented in previous editions of The Good Childhood Report.
38 From cognitive testing of the questions we know that children generally interpret this question as being about physical health rather than mental health39 Rees & Main, 2015
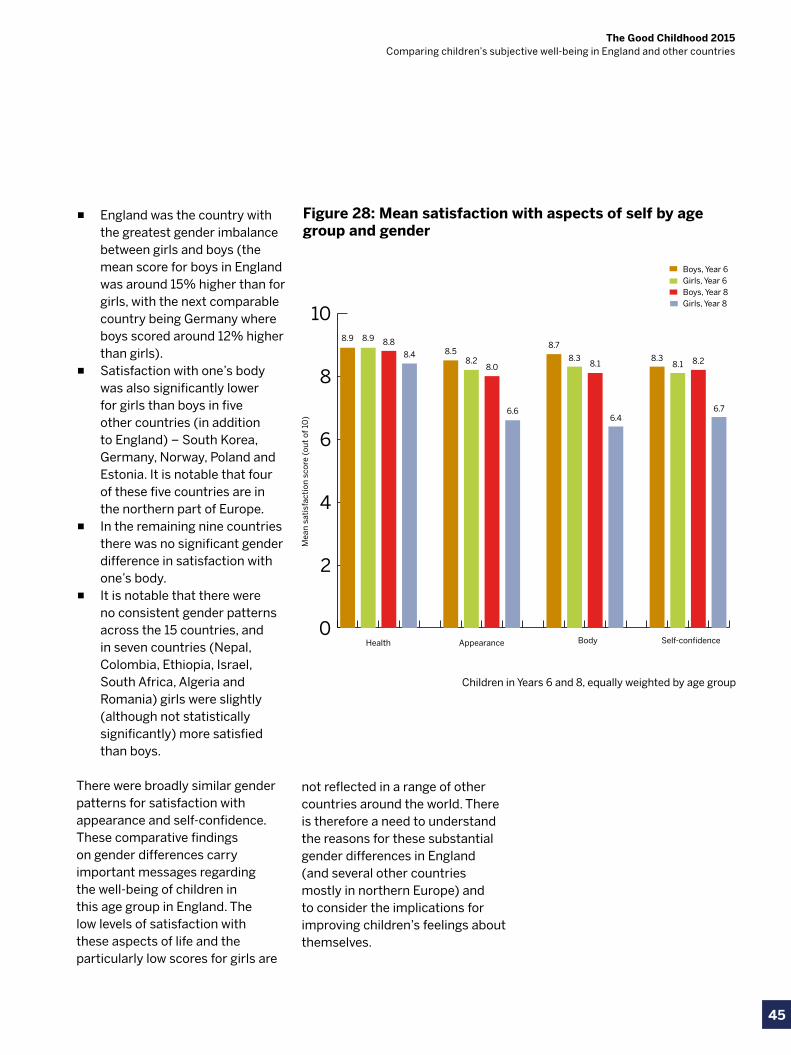
45
The Good Childhood 2015 Comparing children’s subjective well-being in England and other countries
▪ England was the country with the greatest gender imbalance between girls and boys (the mean score for boys in England was around 15% higher than for girls, with the next comparable country being Germany where boys scored around 12% higher than girls).
▪ Satisfaction with one’s body was also significantly lower for girls than boys in five other countries (in addition to England) – South Korea, Germany, Norway, Poland and Estonia. It is notable that four of these five countries are in the northern part of Europe.
▪ In the remaining nine countries there was no significant gender difference in satisfaction with one’s body.
▪ It is notable that there were no consistent gender patterns across the 15 countries, and in seven countries (Nepal, Colombia, Ethiopia, Israel, South Africa, Algeria and Romania) girls were slightly (although not statistically significantly) more satisfied than boys.
There were broadly similar gender patterns for satisfaction with appearance and self-confidence.These comparative findings on gender differences carry important messages regarding the well-being of children in this age group in England. The low levels of satisfaction with these aspects of life and the particularly low scores for girls are
not reflected in a range of other countries around the world. There is therefore a need to understand the reasons for these substantial gender differences in England (and several other countries mostly in northern Europe) and to consider the implications for improving children’s feelings about themselves.
Figure 28: Mean satisfaction with aspects of self by age group and gender
0
2
4
6
8
10
Boys, Year 6Girls, Year 6Boys, Year 8Girls, Year 8
8.9 8.9 8.8
8.4 8.58.2
8.0
6.6
8.7
8.38.1
6.4
8.38.1 8.2
6.7
Health Appearance Body Self-confidence
Mea
n s
atis
fact
ion
sco
re (
ou
t of
10
)
Children in Years 6 and 8, equally weighted by age group
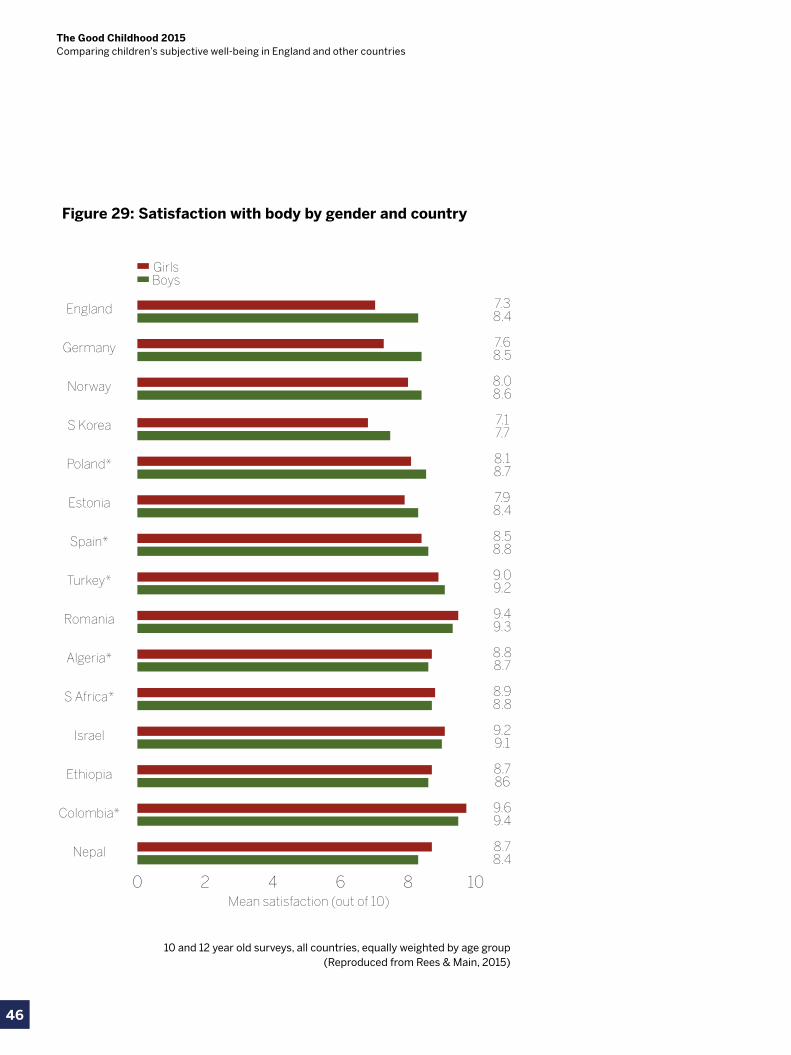
46
The Good Childhood 2015 Comparing children’s subjective well-being in England and other countries
Figure 29: Satisfaction with body by gender and country
0 2 4 6 8 10
England
Germany
Norway
S Korea
Poland*
Estonia
Spain*
Turkey*
Romania
Algeria*
S Africa*
Israel
Ethiopia
Colombia*
Nepal
GirlsBoys
Mean satisfaction (out of 10)
7.38.4
7.68.5
8.08.6
7.17.7
8.18.7
7.98.4
8.58.8
9.09.2
9.49.3
8.88.7
8.98.8
9.29.1
8.786
9.69.4
8.78.4
10 and 12 year old surveys, all countries, equally weighted by age group(Reproduced from Rees & Main, 2015)
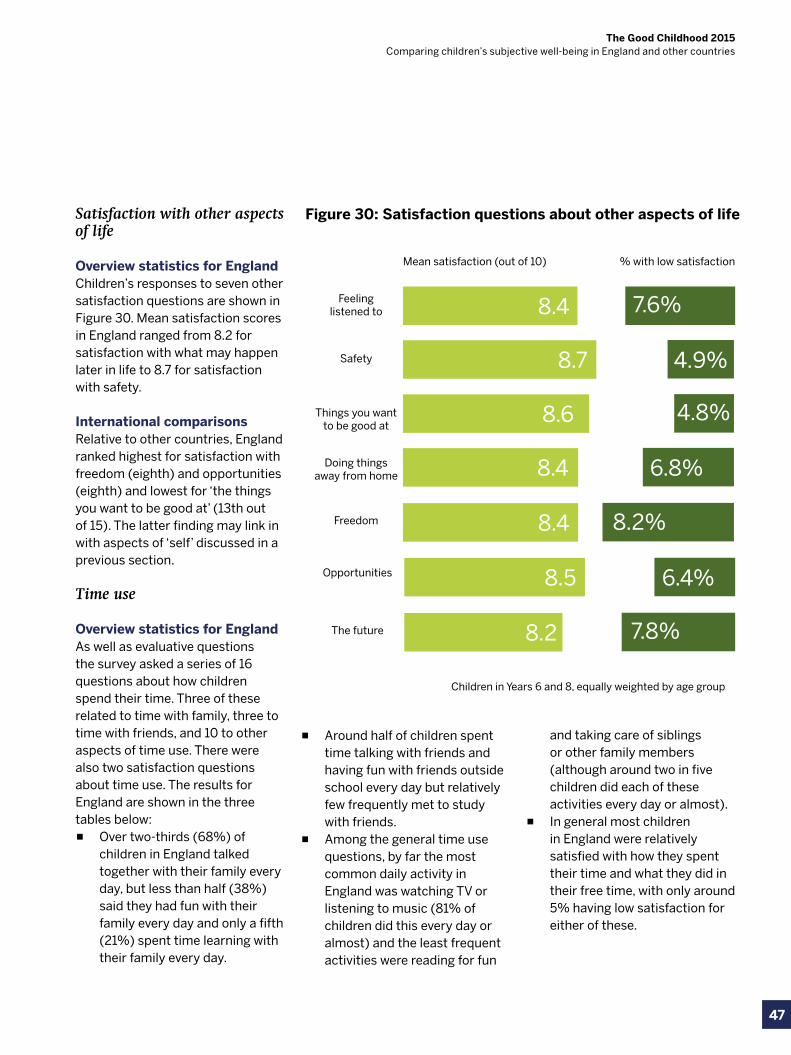
47
The Good Childhood 2015 Comparing children’s subjective well-being in England and other countries
Satisfaction with other aspects of life
Overview statistics for EnglandChildren’s responses to seven other satisfaction questions are shown in Figure 30. Mean satisfaction scores in England ranged from 8.2 for satisfaction with what may happen later in life to 8.7 for satisfaction with safety.
International comparisonsRelative to other countries, England ranked highest for satisfaction with freedom (eighth) and opportunities (eighth) and lowest for ‘the things you want to be good at’ (13th out of 15). The latter finding may link in with aspects of ‘self’ discussed in a previous section.
Time use
Overview statistics for EnglandAs well as evaluative questions the survey asked a series of 16 questions about how children spend their time. Three of these related to time with family, three to time with friends, and 10 to other aspects of time use. There were also two satisfaction questions about time use. The results for England are shown in the three tables below:
▪ Over two-thirds (68%) of children in England talked together with their family every day, but less than half (38%) said they had fun with their family every day and only a fifth (21%) spent time learning with their family every day.
▪ Around half of children spent time talking with friends and having fun with friends outside school every day but relatively few frequently met to study with friends.
▪ Among the general time use questions, by far the most common daily activity in England was watching TV or listening to music (81% of children did this every day or almost) and the least frequent activities were reading for fun
and taking care of siblings or other family members (although around two in five children did each of these activities every day or almost).
▪ In general most children in England were relatively satisfied with how they spent their time and what they did in their free time, with only around 5% having low satisfaction for either of these.
Figure 30: Satisfaction questions about other aspects of life
Children in Years 6 and 8, equally weighted by age group
Mean satisfaction (out of 10) % with low satisfaction
8.4Feeling listened to 7.6%
8.7Safety 4.9%
8.6Things you want to be good at
4.8%
8.4Doing things away from home 6.8%
8.4Freedom 8.2%
8.5Opportunities 6.4%
8.2The future 7.8%
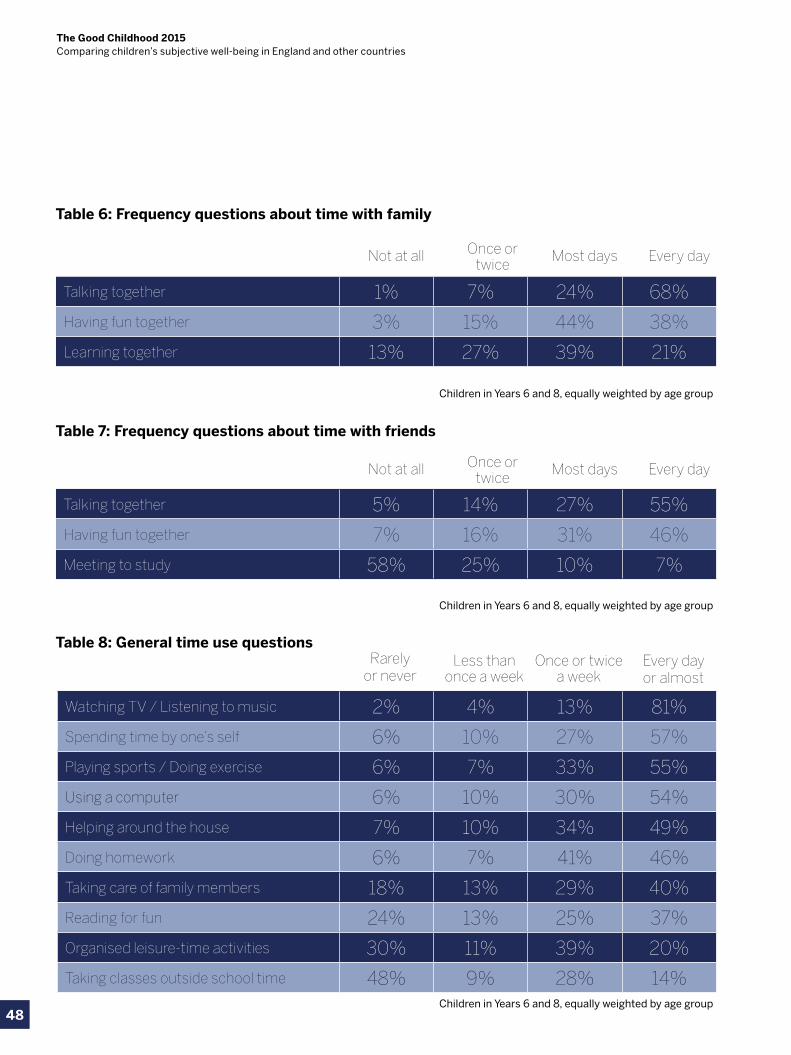
48
The Good Childhood 2015 Comparing children’s subjective well-being in England and other countries
Table 6: Frequency questions about time with family
Table 7: Frequency questions about time with friends
Table 8: General time use questions
Children in Years 6 and 8, equally weighted by age group
Children in Years 6 and 8, equally weighted by age group
Children in Years 6 and 8, equally weighted by age group
Children in Years 6 and 8, equally weighted by age group
Talking together 1% 7% 24% 68%
Having fun together 3% 15% 44% 38%
Learning together 13% 27% 39% 21%
Talking together 5% 14% 27% 55%
Having fun together 7% 16% 31% 46%
Meeting to study 58% 25% 10% 7%
Watching TV / Listening to music 2% 4% 13% 81%
Spending time by one’s self 6% 10% 27% 57%
Playing sports / Doing exercise 6% 7% 33% 55%
Using a computer 6% 10% 30% 54%
Helping around the house 7% 10% 34% 49%
Doing homework 6% 7% 41% 46%
Taking care of family members 18% 13% 29% 40%
Reading for fun 24% 13% 25% 37%
Organised leisure-time activities 30% 11% 39% 20%
Taking classes outside school time 48% 9% 28% 14%
Not at all
Not at all
Rarely or never
Once or twice
Once or twice
Less than once a week
Most days
Most days
Once or twice a week
Every day
Every day
Every day or almost
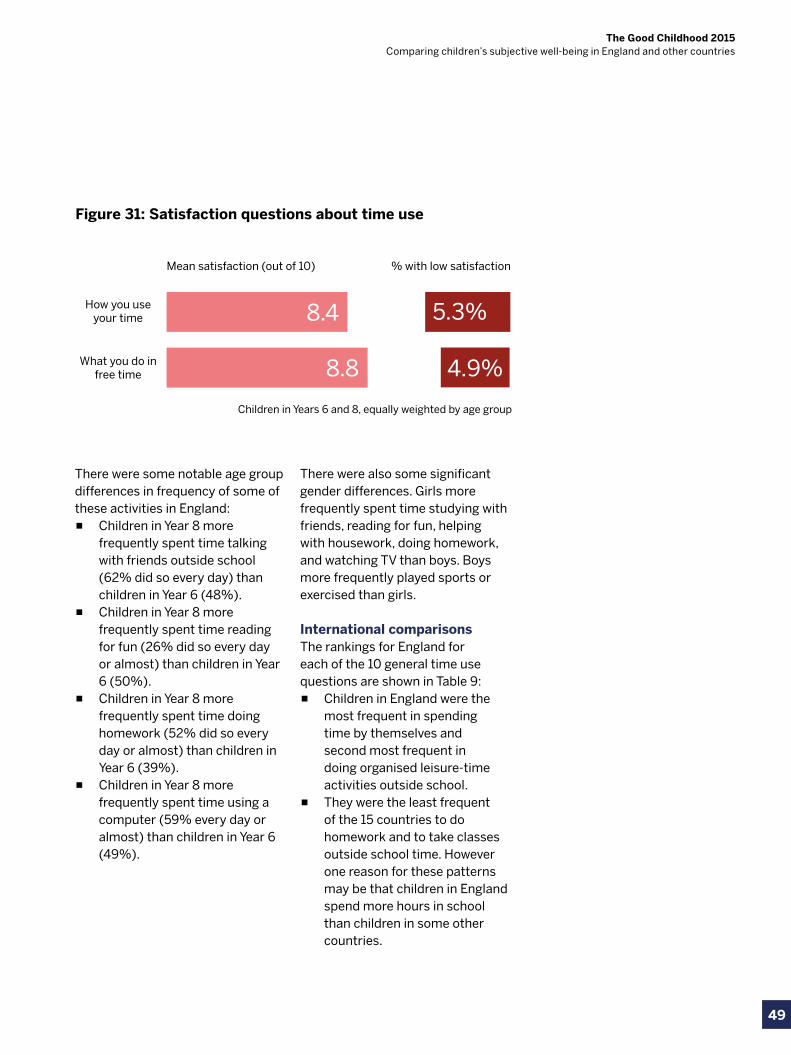
49
The Good Childhood 2015 Comparing children’s subjective well-being in England and other countries
Children in Years 6 and 8, equally weighted by age group
Figure 31: Satisfaction questions about time use
There were some notable age group differences in frequency of some of these activities in England:
▪ Children in Year 8 more frequently spent time talking with friends outside school (62% did so every day) than children in Year 6 (48%).
▪ Children in Year 8 more frequently spent time reading for fun (26% did so every day or almost) than children in Year 6 (50%).
▪ Children in Year 8 more frequently spent time doing homework (52% did so every day or almost) than children in Year 6 (39%).
▪ Children in Year 8 more frequently spent time using a computer (59% every day or almost) than children in Year 6 (49%).
There were also some significant gender differences. Girls more frequently spent time studying with friends, reading for fun, helping with housework, doing homework, and watching TV than boys. Boys more frequently played sports or exercised than girls.
International comparisonsThe rankings for England for each of the 10 general time use questions are shown in Table 9:
▪ Children in England were the most frequent in spending time by themselves and second most frequent in doing organised leisure-time activities outside school.
▪ They were the least frequent of the 15 countries to do homework and to take classes outside school time. However one reason for these patterns may be that children in England spend more hours in school than children in some other countries.
Mean satisfaction (out of 10) % with low satisfaction
8.4How you use your time 5.3%
8.8What you do in free time 4.9%
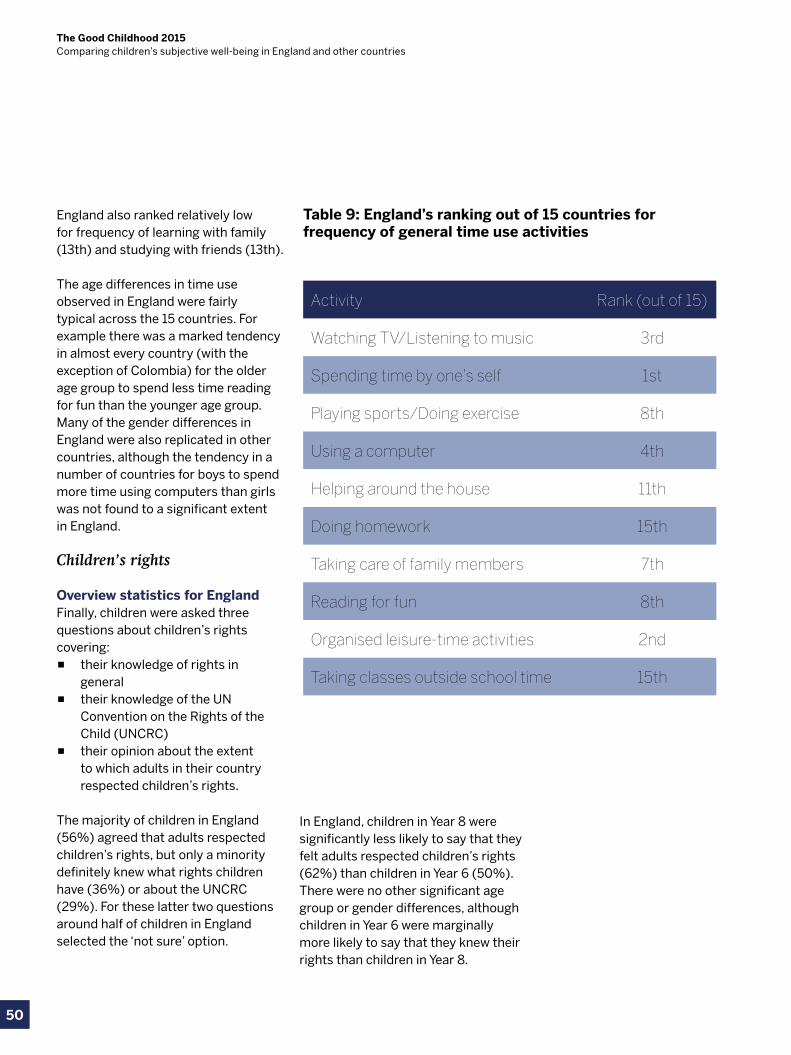
50
The Good Childhood 2015 Comparing children’s subjective well-being in England and other countries
England also ranked relatively low for frequency of learning with family (13th) and studying with friends (13th).
The age differences in time use observed in England were fairly typical across the 15 countries. For example there was a marked tendency in almost every country (with the exception of Colombia) for the older age group to spend less time reading for fun than the younger age group.Many of the gender differences in England were also replicated in other countries, although the tendency in a number of countries for boys to spend more time using computers than girls was not found to a significant extent in England.
Children’s rights
Overview statistics for EnglandFinally, children were asked three questions about children’s rights covering:
▪ their knowledge of rights in general
▪ their knowledge of the UN Convention on the Rights of the Child (UNCRC)
▪ their opinion about the extent to which adults in their country respected children’s rights.
The majority of children in England (56%) agreed that adults respected children’s rights, but only a minority definitely knew what rights children have (36%) or about the UNCRC (29%). For these latter two questions around half of children in England selected the ‘not sure’ option.
In England, children in Year 8 were significantly less likely to say that they felt adults respected children’s rights (62%) than children in Year 6 (50%). There were no other significant age group or gender differences, although children in Year 6 were marginally more likely to say that they knew their rights than children in Year 8.
Activity Rank (out of 15)
Watching TV/Listening to music 3rd
Spending time by one’s self 1st
Playing sports/Doing exercise 8th
Using a computer 4th
Helping around the house 11th
Doing homework 15th
Taking care of family members 7th
Reading for fun 8th
Organised leisure-time activities 2nd
Taking classes outside school time 15th
Table 9: England’s ranking out of 15 countries for frequency of general time use activities
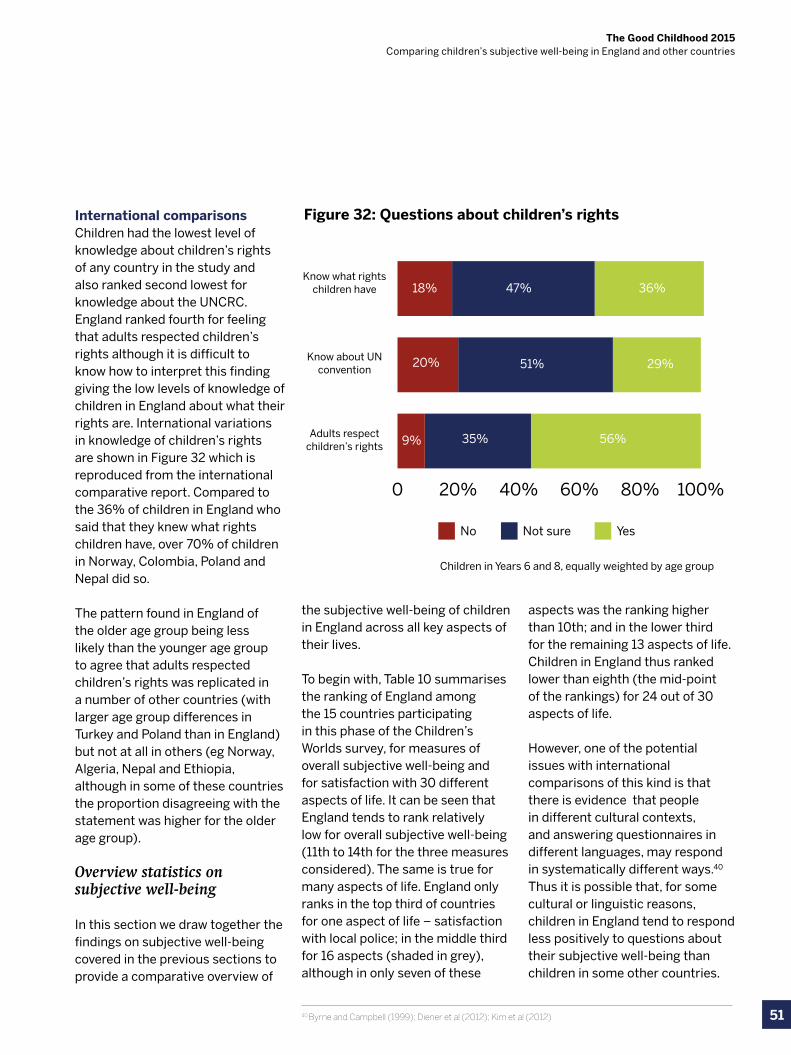
51
The Good Childhood 2015 Comparing children’s subjective well-being in England and other countries
International comparisonsChildren had the lowest level of knowledge about children’s rights of any country in the study and also ranked second lowest for knowledge about the UNCRC. England ranked fourth for feeling that adults respected children’s rights although it is difficult to know how to interpret this finding giving the low levels of knowledge of children in England about what their rights are. International variations in knowledge of children’s rights are shown in Figure 32 which is reproduced from the international comparative report. Compared to the 36% of children in England who said that they knew what rights children have, over 70% of children in Norway, Colombia, Poland and Nepal did so.
The pattern found in England of the older age group being less likely than the younger age group to agree that adults respected children’s rights was replicated in a number of other countries (with larger age group differences in Turkey and Poland than in England) but not at all in others (eg Norway, Algeria, Nepal and Ethiopia, although in some of these countries the proportion disagreeing with the statement was higher for the older age group).
Overview statistics on subjective well-being
In this section we draw together the findings on subjective well-being covered in the previous sections to provide a comparative overview of
the subjective well-being of children in England across all key aspects of their lives.
To begin with, Table 10 summarises the ranking of England among the 15 countries participating in this phase of the Children’s Worlds survey, for measures of overall subjective well-being and for satisfaction with 30 different aspects of life. It can be seen that England tends to rank relatively low for overall subjective well-being (11th to 14th for the three measures considered). The same is true for many aspects of life. England only ranks in the top third of countries for one aspect of life – satisfaction with local police; in the middle third for 16 aspects (shaded in grey), although in only seven of these
aspects was the ranking higher than 10th; and in the lower third for the remaining 13 aspects of life. Children in England thus ranked lower than eighth (the mid-point of the rankings) for 24 out of 30 aspects of life.
However, one of the potential issues with international comparisons of this kind is that there is evidence that people in different cultural contexts, and answering questionnaires in different languages, may respond in systematically different ways.40 Thus it is possible that, for some cultural or linguistic reasons, children in England tend to respond less positively to questions about their subjective well-being than children in some other countries.
Figure 32: Questions about children’s rights
0 20% 40% 60% 80% 100%
Know what rights children have
Know about UN convention
Adults respect children’s rights
18%
20%
9%
47%
51%
35%
36%
29%
56%
No Not sure Yes
Doesn’t add up to 100?
Children in Years 6 and 8, equally weighted by age group
40 Byrne and Campbell (1999); Diener et al (2012); Kim et al (2012)
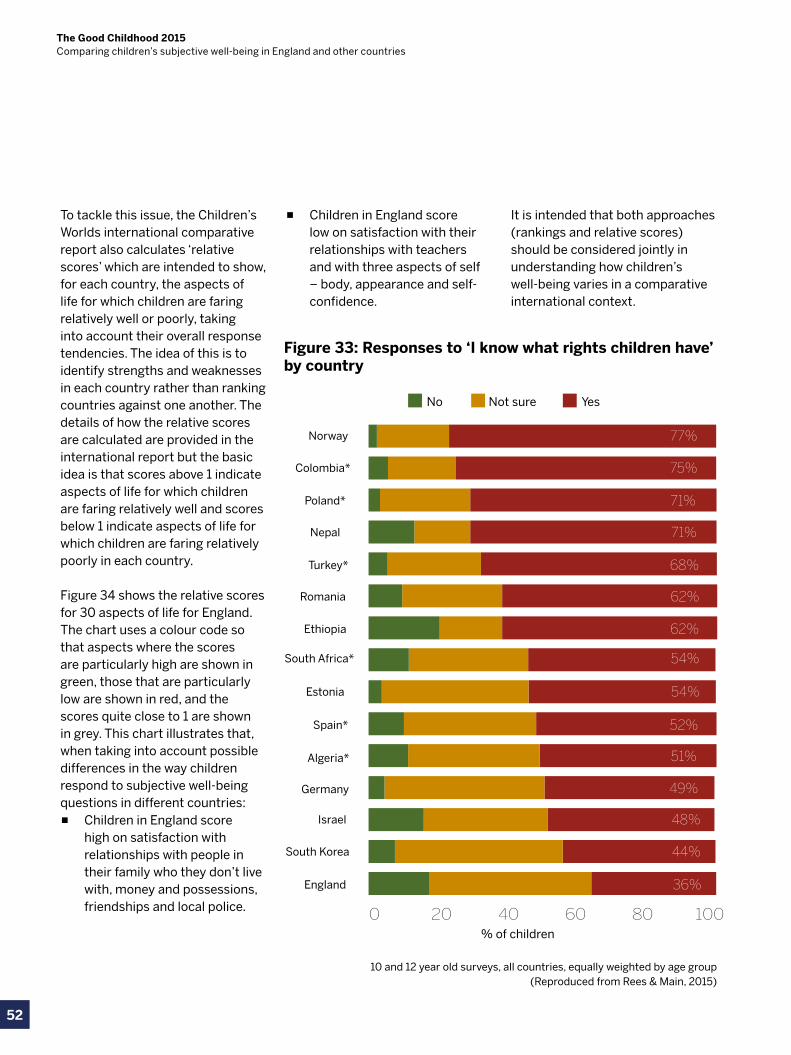
52
The Good Childhood 2015 Comparing children’s subjective well-being in England and other countries
To tackle this issue, the Children’s Worlds international comparative report also calculates ‘relative scores’ which are intended to show, for each country, the aspects of life for which children are faring relatively well or poorly, taking into account their overall response tendencies. The idea of this is to identify strengths and weaknesses in each country rather than ranking countries against one another. The details of how the relative scores are calculated are provided in the international report but the basic idea is that scores above 1 indicate aspects of life for which children are faring relatively well and scores below 1 indicate aspects of life for which children are faring relatively poorly in each country.
Figure 34 shows the relative scores for 30 aspects of life for England. The chart uses a colour code so that aspects where the scores are particularly high are shown in green, those that are particularly low are shown in red, and the scores quite close to 1 are shown in grey. This chart illustrates that, when taking into account possible differences in the way children respond to subjective well-being questions in different countries:
▪ Children in England score high on satisfaction with relationships with people in their family who they don’t live with, money and possessions, friendships and local police.
▪ Children in England score low on satisfaction with their relationships with teachers and with three aspects of self – body, appearance and self-confidence.
It is intended that both approaches (rankings and relative scores) should be considered jointly in understanding how children’s well-being varies in a comparative international context.
Figure 33: Responses to ‘I know what rights children have’ by country
0 20 40 60 80 100
Norway
Colombia*
Poland*
Nepal
Turkey*
Romania
Ethiopia
South Africa*
Spain*
Algeria*
Germany
Israel
South Korea
England
Estonia
77%
75%
71%
71%
68%
62%
62%
54%
52%
51%
49%
48%
44%
36%
54%
% of children
No Not sure Yes
10 and 12 year old surveys, all countries, equally weighted by age group(Reproduced from Rees & Main, 2015)
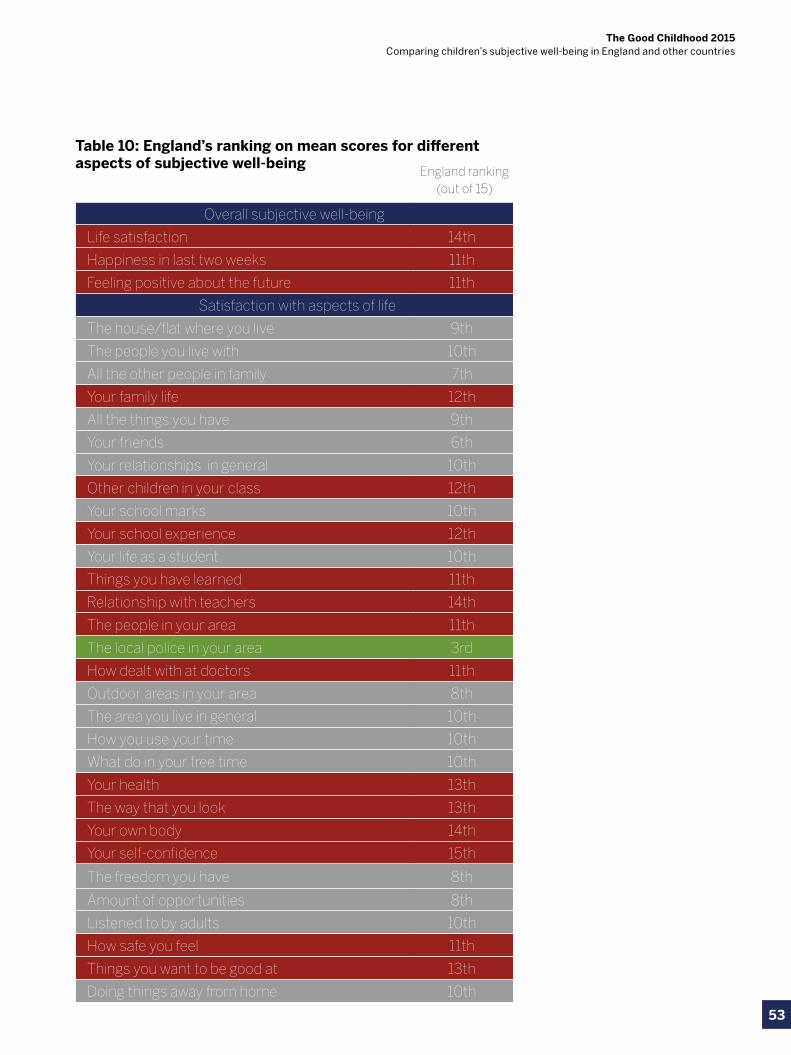
53
The Good Childhood 2015 Comparing children’s subjective well-being in England and other countries
Table 10: England’s ranking on mean scores for different aspects of subjective well-being
England ranking (out of 15)
Overall subjective well-being
Life satisfaction 14th
Happiness in last two weeks 11th
Feeling positive about the future 11th
Satisfaction with aspects of life
The house/flat where you live 9th
The people you live with 10th
All the other people in family 7th
Your family life 12th
All the things you have 9th
Your friends 6th
Your relationships in general 10th
Other children in your class 12th
Your school marks 10th
Your school experience 12th
Your life as a student 10th
Things you have learned 11th
Relationship with teachers 14th
The people in your area 11th
The local police in your area 3rd
How dealt with at doctors 11th
Outdoor areas in your area 8th
The area you live in general 10th
How you use your time 10th
What do in your free time 10th
Your health 13th
The way that you look 13th
Your own body 14th
Your self-confidence 15th
The freedom you have 8th
Amount of opportunities 8th
Listened to by adults 10th
How safe you feel 11th
Things you want to be good at 13th
Doing things away from home 10th
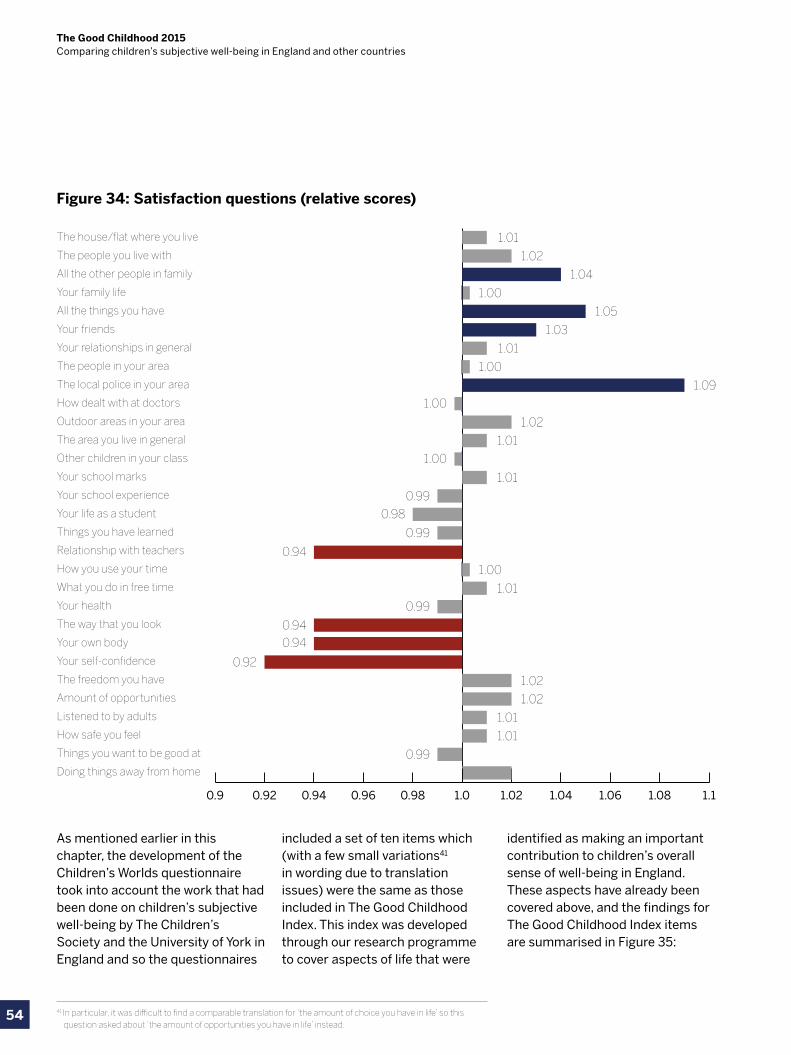
54
The Good Childhood 2015 Comparing children’s subjective well-being in England and other countries
As mentioned earlier in this chapter, the development of the Children’s Worlds questionnaire took into account the work that had been done on children’s subjective well-being by The Children’s Society and the University of York in England and so the questionnaires
included a set of ten items which (with a few small variations41 in wording due to translation issues) were the same as those included in The Good Childhood Index. This index was developed through our research programme to cover aspects of life that were
identified as making an important contribution to children’s overall sense of well-being in England. These aspects have already been covered above, and the findings for The Good Childhood Index items are summarised in Figure 35:
Figure 34: Satisfaction questions (relative scores)
1.02 1.04 1.06 1.08 1.10.9 0.92 0.94 0.96 0.98 1.0
The house/flat where you live
The people you live with
All the other people in family
Your family life
All the things you have
Your friends
Your relationships in general
The people in your area
The local police in your area
How dealt with at doctors
Outdoor areas in your area
The area you live in general
Other children in your class
Your school marks
Your school experience
Your life as a student
Things you have learned
Relationship with teachers
How you use your time
What you do in free time
Your health
The way that you look
Your own body
Your self-confidence
The freedom you have
Amount of opportunities
Listened to by adults
How safe you feel
Things you want to be good at
Doing things away from home
1.01
1.02
1.02
1.02
1.02
1.04
1.05
1.09
1.03
1.01
1.01
1.01
1.01
1.01
1.01
1.00
1.00
1.00
1.00
1.00
0.99
0.99
0.94
0.99
0.99
0.94
0.94
0.92
0.98
41 In particular, it was difficult to find a comparable translation for ‘the amount of choice you have in life’ so this question asked about ‘the amount of opportunities you have in life’ instead.
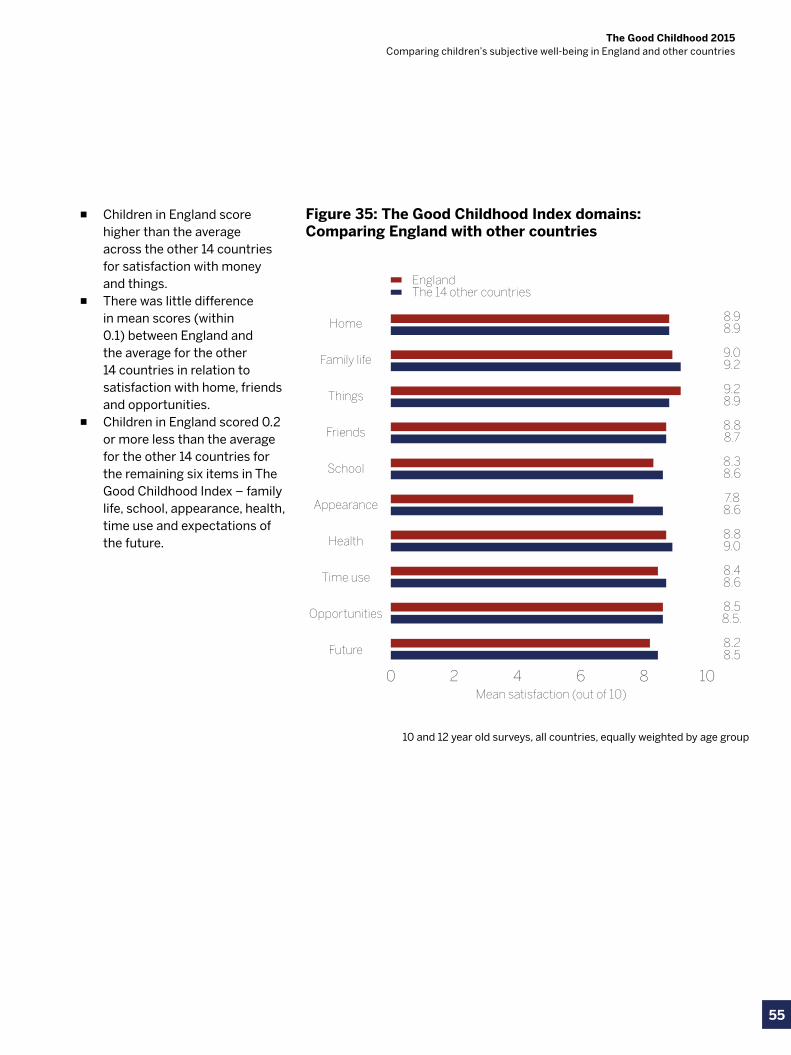
55
The Good Childhood 2015 Comparing children’s subjective well-being in England and other countries
Figure 35: The Good Childhood Index domains: Comparing England with other countries
0 2 4 6 8 10
Home
Family life
Things
Friends
School
Appearance
Health
Time use
Opportunities
Future
EnglandThe 14 other countries
Mean satisfaction (out of 10)
8.98.9
9.09.2
9.28.9
8.88.7
8.38.6
7.88.6
8.89.0
8.48.6
8.58.5.
8.28.5
▪ Children in England score higher than the average across the other 14 countries for satisfaction with money and things.
▪ There was little difference in mean scores (within 0.1) between England and the average for the other 14 countries in relation to satisfaction with home, friends and opportunities.
▪ Children in England scored 0.2 or more less than the average for the other 14 countries for the remaining six items in The Good Childhood Index – family life, school, appearance, health, time use and expectations of the future.
10 and 12 year old surveys, all countries, equally weighted by age group
56
The Good Childhood 2015 Comparing children’s subjective well-being in England and other countries
Summary of key points
A summary of the key points from the comparative analysis between England and other countries included in the Children’s Worlds survey is as follows:
▪ Comparing the rankings of mean satisfaction scores across the 15 countries:
▪ Overall, children in England have relatively low levels of subjective well-being compared to other countries included in the Children’s Worlds survey. England ranked 14th out of 15 countries for life satisfaction and 11th for recent feelings of happiness and feeling positive about the future.
▪ Children in England also tended to rank low for satisfaction with different aspects of life. They ranked lower than eighth out of the 15 countries for 24 out of 30 aspects of life. England ranked highest (third) for satisfaction with local police and lowest (15th) for self-confidence.
▪ However there are potential limitations to international comparisons based on comparing mean scores. So the Children’s Worlds international report also identifies key aspects of life where children in each country are scoring much higher or lower than is typical across the survey topics as a whole. On this basis:
▪ Children have relatively high satisfaction with four aspects of life – relationships with people in their family who they don’t live with, money and possessions, friendships, and local police.
▪ Children in England have relatively low levels of satisfaction with four aspects of life – their relationships with teachers, their body, the way that they look, and their self-confidence.
▪ There are significant age and gender variations in children’s subjective well-being in England and these are not always matched by similar differences in other countries. In particular the strong gender variations in children’s satisfaction with their body, appearance and self-confidence in England are not replicated in many other countries in the survey, and this refutes the idea that these types of gender variations are inevitable.
▪ Compared to other countries in the survey, children in England tended not to like going to school and reported poor relationships with teachers. England ranked 14th for satisfaction with teachers and 14th for children feeling that they were treated fairly by teachers. It did rank slightly higher, but still below average, at ninth for children feeling that teachers listened to their views.
▪ Children in England were the most likely to say that they have experienced being excluded by other children in their class at school and this was a particular issue for girls. The prevalence of physical bullying in schools in England was fairly average for the 15 countries surveyed.
▪ Children in England have relatively poor knowledge of their rights, compared to children in other countries. In particular, only 36% of children in England agreed with the statement ‘I know what rights children have’ and this was the lowest level of agreement for any of the 15 countries. This compares with levels of agreement above 70% in Norway, Colombia, Poland and Nepal.
▪ There are some substantial differences in how children in England spend their time in comparison with children in other countries:
▪ Children in England spend a relatively large amount of time doing organised leisure activities and being alone.
▪ Children in England spend a relatively small amount of time attending classes outside school and doing homework.
57
The Good Childhood 2015 Comparing children’s subjective well-being in England and other countries
58
The Good Childhood 2015 Comparing children’s subjective well-being in England and other countries
59
The Good Childhood 2015 The subjective well-being of children in the UK
Chapter 3: Discussion
60
The Good Childhood 2015 Discussion
It is now 10 years since The Children’s Society and the University of York initiated what has become the most extensive and coherent national programme of research on children’s subjective well-being to have been conducted anywhere in the world. This 10th anniversary provides an ideal opportunity to review the progress that has been made in understanding how children feel about their lives and also to consider how this understanding can be put to practical use in order to improve the lives of children in the future.
42 Helliwell et al (2015)43 Diener and Chan (2011)44 Keyes (2006)
The idea of improving children’s lives might on the face of it seem to be uncontroversial. However, when we embarked upon this research programme in 2005 much of the public discussion about children’s well-being in the UK seemed to focus more on their well-being as future adults – or ‘well-becoming’ – than about their current well-being as children. Few would argue with the idea that children’s prospects as future adults are fundamentally important for them as individuals or for society as a whole. So it is understandable that discussion of children’s well-being often covers topics such as educational attainment or children’s health behaviours as factors that will influence future well-being. However, The Children’s Society’s belief in 2005 was that it was also important to focus on childhood as a life stage in its own right, rather than just as a preparation for adulthood, and that children’s subjective experience of childhood was important in addition to (not
instead of) their future prospects. The discussion about children’s well-being in the UK in 2005 was also largely one that was being conducted between adults, with children’s own views remaining relatively unheard. The Children’s Society’s main goal in initiating the well-being research programme was to involve children more fully in this debate and ensure that their views and experiences were understood and taken into account.
Subjective well-being as a goal?
The issue of children’s subjective well-being links with broader debates about the increasing focus on subjective well-being (or ‘happiness’ as it is often referred to in the media) and in particular about public policy goals. Some would argue that a positive level of subjective well-being is a legitimate policy goal in its own right. The influential Stiglitz Commission made a strong case
for considering subjective well-being as one of a set of measures of societal progress, in addition to more traditional indicators such as GDP. It is possible to go even further and argue that maximising the subjective well-being of the population is the overarching purpose of government.42
However it is not necessary to agree with these views in order for subjective well-being to have widespread relevance. There is already evidence of significant links between adults’ subjective well-being and their later health and longevity, even after taking into account a range of other factors.43 Similar evidence exists which suggests a link between adults’ subjective well-being and the later prevalence of mental health problems.44 Comparable evidence in relation to children’s subjective well-being is sparse, although one study in New Zealand found that adolescent social connectedness was a better predictor than
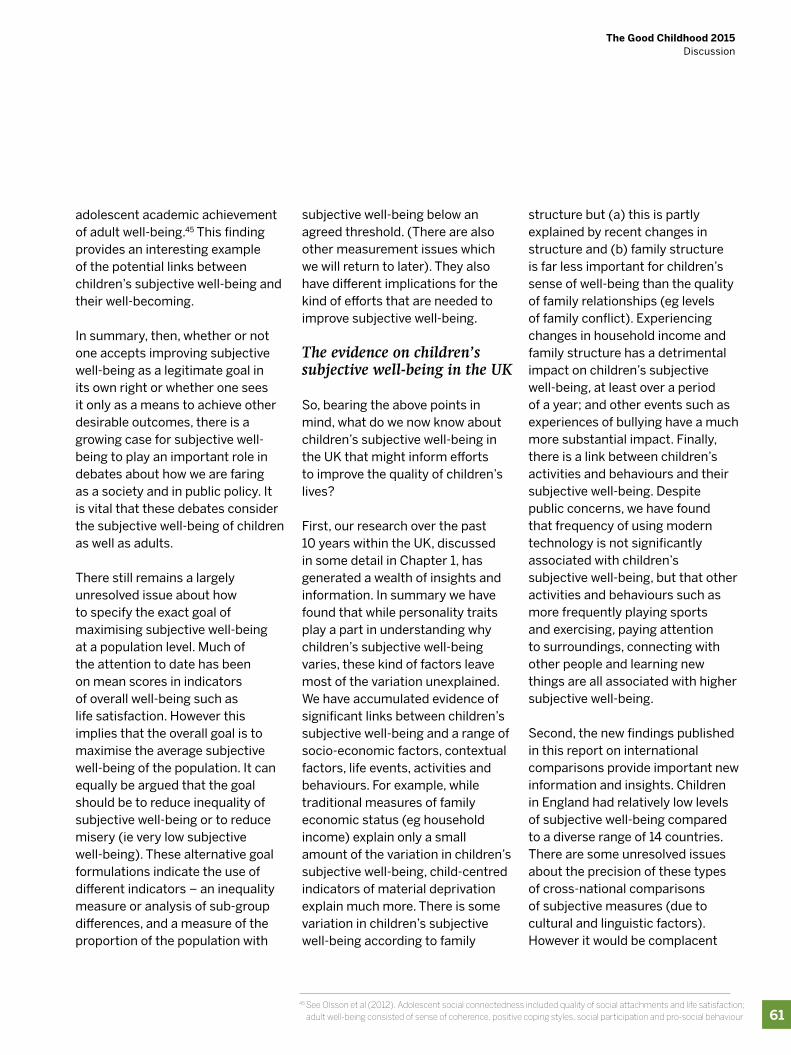
61
The Good Childhood 2015 Discussion
45 See Olsson et al (2012). Adolescent social connectedness included quality of social attachments and life satisfaction; adult well-being consisted of sense of coherence, positive coping styles, social participation and pro-social behaviour
adolescent academic achievement of adult well-being.45 This finding provides an interesting example of the potential links between children’s subjective well-being and their well-becoming. In summary, then, whether or not one accepts improving subjective well-being as a legitimate goal in its own right or whether one sees it only as a means to achieve other desirable outcomes, there is a growing case for subjective well-being to play an important role in debates about how we are faring as a society and in public policy. It is vital that these debates consider the subjective well-being of children as well as adults.
There still remains a largely unresolved issue about how to specify the exact goal of maximising subjective well-being at a population level. Much of the attention to date has been on mean scores in indicators of overall well-being such as life satisfaction. However this implies that the overall goal is to maximise the average subjective well-being of the population. It can equally be argued that the goal should be to reduce inequality of subjective well-being or to reduce misery (ie very low subjective well-being). These alternative goal formulations indicate the use of different indicators – an inequality measure or analysis of sub-group differences, and a measure of the proportion of the population with
subjective well-being below an agreed threshold. (There are also other measurement issues which we will return to later). They also have different implications for the kind of efforts that are needed to improve subjective well-being.
The evidence on children’s subjective well-being in the UK
So, bearing the above points in mind, what do we now know about children’s subjective well-being in the UK that might inform efforts to improve the quality of children’s lives?
First, our research over the past 10 years within the UK, discussed in some detail in Chapter 1, has generated a wealth of insights and information. In summary we have found that while personality traits play a part in understanding why children’s subjective well-being varies, these kind of factors leave most of the variation unexplained. We have accumulated evidence of significant links between children’s subjective well-being and a range of socio-economic factors, contextual factors, life events, activities and behaviours. For example, while traditional measures of family economic status (eg household income) explain only a small amount of the variation in children’s subjective well-being, child-centred indicators of material deprivation explain much more. There is some variation in children’s subjective well-being according to family
structure but (a) this is partly explained by recent changes in structure and (b) family structure is far less important for children’s sense of well-being than the quality of family relationships (eg levels of family conflict). Experiencing changes in household income and family structure has a detrimental impact on children’s subjective well-being, at least over a period of a year; and other events such as experiences of bullying have a much more substantial impact. Finally, there is a link between children’s activities and behaviours and their subjective well-being. Despite public concerns, we have found that frequency of using modern technology is not significantly associated with children’s subjective well-being, but that other activities and behaviours such as more frequently playing sports and exercising, paying attention to surroundings, connecting with other people and learning new things are all associated with higher subjective well-being.
Second, the new findings published in this report on international comparisons provide important new information and insights. Children in England had relatively low levels of subjective well-being compared to a diverse range of 14 countries. There are some unresolved issues about the precision of these types of cross-national comparisons of subjective measures (due to cultural and linguistic factors). However it would be complacent
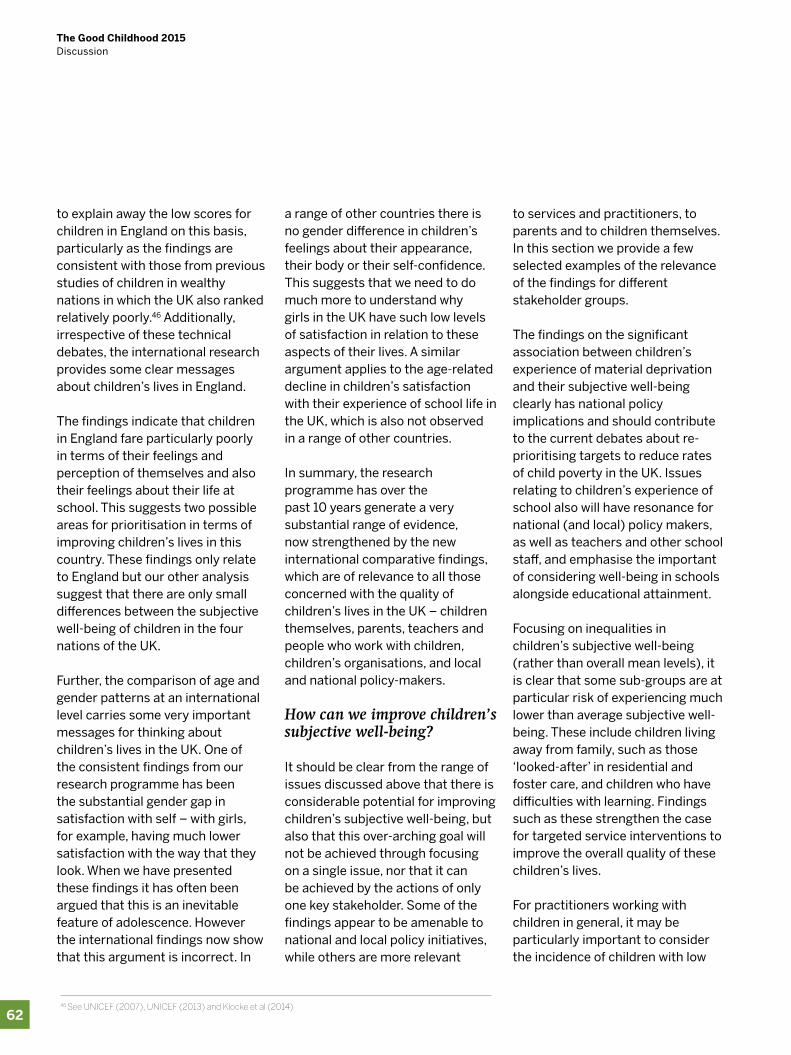
62
The Good Childhood 2015 Discussion
to explain away the low scores for children in England on this basis, particularly as the findings are consistent with those from previous studies of children in wealthy nations in which the UK also ranked relatively poorly.46 Additionally, irrespective of these technical debates, the international research provides some clear messages about children’s lives in England.
The findings indicate that children in England fare particularly poorly in terms of their feelings and perception of themselves and also their feelings about their life at school. This suggests two possible areas for prioritisation in terms of improving children’s lives in this country. These findings only relate to England but our other analysis suggest that there are only small differences between the subjective well-being of children in the four nations of the UK.
Further, the comparison of age and gender patterns at an international level carries some very important messages for thinking about children’s lives in the UK. One of the consistent findings from our research programme has been the substantial gender gap in satisfaction with self – with girls, for example, having much lower satisfaction with the way that they look. When we have presented these findings it has often been argued that this is an inevitable feature of adolescence. However the international findings now show that this argument is incorrect. In
a range of other countries there is no gender difference in children’s feelings about their appearance, their body or their self-confidence. This suggests that we need to do much more to understand why girls in the UK have such low levels of satisfaction in relation to these aspects of their lives. A similar argument applies to the age-related decline in children’s satisfaction with their experience of school life in the UK, which is also not observed in a range of other countries.
In summary, the research programme has over the past 10 years generate a very substantial range of evidence, now strengthened by the new international comparative findings, which are of relevance to all those concerned with the quality of children’s lives in the UK – children themselves, parents, teachers and people who work with children, children’s organisations, and local and national policy-makers.
How can we improve children’s subjective well-being?
It should be clear from the range of issues discussed above that there is considerable potential for improving children’s subjective well-being, but also that this over-arching goal will not be achieved through focusing on a single issue, nor that it can be achieved by the actions of only one key stakeholder. Some of the findings appear to be amenable to national and local policy initiatives, while others are more relevant
to services and practitioners, to parents and to children themselves. In this section we provide a few selected examples of the relevance of the findings for different stakeholder groups.
The findings on the significant association between children’s experience of material deprivation and their subjective well-being clearly has national policy implications and should contribute to the current debates about re-prioritising targets to reduce rates of child poverty in the UK. Issues relating to children’s experience of school also will have resonance for national (and local) policy makers, as well as teachers and other school staff, and emphasise the important of considering well-being in schools alongside educational attainment.
Focusing on inequalities in children’s subjective well-being (rather than overall mean levels), it is clear that some sub-groups are at particular risk of experiencing much lower than average subjective well-being. These include children living away from family, such as those ‘looked-after’ in residential and foster care, and children who have difficulties with learning. Findings such as these strengthen the case for targeted service interventions to improve the overall quality of these children’s lives.
For practitioners working with children in general, it may be particularly important to consider the incidence of children with low
46 See UNICEF (2007), UNICEF (2013) and Klocke et al (2014)
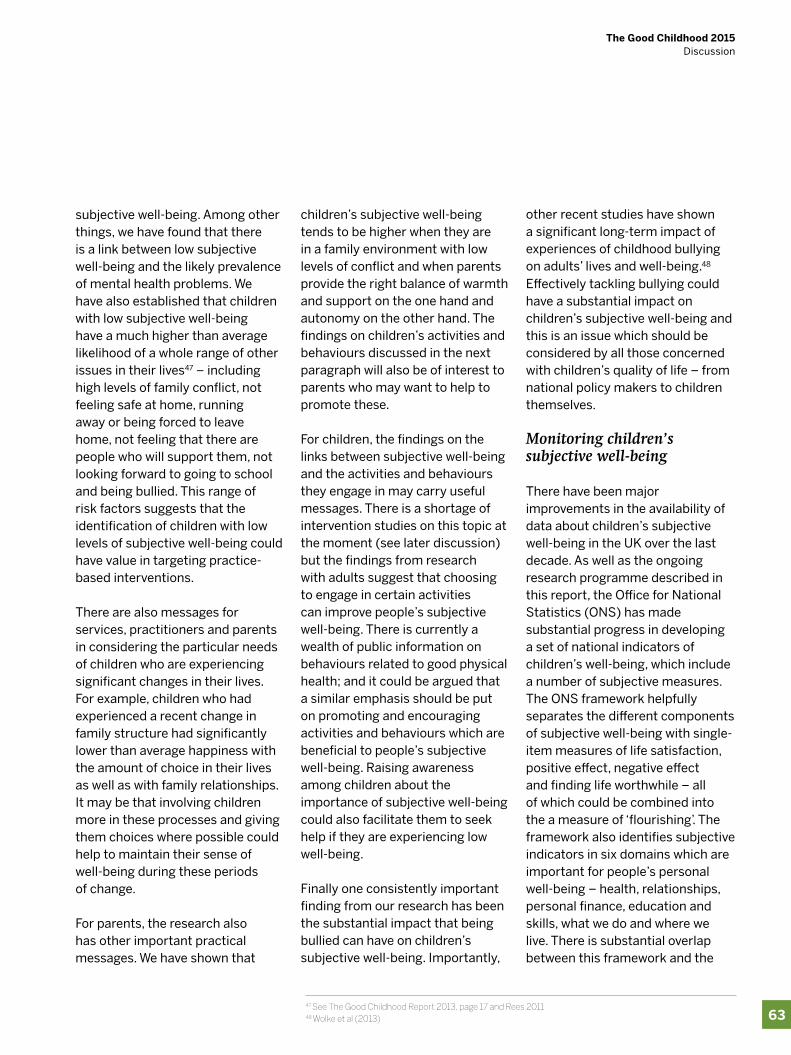
63
The Good Childhood 2015 Discussion
subjective well-being. Among other things, we have found that there is a link between low subjective well-being and the likely prevalence of mental health problems. We have also established that children with low subjective well-being have a much higher than average likelihood of a whole range of other issues in their lives47 – including high levels of family conflict, not feeling safe at home, running away or being forced to leave home, not feeling that there are people who will support them, not looking forward to going to school and being bullied. This range of risk factors suggests that the identification of children with low levels of subjective well-being could have value in targeting practice-based interventions.
There are also messages for services, practitioners and parents in considering the particular needs of children who are experiencing significant changes in their lives. For example, children who had experienced a recent change in family structure had significantly lower than average happiness with the amount of choice in their lives as well as with family relationships. It may be that involving children more in these processes and giving them choices where possible could help to maintain their sense of well-being during these periods of change.
For parents, the research also has other important practical messages. We have shown that
children’s subjective well-being tends to be higher when they are in a family environment with low levels of conflict and when parents provide the right balance of warmth and support on the one hand and autonomy on the other hand. The findings on children’s activities and behaviours discussed in the next paragraph will also be of interest to parents who may want to help to promote these.
For children, the findings on the links between subjective well-being and the activities and behaviours they engage in may carry useful messages. There is a shortage of intervention studies on this topic at the moment (see later discussion) but the findings from research with adults suggest that choosing to engage in certain activities can improve people’s subjective well-being. There is currently a wealth of public information on behaviours related to good physical health; and it could be argued that a similar emphasis should be put on promoting and encouraging activities and behaviours which are beneficial to people’s subjective well-being. Raising awareness among children about the importance of subjective well-being could also facilitate them to seek help if they are experiencing low well-being.
Finally one consistently important finding from our research has been the substantial impact that being bullied can have on children’s subjective well-being. Importantly,
other recent studies have shown a significant long-term impact of experiences of childhood bullying on adults’ lives and well-being.48 Effectively tackling bullying could have a substantial impact on children’s subjective well-being and this is an issue which should be considered by all those concerned with children’s quality of life – from national policy makers to children themselves.
Monitoring children’s subjective well-being
There have been major improvements in the availability of data about children’s subjective well-being in the UK over the last decade. As well as the ongoing research programme described in this report, the Office for National Statistics (ONS) has made substantial progress in developing a set of national indicators of children’s well-being, which include a number of subjective measures. The ONS framework helpfully separates the different components of subjective well-being with single-item measures of life satisfaction, positive effect, negative effect and finding life worthwhile – all of which could be combined into the a measure of ‘flourishing’. The framework also identifies subjective indicators in six domains which are important for people’s personal well-being – health, relationships, personal finance, education and skills, what we do and where we live. There is substantial overlap between this framework and the
47 See The Good Childhood Report 2013, page 17 and Rees 201148 Wolke et al (2013)
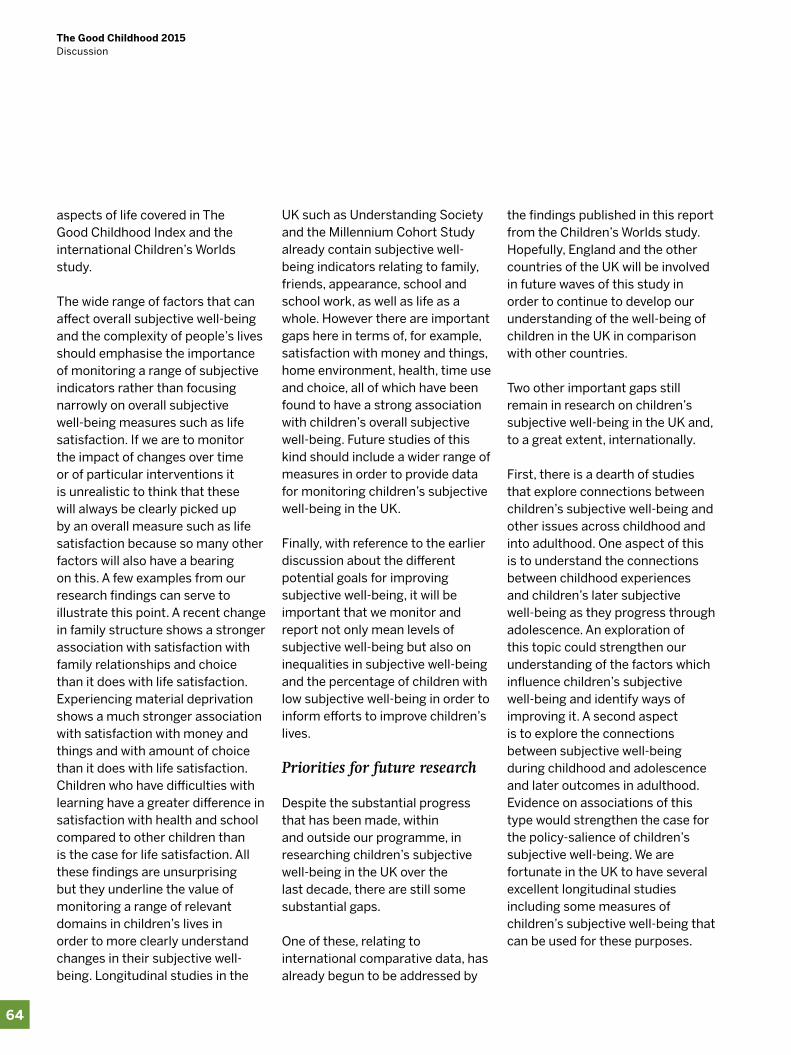
64
The Good Childhood 2015 Discussion
aspects of life covered in The Good Childhood Index and the international Children’s Worlds study.
The wide range of factors that can affect overall subjective well-being and the complexity of people’s lives should emphasise the importance of monitoring a range of subjective indicators rather than focusing narrowly on overall subjective well-being measures such as life satisfaction. If we are to monitor the impact of changes over time or of particular interventions it is unrealistic to think that these will always be clearly picked up by an overall measure such as life satisfaction because so many other factors will also have a bearing on this. A few examples from our research findings can serve to illustrate this point. A recent change in family structure shows a stronger association with satisfaction with family relationships and choice than it does with life satisfaction. Experiencing material deprivation shows a much stronger association with satisfaction with money and things and with amount of choice than it does with life satisfaction. Children who have difficulties with learning have a greater difference in satisfaction with health and school compared to other children than is the case for life satisfaction. All these findings are unsurprising but they underline the value of monitoring a range of relevant domains in children’s lives in order to more clearly understand changes in their subjective well-being. Longitudinal studies in the
UK such as Understanding Society and the Millennium Cohort Study already contain subjective well-being indicators relating to family, friends, appearance, school and school work, as well as life as a whole. However there are important gaps here in terms of, for example, satisfaction with money and things, home environment, health, time use and choice, all of which have been found to have a strong association with children’s overall subjective well-being. Future studies of this kind should include a wider range of measures in order to provide data for monitoring children’s subjective well-being in the UK.
Finally, with reference to the earlier discussion about the different potential goals for improving subjective well-being, it will be important that we monitor and report not only mean levels of subjective well-being but also on inequalities in subjective well-being and the percentage of children with low subjective well-being in order to inform efforts to improve children’s lives.
Priorities for future research
Despite the substantial progress that has been made, within and outside our programme, in researching children’s subjective well-being in the UK over the last decade, there are still some substantial gaps.
One of these, relating to international comparative data, has already begun to be addressed by
the findings published in this report from the Children’s Worlds study. Hopefully, England and the other countries of the UK will be involved in future waves of this study in order to continue to develop our understanding of the well-being of children in the UK in comparison with other countries.
Two other important gaps still remain in research on children’s subjective well-being in the UK and, to a great extent, internationally.
First, there is a dearth of studies that explore connections between children’s subjective well-being and other issues across childhood and into adulthood. One aspect of this is to understand the connections between childhood experiences and children’s later subjective well-being as they progress through adolescence. An exploration of this topic could strengthen our understanding of the factors which influence children’s subjective well-being and identify ways of improving it. A second aspect is to explore the connections between subjective well-being during childhood and adolescence and later outcomes in adulthood. Evidence on associations of this type would strengthen the case for the policy-salience of children’s subjective well-being. We are fortunate in the UK to have several excellent longitudinal studies including some measures of children’s subjective well-being that can be used for these purposes.
65
The Good Childhood 2015 Discussion
Second, there is a need for researchers to become more engaged in evaluating initiatives to improve children’s subjective well-being. This includes helping policy-makers and others to develop realistic and useful ways of identifying the impact of their actions on subjective well-being. It should also include developing pilot studies on particular interventions. For example, we know that children who more frequently play sports or pay attention to their surroundings have higher than average subjective well-being. But we don’t yet know if promoting and encouraging these activities would necessarily lead to improvements in the subjective well-being of individual children.
To conclude this report, and our review of progress over the last 10 years, it is appropriate to thank all those who have contributed to the success of the well-being research programme. This includes schools, local authorities, national government departments (including the Cabinet Office) and public bodies (including the Office for National Statistics), other non-governmental organisations, academics and the media, all of whom have provided support and shown interest in this initiative. Most importantly we would like to thank the estimated 60,000 children in the UK who have spent time talking to us and completing survey questionnaires to provide the information on which the programme is based.
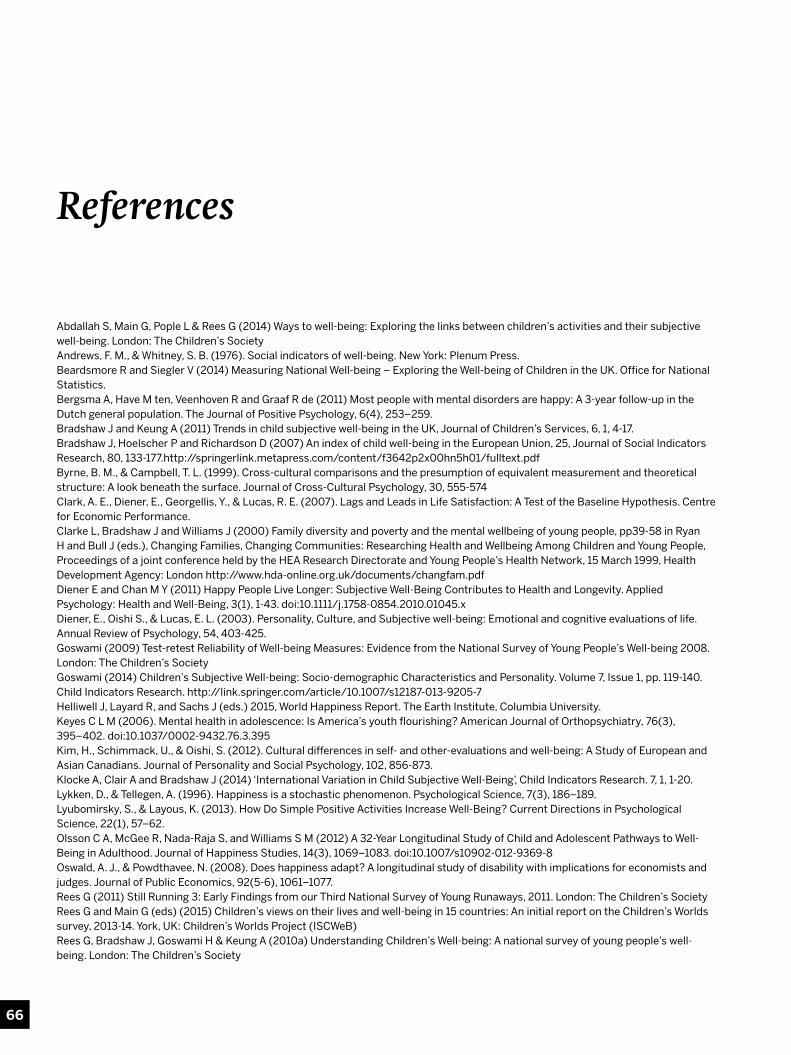
66
References
Abdallah S, Main G, Pople L & Rees G (2014) Ways to well-being: Exploring the links between children’s activities and their subjective well-being. London: The Children’s SocietyAndrews, F. M., & Whitney, S. B. (1976). Social indicators of well-being. New York: Plenum Press.Beardsmore R and Siegler V (2014) Measuring National Well-being – Exploring the Well-being of Children in the UK. Office for National Statistics.Bergsma A, Have M ten, Veenhoven R and Graaf R de (2011) Most people with mental disorders are happy: A 3-year follow-up in the Dutch general population. The Journal of Positive Psychology, 6(4), 253–259. Bradshaw J and Keung A (2011) Trends in child subjective well-being in the UK, Journal of Children’s Services, 6, 1, 4-17.Bradshaw J, Hoelscher P and Richardson D (2007) An index of child well-being in the European Union, 25, Journal of Social Indicators Research, 80, 133-177.http://springerlink.metapress.com/content/f3642p2x00hn5h01/fulltext.pdfByrne, B. M., & Campbell, T. L. (1999). Cross-cultural comparisons and the presumption of equivalent measurement and theoretical structure: A look beneath the surface. Journal of Cross-Cultural Psychology, 30, 555-574Clark, A. E., Diener, E., Georgellis, Y., & Lucas, R. E. (2007). Lags and Leads in Life Satisfaction: A Test of the Baseline Hypothesis. Centre for Economic Performance.Clarke L, Bradshaw J and Williams J (2000) Family diversity and poverty and the mental wellbeing of young people, pp39-58 in Ryan H and Bull J (eds.), Changing Families, Changing Communities: Researching Health and Wellbeing Among Children and Young People, Proceedings of a joint conference held by the HEA Research Directorate and Young People’s Health Network, 15 March 1999, Health Development Agency: London http://www.hda-online.org.uk/documents/changfam.pdfDiener E and Chan M Y (2011) Happy People Live Longer: Subjective Well-Being Contributes to Health and Longevity. Applied Psychology: Health and Well-Being, 3(1), 1-43. doi:10.1111/j.1758-0854.2010.01045.xDiener, E., Oishi S., & Lucas, E. L. (2003). Personality, Culture, and Subjective well-being: Emotional and cognitive evaluations of life. Annual Review of Psychology, 54, 403-425. Goswami (2009) Test-retest Reliability of Well-being Measures: Evidence from the National Survey of Young People’s Well-being 2008. London: The Children’s SocietyGoswami (2014) Children’s Subjective Well-being: Socio-demographic Characteristics and Personality. Volume 7, Issue 1, pp. 119-140. Child Indicators Research. http://link.springer.com/article/10.1007/s12187-013-9205-7 Helliwell J, Layard R, and Sachs J (eds.) 2015, World Happiness Report. The Earth Institute, Columbia University.Keyes C L M (2006). Mental health in adolescence: Is America’s youth flourishing? American Journal of Orthopsychiatry, 76(3), 395–402. doi:10.1037/0002-9432.76.3.395Kim, H., Schimmack, U., & Oishi, S. (2012). Cultural differences in self- and other-evaluations and well-being: A Study of European and Asian Canadians. Journal of Personality and Social Psychology, 102, 856-873.Klocke A, Clair A and Bradshaw J (2014) ‘International Variation in Child Subjective Well-Being’, Child Indicators Research. 7, 1, 1-20.Lykken, D., & Tellegen, A. (1996). Happiness is a stochastic phenomenon. Psychological Science, 7(3), 186–189.Lyubomirsky, S., & Layous, K. (2013). How Do Simple Positive Activities Increase Well-Being? Current Directions in Psychological Science, 22(1), 57–62. Olsson C A, McGee R, Nada-Raja S, and Williams S M (2012) A 32-Year Longitudinal Study of Child and Adolescent Pathways to Well-Being in Adulthood. Journal of Happiness Studies, 14(3), 1069–1083. doi:10.1007/s10902-012-9369-8Oswald, A. J., & Powdthavee, N. (2008). Does happiness adapt? A longitudinal study of disability with implications for economists and judges. Journal of Public Economics, 92(5-6), 1061–1077.Rees G (2011) Still Running 3: Early Findings from our Third National Survey of Young Runaways, 2011. London: The Children’s SocietyRees G and Main G (eds) (2015) Children’s views on their lives and well-being in 15 countries: An initial report on the Children’s Worlds survey, 2013-14. York, UK: Children’s Worlds Project (ISCWeB)Rees G, Bradshaw J, Goswami H & Keung A (2010a) Understanding Children’s Well-being: A national survey of young people’s well-being. London: The Children’s Society
67
Rees G, Goswami H & Bradshaw J (2010b) Developing an Index of Children’s Subjective Well-Being in England. London: The Children’s SocietyRees G, Pople L & Goswami H (2011) Links between family economic factors and children’s subjective wellbeing: Initial findings from Wave 2 and Wave 3 quarterly surveys. London: The Children’s SocietyStiglitz J E, Sen, A and Fitoussi J P (2009). Report by the Commission on the Measurement of Economic Performance and Social Progress. OECD.Suh, E., Diener, E., & Fujita, F. (1996). Events and subjective well-being: only recent events matter. Journal of Personality and Social Psychology, 70(5), 1091.The Children’s Society (2006) Good Childhood? A Question for Our Times. London: The Children’s SocietyThe Children’s Society (2008) Happy and they know it - Developing a well-being framework based on young people consultation. London: The Children’s Society.The Children’s Society (2009). The Good Childhood Inquiry: What children told us. London: The Children’s Society.The Children’s Society (2012) The Good Childhood Report 2012. London: The Children’s Society.The Children’s Society (2013a) The Good Childhood Report 2013. London: The Children’s Society.The Children’s Society (2013b) Isle of Wight survey of children and young people, 2012. London: The Children’s Society.The Children’s Society (2014) The Good Childhood Report 2014. London: The Children’s Society.UNICEF (2007) Child poverty in perspective: An overview of child well-being in rich countries, Innocenti Report Card 7. UNICEF: FlorenceUNICEF Office of Research (2013) Child Well-Being in Rich Countries: A Comparative Overview (Innocenti Report Card 11). Florence: UNICEF Office of Research
This project was funded by the Jacobs Foundation
childrenssociety.org.uk@childsocpol© The Children’s Society August 2015
Registered Charity No. 221124
PCR046b/0815
For more information on this report, please contact:
Larissa Pople The Children’s Society e: [email protected] t: 020 7841 4645
It is a painful fact that many children and young people in Britain
today are still suffering extreme hardship, abuse and neglect.
The Children’s Society is a national charity that runs local projects, helping children and young people when they are
at their most vulnerable and have nowhere left to turn.
We also campaign for changes to laws affecting children and young people, to stop the mistakes of
the past being repeated in the future.