Embed Size (px)
Citation preview
Eleventh Floor, Menzies Building Monash University, Wellington Road CLAYTON Vic 3800 AUSTRALIA Telephone: from overseas: (03) 9905 2398, (03) 9905 5112 61 3 9905 2398 or 61 3 9905 5112 Fax: (03) 9905 2426 61 3 9905 2426 e-mail: [email protected] Internet home page: http//www.monash.edu.au/policy/
The Global Wine Market in the
Decade to 2015 with a Focus on Australia and Chile
by
GLYN WITTWER
Centre of Policy Studies Monash University
General Working Paper No. G-166 July 2007
ISSN 1 031 9034 ISBN 0 7326 1573 9
The Centre of Policy Studies (COPS) is a research centre at Monash University devoted to quantitative analysis of issues relevant to Australian economic policy.

The global wine market in the decade to 2015 with a focus on Australia and Chile
Glyn Wittwer, Centre of Policy Studies, Monash University, July 2007
Summary
The share of global wine supplied by New World producers has increased dramatically since the late 1980s. Australia and Chile have emerged as major exporters of wine. USA has also increased production sharply though its sales have grown mainly in the domestic rather than export markets. This paper uses the World Wine Model to project the wine markets of the world from 2005 to 2015. The model includes different types of wine, so as to distinguish the growing premium segment of the market from the non-premium segment. USA is set to become the largest consumer and importer of wine in the world. Hence, growth prospects for wine exporting nations will centre increasingly on the US market. The Chinese market is likely to follow the pattern set by the Japanese market, in which per capita consumption of wine has remained relatively low despite real income growth. Nevertheless, exports to China of non-premium wine will grow over the next decade. Paper prepared for a seminar in Chile in August 2007. Research funded by the Grape and Wine Research and Development Corporation (GWRDC) of Australia. JEL classification: C68, Q13
Keywords: CGE modelling, wine consumption

Contents
Summary 1
Developments since 2005 2
Contrasting antipodean exporters and their target markets 4
Australia and Chile in the Chinese wine market 6
Projections to 2015 7
Macro assumptions in projecting to 2015 14
Possible alterations to our 2015 projection 20
References 20
Appendix 22
Tables and Figures
Table 1: Super premium wine output and real price changes 14
Table 2: Commercial premium wine output and real price changes 15
Table 3: Non-prem wine output and real price changes 16
Table 4: Super premium wine consumption and real price changes 16
Table 5: Commercial premium wine consumption 17
Table 6: Non-prem wine consumption and real price changes 17
Table 7: Export growth by producing nation 18
Table 8: Import growth by consuming nation 18
Table 9: Chilean and Australian export growth by destination 18
Figure 1: Western Europe wine consumption 9
Figure 2: Western Europe wine consumption 10
Figure 3: Emergent importers wine consumption 11
Figure 4: Chile’s and Australia’s exports to emergent importers 11
Figure 5: Consumption: New World 12
Figure 6: Past and future aggregate wine consumption in Australia and Chile 19

2
The global wine market in the decade to 2015 with a focus on Australia and Chile The wine world has experienced some remarkable swings over the past 20 years. New World producers led by Australia have emerged as major exporters. Traditional European exporters have struggled to adapt to changing market conditions, and face the threat of growing competition from eastern European nations joining the European Union. As the Russian economy grows, so too does its appetite for imported food and wine, though policy within the federation appears to be geared towards preventing imports. It now appears the China may emerge as a major importer of wine, though per capita consumption of wine in the nation remains low.
The aim of this paper is to build on Wittwer and Rothfield (2005), which included projections to 2010 and some historical background. Rather than go over old ground, our aim in this paper is to report on developments since 2005 and project to 2015.
Developments since 2005 Australia
More recently, Australia’s wine industry has entered the school of hard knocks. First, it had to deal with wine glut for several vintages, in the wake of a plantings rush in the 1990s; this was the sting fuelled by six consecutive vintages of rising winegrape prices. Now, a drought has diminished production volumes in both dry-land and irrigated vineyards in the 2007 vintage.1 At the same time, amid a resources boom fuelled primarily by China, Australia’s currency has appreciated against the major currencies of the world, diminishing the competitiveness of its non-mineral exports, including wine. The terms-of-trade boom in Australia that has induced a currency appreciation started in mid-2004. Meanwhile, grape growers in the Murray-Darling basin hope that rain and snow continues in the alpine region of Australia. Last year, the alpine region that is source of the Murray River, experienced record low levels of rainfall. Water allocations to irrigators eventually were cut altogether and remain for the new season at zero.
In the Australian market in the late 1990s, few reds other than some of the most basic quality were available for less than AUS$10 per bottle. Now, the range of budget reds has increased considerably. Generally, the price of red wine has fallen across most of the quality range with some exceptions. Most notable of the exceptions have been rare aged-vine reds that a decade or so ago were not priced according to their scarcity, partly due to limited marketing.
New Zealand
New Zealand’s growth in production and exports has been as spectacular as that of Australia, albeit from a lower base. New Zealand’s exports almost doubled in volume between 2003 and 2005 following a more than doubling of the nation’s area of vineyards
1 Former tobacco growers in the King Valley of Victoria, who account for only a tiny fraction of Australia’s wine output, have lost their winegrape crops for the 2007 vintage ironically to bushfire smoke. We live in the era of wine quality, when producers would rather live without an income for a year than damage their reputations permanently with a single vintage of smoke-tainted wine.
3
between the late 1990s and mid-2000s. New Zealand forged a reputation for excellent white wines, reflected in the highest unit values for bottled still wine by any significant exporter from the late 1990s onwards. Unit values fell sharply in 2005 due to rising export volumes and an appreciating domestic currency though preliminary data indicate a small recovery in unit values in 2006 (New Zealand Winegrowers, 2007).
USA International exports of US wine play only a small part in overall sales. Indeed, the US market is virtually alone in the world in exporting lower quality wine on average than that sold in the domestic market (using unit values as a guide to quality). If we divide USA into California and the rest of USA, we would interpret Californian exports to the rest of the nation as one of the largest of all bilateral wine trades. California sales in the USA amounted to 1,700 million litres in 2006 (Wine Institute of California, 2007). From available state consumption data (Adams Beverage Group, 2006), we infer that California exports to other states are around 1,200 million litres. In the next year or two, the US will displace France as the world’s largest consumer of wine. The US market therefore will remain important to the wine industry in the rest of the world.
China
China, having dented the competitiveness of the Australian wine industry through its galloping demand for resources, may yet soften the impact by emerging as a potential major importer of wine. A combination of rocketing per capita incomes, a cut in the tariff on wine imports as part of its WTO obligations, and the outlawing of the dubious home-grown practice of adding sugar and water to domestic wine to stretch scarce grapes have contributed. China’s imports of Australian wine have trebled in volume in a single year, thereby overtaking the Netherlands, Denmark, Ireland, Sweden and Japan as buyers of Australian wine in volumetric terms, yet lagging behind each of these destinations in value terms (AWEC, 2007). Ultimately, the importance of China as an export destination for wine depends on whether Chinese consumers acquire a taste for wine as incomes rise.
Russia
The growing economic fortunes that might turn China into a major importer are not yet raising the hopes of wine exporters aiming at Russia. In July 2006, Russia’s entry into the WTO was blocked after Presidents Bush and Putin failed to agree on terms for accession. The Russians earlier in the year rehearsed for WTO accession by imposing a total ban on imports of wine from Georgia and Moldova.2 Moldova has the most wine-intensive economy in the world and Russia accounts for 80% of its exports. Russia’s action bankrupted many wineries in Moldova and harmed Moldova’s economy significantly. Russia’s actions may have hastened a move in Moldova’s bilateral trade from Russia towards Europe. The wine producers in France, Italy and Spain may not welcome
2 The Russians meant to show they were serious about WTO accession in 2006. In addition to the abovementioned bans on wine imports (from March until December 2006), they banned meat imports from Poland in November 2005, all animal products from Ukraine between January and October 2006 and chilled Norwegian salmon between January and April 2006. A ban on canned fish from Latvia imposed in October 2006 was lifted in January 2007. The website below indicates that some food quality issues may have been real. This might indicate that food exporters have not applied to same standards in the past to food destined for Russia as elsewhere (see http://en.rian.ru/russia/20070516/65597324.html).
4
additional competition from Moldova, though they may at present feel shielded from close competition by reputation and quality.
Contrasting antipodean exporters and their target markets Chile’s export expansion since the early 1990s has been as spectacular as that of Australia. The value of exports from 1995 to 2005 increased almost five-fold. Chile’s exports are less concentrated than those of Australia. The top five destinations in 2005, namely USA, United Kingdom, Germany, Canada and Denmark, accounted for just over half of the value of Chile’s total exports. Compare this with Australian: sales to USA, United Kingdom and Canada accounted for over 75% of the value of all Australian wine exports. This need not be a great concern to the Australian industry, given that USA is poised to become the world’s largest consumer of wine. A greater concern for exporters around the world might be what happens if wine consumption per capita ceases to grow in the United Kingdom: at over 20 litres per capita, UK consumption might be drawing closer to its consumption plateau, limiting scope for further sales growth. But Chile’s main concern, having established a relatively diverse export base, is where it should go now. Already, there are warning signs in two markets in which Chile has outperformed Australia’s wine sales in the past, namely Japan and Germany. In 2005, Australia’s sales to Japan exceeded those of Chile, with preliminary data indicating that this may have happened in Germany in 2006.
Australia’s export performance is no accident. The most recent USDA attaché report on the Japanese wine market indicates that Australia has gained shelf space at convenience stores, possibly indicating a hard-won advantage over its New World competitors (USDA, 2007a). It might be that the Chilean industry has much to do to upgrade its image. Historically, Chilean wine has occupied a lower price increment in international markets than Australian wine. At the same, Australia’s unit values have fallen. This is potentially misleading, as some of Australia’s volume increase has been in bulk commercial premium wine. That is, bottling is done by a foreign buyer, perhaps in the UK, Germany or – to take advantage of different tax rates on either side of the Channel – France. In US dollar terms, the unit values of Australia’s bottled exports have remained steady or increased in some markets, even as supply has grown. This may mask a quality increment creep upwards by consumers as their discernment grows with time.
The most recent USDA report on Germany noted that only Chilean wine among New World wine is sold at below average import prices in the German market. Data indicate that German wine consumers are more price conscious than US consumers. Three quarters of sales in Germany are at below 2.00 Euro per bottle (USDA, 2007b). Given that Chile’s wine producers are now suffering the same exchange rate pressures as those of Australia, it may be increasingly difficult to compete in this segment. Chile’s improving performances in international wine shows may encourage consumers to search for higher quality Chilean wine.
Although trade data up until 2004 indicated that Chile has an outstanding export growth record, there are some signs that the Chilean industry should address. Its diverse export base relative to that of Australia is not an advantage if Australia has a larger market share in the rapidly growing US market. Australia has overtaken Chile in Japan, is about to in Germany and may even have usurped the South American to some extent from its role as
5
a supplier of bulk wine to China. Maybe, the Chilean industry needs to heed a few lessons from Australia. Australia’s export wine base in terms of quality increments is quite diverse. At the top end, it competes against the mighty reds of Bordeaux and the finesse of New Zealand whites. At least one relatively small wine company in the Barossa Valley of South Australia has a full-time marketer in North America, exploiting the cult status of earthy aged-vines Barossa Shiraz. The Australia Penfolds label competes at every bottled quality increment for both reds and whites.
In the budget end of the bottled market, Australia’s reputation for value-for-money reds has been until recently second to none. Only Chile has come close. Wine suppliers in both countries need to make an ongoing judgment as to how they concentrate on the budget end of the market in North America, and how much they should aim for the rapidly growing super-premium segment of the market. To some extent, the advent of “Two Buck Chuck” in USA has made some decisions for competing exporters easier: competition on price alone is perilous. The depreciation of the US dollar against major currencies has also made it easier for US domestic producers to compete with imports. Therefore, the US market seems to be a clear-cut case for Australian and Chilean exporters: aim to raise the quality of wine sold in the US market.
There are some parallels between the supply of bulk wine in Australia and the role of “Two Buck Chuck” in the US market. Each arose from a glut of wine grapes in their respective domestic vineyards. Assuming that global demand for high quality wine rises as a share of total wine consumption, then the availability of wine of a certain quality for bulk sales (the Australian bulk wine export case) or budget-priced sales (the “Two Buck Chuck” case) will gradually decrease. Some marketers may perceive of “Two Buck Chuck” as a threat to existing sales. It could be that extreme discounting paves the way to consumers who formerly did not consume wine at all. In Australia, the wine cask performed a similar role in the 1970s, raising per capita consumption of wine. The proportion of bottled wine in total consumption has continued to rise as the discernment of Australian consumers has grown. It follows that US consumers who started on “Two Buck Chuck” may seek both variety and quality – at a price – in the future. Unlike the United Kingdom, for example, there is plenty of room in the US market for an increase in per capita consumption. However, US per capita consumption varies widely across states. In the District of Columbia, consumption per adult is around 28 litres per annum. The lowest consuming state is West Virginia, where adults consume only 3.5 litres per capita (Adams Beverage Group, 2006).
Natural v. institutional attributes
What natural advantages does the Australian wine industry have? Variations in climate and soil type lead to different grape types being suitable for different regions in Australia. Consumers associate Shiraz with the Barossa Valley, Riesling with the Clare Valley, Semillon with the Hunter Valley, Chardonnay and Pinot Noir with the Yarra Valley and Cabernet Sauvignon with Margaret River. Such distinctions are a little arbitrary as brilliant wines of different varieties emerge from many different regions – and new varieties continue to enter the market. Any investigation of the natural environment in which Chilean wine is produced would lead to the conclusion that it surely is at least the equal of that in Australia. However, if we use export prices as a proxy for quality,
6
Australia continues to produce higher quality wine than Chile. This suggests that factors other than natural advantages are driving quality.
One area in which Australia leads the world is in the institutional structures surrounding the industry. For example, Australia has invested in formal grape and wine research, education and training since 1883 at Roseworthy Agricultural College, which is now part of the University of Adelaide. Roseworthy’s Diploma of Oenology commenced in 1934. The Australia Wine Research Institute was established in 1955. The Cooperative Research Centre for Viticulture came into being in 1992. More recently, the industry established its own Grape and Wine Research and Development Corporation (GWRDC).3 Charles Sturt University (CSU) at Wagga Wagga in Murrumbidgee region offers degrees in wine science and viticulture, and formally a double degree in both. Wine business or marketing courses are available at CSU, the University of Adelaide and the University of South Australia.4
Consider the French obsession with terroir. This concept implies that there is something unchangeable and unique about a wine, determined by the natural environment in which it is produced. Contrast this with the Australian approach: experimentation and innovation within an industry can change the ground rules and facilitate responses to changing consumer tastes. With globalization, there are now more opportunities for expertise developed in one part of the world to be applied elsewhere. Technical skills in wine-making ought to be readily transferable. There is still some place for terroir – without it, wine tasters would not be able to identify the origin of a wine in a blind tasting. Interestingly, some winemakers in the unfashionable Languedoc region of France have emulated some Australian traits by producing fruit-driven wine and using screw caps instead of corks. These winemakers are likely to be viewed as heretics by their colleagues elsewhere in France for another generation or more. Ultimately, these Languedoc producers will regard sustained profitability as the best indicator of the worth of their approach.
Australia and Chile in the Chinese wine market If there is an advantage in Chile and Australia raising their respective quality profiles in USA and Japan, and possibly Germany, then China is an entirely different proposition. China’s wine industry faced a supply shortage following the outlawing of half-juice wine in 2004. The growing imports of bulk wine in the next three to five years might help reduce Australia’s wine stocks. For Chilean exporters, the entry of Australian wine in bulk in the Chinese market may have come as a rude shock. To make matters worse for competitors, this wine is made from genuine wine grapes. There was a time, possibly until early in the new millennium, when bulk Australian white wine blends included sultana.5 For the past few vintages, warm climate grape prices have fallen so as to be no more expensive than table grapes such as sultana. Chardonnay probably dominates bulk white wine produced in Australia now. Varietal and regional information on bulk wine is not as readily available as it is for bottled wine.
3 Indeed, the GWRDC has funded the present paper. 4 Anderson(2000) elaborates on the institutional support and research and training linkages. Perhaps Chilean researchers should put together a similar study on the Chilean industry. 5 A darker secret is that sultana may have made its way into many cask red blends.
7
The role of bulk Australian exports to China may change as wine stocks within Australia are lowered to levels with which the industry feels comfortable. As Australia consolidates its reputation in other export markets, and assuming that its vineyard plantings have peaked, Australia’s bulk sales to China may decline at some point after 2010. Will Chile be content with continuing bulk exports to China if Australia eventually leaves more room for its sales? The answer might be that like Australia, Chile produces wine across a spectrum of qualities – although in Australia, quality at the bottom end has risen. Also, Chile is one of the world’s largest producers of table grapes, so that it has a ready supply of raw material to blend into bulk exports. Perhaps the wine industries in neither Chile nor Australia aspire to become bulk suppliers of cheap wine to other countries in the long term. They are both striving to maximize the quality of produce, although not all wine will be up to bottle quality. In Australia, the wine grape glut of the 2004 to 2006 vintages may have seen table grapes virtually disappear from bulk wine production.
One aspect of bulk sales to China is that they do little to enhance the reputation of the source country as a wine producer among Chinese consumers. This is not to do with quality. It is because in China, producers may label wine as their own as long as it contains 10% Chinese wine. Therefore, imported bulk wines are anonymous. It is possible the consumer trends in China could change rapidly. More likely though, is that broad trends observed in the Japanese market will follow in China. Japan’s consumption of wine remains below 3 litres per capita. The segment of the Chinese population that is likely to drink wine at all is confined to cities, though it will end up being many-fold higher than the wine-consuming segment of the Japanese population. Urban consumers in China may respond to information about the health benefits of red wine as they did in Japan in the late 1990s (USDA, 2007a). And there may come a time when there is genuine interest in wine variety and origin in China. That time seems distant at present. It is more likely that for the next decade at least, China will remain a unique market in which demand for bulk wine grows rapidly.
Projections to 2015 Before going into details of our projections, we outline some of the key features of the World Wine Model (Wittwer et al., 2003). One of its most important attributes is that it contains three types of still wine: super-premium, commercial premium and non-premium.6 This means that we distinguish between the growing premium and shrinking non-premium segments of the industry. Since non-premium consumption still exceeds premium consumption in many countries, in aggregate it appears as though wine consumption is shrinking. Aggregation masks much of the story.
By splitting still wine into three, we have to impose and infer many of the base numbers in the database. Our best source of disaggregated data is the Comtrade data produced by the United Nations. We supplement these data by relying on national wine agencies, including Vinas de Chile, the Australian Wine and Brandy Corporation, the Wine Institute of California, the Wine Institute of New Zealand and South African Wine Industry Information and Systems. For nations that rely exclusively on imports, our split
6 The model also contains sparkling wine. We do not report on this sector in the present paper as production, consumption and trade patterns are changing less rapidly than for other wine.
8
of consumption between the wine types is reasonably reliable. For other countries, we require some guesswork. In the case of very large per capita consumers (e.g, France, Italy and Portugal), we assume that most consumption is of non-premium wine.
In some respects, the task of putting the model together is the inverse of econometrics. In econometrics, many observed data are used to estimate a handful of behavioural parameters. In the World Wine Model, although we have made considered available estimates of demand parameters, most of the work has been in devising a partial equilibrium model and putting together base numbers derived from various data sources. This means that the parameters we impose on the model are conditional on database weights. For example, if there is no wine trade between two particular countries, then trade elasticities play no part in determining the pattern of trade between them.
Although we have put considerable effort into splitting wine into different types, the household demands in the World Wine Model are driven by a linear expenditure system. This does not allow specific substitutability. Therefore, if one were viewing the impacts on a specific nation of a switch from ad valorem to volumetric taxes, the current version of the model by omitting cross-price effects would underestimate the switch from low value to higher value wines arising from the change in tax policy. The macro growth assumptions used to project the World Wine Model impact directly on demand for the various wine types in the model via the expenditure elasticities. We impose relatively high expenditure elasticities on the premium wine types, with relatively low elasticities for non-premium wine.
Taste swings in different countries
Our most recent projection of the global wine market from 2003 to 2010 (Wittwer and Rothfield, 2005) included some assumptions that we ought to revisit. The one of most immediate concern is whether there will continue to be a global taste swing towards higher quality wine among consumers. The difficulty with this assumption has less to do with its veracity than with the way we model it using available information. At the same time as consumers are becoming more discerning and switching to higher quality wines – thereby drinking less but better – wine production quality is rising.
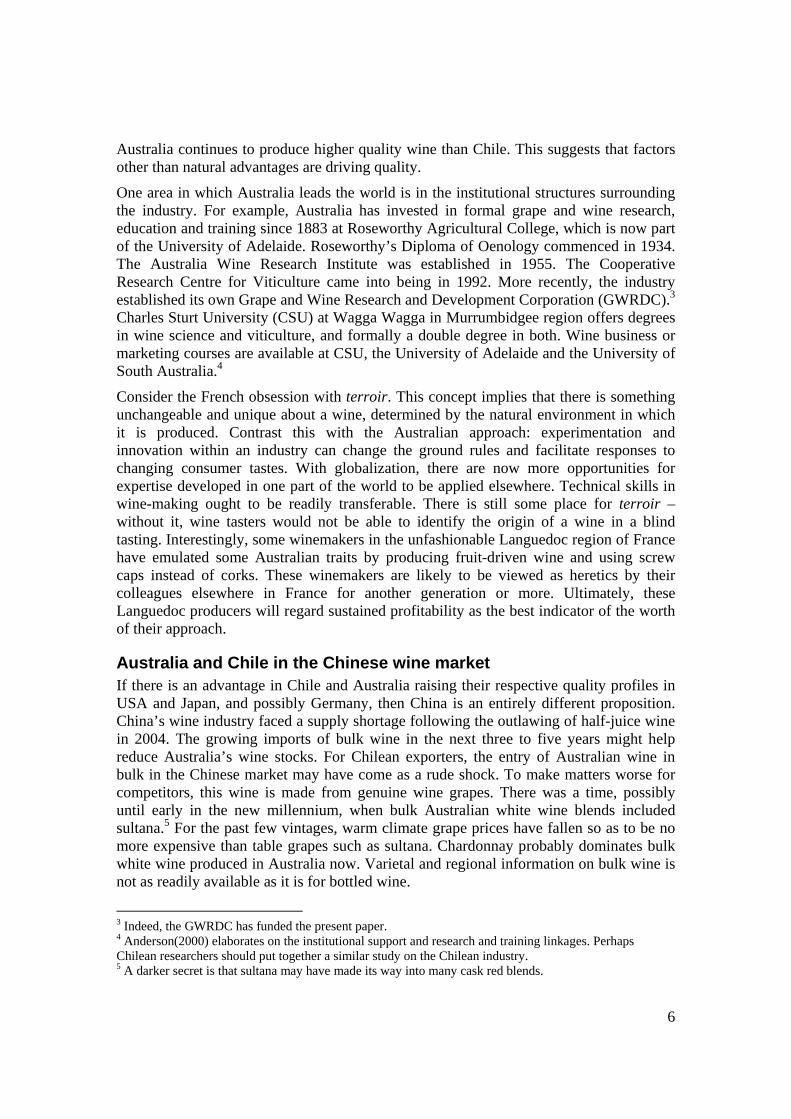
Figure 1 shows the trend in per capita wine consumption since 1995 in the four major wine-producing nations of Europe plus Switzerland. For France, Italy, Portugal and Switzerland, there appears to be a downward trend in wine consumed. It might be that there is a taste swing towards premium wines – but a strong swing against jug wine in these four countries masks any positive trend for bottled wine.
9
Figure 1: Western Europe wine consumption – group 1 (litres per capita)
30
35
40
45
50
55
60
65
1995 1996 1997 1998 1999 2000 2001 2002 2003 2004 2005
France
Italy
Portugal
Switzerland
Spain
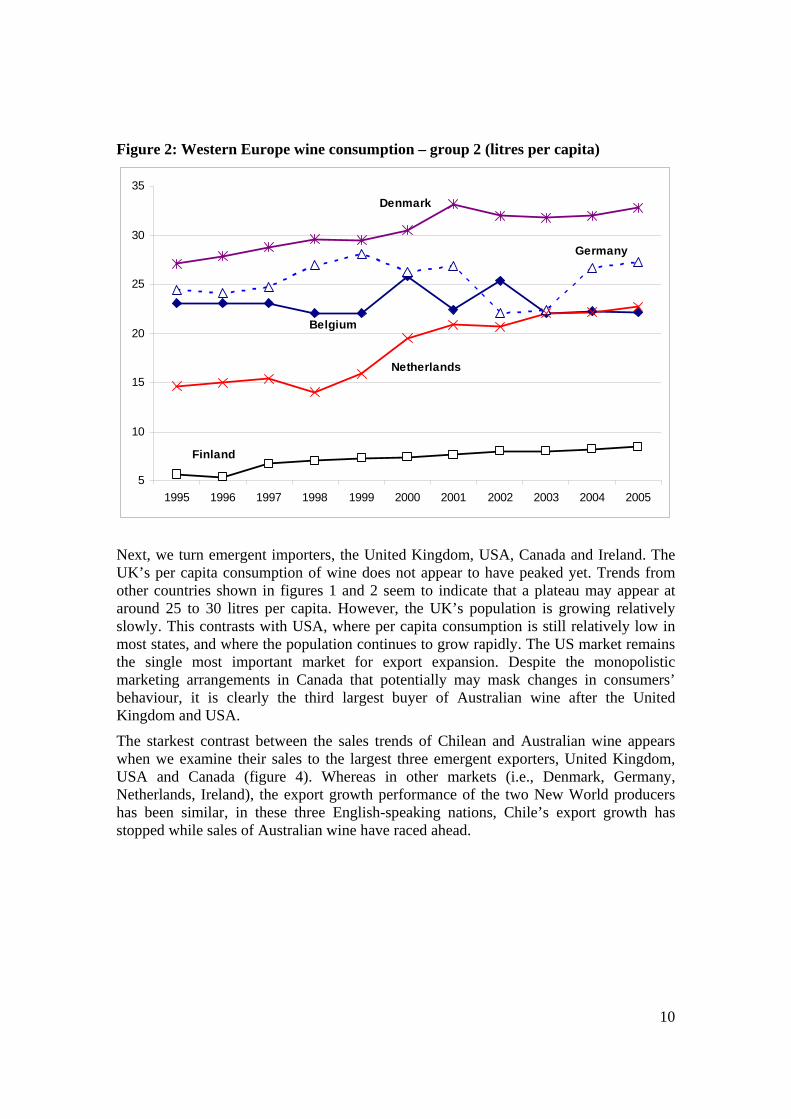
Figure 2 shows a different group of Western European consumers. In Denmark, the Netherlands and Finland, per capita consumption is rising and with it good prospects for increased sales from exporting nations. Although Germany’s per capita consumption appears relatively stable, there appears to be growing demand for red wine. This might be due to the publicized health benefits of moderate red wine consumption combined with a possible perception that some German wines, although soundly made and consistent, are a little old-fashioned. We have already flagged the possibility that Australia may already have overtaken Chile in the German export in volume terms, having matched Chile’s sales to Germany in value terms since the turn of the millennium. The Netherlands has become an increasingly important destination for wine from both Chile and Australia, with uncannily similar sales in both value and volume terms since 1999. The Netherlands and Germany give us examples of the importance of understanding what goes on in a particular market. As the world’s largest importer of wine, Germany may have been regarded by some exporters as a key market in which to increase sales. Both Chilean and Australian exporters have succeeded in increasing their market shares in Germany. However, the Netherlands remains only a slightly less important destination for these two producers. The difference between Germany and the Netherlands is apparent in figure 2: there has been an unambiguous increase in wine consumption per capita in the latter that has enlarged its import demand.
10
Figure 2: Western Europe wine consumption – group 2 (litres per capita)
5
10
15
20
25
30
35
1995 1996 1997 1998 1999 2000 2001 2002 2003 2004 2005
Belgium
Denmark
Germany
Netherlands
Finland
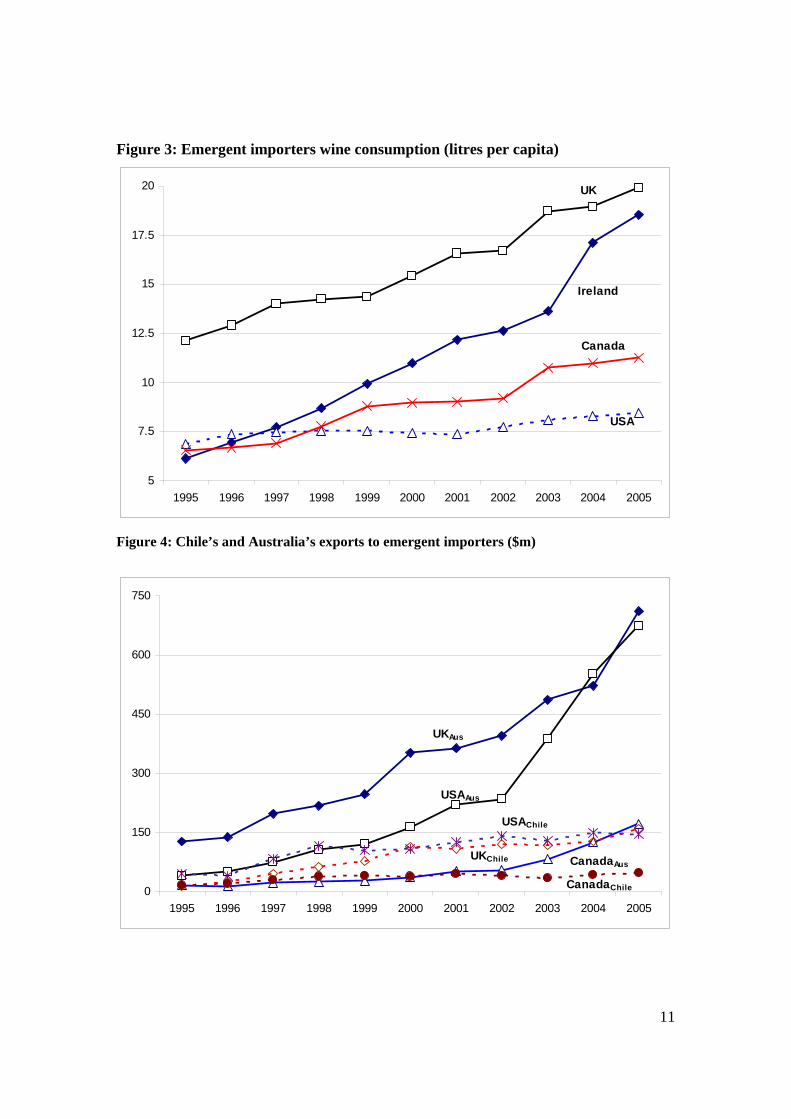
Next, we turn emergent importers, the United Kingdom, USA, Canada and Ireland. The UK’s per capita consumption of wine does not appear to have peaked yet. Trends from other countries shown in figures 1 and 2 seem to indicate that a plateau may appear at around 25 to 30 litres per capita. However, the UK’s population is growing relatively slowly. This contrasts with USA, where per capita consumption is still relatively low in most states, and where the population continues to grow rapidly. The US market remains the single most important market for export expansion. Despite the monopolistic marketing arrangements in Canada that potentially may mask changes in consumers’ behaviour, it is clearly the third largest buyer of Australian wine after the United Kingdom and USA.
The starkest contrast between the sales trends of Chilean and Australian wine appears when we examine their sales to the largest three emergent exporters, United Kingdom, USA and Canada (figure 4). Whereas in other markets (i.e., Denmark, Germany, Netherlands, Ireland), the export growth performance of the two New World producers has been similar, in these three English-speaking nations, Chile’s export growth has stopped while sales of Australian wine have raced ahead.
11
Figure 3: Emergent importers wine consumption (litres per capita)
5
7.5
10
12.5
15
17.5
20
1995 1996 1997 1998 1999 2000 2001 2002 2003 2004 2005
Canada
UK
Ireland
USA
Figure 4: Chile’s and Australia’s exports to emergent importers ($m)
0
150
300
450
600
750
1995 1996 1997 1998 1999 2000 2001 2002 2003 2004 2005
UKChile
USAAus
CanadaChile
UKAus
USAChile
CanadaAus
12
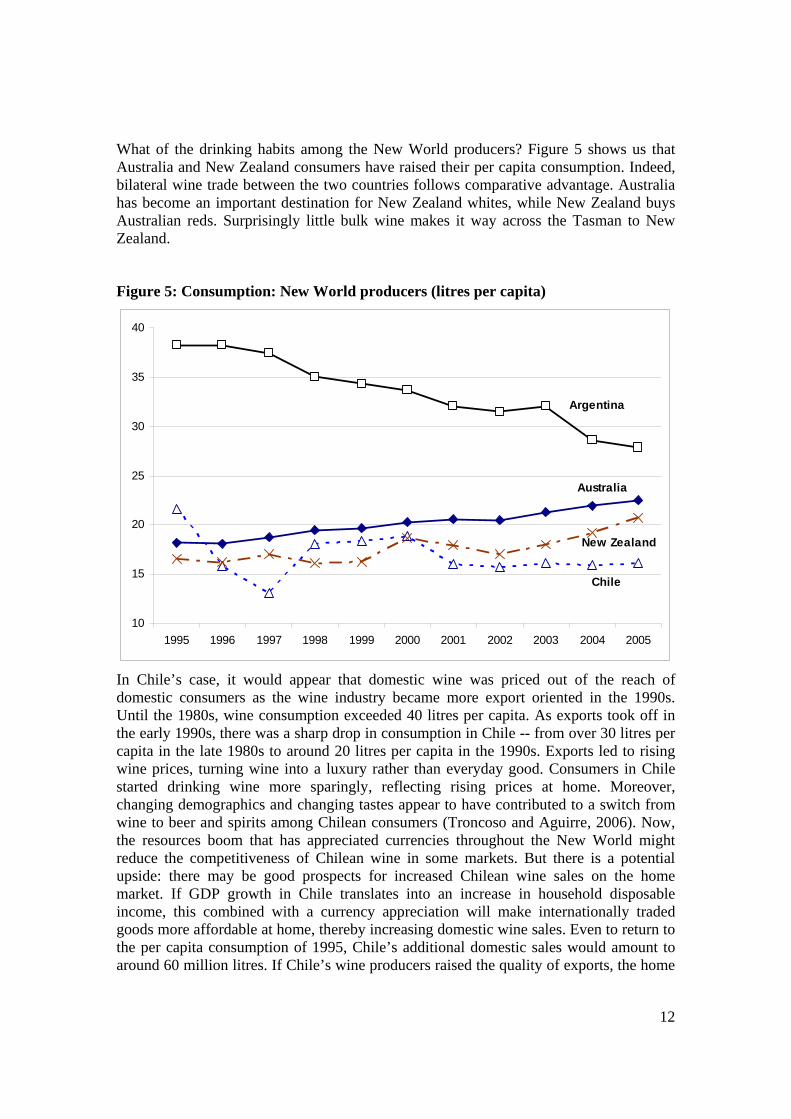
What of the drinking habits among the New World producers? Figure 5 shows us that Australia and New Zealand consumers have raised their per capita consumption. Indeed, bilateral wine trade between the two countries follows comparative advantage. Australia has become an important destination for New Zealand whites, while New Zealand buys Australian reds. Surprisingly little bulk wine makes it way across the Tasman to New Zealand.
Figure 5: Consumption: New World producers (litres per capita)
10
15
20
25
30
35
40
1995 1996 1997 1998 1999 2000 2001 2002 2003 2004 2005
Australia
Argentina
Chile
New Zealand
In Chile’s case, it would appear that domestic wine was priced out of the reach of domestic consumers as the wine industry became more export oriented in the 1990s. Until the 1980s, wine consumption exceeded 40 litres per capita. As exports took off in the early 1990s, there was a sharp drop in consumption in Chile -- from over 30 litres per capita in the late 1980s to around 20 litres per capita in the 1990s. Exports led to rising wine prices, turning wine into a luxury rather than everyday good. Consumers in Chile started drinking wine more sparingly, reflecting rising prices at home. Moreover, changing demographics and changing tastes appear to have contributed to a switch from wine to beer and spirits among Chilean consumers (Troncoso and Aguirre, 2006). Now, the resources boom that has appreciated currencies throughout the New World might reduce the competitiveness of Chilean wine in some markets. But there is a potential upside: there may be good prospects for increased Chilean wine sales on the home market. If GDP growth in Chile translates into an increase in household disposable income, this combined with a currency appreciation will make internationally traded goods more affordable at home, thereby increasing domestic wine sales. Even to return to the per capita consumption of 1995, Chile’s additional domestic sales would amount to around 60 million litres. If Chile’s wine producers raised the quality of exports, the home
13
market might provide a destination for commercial premium wine that has lost some competitiveness in some export markets.7
In Australia, there is some sort of symbiosis between domestic and export sales. Smaller wineries have until the turn of the millennium concentrated on the domestic market. Wine tourism has played an important part in the profile of the domestic industry. While large corporate wineries may still dominate the volume of Australian exports, small wineries have increased their exports in the past few years. Some have seen this as a necessary strategy as the domestic wine grape glut led to heavy discounting in the domestic market. Even as the share of exports in total sales has increased, now exceeding 50% of production, the domestic market has remained important – even more so as the average quality consumed has risen. The share of bulk wine in domestic sales has been shrinking over the past two decades. In the 1980s, cask wine sales dominated the volume of total domestic sales. As the consumer discernment has grown, the role of cask wine has diminished. For the first time since the advent of the cask, the volume of table wine sold in bottles exceeded the volume of soft pack sales in 2005 (ABS, 2006). The Australian industry wishes to keep a solid base of domestic sales. Among other considerations, such sales reduce the exposure of wine companies to exchange rate fluctuations.
Has Chile marketed wine in different increments of the quality range in the US market? Chile has some profile in the top end, judging by expensive wines available for purchases via internet sites in USA. But its commercial premium wine, which represents most sales, may not be sufficiently superior to “Two Buck Chuck” for it to remain competitive. If so, the best strategy might be to raise the quality of its currently commercial premium exports so as to differentiate it from the “extreme value” wines. There appears to be plenty of room in the US market for such differentiation.
If Chile starts to increase wine sales to North America, will it do so at the expense of Australia? In all probability, Chile could establish new sales and revitalise its image in the North American market without eating into the sales of other products: there may be plenty of room for all suppliers to expand sales. Differentiation is necessary. USA has the highest average retail prices for wine sales among the large markets. No longer is it sufficient to aim for value-for-money products in the lower commercial premium range.
Supply growth
The Australia and New Zealand wine industries have experienced a dramatic increase in wine input since the turn of the millennium. There has also been a sharp increase in production in Chile, contrasting with its downward trend in consumption. USA has also experienced a large increase in wine output, albeit from a much higher base. Both Chile and USA are already large producers of table grapes. Their respective increases in wine output have not resulted from the same dramatic increase in vineyard plantings in Australia and New Zealand, where table grape plantings are much smaller. However, it almost certain that export supply expansion by the Australasian neighbours has driven down returns to wine producers in the Americas.
7 As noted earlier, selling lower quality on average at home is not rare. USA is virtually the only market in the world in which the average quality of home wines on the domestic market exceeds the average quality of exports.
14
Australia’s excess supply growth in the new millennium until the drought of 2007 remained well ahead of export sales growth. Before the drought, sales in the USA provided the best prospects for premium sales growth. China remains the only destination in which we can anticipate substantial growth in bulk wine sales. Now, it would appear that we are entering an era in which supply expansions in the New World play a smaller part and product differentiation strategies a bigger part in shaping global wine trade patterns. Maybe, Australia’s bulk wine sales will displace some of Chile’s sales in China, although there may be plenty of room for both. Yet, will Australia’s sales made from wine grapes raise the quality of product that Chinese distributors expect in the future? If so, Chile may find it difficult to continue exporting product made substantially from table grapes.
We assume that there are only modest changes in wine supply, at least relative to the rapid growth in Australian, New Zealand and Chile between the mid-1990s and 2005. In tables 1 to 6, the effect of these supply changes appear in column (3).
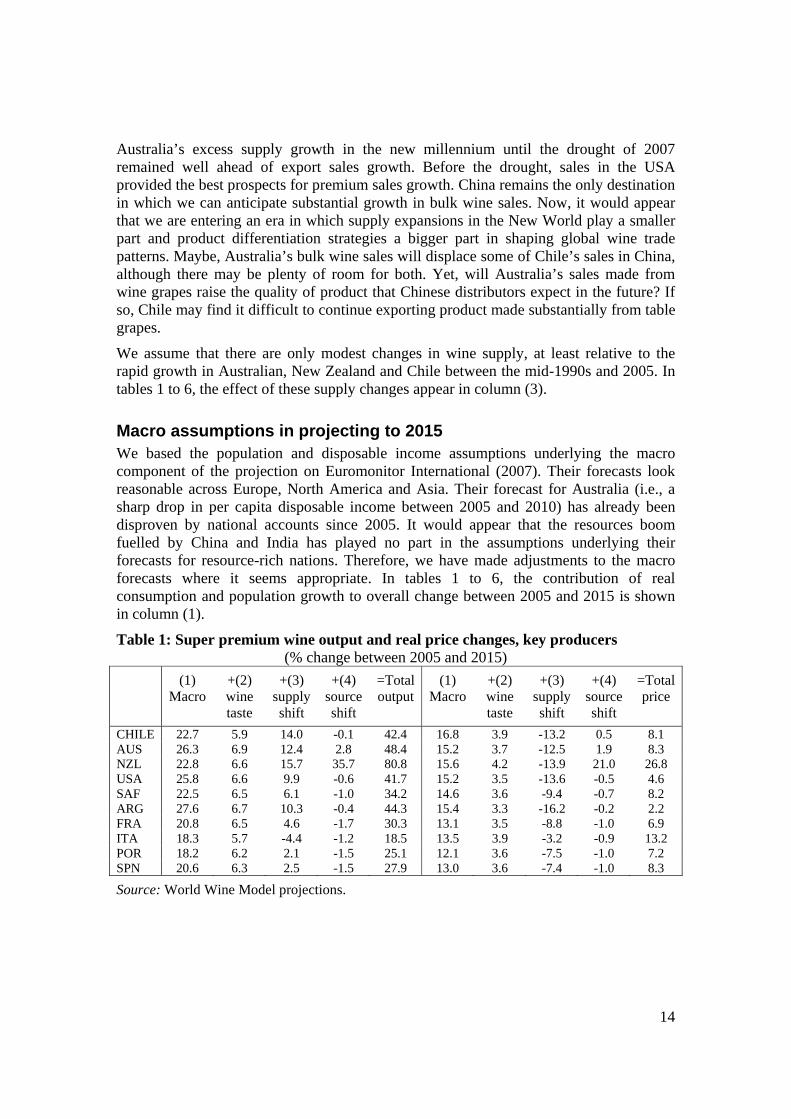
Macro assumptions in projecting to 2015 We based the population and disposable income assumptions underlying the macro component of the projection on Euromonitor International (2007). Their forecasts look reasonable across Europe, North America and Asia. Their forecast for Australia (i.e., a sharp drop in per capita disposable income between 2005 and 2010) has already been disproven by national accounts since 2005. It would appear that the resources boom fuelled by China and India has played no part in the assumptions underlying their forecasts for resource-rich nations. Therefore, we have made adjustments to the macro forecasts where it seems appropriate. In tables 1 to 6, the contribution of real consumption and population growth to overall change between 2005 and 2015 is shown in column (1).
Table 1: Super premium wine output and real price changes, key producers (% change between 2005 and 2015)
(1) Macro
+(2) wine taste
+(3) supply shift
+(4) source shift
=Total output
(1) Macro
+(2) wine taste
+(3) supply shift
+(4) source shift
=Total price
CHILE 22.7 5.9 14.0 -0.1 42.4 16.8 3.9 -13.2 0.5 8.1 AUS 26.3 6.9 12.4 2.8 48.4 15.2 3.7 -12.5 1.9 8.3 NZL 22.8 6.6 15.7 35.7 80.8 15.6 4.2 -13.9 21.0 26.8 USA 25.8 6.6 9.9 -0.6 41.7 15.2 3.5 -13.6 -0.5 4.6 SAF 22.5 6.5 6.1 -1.0 34.2 14.6 3.6 -9.4 -0.7 8.2 ARG 27.6 6.7 10.3 -0.4 44.3 15.4 3.3 -16.2 -0.2 2.2 FRA 20.8 6.5 4.6 -1.7 30.3 13.1 3.5 -8.8 -1.0 6.9 ITA 18.3 5.7 -4.4 -1.2 18.5 13.5 3.9 -3.2 -0.9 13.2 POR 18.2 6.2 2.1 -1.5 25.1 12.1 3.6 -7.5 -1.0 7.2 SPN 20.6 6.3 2.5 -1.5 27.9 13.0 3.6 -7.4 -1.0 8.3
Source: World Wine Model projections.
15
Two sets of taste change assumptions in projecting to 2015
Figures 1 to 3 show the per capita consumption trends for different consumers over time. Most consumption in nations that consume more than 30 litres of wine per capita is of jug or cask wine, rather than commercial- or super-premium wine. Therefore, by ascribing a uniform positive taste swing to the premium wine types, which have a low weighting in the total volume consumed in such nations, combined with a uniform negative swing on non-premium wine, the trend towards fall wine consumption per capita will continue in those nations where non-premium wine dominates. Conversely, in nations such as USA and United Kingdom, where the premium wine types accounts for larger initial share of total wine consumption, the same taste swings are likely to result in an increase in per capita consumption. Column (2) of tables 1 to 6 contains the impact of taste swing towards premium wine types. Hence, in tables 1, 2, 4 and 5 (each of which deals with either commercial-premium or super-premium wine) the contributions to volumes and prices are positive. Tables 3 and 6 deal with non-premium wine. Consequently, the taste swing shown in column (2) makes a negative contribution.
The second type of taste swing we model is geographic source-specific rather than wine-type swing. We assume that there is a positive swing among importers towards super-premium wines originating in New Zealand, Australia and Chile. The only other geographic taste swing we assume is for China’s imports. We assume that it favours Australian bulk wine at the expense of Chilean bulk wine. In tables 1 to 6, the contributions of the geographic taste swings to the total impacts appear in column (4).
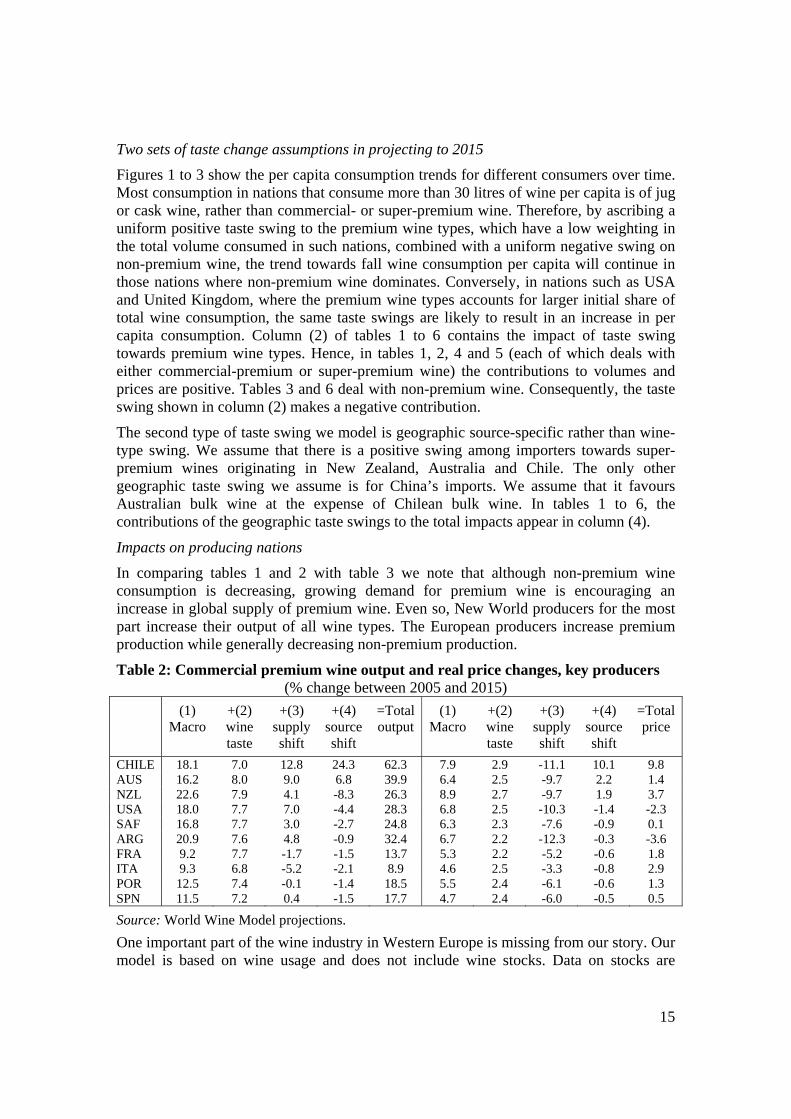
Impacts on producing nations
In comparing tables 1 and 2 with table 3 we note that although non-premium wine consumption is decreasing, growing demand for premium wine is encouraging an increase in global supply of premium wine. Even so, New World producers for the most part increase their output of all wine types. The European producers increase premium production while generally decreasing non-premium production.
Table 2: Commercial premium wine output and real price changes, key producers (% change between 2005 and 2015)
(1) Macro
+(2) wine taste
+(3) supply shift
+(4) source shift
=Total output
(1) Macro
+(2) wine taste
+(3) supply shift
+(4) source shift
=Total price
CHILE 18.1 7.0 12.8 24.3 62.3 7.9 2.9 -11.1 10.1 9.8 AUS 16.2 8.0 9.0 6.8 39.9 6.4 2.5 -9.7 2.2 1.4 NZL 22.6 7.9 4.1 -8.3 26.3 8.9 2.7 -9.7 1.9 3.7 USA 18.0 7.7 7.0 -4.4 28.3 6.8 2.5 -10.3 -1.4 -2.3 SAF 16.8 7.7 3.0 -2.7 24.8 6.3 2.3 -7.6 -0.9 0.1 ARG 20.9 7.6 4.8 -0.9 32.4 6.7 2.2 -12.3 -0.3 -3.6 FRA 9.2 7.7 -1.7 -1.5 13.7 5.3 2.2 -5.2 -0.6 1.8ITA 9.3 6.8 -5.2 -2.1 8.9 4.6 2.5 -3.3 -0.8 2.9 POR 12.5 7.4 -0.1 -1.4 18.5 5.5 2.4 -6.1 -0.6 1.3 SPN 11.5 7.2 0.4 -1.5 17.7 4.7 2.4 -6.0 -0.5 0.5
Source: World Wine Model projections. One important part of the wine industry in Western Europe is missing from our story. Our model is based on wine usage and does not include wine stocks. Data on stocks are
16
unreliable and appear to understate stocks that have built up in Europe. We have not modelled changes in the supply of industrial wine, that is, wine used in distillation. Our expectation is that wine used for industrial purposes in Western Europe will decrease over the next decade. With enlargement of the European Union, distortionary subsidies that have promoted production of wine for which there is little market are likely to cease.
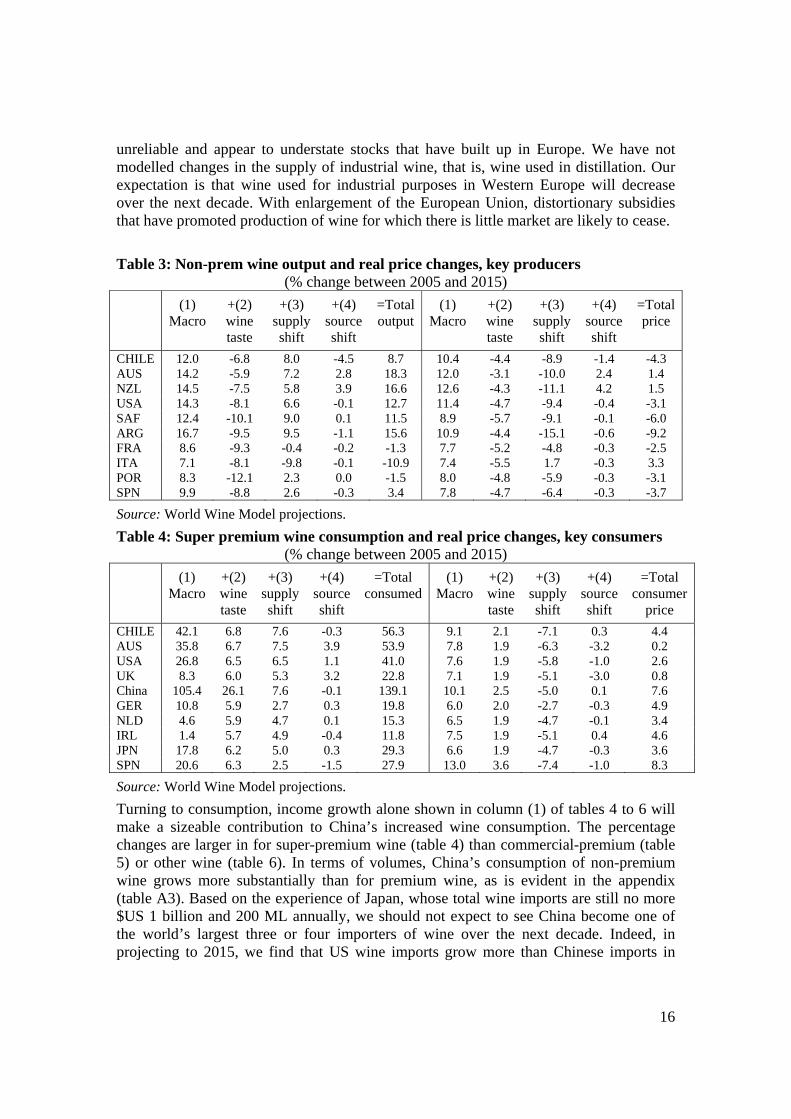
Table 3: Non-prem wine output and real price changes, key producers
(% change between 2005 and 2015) (1)
Macro +(2) wine taste
+(3) supply shift
+(4) source shift
=Total output
(1) Macro
+(2) wine taste
+(3) supply shift
+(4) source shift
=Total price
CHILE 12.0 -6.8 8.0 -4.5 8.7 10.4 -4.4 -8.9 -1.4 -4.3 AUS 14.2 -5.9 7.2 2.8 18.3 12.0 -3.1 -10.0 2.4 1.4 NZL 14.5 -7.5 5.8 3.9 16.6 12.6 -4.3 -11.1 4.2 1.5 USA 14.3 -8.1 6.6 -0.1 12.7 11.4 -4.7 -9.4 -0.4 -3.1 SAF 12.4 -10.1 9.0 0.1 11.5 8.9 -5.7 -9.1 -0.1 -6.0 ARG 16.7 -9.5 9.5 -1.1 15.6 10.9 -4.4 -15.1 -0.6 -9.2 FRA 8.6 -9.3 -0.4 -0.2 -1.3 7.7 -5.2 -4.8 -0.3 -2.5 ITA 7.1 -8.1 -9.8 -0.1 -10.9 7.4 -5.5 1.7 -0.3 3.3 POR 8.3 -12.1 2.3 0.0 -1.5 8.0 -4.8 -5.9 -0.3 -3.1 SPN 9.9 -8.8 2.6 -0.3 3.4 7.8 -4.7 -6.4 -0.3 -3.7
Source: World Wine Model projections. Table 4: Super premium wine consumption and real price changes, key consumers
(% change between 2005 and 2015) (1)
Macro +(2) wine taste
+(3) supply shift
+(4) source shift
=Total consumed
(1) Macro
+(2) wine taste
+(3) supply shift
+(4) source shift
=Total consumer
price CHILE 42.1 6.8 7.6 -0.3 56.3 9.1 2.1 -7.1 0.3 4.4 AUS 35.8 6.7 7.5 3.9 53.9 7.8 1.9 -6.3 -3.2 0.2 USA 26.8 6.5 6.5 1.1 41.0 7.6 1.9 -5.8 -1.0 2.6 UK 8.3 6.0 5.3 3.2 22.8 7.1 1.9 -5.1 -3.0 0.8 China 105.4 26.1 7.6 -0.1 139.1 10.1 2.5 -5.0 0.1 7.6 GER 10.8 5.9 2.7 0.3 19.8 6.0 2.0 -2.7 -0.3 4.9 NLD 4.6 5.9 4.7 0.1 15.3 6.5 1.9 -4.7 -0.1 3.4 IRL 1.4 5.7 4.9 -0.4 11.8 7.5 1.9 -5.1 0.4 4.6 JPN 17.8 6.2 5.0 0.3 29.3 6.6 1.9 -4.7 -0.3 3.6 SPN 20.6 6.3 2.5 -1.5 27.9 13.0 3.6 -7.4 -1.0 8.3
Source: World Wine Model projections. Turning to consumption, income growth alone shown in column (1) of tables 4 to 6 will make a sizeable contribution to China’s increased wine consumption. The percentage changes are larger in for super-premium wine (table 4) than commercial-premium (table 5) or other wine (table 6). In terms of volumes, China’s consumption of non-premium wine grows more substantially than for premium wine, as is evident in the appendix (table A3). Based on the experience of Japan, whose total wine imports are still no more $US 1 billion and 200 ML annually, we should not expect to see China become one of the world’s largest three or four importers of wine over the next decade. Indeed, in projecting to 2015, we find that US wine imports grow more than Chinese imports in
17
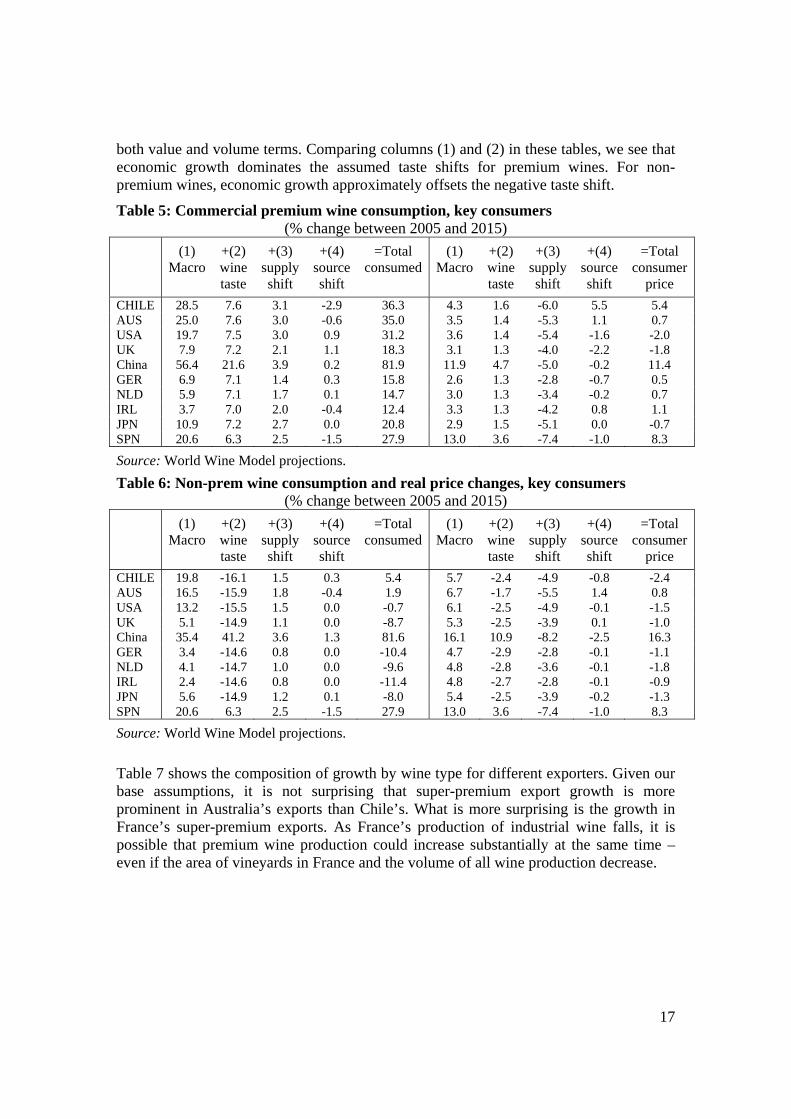
both value and volume terms. Comparing columns (1) and (2) in these tables, we see that economic growth dominates the assumed taste shifts for premium wines. For non-premium wines, economic growth approximately offsets the negative taste shift.
Table 5: Commercial premium wine consumption, key consumers (% change between 2005 and 2015)
(1) Macro
+(2) wine taste
+(3) supply shift
+(4) source shift
=Total consumed
(1) Macro
+(2) wine taste
+(3) supply shift
+(4) source shift
=Total consumer
price CHILE 28.5 7.6 3.1 -2.9 36.3 4.3 1.6 -6.0 5.5 5.4 AUS 25.0 7.6 3.0 -0.6 35.0 3.5 1.4 -5.3 1.1 0.7 USA 19.7 7.5 3.0 0.9 31.2 3.6 1.4 -5.4 -1.6 -2.0 UK 7.9 7.2 2.1 1.1 18.3 3.1 1.3 -4.0 -2.2 -1.8 China 56.4 21.6 3.9 0.2 81.9 11.9 4.7 -5.0 -0.2 11.4 GER 6.9 7.1 1.4 0.3 15.8 2.6 1.3 -2.8 -0.7 0.5NLD 5.9 7.1 1.7 0.1 14.7 3.0 1.3 -3.4 -0.2 0.7 IRL 3.7 7.0 2.0 -0.4 12.4 3.3 1.3 -4.2 0.8 1.1 JPN 10.9 7.2 2.7 0.0 20.8 2.9 1.5 -5.1 0.0 -0.7 SPN 20.6 6.3 2.5 -1.5 27.9 13.0 3.6 -7.4 -1.0 8.3
Source: World Wine Model projections. Table 6: Non-prem wine consumption and real price changes, key consumers
(% change between 2005 and 2015) (1)
Macro +(2) wine taste
+(3) supply shift
+(4) source shift
=Total consumed
(1) Macro
+(2) wine taste
+(3) supply shift
+(4) source shift
=Total consumer
price CHILE 19.8 -16.1 1.5 0.3 5.4 5.7 -2.4 -4.9 -0.8 -2.4 AUS 16.5 -15.9 1.8 -0.4 1.9 6.7 -1.7 -5.5 1.4 0.8 USA 13.2 -15.5 1.5 0.0 -0.7 6.1 -2.5 -4.9 -0.1 -1.5 UK 5.1 -14.9 1.1 0.0 -8.7 5.3 -2.5 -3.9 0.1 -1.0China 35.4 41.2 3.6 1.3 81.6 16.1 10.9 -8.2 -2.5 16.3 GER 3.4 -14.6 0.8 0.0 -10.4 4.7 -2.9 -2.8 -0.1 -1.1 NLD 4.1 -14.7 1.0 0.0 -9.6 4.8 -2.8 -3.6 -0.1 -1.8 IRL 2.4 -14.6 0.8 0.0 -11.4 4.8 -2.7 -2.8 -0.1 -0.9 JPN 5.6 -14.9 1.2 0.1 -8.0 5.4 -2.5 -3.9 -0.2 -1.3 SPN 20.6 6.3 2.5 -1.5 27.9 13.0 3.6 -7.4 -1.0 8.3
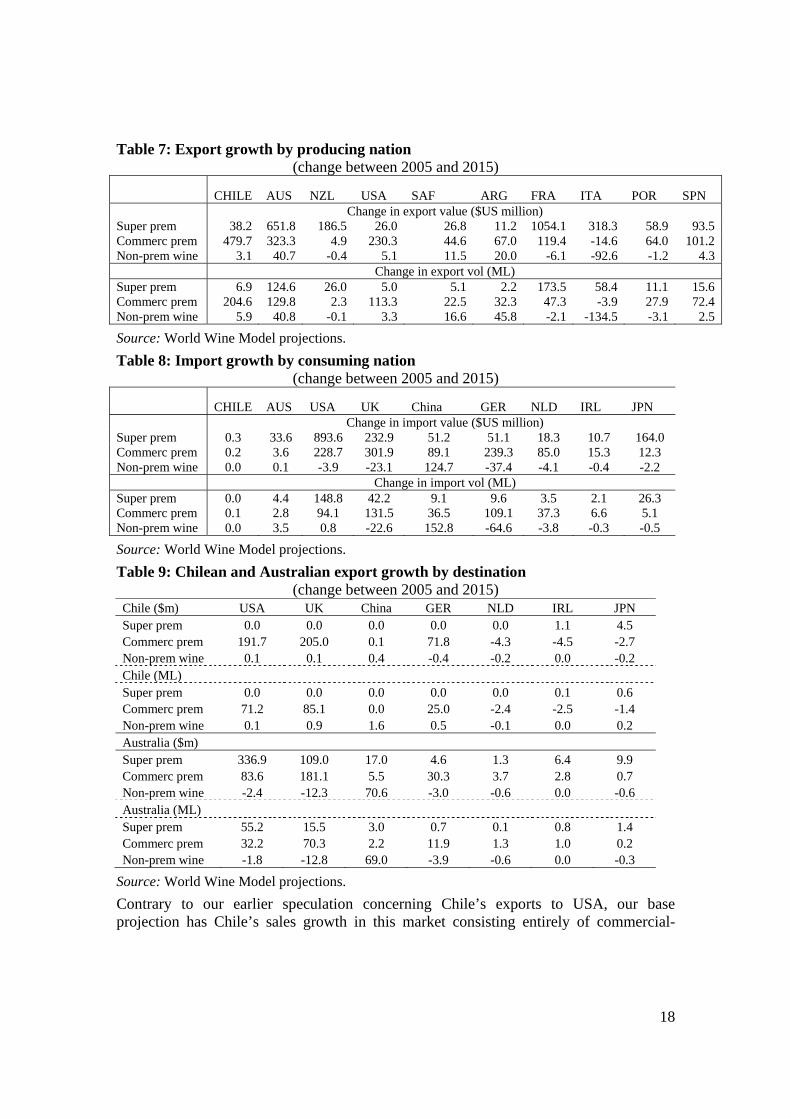
Source: World Wine Model projections. Table 7 shows the composition of growth by wine type for different exporters. Given our base assumptions, it is not surprising that super-premium export growth is more prominent in Australia’s exports than Chile’s. What is more surprising is the growth in France’s super-premium exports. As France’s production of industrial wine falls, it is possible that premium wine production could increase substantially at the same time – even if the area of vineyards in France and the volume of all wine production decrease.
18
Table 7: Export growth by producing nation (change between 2005 and 2015)
CHILE AUS NZL USA SAF ARG FRA ITA POR SPN Change in export value ($US million) Super prem 38.2 651.8 186.5 26.0 26.8 11.2 1054.1 318.3 58.9 93.5 Commerc prem 479.7 323.3 4.9 230.3 44.6 67.0 119.4 -14.6 64.0 101.2 Non-prem wine 3.1 40.7 -0.4 5.1 11.5 20.0 -6.1 -92.6 -1.2 4.3 Change in export vol (ML) Super prem 6.9 124.6 26.0 5.0 5.1 2.2 173.5 58.4 11.1 15.6 Commerc prem 204.6 129.8 2.3 113.3 22.5 32.3 47.3 -3.9 27.9 72.4 Non-prem wine 5.9 40.8 -0.1 3.3 16.6 45.8 -2.1 -134.5 -3.1 2.5
Source: World Wine Model projections. Table 8: Import growth by consuming nation
(change between 2005 and 2015) CHILE AUS USA UK China GER NLD IRL JPN Change in import value ($US million) Super prem 0.3 33.6 893.6 232.9 51.2 51.1 18.3 10.7 164.0 Commerc prem 0.2 3.6 228.7 301.9 89.1 239.3 85.0 15.3 12.3 Non-prem wine 0.0 0.1 -3.9 -23.1 124.7 -37.4 -4.1 -0.4 -2.2 Change in import vol (ML) Super prem 0.0 4.4 148.8 42.2 9.1 9.6 3.5 2.1 26.3Commerc prem 0.1 2.8 94.1 131.5 36.5 109.1 37.3 6.6 5.1 Non-prem wine 0.0 3.5 0.8 -22.6 152.8 -64.6 -3.8 -0.3 -0.5
Source: World Wine Model projections. Table 9: Chilean and Australian export growth by destination
(change between 2005 and 2015) Chile ($m) USA UK China GER NLD IRL JPN Super prem 0.0 0.0 0.0 0.0 0.0 1.1 4.5 Commerc prem 191.7 205.0 0.1 71.8 -4.3 -4.5 -2.7 Non-prem wine 0.1 0.1 0.4 -0.4 -0.2 0.0 -0.2 Chile (ML) Super prem 0.0 0.0 0.0 0.0 0.0 0.1 0.6 Commerc prem 71.2 85.1 0.0 25.0 -2.4 -2.5 -1.4 Non-prem wine 0.1 0.9 1.6 0.5 -0.1 0.0 0.2 Australia ($m) Super prem 336.9 109.0 17.0 4.6 1.3 6.4 9.9 Commerc prem 83.6 181.1 5.5 30.3 3.7 2.8 0.7 Non-prem wine -2.4 -12.3 70.6 -3.0 -0.6 0.0 -0.6 Australia (ML) Super prem 55.2 15.5 3.0 0.7 0.1 0.8 1.4 Commerc prem 32.2 70.3 2.2 11.9 1.3 1.0 0.2 Non-prem wine -1.8 -12.8 69.0 -3.9 -0.6 0.0 -0.3
Source: World Wine Model projections. Contrary to our earlier speculation concerning Chile’s exports to USA, our base projection has Chile’s sales growth in this market consisting entirely of commercial-
19
premium wine.8 There is a similar pattern in the United Kingdom. This need not be so: Chile’s strategy may be to move into super-premium exports in these two markets. What emerges from our modelling is that sales to USA and United Kingdom will dominate Chile’s export growth, accounting between them for around 75% of the volume of Chile’s total wine export growth in the decade to 2015. Chile’s sales to growth to Germany will be larger than Australia’s. Australia will be relatively dominant in sales growth to China, although the value of sales (less than $US 100 million for all wine, table 9) is not large relative to growth in other markets.
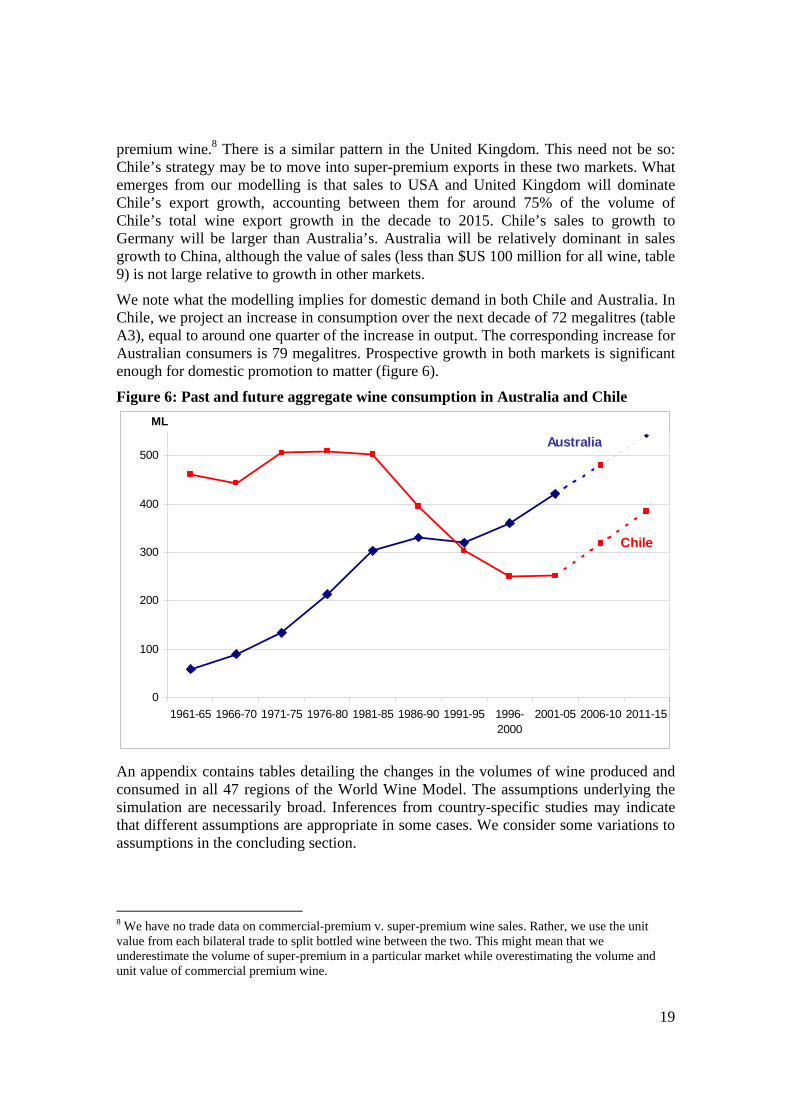
We note what the modelling implies for domestic demand in both Chile and Australia. In Chile, we project an increase in consumption over the next decade of 72 megalitres (table A3), equal to around one quarter of the increase in output. The corresponding increase for Australian consumers is 79 megalitres. Prospective growth in both markets is significant enough for domestic promotion to matter (figure 6).
Figure 6: Past and future aggregate wine consumption in Australia and Chile An appendix contains tables detailing the changes in the volumes of wine produced and consumed in all 47 regions of the World Wine Model. The assumptions underlying the simulation are necessarily broad. Inferences from country-specific studies may indicate that different assumptions are appropriate in some cases. We consider some variations to assumptions in the concluding section.
8 We have no trade data on commercial-premium v. super-premium wine sales. Rather, we use the unit value from each bilateral trade to split bottled wine between the two. This might mean that we underestimate the volume of super-premium in a particular market while overestimating the volume and unit value of commercial premium wine.
0
100
200
300
400
500
1961-65 1966-70 1971-75 1976-80 1981-85 1986-90 1991-95 1996-2000
2001-05 2006-10 2011-15
ML
Australia
Chile
20
Possible alterations to our 2015 projection There are a number of developments that might alter the projections outlined in this paper. In the case of Chile, we think that most export growth will be in sales to USA and United Kingdom. Yet it is possible that in the US market in particular, there will be more growth in super-premium exports than we have modelled. At the same time, there may be a larger per capita increase in Chilean home consumption. This would not indicate a movement back towards consumption levels of the 1980s, when most consumption was of low quality wine. Rather, we might expect more commercial premium consumption with an enhanced consumer image for wine in the home market. That is, consumers on average would still be drinking less than in the 1980s but drinking better wine, following a pattern already observed elsewhere.
In our analysis, we have not discussed Argentina’s production, consumption or exports. Once regarded as a sleeping giant in the wine world, Argentina does not appear to have a wine image comparable to other New World producers. In some respects, Argentina may have been the mirror image of Chile, concentrating on domestic growth with a limited export profile. With growing globalization in the world wine market, this may change. One possible development is that Argentina’s sales to USA increase in the commercial premium segment, to some extent displacing Chilean wine. This may be more likely if Chile aims for higher quality increments.
In the present projections, we may have overstated future per capital consumption of wine in some Eastern European countries, namely Croatia, Hungary and Romania. We have not ascribed a much larger taste swing against non-premium wine consumption in Eastern Europe than elsewhere. If we did, per capita consumption in these countries such would either remain fairly flat or fall over time. Again, growing incomes in Eastern Europe might entail a movement away from consumption of “peasant” wine, slowly towards higher quality wine in smaller quantities.
Finally, we consider a possible alternative for China. The matching of food and wine in Western countries may never become quite as important in China, given that Chinese cuisine does not match easily to wide range of wines. This may provide a constraint to per capita growth as it has in Japan. On the basis of a sudden jump in sales from Australian to China in 2006, we have assumed that Australia will continue to increase in the Chinese market at the expense, to some extent, of Chile. Perhaps the Chinese market is the greatest of all unknowns. If, for example, consumption is twice as rapid in the next decade as we have modelled, export growth from both Chile and Australia to China will be more important. Australia’s sales growth in China may rise 100 megalitres between 2005 and 2015, while Chile’s may rise by over 50 megalitres. Exporters may regard accelerated sales to China as problematic, to the extent that they are of bulk wine and carry no brand image. This could also change over time, with foreign wines eventually acquiring a brand image in the Chinese market.
References ABS (Australian Bureau of Statistics) (2006). Catalogue 8504.0.
Adams Beverage Group (2006). Adams wine handbook.
21
Anderson, K. (2000). The Anatomy of Australia's Wine Boom: Lessons for Other Industries, May 2000. (Since published in Australian Agribusiness Review 8 (6), October 2000.)
Euromonitor International (2007). World Economic Prospects: a planner’s guide to international market conditions. http://www.euromonitor.com/pdf/wep_samples.pdf
New Zealand Winegrowers (2007). http://www.nzwine.com/statistics/
Troncoso, J. and Aguirre, M. (2006), Demanda y oferta de vino en el periodo 1980-2004: an analisis econometrico, Panorama Socioeconómico, 33:26-33.
USDA (United States Department of Agriculture) (2007a), Japan Wine Report 2006, GAIN report JA7502. http://www.fas.usda.gov/
USDA (United States Department of Agriculture) (2007b), Germany Wine Annual 2006, GAIN report GM7002 . http://www.fas.usda.gov/
Wittwer, G., Berger, N. and Anderson, K. (2003), A model of the world’s wine markets, Economic Modelling, 20(3): 487-506, May.
Wittwer, G. and Rothfield, J. (2005), Projecting the world wine market from 2003 to 2010, Australasian Agribusiness Review, 13, paper no. 21.
22
Appendix
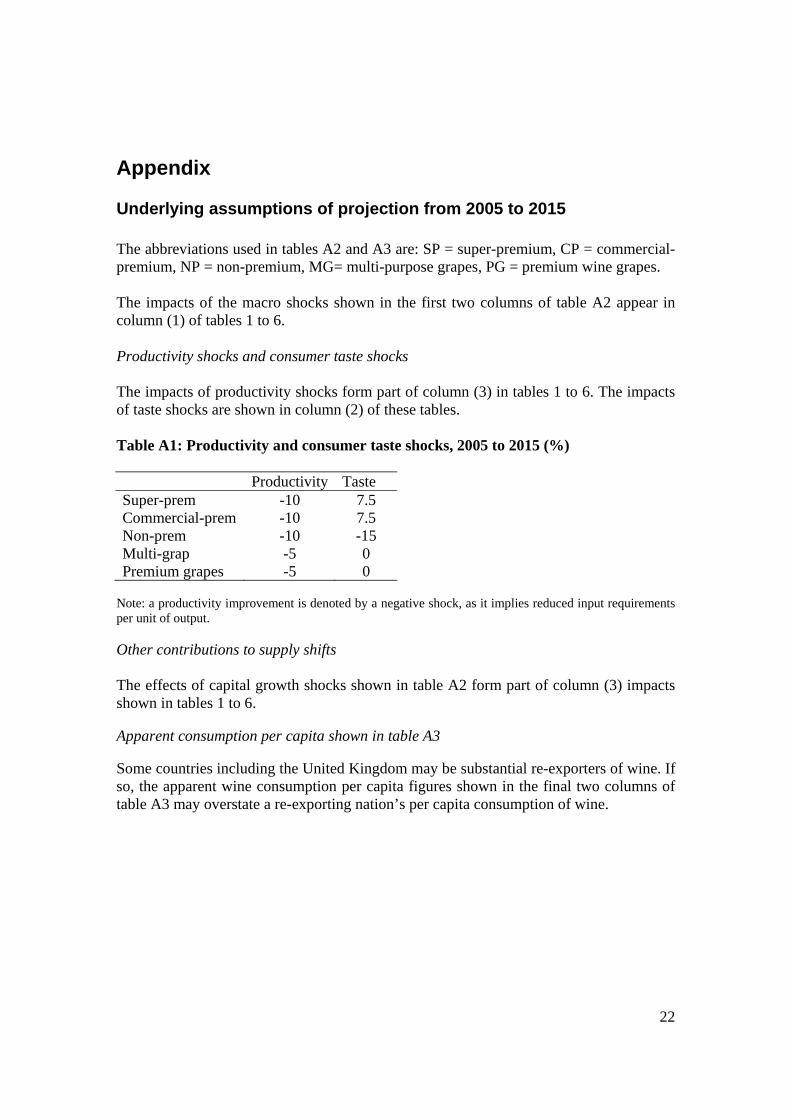
Underlying assumptions of projection from 2005 to 2015 The abbreviations used in tables A2 and A3 are: SP = super-premium, CP = commercial-premium, NP = non-premium, MG= multi-purpose grapes, PG = premium wine grapes. The impacts of the macro shocks shown in the first two columns of table A2 appear in column (1) of tables 1 to 6. Productivity shocks and consumer taste shocks The impacts of productivity shocks form part of column (3) in tables 1 to 6. The impacts of taste shocks are shown in column (2) of these tables. Table A1: Productivity and consumer taste shocks, 2005 to 2015 (%) Productivity Taste Super-prem -10 7.5 Commercial-prem -10 7.5 Non-prem -10 -15 Multi-grap -5 0 Premium grapes -5 0
Note: a productivity improvement is denoted by a negative shock, as it implies reduced input requirements per unit of output. Other contributions to supply shifts The effects of capital growth shocks shown in table A2 form part of column (3) impacts shown in tables 1 to 6. Apparent consumption per capita shown in table A3 Some countries including the United Kingdom may be substantial re-exporters of wine. If so, the apparent wine consumption per capita figures shown in the final two columns of table A3 may overstate a re-exporting nation’s per capita consumption of wine.
23
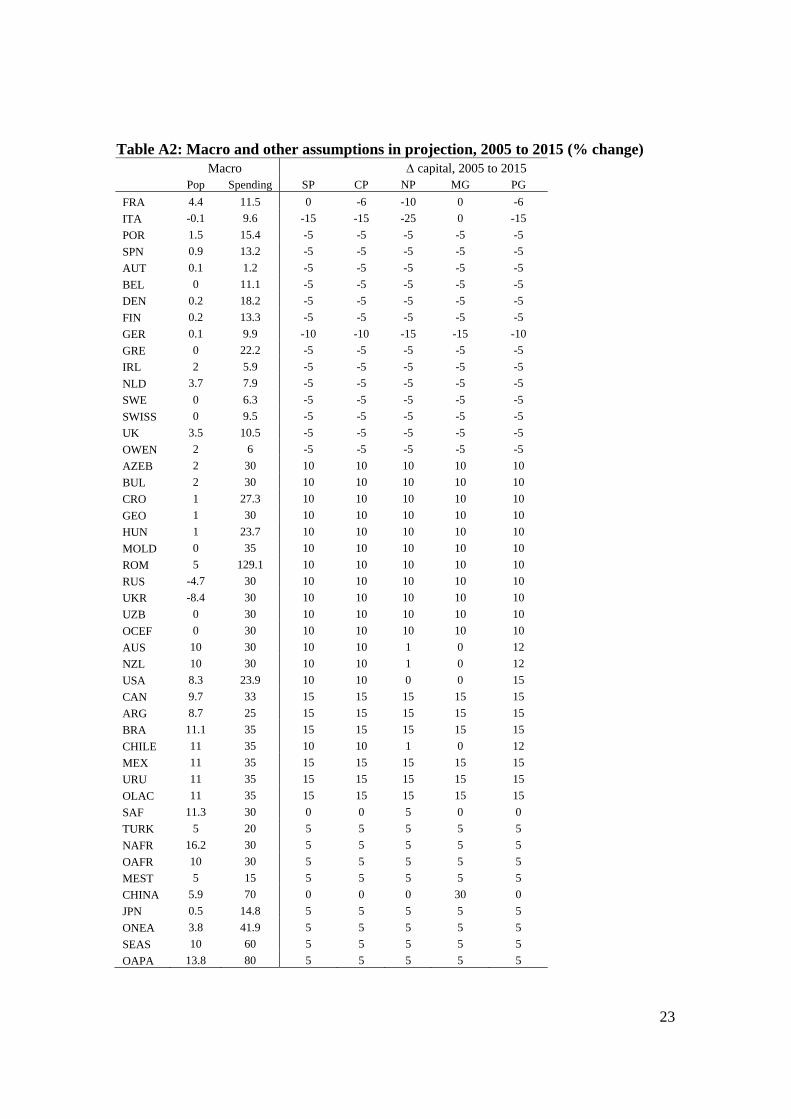
Table A2: Macro and other assumptions in projection, 2005 to 2015 (% change) Macro Δ capital, 2005 to 2015 Pop Spending SP CP NP MG PG
FRA 4.4 11.5 0 -6 -10 0 -6 ITA -0.1 9.6 -15 -15 -25 0 -15 POR 1.5 15.4 -5 -5 -5 -5 -5 SPN 0.9 13.2 -5 -5 -5 -5 -5 AUT 0.1 1.2 -5 -5 -5 -5 -5 BEL 0 11.1 -5 -5 -5 -5 -5 DEN 0.2 18.2 -5 -5 -5 -5 -5 FIN 0.2 13.3 -5 -5 -5 -5 -5 GER 0.1 9.9 -10 -10 -15 -15 -10 GRE 0 22.2 -5 -5 -5 -5 -5 IRL 2 5.9 -5 -5 -5 -5 -5 NLD 3.7 7.9 -5 -5 -5 -5 -5 SWE 0 6.3 -5 -5 -5 -5 -5 SWISS 0 9.5 -5 -5 -5 -5 -5 UK 3.5 10.5 -5 -5 -5 -5 -5 OWEN 2 6 -5 -5 -5 -5 -5 AZEB 2 30 10 10 10 10 10 BUL 2 30 10 10 10 10 10 CRO 1 27.3 10 10 10 10 10 GEO 1 30 10 10 10 10 10 HUN 1 23.7 10 10 10 10 10 MOLD 0 35 10 10 10 10 10 ROM 5 129.1 10 10 10 10 10 RUS -4.7 30 10 10 10 10 10 UKR -8.4 30 10 10 10 10 10 UZB 0 30 10 10 10 10 10 OCEF 0 30 10 10 10 10 10 AUS 10 30 10 10 1 0 12 NZL 10 30 10 10 1 0 12 USA 8.3 23.9 10 10 0 0 15 CAN 9.7 33 15 15 15 15 15 ARG 8.7 25 15 15 15 15 15 BRA 11.1 35 15 15 15 15 15 CHILE 11 35 10 10 1 0 12 MEX 11 35 15 15 15 15 15 URU 11 35 15 15 15 15 15 OLAC 11 35 15 15 15 15 15 SAF 11.3 30 0 0 5 0 0 TURK 5 20 5 5 5 5 5 NAFR 16.2 30 5 5 5 5 5 OAFR 10 30 5 5 5 5 5 MEST 5 15 5 5 5 5 5 CHINA 5.9 70 0 0 0 30 0 JPN 0.5 14.8 5 5 5 5 5 ONEA 3.8 41.9 5 5 5 5 5 SEAS 10 60 5 5 5 5 5 OAPA 13.8 80 5 5 5 5 5
24
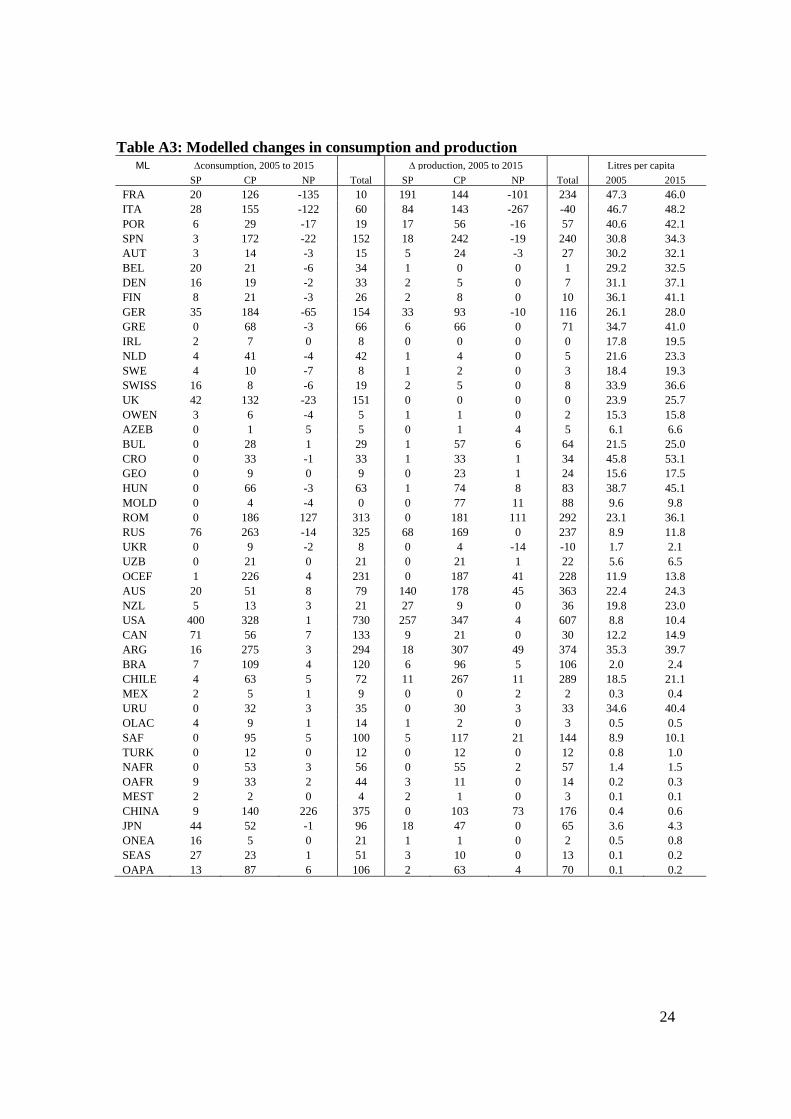
Table A3: Modelled changes in consumption and production ML Δconsumption, 2005 to 2015 Δ production, 2005 to 2015 Litres per capita
SP CP NP Total SP CP NP Total 2005 2015FRA 20 126 -135 10 191 144 -101 234 47.3 46.0ITA 28 155 -122 60 84 143 -267 -40 46.7 48.2POR 6 29 -17 19 17 56 -16 57 40.6 42.1SPN 3 172 -22 152 18 242 -19 240 30.8 34.3AUT 3 14 -3 15 5 24 -3 27 30.2 32.1BEL 20 21 -6 34 1 0 0 1 29.2 32.5DEN 16 19 -2 33 2 5 0 7 31.1 37.1FIN 8 21 -3 26 2 8 0 10 36.1 41.1GER 35 184 -65 154 33 93 -10 116 26.1 28.0GRE 0 68 -3 66 6 66 0 71 34.7 41.0IRL 2 7 0 8 0 0 0 0 17.8 19.5NLD 4 41 -4 42 1 4 0 5 21.6 23.3SWE 4 10 -7 8 1 2 0 3 18.4 19.3SWISS 16 8 -6 19 2 5 0 8 33.9 36.6UK 42 132 -23 151 0 0 0 0 23.9 25.7OWEN 3 6 -4 5 1 1 0 2 15.3 15.8AZEB 0 1 5 5 0 1 4 5 6.1 6.6BUL 0 28 1 29 1 57 6 64 21.5 25.0CRO 0 33 -1 33 1 33 1 34 45.8 53.1GEO 0 9 0 9 0 23 1 24 15.6 17.5HUN 0 66 -3 63 1 74 8 83 38.7 45.1MOLD 0 4 -4 0 0 77 11 88 9.6 9.8ROM 0 186 127 313 0 181 111 292 23.1 36.1RUS 76 263 -14 325 68 169 0 237 8.9 11.8UKR 0 9 -2 8 0 4 -14 -10 1.7 2.1UZB 0 21 0 21 0 21 1 22 5.6 6.5OCEF 1 226 4 231 0 187 41 228 11.9 13.8AUS 20 51 8 79 140 178 45 363 22.4 24.3NZL 5 13 3 21 27 9 0 36 19.8 23.0USA 400 328 1 730 257 347 4 607 8.8 10.4CAN 71 56 7 133 9 21 0 30 12.2 14.9ARG 16 275 3 294 18 307 49 374 35.3 39.7BRA 7 109 4 120 6 96 5 106 2.0 2.4CHILE 4 63 5 72 11 267 11 289 18.5 21.1MEX 2 5 1 9 0 0 2 2 0.3 0.4URU 0 32 3 35 0 30 3 33 34.6 40.4OLAC 4 9 1 14 1 2 0 3 0.5 0.5SAF 0 95 5 100 5 117 21 144 8.9 10.1TURK 0 12 0 12 0 12 0 12 0.8 1.0NAFR 0 53 3 56 0 55 2 57 1.4 1.5OAFR 9 33 2 44 3 11 0 14 0.2 0.3MEST 2 2 0 4 2 1 0 3 0.1 0.1CHINA 9 140 226 375 0 103 73 176 0.4 0.6JPN 44 52 -1 96 18 47 0 65 3.6 4.3ONEA 16 5 0 21 1 1 0 2 0.5 0.8SEAS 27 23 1 51 3 10 0 13 0.1 0.2OAPA 13 87 6 106 2 63 4 70 0.1 0.2