Embed Size (px)
Citation preview

The Global Warming Challenge:
Can policy catch up with the science?
Michael OppenheimerPrinceton University
for Washington DC Regional
Conference7 March 2009

TrappedRadiationWarmsEarth’sSurface
The Greenhouse Effect
IPCC AR4 Ch 1

Going to the ends of Earth for evidence
http://earthobservatory.nasa.gov/Study/Paleoclimatology_IceCores/

The Greenhouse Problem
IPCC WGI AR4
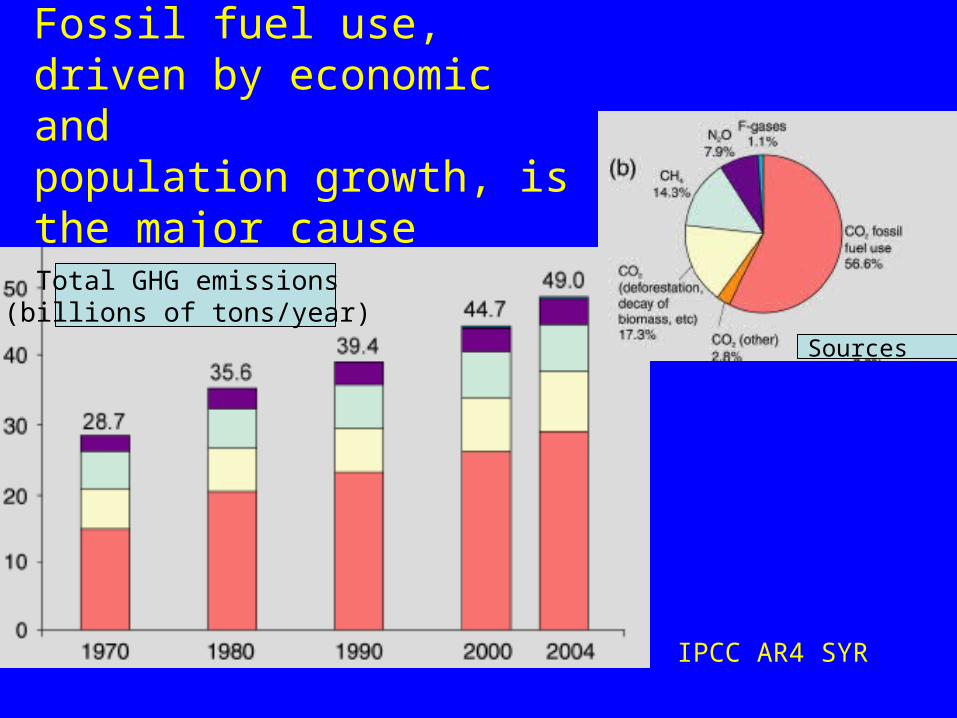
Fossil fuel use, driven by economic andpopulation growth, is the major cause
IPCC AR4 SYRSources
Total GHG emissions (billions of tons/year)
IPCC AR4 SYR

IPCC AR4
10
9
8
7
6
5
4
3
2
1
0
Em
issi
ons
(bill
ions
of
tons
CO
2/y
r)
1970 1980 1990 2000Year
Electricity plants
Industry (excl. cement)
Road transportationResidential/services sectors
Deforestation Other
RefineriesInternational transport
total emissions ≈ 36 billion tons
CO2/yr
Rapid growth in electric power and transport

Climate system primed for a big change
CO2 TodayNature 453, p.292

Physical reality outpacing responses
• Long-lived emissions, long-term commitment
• Changes already underway, more to come
• Demonstrated limits on our ability to adapt to extreme events
• Modest warming (about 20C) may imply unmanageable changes
• Window to act to avoid such warming closing rapidly
known forsome time
recent developments

CO2 accumulation, and
consequences,very persistent:How to avoid discounting?
CO2
(ppm)
∆T(0K)
Sea levelThermal
Exp.
(m)Solomon et al PNAS 2009

IPCC AR4 WGI SPM
Pervasive climate change already underway:
•Temperature
•Sea level
•Ice (glaciers) and snow
•Extreme heat( ), cold( )
•Rainstorm intensity and drought ( )
•Tropical cyclones
•Ocean acidity

Arctic Sea Ice Pack is Shrinking: Partly due to greenhouse gases, partly
natural
NSDIC
September Sea IceExtent, 1979-2008

Glaciers are retreating
1979 Today
Glacier length,globally IPCC AR4 WGI

Drought Intensity
Increasing
IPCC AR4 WGI

Species observed to be moving up and north to avoid warming...
Lenoir et al Science 2008
Comparison:1905-1985
vs. 1986-2005 for western
Europe
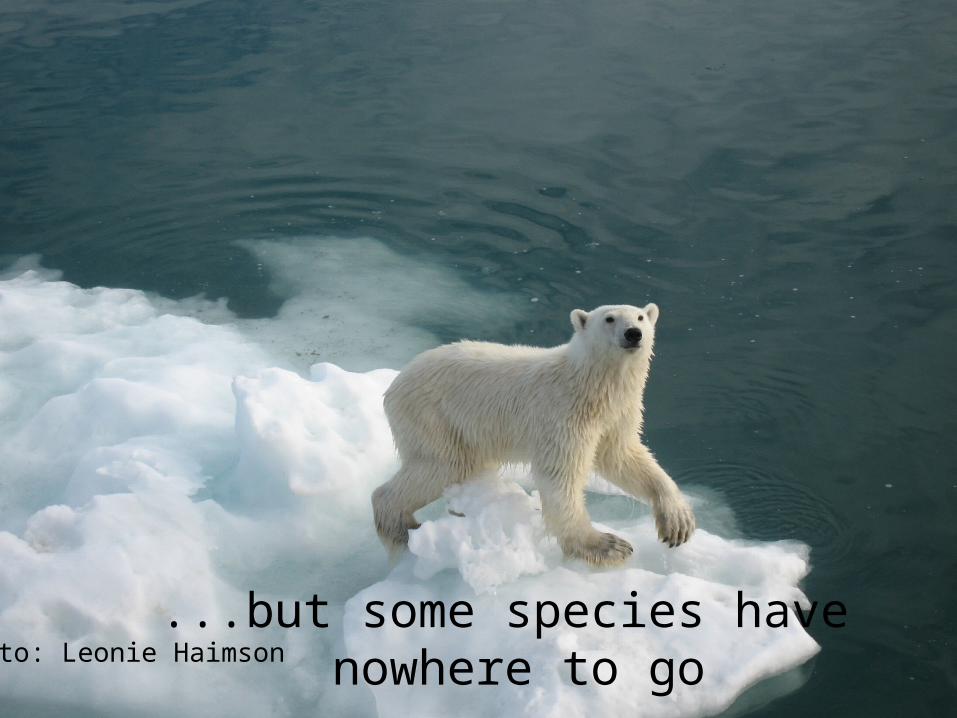
...but some species have nowhere to go
Photo: Leonie Haimson
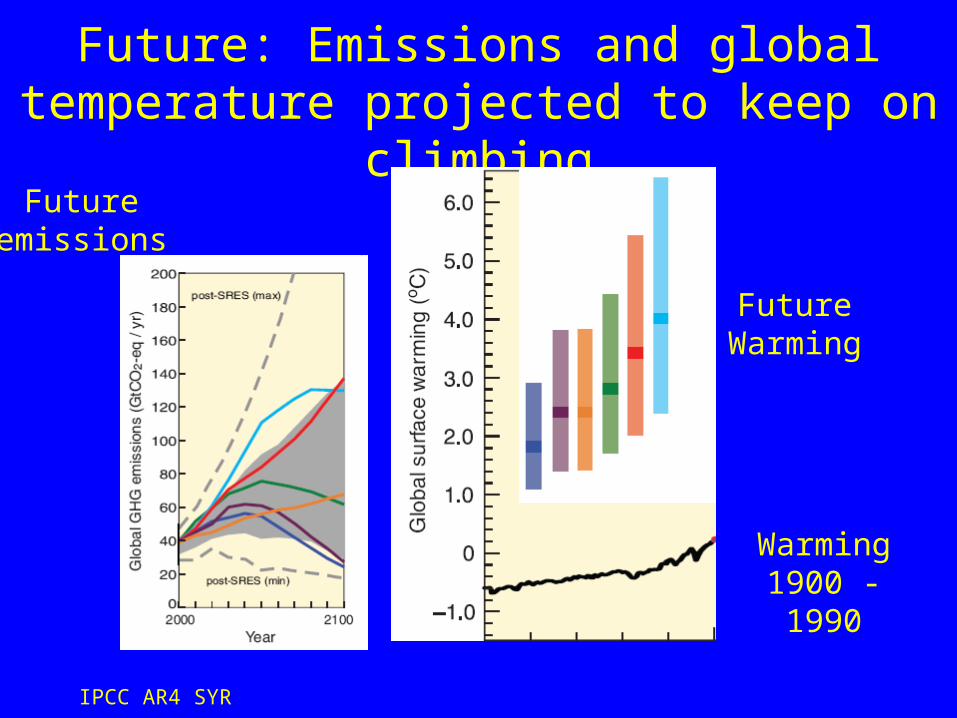
Future: Emissions and global temperature projected to keep on
climbing
IPCC AR4 SYR
Warming 1900 - 1990
Future Warming
Futureemissions

GEO339 Class 9 17
IPCC AR4TS
What makes these projections credible?

What extremes of climate are likely to intensify?
• More heat, less cold
• More drought
• More intense precipitation and flooding
• Changed ecosystems, species losses
• Higher sea level, maybe much higher
...with implications for food, drinking water, infrastructure, disease, ecosystems and species

But cool periods (like this winter) could occur, too
Courtesy Ron Stouffer, GFDL

Over long term, killer heat waves become the norm
Extreme Summer 2003:
About 35,000 people
in Europesuccumb to
extremeheat...
“normal” summer
model of “normal”
model of future
IPCC AR4 WGI

Large changes in water for drinking, food(Year 2050)
Milly et al, Nature, 438, 347-350, 2005.)
Food production tends to decline, low latitudes, 1-30C
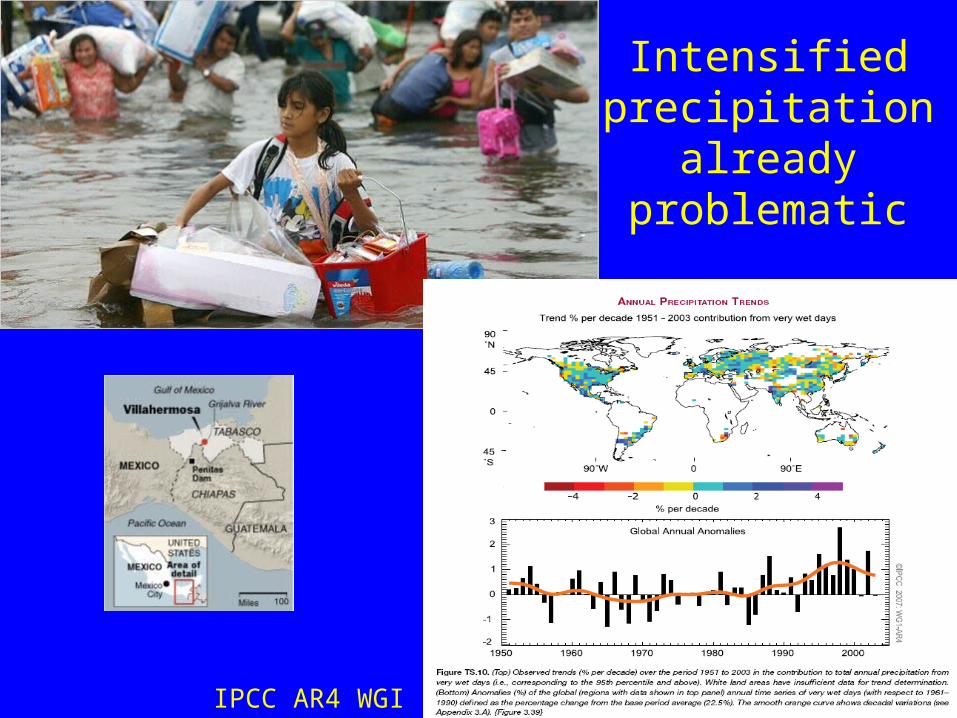
Intensified precipitation
already problematic
IPCC AR4 WGI

Ecosystems expected to shift, species disappear
Up to 30% at risk of extinction, 1-30C warming
Role of Ocean Acidification?

Various Estimates of Upper Limit for Sea Level Rise
Dut
ch e
st.
Ger
man
est
.
Rahmstorf 2
007
Data
Until 2100:18 – 59 cm + X (IPCC 2007)
50 – 140 cm (Rahmstorf 2007)55 – 110 cm (“high end”, Delta Commission 2008)
80 – 200 cm (Pfeffer et al. 2008)1.2m Grinsted et al (not shown)
Until 2200:150 – 350 cm (“high end”, Delta Commission
2008)
Until 2300:250 – 510 cm (German Advisory Council on
Global Change, WBGU, 2006)
Courtesy of Stefan Rahmstorf
IPCCrange
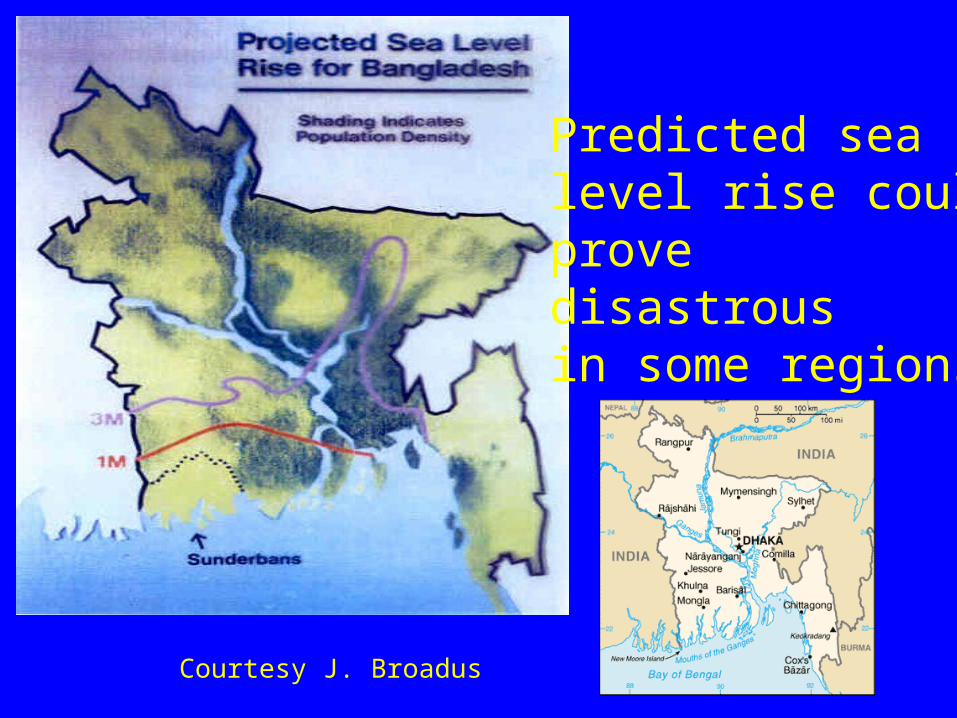
Predicted sealevel rise could prove disastrousin some regions
Courtesy J. Broadus

US, too, needs to develop adaptation strategies. Instead, we are doing this…
Courtesy Norm Psuty
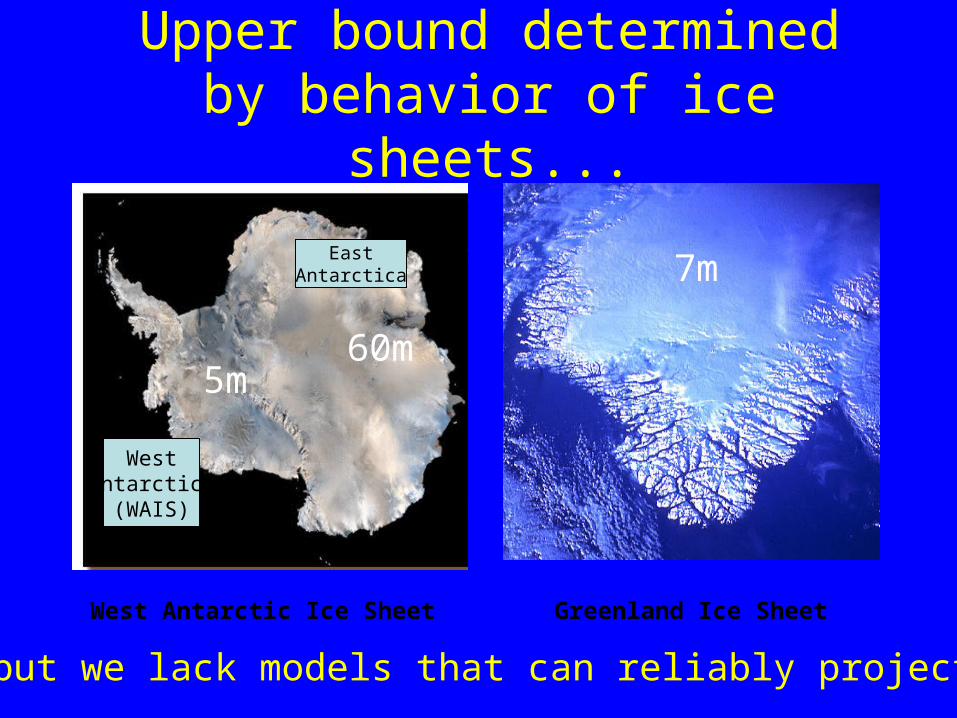
Upper bound determined by behavior of ice sheets...
West Antarctic Ice Sheet Greenland Ice Sheet
WestAntarctica
(WAIS)
EastAntarctica
5m60m
7m
...but we lack models that can reliably project

6-meter
sea level
rise

National Snow and IceData Center 2004
Hazard is clearbut timescale and
critical T are not:
Would rates of risereach
~meter/100yrOr
~meter/1000yr??

Buttressing by ice shelves may be a key factor...
But we lack a satisfactory continental ice-sheet model
Groundingline
(Modified from IPCC AR4 WGI)

Nature/Vol. 419/12 September 2002, pg. 189
Last Interglacial (LIG):Poles 3-50C warmer....
(Similar to outcome of 1-40C global increase in future)
Could this really happen? We Can Also Learn from the Past

Locations of sea level indicators for LIG (Kopp et al 2009)
... sea level was 6-9m higher...

...and apparently rose quickly
(Kopp et al 2009)
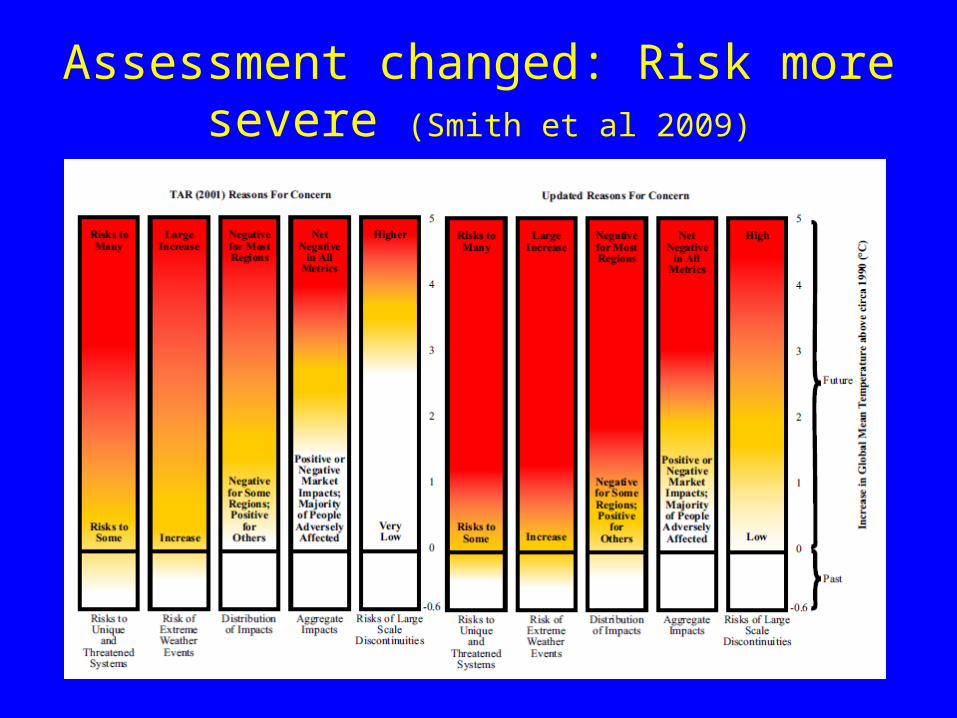
Assessment changed: Risk more severe (Smith et al 2009)

Climate Wheel of Fortune
Courtesy MIT joint program

What policies and institutions, international
and domestic, are needed?
Key question for policy makers:

1. Facilitate adaptation, already a key issue, even in developed
countries

2. Legislate Domestic Cap on Emissions
Pew Center for GCC 38

3. Provide other incentives and mandates to
implement existing technologies

4. Decide what are “common but differentiated responsibilities”...and implement with a treaty
40
NY Times 2 07 09

5. Provide incentives for R&D and commercialization of emerging
technologies
Socolow, Sci. Am. July 2005
Statoil CCS operation, AlgeriaFrom Socolow, Sci Am 2006
Carbon capture?
Nuclear?
Solar?

What’s there to work with: Current Regulatory Setting
• EPA/DoE/DoT regulatory action
• US state–level initiatives: links abroad?
• Litigation, and threat thereof
• Kyoto Protocol Part II?
• Group of 15: parallel tracks while gathering 67 votes?
• Private-sector actions

Reason for hope?US CO2 emissions declined as economy continued to grow
1990 1995 2000 2001 2002 2003 2004 2005 2006
Emiss
ions
Years
Net CO2 Emission
Fossil Fuel Combustion
Electricity Generation
Transportation
Industrial
Residential
Commercial
Oil price
Emissions
USEPA