Embed Size (px)
Citation preview
The Global Tuna Atlas: Services of interest to FAO,RFMOs, scientific Community and general public
E Chassot1,2, P Taconet1, E Blondel3, J Barde1
1Institut de Recherche pour le Developpement2Seychelles Fishing Authority
3Food and Agriculture Organization
IRD (Chassot et al.) CWP Task Group – Tuna subgroup 1 / 28
Standing on the shoulder of giants
Table of Contents
1 Standing on the shoulder of giants
2 Monitoring fisheries and stocks
3 Making the most of tuna fisheries data
IRD (Chassot et al.) CWP Task Group – Tuna subgroup 2 / 28
Standing on the shoulder of giants
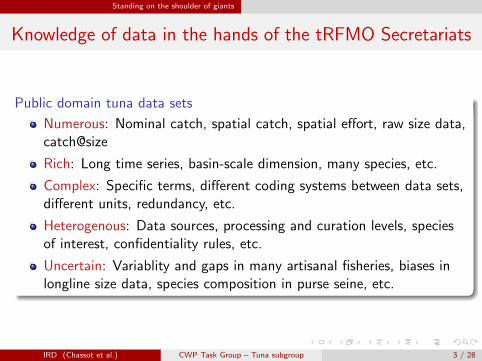
Knowledge of data in the hands of the tRFMO Secretariats
Public domain tuna data sets
Numerous: Nominal catch, spatial catch, spatial effort, raw size data,catch@size
Rich: Long time series, basin-scale dimension, many species, etc.
Complex: Specific terms, different coding systems between data sets,different units, redundancy, etc.
Heterogenous: Data sources, processing and curation levels, speciesof interest, confidentiality rules, etc.
Uncertain: Variablity and gaps in many artisanal fisheries, biases inlongline size data, species composition in purse seine, etc.
IRD (Chassot et al.) CWP Task Group – Tuna subgroup 3 / 28
Standing on the shoulder of giants
Generate an operational global data set for science
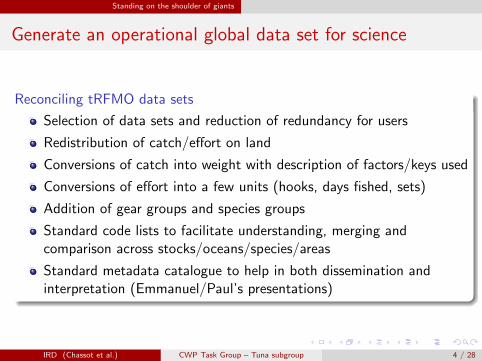
Reconciling tRFMO data sets
Selection of data sets and reduction of redundancy for users
Redistribution of catch/effort on land
Conversions of catch into weight with description of factors/keys used
Conversions of effort into a few units (hooks, days fished, sets)
Addition of gear groups and species groups
Standard code lists to facilitate understanding, merging andcomparison across stocks/oceans/species/areas
Standard metadata catalogue to help in both dissemination andinterpretation (Emmanuel/Paul’s presentations)
IRD (Chassot et al.) CWP Task Group – Tuna subgroup 4 / 28
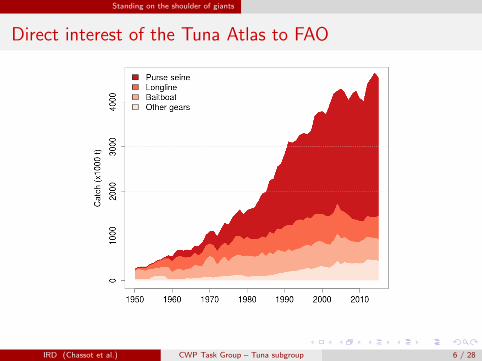
Standing on the shoulder of giants
Direct interest of the Tuna Atlas to FAO
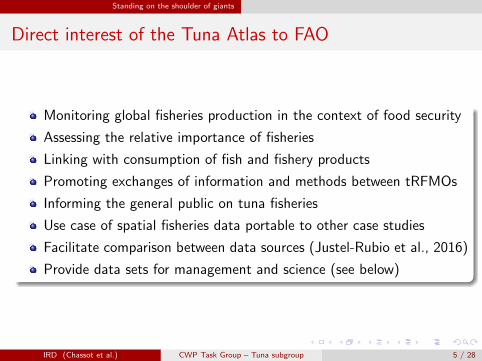
Monitoring global fisheries production in the context of food security
Assessing the relative importance of fisheries
Linking with consumption of fish and fishery products
Promoting exchanges of information and methods between tRFMOs
Informing the general public on tuna fisheries
Use case of spatial fisheries data portable to other case studies
Facilitate comparison between data sources (Justel-Rubio et al., 2016)
Provide data sets for management and science (see below)
IRD (Chassot et al.) CWP Task Group – Tuna subgroup 5 / 28
Standing on the shoulder of giants
Direct interest of the Tuna Atlas to FAO
IRD (Chassot et al.) CWP Task Group – Tuna subgroup 6 / 28

Standing on the shoulder of giants
Direct interest of the Tuna Atlas to FAO
Monitoring global fisheries production in the context of food security
Assessing the relative importance of fisheries
Linking with consumption of fish and fishery products
Promoting exchanges of information and methods between tRFMOs
Informing the general public on tuna fisheries
Use case of spatial fisheries data portable to other case studies
Facilitate comparison between data sources (Justel-Rubio et al., 2016)
Provide data sets for management and science (see below)
IRD (Chassot et al.) CWP Task Group – Tuna subgroup 7 / 28
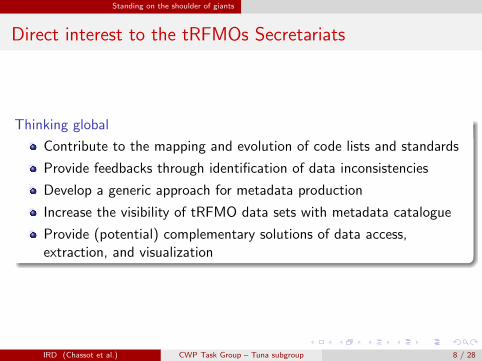
Standing on the shoulder of giants
Direct interest to the tRFMOs Secretariats
Thinking global
Contribute to the mapping and evolution of code lists and standards
Provide feedbacks through identification of data inconsistencies
Develop a generic approach for metadata production
Increase the visibility of tRFMO data sets with metadata catalogue
Provide (potential) complementary solutions of data access,extraction, and visualization
IRD (Chassot et al.) CWP Task Group – Tuna subgroup 8 / 28
Monitoring fisheries and stocks
Table of Contents
1 Standing on the shoulder of giants
2 Monitoring fisheries and stocks
3 Making the most of tuna fisheries data
IRD (Chassot et al.) CWP Task Group – Tuna subgroup 9 / 28
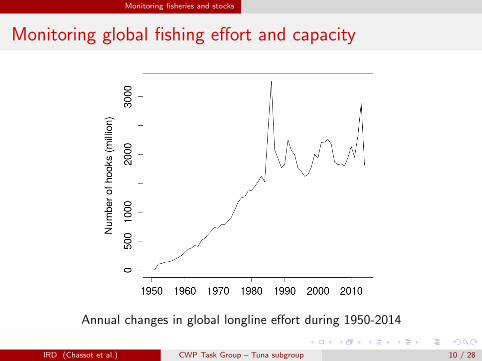
Monitoring fisheries and stocks
Monitoring global fishing effort and capacity
Annual changes in global longline effort during 1950-2014
IRD (Chassot et al.) CWP Task Group – Tuna subgroup 10 / 28
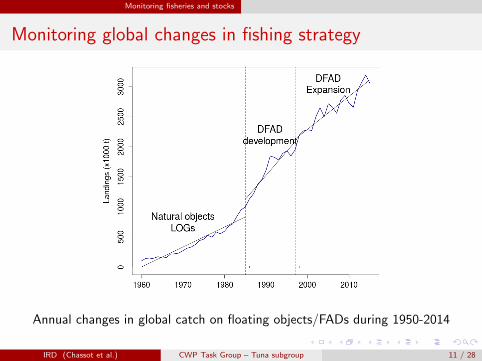
Monitoring fisheries and stocks
Monitoring global changes in fishing strategy
Annual changes in global catch on floating objects/FADs during 1950-2014
IRD (Chassot et al.) CWP Task Group – Tuna subgroup 11 / 28
Monitoring fisheries and stocks
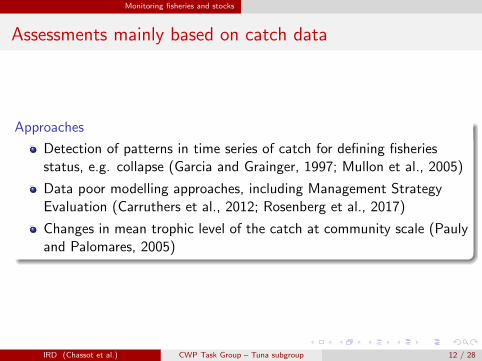
Assessments mainly based on catch data
Approaches
Detection of patterns in time series of catch for defining fisheriesstatus, e.g. collapse (Garcia and Grainger, 1997; Mullon et al., 2005)
Data poor modelling approaches, including Management StrategyEvaluation (Carruthers et al., 2012; Rosenberg et al., 2017)
Changes in mean trophic level of the catch at community scale (Paulyand Palomares, 2005)
IRD (Chassot et al.) CWP Task Group – Tuna subgroup 12 / 28
Monitoring fisheries and stocks
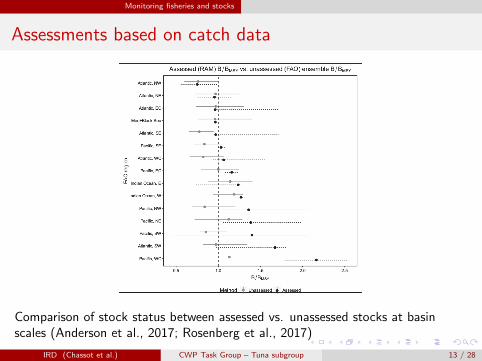
Assessments based on catch data
Comparison of stock status between assessed vs. unassessed stocks at basinscales (Anderson et al., 2017; Rosenberg et al., 2017)
IRD (Chassot et al.) CWP Task Group – Tuna subgroup 13 / 28
Monitoring fisheries and stocks
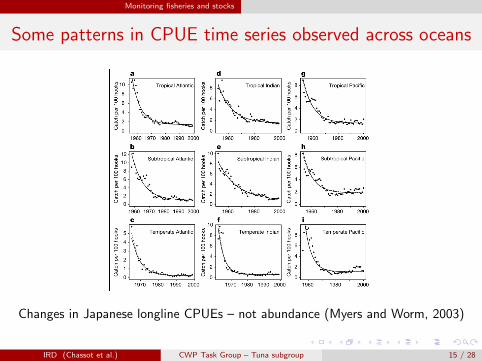
Some patterns in CPUE time series observed across oceans
Strong initial decline in longline CPUEs observed across oceans(Myers and Worm, 2003; Sibert et al., 2006; Polacheck, 2006)
Major “jump“ in longline CPUE in the mid-1970s due to developmentof deep-water longline
Increasing CPUEs in purse seine linked to FAD fishery expansion
Comparison of catch rates between oceans
Local effects of seamounts on fisheries productivity
IRD (Chassot et al.) CWP Task Group – Tuna subgroup 14 / 28
Monitoring fisheries and stocks
Some patterns in CPUE time series observed across oceans
Changes in Japanese longline CPUEs – not abundance (Myers and Worm, 2003)
IRD (Chassot et al.) CWP Task Group – Tuna subgroup 15 / 28

Monitoring fisheries and stocks
Some patterns in CPUE time series observed across oceans
Strong initial decline in longline CPUEs observed across oceans(Myers and Worm, 2003; Sibert et al., 2006; Polacheck, 2006)
Major “jump“ in longline CPUE in the mid-1970s due to developmentof deep-water longline
Increasing CPUEs in purse seine linked to FAD fishery expansion
Comparison of catch rates between oceans
Local effects of seamounts on fisheries productivity
IRD (Chassot et al.) CWP Task Group – Tuna subgroup 16 / 28
Monitoring fisheries and stocks
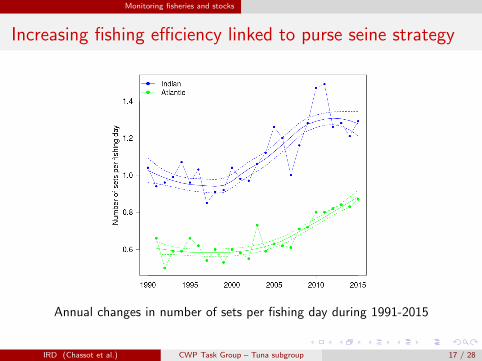
Increasing fishing efficiency linked to purse seine strategy
Annual changes in number of sets per fishing day during 1991-2015
IRD (Chassot et al.) CWP Task Group – Tuna subgroup 17 / 28
Monitoring fisheries and stocks
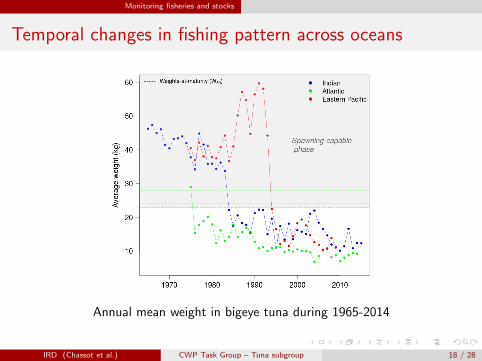
Temporal changes in fishing pattern across oceans
Annual mean weight in bigeye tuna during 1965-2014
IRD (Chassot et al.) CWP Task Group – Tuna subgroup 18 / 28
Monitoring fisheries and stocks
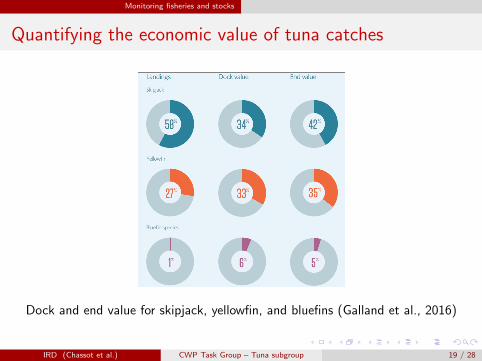
Quantifying the economic value of tuna catches
Dock and end value for skipjack, yellowfin, and bluefins (Galland et al., 2016)
IRD (Chassot et al.) CWP Task Group – Tuna subgroup 19 / 28
Monitoring fisheries and stocks
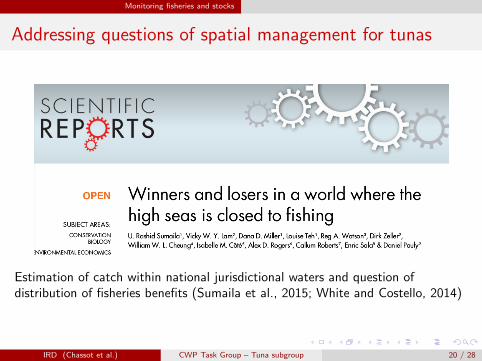
Addressing questions of spatial management for tunas
Estimation of catch within national jurisdictional waters and question ofdistribution of fisheries benefits (Sumaila et al., 2015; White and Costello, 2014)
IRD (Chassot et al.) CWP Task Group – Tuna subgroup 20 / 28
Making the most of tuna fisheries data
Table of Contents
1 Standing on the shoulder of giants
2 Monitoring fisheries and stocks
3 Making the most of tuna fisheries data
IRD (Chassot et al.) CWP Task Group – Tuna subgroup 21 / 28
Making the most of tuna fisheries data
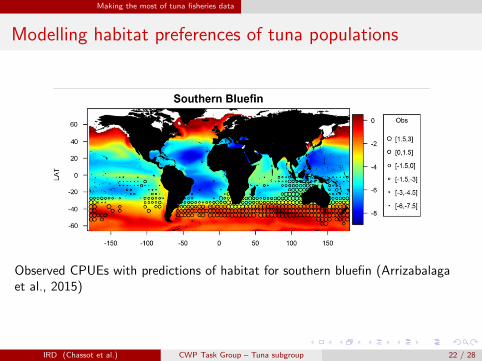
Modelling habitat preferences of tuna populations
Observed CPUEs with predictions of habitat for southern bluefin (Arrizabalagaet al., 2015)
IRD (Chassot et al.) CWP Task Group – Tuna subgroup 22 / 28
Making the most of tuna fisheries data
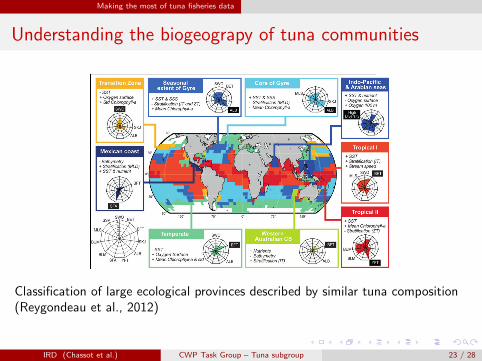
Understanding the biogeograpy of tuna communities
Classification of large ecological provinces described by similar tuna composition(Reygondeau et al., 2012)
IRD (Chassot et al.) CWP Task Group – Tuna subgroup 23 / 28
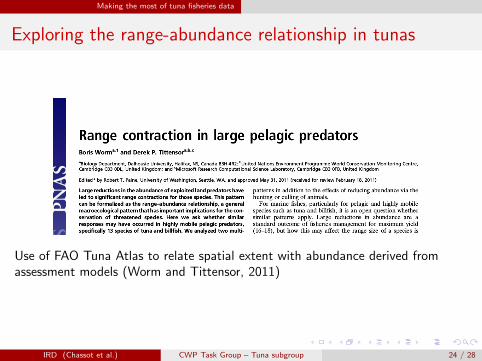
Making the most of tuna fisheries data
Exploring the range-abundance relationship in tunas
Use of FAO Tuna Atlas to relate spatial extent with abundance derived fromassessment models (Worm and Tittensor, 2011)
IRD (Chassot et al.) CWP Task Group – Tuna subgroup 24 / 28
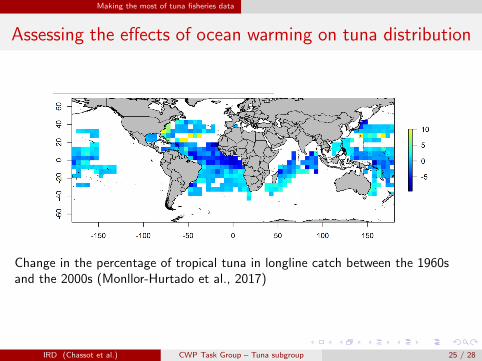
Making the most of tuna fisheries data
Assessing the effects of ocean warming on tuna distribution
Change in the percentage of tropical tuna in longline catch between the 1960sand the 2000s (Monllor-Hurtado et al., 2017)
IRD (Chassot et al.) CWP Task Group – Tuna subgroup 25 / 28
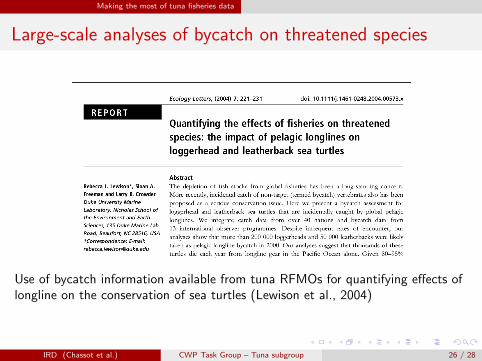
Making the most of tuna fisheries data
Large-scale analyses of bycatch on threatened species
Use of bycatch information available from tuna RFMOs for quantifying effects oflongline on the conservation of sea turtles (Lewison et al., 2004)
IRD (Chassot et al.) CWP Task Group – Tuna subgroup 26 / 28
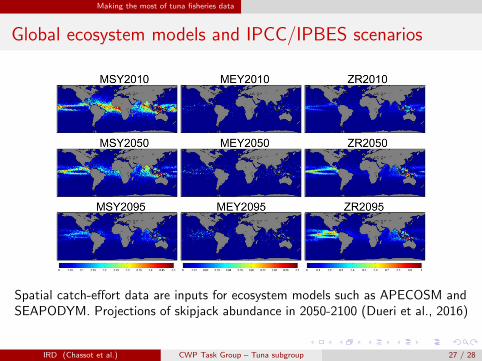
Making the most of tuna fisheries data
Global ecosystem models and IPCC/IPBES scenarios
Spatial catch-effort data are inputs for ecosystem models such as APECOSM andSEAPODYM. Projections of skipjack abundance in 2050-2100 (Dueri et al., 2016)
IRD (Chassot et al.) CWP Task Group – Tuna subgroup 27 / 28
Making the most of tuna fisheries data
Make the Tuna Atlas great again!
Key points
Public-domain tuna data (catch, effort, size) are just one componentof the data sets for management
The spatial dimension of the data is however of much interest formany research questions
The knowledge of the data sets comes from the tRFMOs and thedata curation should be reflected in the metadata
The standards adopted facilitate the connection between the tunaAtlas and other sources (environmental data, RAM Legacy database,FAD-tracking data, etc.)
The Tuna Atlas is a link between the RFMO Secretariats and a wideraudience of researchers
IRD (Chassot et al.) CWP Task Group – Tuna subgroup 28 / 28

References
Anderson SC, Cooper B Andrew, Jensen OP, Minto C, Thorson JT, Walsh JC, Afflerbach J, Mark D, Kleisner KM, Longo C,Osio GC, Ovando D, Mosqueira I, Rosenberg AA, R SE (2017) Improving estimates of population status and trend withsuperensemble models. Fish and Fisheries 18(4):732–741. URLhttps://onlinelibrary.wiley.com/doi/full/10.1111/faf.12200
Arrizabalaga H, Dufour F, Kell L, Merino G, Ibaibarriaga L, Chust G, Irigoien X, Santiago J, Murua H, Fraile I, Chifflet M,Goikoetxea N, Sagarminaga Y, Aumont O, Bopp L, Herrera M, Marc Fromentin J, Bonhomeau S (2015) Global habitatpreferences of commercially valuable tuna. Deep Sea Research Part II: Topical Studies in Oceanography 113:102–112. URLhttp://www.sciencedirect.com/science/article/pii/S0967064514001738
Carruthers TR, Walters CJ, McAllister MK (2012) Evaluating methods that classify fisheries stock status using only fisheriescatch data. Fisheries Research 119-120:66–79. URLhttp://www.sciencedirect.com/science/article/pii/S0165783611003894
Dueri S, Guillotreau P, Jimenez-Toribio R, Oliveros-Ramos R, Bopp L, Maury O (2016) Food security or economic profitability?Projecting the effects of climate and socioeconomic changes on global skipjack tuna fisheries under three managementstrategies. Global Environmental Change 41:1–12. URLhttp://www.sciencedirect.com/science/article/pii/S0959378016301352
Fonteneau A, Chassot E, Bodin N (2013) Global spatio-temporal patterns in tropical tuna purse seine fisheries on drifting fishaggregating devices (DFADs): Taking a historical perspective to inform current challenges. Aquatic Living Resources26(1):37–48. URL http://www.alr-journal.org/10.1051/alr/2013046
Galland G, Rogers A, Nickson A (2016) Netting billions: A global valuation of tuna. Tech. rep., The PEW Charitable Trusts,Washington D.C., U.S.A.
Garcia S, Grainger R (1997) Chronicles of marine fishery landings (1950–1994). Trend analysis and fisheries potential. FAOFisheries Technical Paper, FAO, Roma, Italy
Justel-Rubio A, Garibaldi L, Hampton J, Maunder M, Restrepo VR (2016) A comparative study of annual tuna catches from twodifferent sources: FAO global capture database vs tuna RFMOs statistical databases (2000 -2014). ISSF Technical Report2016-05, ISSF, Washington D.C., U.S.A. 10.13140/RG.2.2.32755.32801
Lewison RL, Freeman SA, Crowder LB (2004) Quantifying the effects of fisheries on threatened species: the impact of pelagiclonglines on loggerhead and leatherback sea turtles. Ecology Letters 7(3):221–231. URLhttp://dx.doi.org/10.1111/j.1461-0248.2004.00573.x
Monllor-Hurtado A, Pennino MG, Sanchez-Lizaso JL (2017) Shift in tuna catches due to ocean warming. PLOS ONE12(6):e0178196. URL http://journals.plos.org/plosone/article?id=10.1371/journal.pone.0178196
Mullon C, Freon P, Cury P (2005) The dynamics of collapse in world fisheries. Fish and Fisheries 6:111–120
IRD (Chassot et al.) CWP Task Group – Tuna subgroup 28 / 28

References
Myers RA, Worm B (2003) Rapid worldwide depletion of predatory fish communities. Nature 423(6937):280–283. URLhttp://www.nature.com/nature/journal/v423/n6937/abs/nature01610.html
Pauly D, Palomares ML (2005) Fishing down marine food web: It is far more pervasive than we thought. Bulletin of MarineScience 76(2):197–212
Polacheck T (2006) Tuna longline catch rates in the Indian Ocean: Did industrial fishing result in a 90% rapid decline in theabsence of predatory species? Marine Policy 30:470–482
Reygondeau G, Maury O, Beaugrand G, Fromentin JM, Fonteneau A, Cury P (2012) Biogeography of tuna and billfishcommunities. Journal of Biogeography 39:114–129. URLhttp://onlinelibrary.wiley.com/doi/10.1111/j.1365-2699.2011.02582.x/abstract. ACL
Rosenberg AA, Kleisner KM, Afflerbach Jamie, Anderson Sean C, DickeyCollas Mark, Cooper Andrew B, Fogarty Michael J,Fulton Elizabeth A, Gutierrez Nicolas L, Hyde Kimberly JW, Jardim Ernesto, Jensen Olaf P, Kristiansen Trond, LongoCatherine, MinteVera Carolina V, Minto Coilın, Mosqueira Iago, Osio Giacomo Chato, Ovando Daniel, Selig Elizabeth R,Thorson James T, Walsh Jessica C, Ye Yimin (2017) Applying a New Ensemble Approach to Estimating Stock Status ofMarine Fisheries around the World. Conservation Letters 11(1):e12363. URLhttps://onlinelibrary.wiley.com/doi/full/10.1111/conl.12363
Sibert J, Hampton J, Kleiber P, Maunder M (2006) Biomass, size, and trophic status of top predators in the Pacific Ocean.Science 314(5806):1773–1776. URL http://dx.doi.org/10.1126/science.1135347
Sumaila UR, Lam VWY, Miller DD, Teh L, Watson RA, Zeller D, Cheung WWL, Cote IM, Rogers AD, Roberts C, Sala E, PaulyD (2015) Winners and losers in a world where the high seas is closed to fishing. Scientific Reports 5. URLhttp://www.nature.com/srep/2015/150212/srep08481/full/srep08481.html
White C, Costello C (2014) Close the High Seas to Fishing? PLoS Biol 12(3):e1001826. URLhttp://dx.doi.org/10.1371/journal.pbio.1001826
Worm B, Tittensor DP (2011) Range contraction in large pelagic predators. Proceedings of the National Academy of Sciences108(29):11942–11947. URL http://www.pnas.org/content/108/29/11942
IRD (Chassot et al.) CWP Task Group – Tuna subgroup 28 / 28