Embed Size (px)
Citation preview

The Global Market for Olive Oil: TrendsThe Global Market for Olive Oil: Trends, Policies and Trade Liberalisation in the
Mediterranean
S i Mili
Mediterranean
Samir MiliResearch Group on Agri-Food Economics and Marketing
Spanish Council for Scientific Research, [email protected]
Presented at the CALMED WorkshopCetraro (Calabria), 16-17 June 2008
Outline
World Markets, Trade & Policies,
Euro-Med Trade Liberalisation: Scenarios & Estimates
Potential Impacts on the EU (Quantitative + Qualitative)
Concluding Remarks

World Olive Oil Market Aggregate Figures1990-2008
Av./Campaign(1000 t)
% CV Min(1000 t)
Max(1000 t)
Annual% Growth (2)
(1000 t)
Production 2391.1EU 77%
20.322.5
1453.0993.7
3174.02463.7
3.8 4.3 EU 77% 22.5 993.7 2463.7 4.3
Consumption 2387.7EU 71%
17.516.3
1666.51214.5
2926.52078.9
3.2 2.9
Exports (1) 464.6EU 54%
29.528.5
256.5146.1
705.5335.9
3.84.7
Imports (1) 488.8EU 31%
28.637.6
288.542.4
723.0231.8
4.83.1
(1) Only extra-EU trade (2) Average compound- rate Source: Based on IOOC data

Application of New CMO in EU Countries
% Decoupling R t
% Retention Art 69
% Retention Operators’ OrgRate Art. 69 Operators Org.
Spain 93.61 - -pItaly 100 - 10Greece 100 4 2Greece 100 4 2Portugal 100 10 -France 100 - 10France 100 10Slovenia 100 - -Malta 100Malta 100 - -
Source: EC

Producer Countries Consumer CountriesMainparticipantsin theworldolive oil market,1990-2008
% Change % ChangeProducer
% Change % Change99-08 / 90-98
% of World Production % of World Consumption
55.4 19.936.2Spain 30.2Italy
99-08 / 90-98
Spain Italy
37.2
13.3
31.0
25.2
23.4
15.4
Italy
Greece
21.4
10.3
Spain
Greece
Italy
Greece
Spain
Greece
- 6.0
30.2
84.4
40.8
6.8
4.6
Tunisia
Turkey
6.8
3.9
USA
Syria
-Tunisia
Turkey
USA
Syria
51.9
15.5 - 6.3
4.4
2.4
Syria
Morocco
3.1
2.6Turkey
France 89.7Syria
Morocco Turkey
France
-3.3
4.3
2
-15.1
1.5
1.3
Portugal
Algeria
2.6
2.1
Portugal
Tunisia
- 22.8
-
Portugal
Algeria
Portugal
Tunisia
Based on IOOC data
67.3 25.90.8Jordan 2.1MoroccoMorocco

Exporter Countries% Change
Main participants in the world olive oil market, 1990-2008Importer CountriesExporter
% Change
MainImporter
% of World Imports (1)% Change
99-08 / 90-98
76.2 84.2
% of World Exports (1)
30.6Italy 34.3USA
% 99-08 / 90-98% Change
%
ItalyItaly USA
-6.2
74.5
33.3
-15.2
25.1
17.9
Tunisia
Spain
22.0
7.5
Italy
Spain
-
-
Tunisia
Spain
Tunisia
Spain
Italy
Spain
117.0
56.7
73.5
34.8
10.3
3.1
Turkey
Portugal
4.9
4.7
Australia
Brazil
Turkey
Portugal
Turkey
Portugal
Australia
Brazil
615.5
30.7
105.6
91.1
2.8Syria
2.2
4.6
4.3
Japan
CanadaMorocco
Japan
Canada
27.0
47.5
156.9
67.1
2.0
1.5USA
1.5
1.1
Switzerland
Russia
Greece
USAUSA
Switzerland
Russia
72.3 316.7
(1) Without intra- EU tradeBased on IOOC data
1.5Argentina 1.1Mexico
(1) Without -
1ArgentinaArgentina Mexico

Principal Non-Traditional Purchasers of Olive Oil,1990-2008
CountryAv./
campaign(1000 t)
% CV Min
(1000 t)Max
(1000 t)Annual
% growth
USA 167.9 34.3 87.5 260.0 6.1
UK (1) 30 1 58 6 6 8 71 6 8 4UK (1) 30.1 58.6 6.8 71.6 8.4
Germany (1) 29.7 52.2 9.8 56.0 9.9
Australia 23.8 31.1 12.5 35.0 5.4
Brazil 22.9 27.1 11.0 34.0 5.3
Japan 22.7 50.6 4.0 34.0 12.1
Canada 20.9 35.9 10.0 32.0 6.4
Switzerland 7.1 49.2 3.0 12.0 8.0
Netherlands (1) 6 8 71 0 1 0 14 5 16 0Netherlands ( ) 6.8 71.0 1.0 14.5 16.0
Russia 5.4 54.3 1.0 9.5 3.6
Mexico 5.2 72.4 1.0 10.5 11.4
Austria (1)(2) 4.3 54.2 0.2 7.3 31.7
Sweden (1)(2) 3.9 49.2 1.0 7.2 16.4
Denmark (1) 2.2 37.7 0.7 3.4 9.2
Ireland (1) 1.7 42.3 0.5 2.7 9.8
Finland (1)(2) 0.9 44.0 0.2 1.4 11.3
(1) Includes intra + extra EU imports, (2) 1994/95 – 2007/08Source: Based on IOOC, Eurostat, National Accounts data

Euro-Med Production & Internationalisation Indicators, 1990-2008
PRODUCTION EXPORT INTENSITY(Export1 / Prod.) %
Annual % Growth % CV
Tunisia 0.2 45.6 71.3Turkey 3.9 50.0 43.6Syria 1 0 36 1 12 5Syria 1.0 36.1 12.5Morocco 4.9 39.3 17.7Jordan 5.6 46.7 10.8Spain 3.7 35.2 9.6Italy 6.4 28.8 25.4Greece 4 3 19 6 2 5Greece 4.3 19.6 2.5Portugal 3.3 29.4 40.0EU 4.3 22.5 13.7WORLD 3.8 20.3 19.4
(1) Without intra-EU trade Source: Based on IOOC, National Accounts data
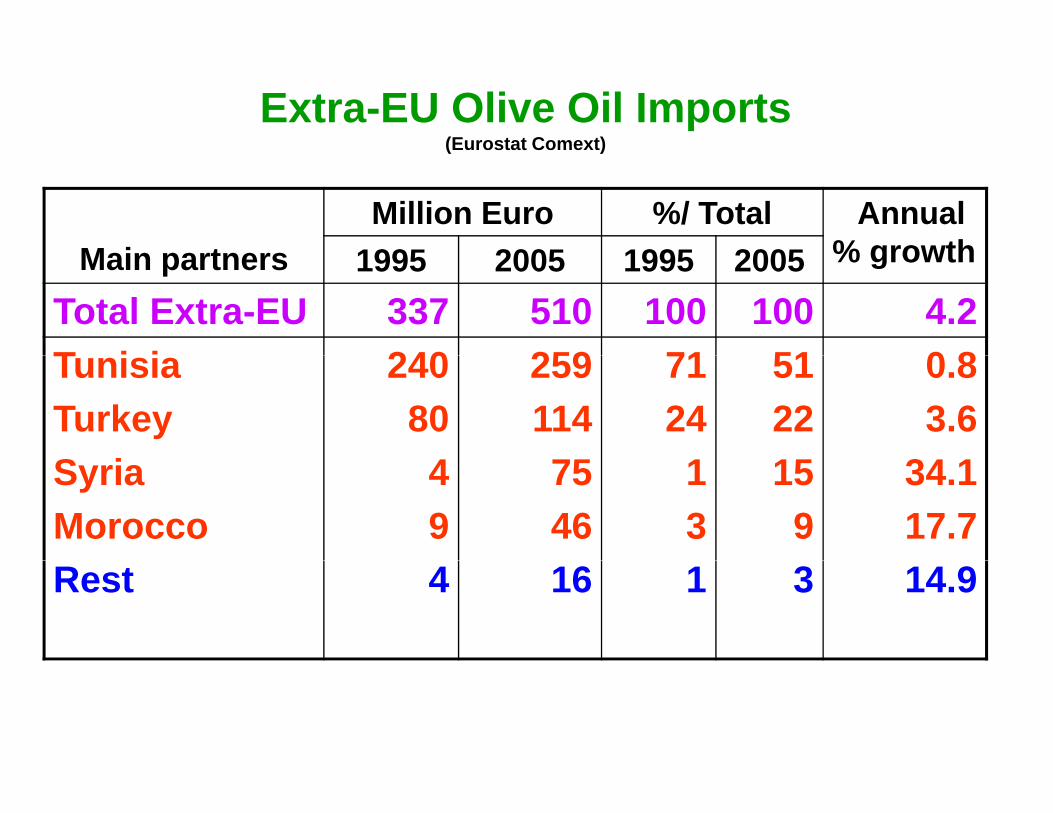
Extra-EU Olive Oil Imports(Eurostat Comext)( )
M i tMillion Euro %/ Total Annual
% growth1995 2005 1995 2005Main partners % growth 1995 2005 1995 2005Total Extra-EU 337 510 100 100 4.2T i i 240 259 71 51 0 8TunisiaTurkeyS
24080
259114
7124
5122
0.83.6
SyriaMorocco
49
7546
13
159
34.117.7
Rest 4 16 1 3 14.9
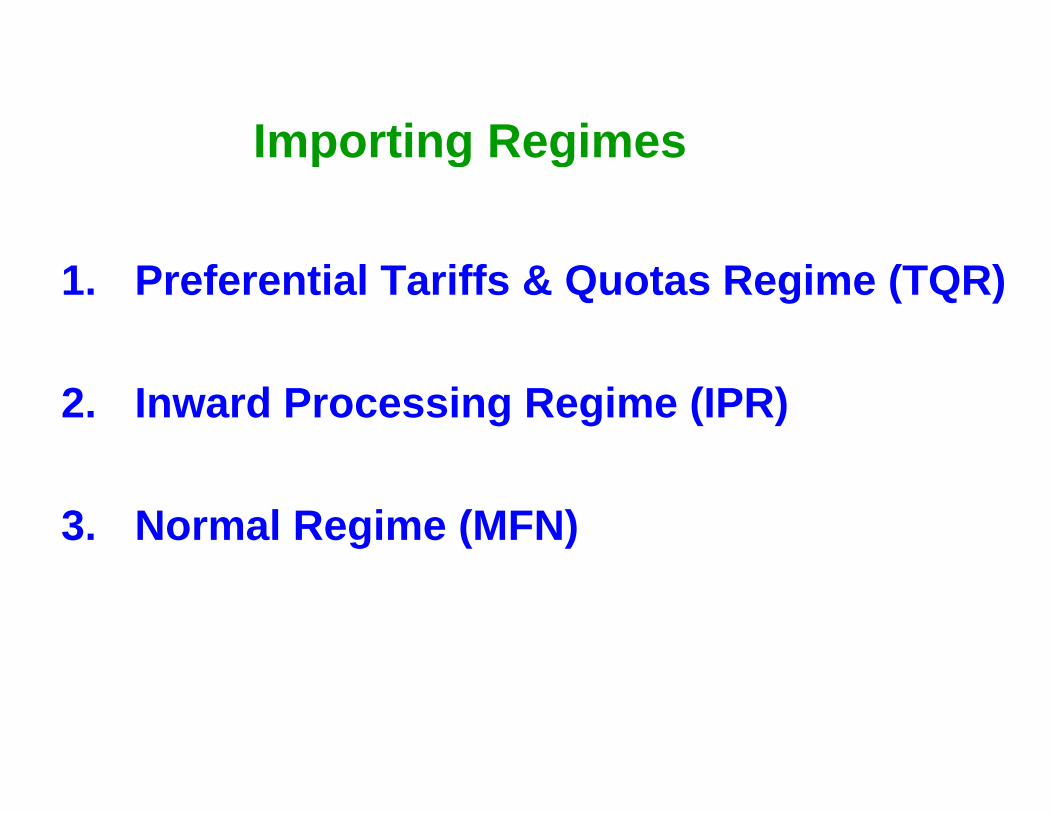
Importing RegimesImporting Regimes
1. Preferential Tariffs & Quotas Regime (TQR)
2. Inward Processing Regime (IPR)
3. Normal Regime (MFN)

Olive Oil Tariff Quotas Granted by EU to 3rd Countries
Third Countries Code NC Quota (tons) Date of Application
Lebanon 150910 1000 March 200315100010
Palestine 150910 2000 January 2005
Tunisia 15091010 57167 May 2004
Algeria 1509 1000 October 20051510 1000
Morocco 1509 3500 September 2005151000150910 2000 From 1 January to 31 December 2006150910 2000 From 1 January to 31 December 2006150910 4500 From 1 January to 31 December 2007150910 7000 From 1 January to 31 December 2008150910
Jordan
9500 From 1 January to 31 December 2009150910
12000 From 1 January to 31 December 2010Source: ECSource: EC

Euro-Med Trade Liberalisation : Tunisia Case StudyEuro Med Trade Liberalisation : Tunisia Case Study(Karray & Mili, 2007)
Delphi Survey
Iterative questionnaires anonymouslyIterative questionnaires, anonymously addressed in 2 rounds to 24 experts from different backgrounds, to obtain consensus g ,views and estimates about Tunisia olive oil production and export potential by 2010 and 2015 under different liberalisation scenarios2015, under different liberalisation scenarios

Methodological FrameworkObjectives Preliminary Analysisj y y
Expert Panel Hypothesis
Questionnaire 1 (Q1)
Q Analysis QIteration 1
Q1 Analysis , Q2
Iteration 2
Q2 Analysis
Q3. . .
Consensus achieved ?YES
NO
Iteration 3…
Q3 Analysis…
Consensus achieved ?NO Consensus achieved ?YES
NO
Final Results

Liberalisation Scenarios
Scenario 1: Partial Liberalisation1. Quota 86,000 t2. IPR Maintained3. MFN Regime 20% Reduction3. MFN Regime 20% Reduction
Extra virgin 1245 Euro/t – 20%
Lampante 1226 Euro/t – 20%
Refined 1346 Euro/t – 20%
1 + 2 + 3Scenario 2: Full LiberalisationScenario 2: Full Liberalisation

Results - 1/2Tunisia Olive Oil Production Potential (1000 t)
2001-05 2010 2015
Tunisia Olive Oil Production Potential (1000 t)
Production Potential 142 190 250Increasing yields through good agricultural practices 1g y g g g p
Olive growing strategy based on scientific results and clear vision 2
Expanding areas of irrigated plantations 3p g g p 3Reinforcing financial support to producers 4Restructuring old plantations 5Expanding olive cultivation in dry areas 6Promoting hyper-intensive plantations 7Encouraging selection of Tunisian varieties for intensive plantations 8Encouraging selection of Tunisian varieties for intensive plantations 8
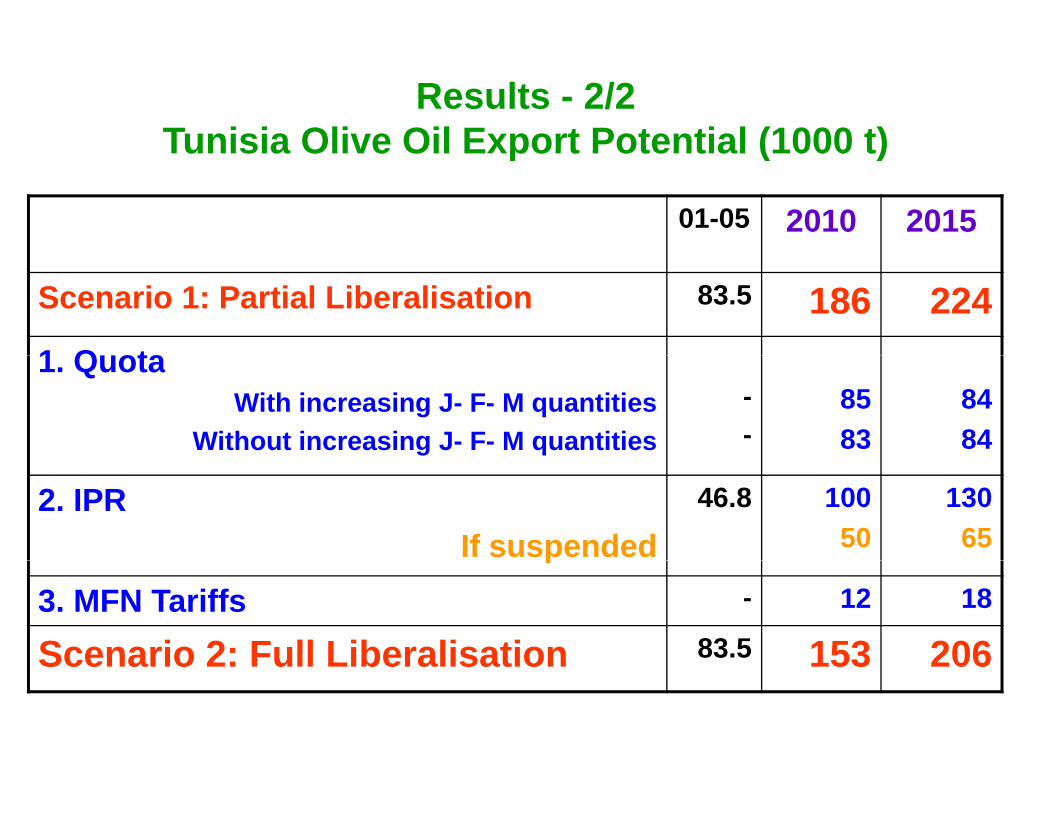
Results - 2/2Tunisia Olive Oil Export Potential (1000 t)
01-05 2010 2015
Tunisia Olive Oil Export Potential (1000 t)
Scenario 1: Partial Liberalisation 83.5 186 2241 Q ota1. Quota
With increasing J- F- M quantitiesWithout increasing J- F- M quantities
--
8583
8484
2. IPRIf suspended
46.8 10050
13065p
3. MFN Tariffs - 12 18
Scenario 2: Full Liberalisation 83.5 153 206Scenario 2: Full Liberalisation 153 206
Main Conclusions from Tunisia Study - 1/2
Potential quantitative impacts are limited overall
Almost all Tunisian export potential is bulk
Monthly in-quota quantity changes almost have no impact on exports, while quota increase has a clear effecta clear effect
IP regime will continue to be determinant for Tunisian exports

Main Conclusions from Tunisia Study - 2/2
MFN regime will continue to be residual (even with 20% reduction under current CMO provisions)
Export potential under total lib. scenario is less than under the partial : Partial lib. assumesthan under the partial : Partial lib. assumes Tunisia keeps its preferential quota, lost under total lib. Experts assumed that Tunisia would loose market share to competitors like Turkeyloose market share to competitors like Turkey, Morocco and Syria

Qualitative Impacts (Potential Competition on Domestic EU Production)Domestic EU Production)
Limited overall :Limited overall :
Two operating levels (few big /medium sizedTwo operating levels (few big /medium sized companies + many small entreprises) : imperfectly competitive industry
Growing horizontal concentration (primary )production - cooperatives) and vertical integration
(Sos…)
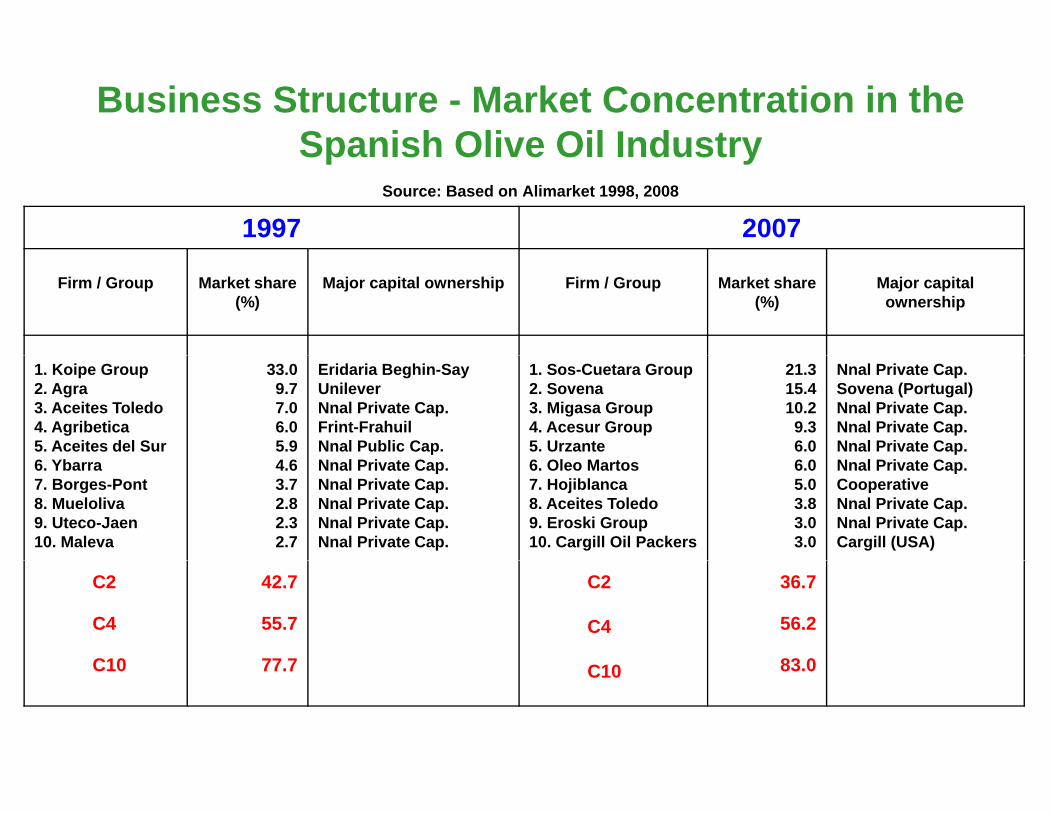
Business Structure - Market Concentration in the Spanish Olive Oil IndustrySpanish Olive Oil Industry
Source: Based on Alimarket 1998, 2008
1997 2007
Firm / Group Market share(%)
Major capital ownership Firm / Group Market share(%)
Major capital ownership
1. Koipe Group2. Agra3. Aceites Toledo4. Agribetica5. Aceites del Sur
33.09.77.06.05.9
Eridaria Beghin-SayUnileverNnal Private Cap.Frint-FrahuilNnal Public Cap.
1. Sos-Cuetara Group2. Sovena3. Migasa Group4. Acesur Group5. Urzante
21.315.410.29.36.0
Nnal Private Cap.Sovena (Portugal)Nnal Private Cap.Nnal Private Cap.Nnal Private Cap.
6. Ybarra7. Borges-Pont8. Mueloliva9. Uteco-Jaen10. Maleva
4.63.72.82.32.7
Nnal Private Cap.Nnal Private Cap.Nnal Private Cap.Nnal Private Cap.Nnal Private Cap.
6. Oleo Martos7. Hojiblanca8. Aceites Toledo9. Eroski Group10. Cargill Oil Packers
6.05.03.83.03.0
Nnal Private Cap.CooperativeNnal Private Cap.Nnal Private Cap.Cargill (USA)
C2
C4
C10
42.7
55.7
77 7
C2
C4
36.7
56.2
83 0C10 77.7 C10 83.0

Concluding Remarks - 1/2
Key market features: Growing but still low internationalisation ; Relative saturation ofinternationalisation ; Relative saturation of domestic demand in main producing countries ; Higher growth rates for world supply than for potential demand ; Substitute oils competition;potential demand ; Substitute oils competition; Growing bargaining power of distribution sector
International olive oil competitive scenario will be shaped by 1) Developments in demand and business strategies, 2) Changes in agricultural and g , ) g gtrade policies
Concluding Remarks - 2/2
Mediterranean trade flows (and presumably the i t ) t ti ll i t t f M dimpacts) are potentially more important for Med countries than for the EU
Scope for further liberalisation (political will, feasibility!)
Growing influence of NTMs (safety measures, quality certification, labelling, rules of origin...)quality certification, labelling, rules of origin...)
Areas in which more research is needed

Thank you