Embed Size (px)
Citation preview

The Global Internet
Phenomena ReportSeptember 2019

Welcome to the 2019 Global Internet Phenomena Report
The 2019 version of
the Global Internet
Phenomena Report
was truly a labor of love
for me. Last year, we
built a new foundation
for the report with more
exploration of traffic
not only at the regional level, but also for
different classes of application traffic. This
started us down some interesting paths that
we are exploring further this year, and has
highlighted some trends that we will go into
more detail on in this and in future reports.
There were some predictions and some
controversial positions that we took last year,
and the data from this year bears out our thesis
on how consumers are reacting to some of the
new trends, especially in video and file sharing.
This report is a bit more comprehensive than
the 2018 edition. There were a lot of high
profile events that occurred during the first
half of 2019, namely the final season of Game
of Thrones, the FIFA Women’s World Cup,
the release of Avengers: Endgame; as well
as new series releases, the Super Bowl, new
streaming services, etc. So rather than pick
a single month during the first half of 2019,
which would likely result in some data bias, this
report covers the entire first half of 2019 in all
categories. This has the effect of smoothing out
the impact that a special event has on traffic
across a six month period.
Some of the events that occurred have clearly
had an impact on the global share of specific
traffic types, but the data is speaking pretty
clearly on the trends, and it is impossible to
dismiss the data when it is taken from such a
large sample size.
The data mixes traffic from all around the world,
from all different sizes of networks. Traffic on
large networks in large countries drives global
share – just as in any market – so, applications
and content providers that have worldwide user
bases and are popular in the US, South Korea,
and Japan (all countries with fast connections
and millions of users) do well. Regional
applications or language-specific applications
tend to not show strongly in global rankings.
This is why, in addition to global data, we
release regional data. If you are in Asia, your
network will act differently than the US. We want
to give you the data that is relevant for your
network planning or just because you are the
curious type – like I am! If you’re an over-the-top
(OTT) content provider and have an application
you want covered in the phenomena report,
click here.
Cam Cullen, VP of Marketing, Sandvine
A word from Lyn Cantor, CEO, Sandvine
Sandvine is a global leader in the network intelligence market segment. Our customer base represents
over 160 Tier 1 and Tier 2 global network operators (fixed, mobile, satellite, WiFi, and enterprise) and our
solutions touch over 2.5 billion internet subscribers worldwide.
The foundation of our business is being the best network intelligence
company with unmatched depth and breadth of pre-packaged use cases,
that help our customers understand, optimize, automate, and manage
subscriber quality of experience (QoE). Our objective is to provide
the best vendor-agnostic granularity, accuracy, and automated
workflows for the data across our customers’ networks, and help
them intelligently act on that data.
We are committed to delivering the pre-eminent view of
global trends and distilled insights into what our operator
ecosystem sees and manages in terms of services delivered to
subscribers. As our global reach continues to expand across
fixed, mobile, cable, satellite, and WiFi network domains, we
will bring you viewpoints on these trends and special topics
through our report series.
Our goal with this report is to inform the global community on the
“internet phenomena” we live through every day, and to expose
both challenges and opportunities to build a more collaborative
ecosystem, providing a robust connected experience for subscribers.
We hope you will enjoy the report as well as the enhanced
presentation of the data. If you have any suggestions on
how we can make this report better, we would
appreciate your input. Please feel free to
email: [email protected].
Lyn Cantor,
CEO, Sandvine
About the Global Internet Phenomena Data
The data in this edition of the Global Internet
Phenomena Report is drawn from Sandvine’s
installed base of over 160 Tier 1 and Tier 2 fixed,
mobile, and WiFi operators worldwide. The report
does not include significant data from either China or
India, but the data represents a portion of Sandvine’s
2.5B subscribers installed base, a statistically
significant segment of the internet population.
This edition combines fixed and mobile data into a
single comprehensive view of internet traffic across
all network types. The volume of traffic on the
internet is dominated by fixed line networks, so even
though this report includes mobile and WiFi data,
the trends on fixed networks dominate traffic share.
Within each section, Sandvine measured the global
traffic share for applications from several different
perspectives:
Downstream: this is the traffic volume downloaded
from the internet. Examples would be a video
stream, a file download, or an app download from
the iTunes store.
Upstream: this is the traffic volume uploaded to
the Internet. It could be requests for content, an
interactive messaging session, or a Twitch stream of
a gaming session from a console.
Connections: this represents the number of
conversations occurring for an application. Some
applications use a single connection for all traffic,
others use many connections to transfer data or
video to the end user.
Welcome!
2
The Global Internet
Phenomena ReportSeptember 2019
Copyright © 2019 Sandvine. All rights reserved. All other trademarks are property of their respective owners.

Section 1: Global News Section 3: Spotlights
HIGHLIGHTS IN THIS EDITION A brief overview of some of key findings in this issue of the
Global Internet Phenomena Report.
EXECUTIVE OVERVIEWThere are more OTT video services vying for consumer dollars
and attention with fantastic original content. This fragmentation is
having a huge impact on networks worldwide in ways that you might
not have anticipated. The new normal might be a tall order for network
operators to deliver the QoE that consumers expect today.
GLOBAL APPLICATION TRAFFIC SHARE How much video can we watch? There are only so many hours
in the day, and we do have to work. Will something like 4K streaming
change the results of global traffic share?
GLOBAL APPLICATION RANKINGSWho is the king of the internet (at least from a bandwidth
perspective)? Last year Netflix reigned supreme; can they hold on to
the crown? Or is something else changing the landscape?
GLOBAL TRENDS: BEYOND THE TOP 10What happens outside the top 10? Almost 7,000 signatures are
present in this year’s Global Internet Phenomena Report, with many
of them customer-defined. We look at Nest Thermostat, Alexa versus
Siri, Tik Tok, and Crashlytics.
SPOTLIGHT: STREAMING VIDEO Not all regions are created equal when it comes to streaming
video traffic share. Netflix and YouTube are everywhere, but local
streaming is increasing.
SPOTLIGHT: GAMINGWhat individual games are generating the most traffic on
networks? Since the number of players does not always align with
traffic share, we look at each region to determine the winners.
SPOTLIGHT: SOCIAL NETWORKINGFacebook or Instagram? What about Snapchat? Or VK and
YouKu? Although the leaders are obvious, there are some surprising
names that pop up in this edition.
SPOTLIGHT: MESSAGINGSkype is the global traffic share leader in messaging, but there
are other strong contenders not far behind that may shift the share
rankings in the next edition.
SPOTLIGHT: STREAMING AUDIO“And the winner in streaming audio is... Spotify.” The market
share numbers for streaming audio do not align with the traffic share,
so what services are being used by consumers more often?
INFOGRAPHIC COLLECTION AND RESOURCESWant to use some of this data? We have a handy collection of
resources to simplify re-use of the data in the Phenomena Report, as
well as links to more information if you have questions for us.
AMERICAS DOWNSTREAM TRAFFIC SHAREVideo operators are fighting to hold consumers from OTT services. Are they succeeding?
AMERICAS UPSTREAM TRAFFIC SHAREMany OTT services are delivering exclusive content in the US; are consumers willing to pay for all of
them? Or is this changing the composition of streaming in the Americas?
SPOTLIGHT: IPTV FRAUD What if I told you that you could have all the channels you want for less than $10/month? The only catch
is that it is illegal...
EMEA DOWNSTREAM TRAFFIC SHAREAmazon with Twitch is dominating gaming streaming, but there are competitors coming.
EMEA UPSTREAM TRAFFIC SHARE People are sharing files in EMEA like never before. These numbers are epic, just like Game of Thrones.
SPOTLIGHT: GAME OF THRONES Highly anticipated, shared like never before. Is this the new normal?
APAC DOWNSTREAM TRAFFIC SHAREFacebook is one of the strongest brands on the internet. How strong is it in APAC?
APAC UPSTREAM TRAFFIC SHARE Consumers are using the cloud more than ever before. What type of traffic is cloud?
SPOTLIGHT: BRANDS Google, Netflix, Microsoft, Apple, Amazon, and Facebook are big on the internet. How big?
Section OverviewThe Global Internet
Phenomena ReportSeptember 2019
3Copyright © 2019 Sandvine. All rights reserved. All other trademarks are property of their respective owners.
Section 2: Regional News

Do OTT video content providers
have a fight on their hands?
Spidey gives the low-down on the true cost of higher resolutions
Highlights in this edition The Global Internet
Phenomena ReportSeptember 2019
4Copyright © 2019 Sandvine. All rights reserved. All other trademarks are property of their respective owners.
Plus spotlights on:
Traffic share leaders for video, social networking, messaging, audio streaming, and gaming
vsAlexa Siri
34th Worldwide (up from 65th in 2018)CLOUD TRAFFIC
is more than 50% of all APAC
upstream traffic
facebook>15%of all APAC Traffic

The massive impact of OTT fragmentationIn the 2018 report, we said: “We will talk quite a bit about video in this report, but it is important to
highlight the diversity of video streaming traffic around the world. Although Netflix and YouTube are still
the largest names in streaming (as you will see in the reports), there is an ever growing number of other
streaming providers capturing consumer screen time.” Well, not only were we right, but it is highly likely
to be getting worse, with some big changes on the way as major new services launch soon.
The data in this year’s report is conclusive that this
fragmentation is already happening in the market,
even before some large new players enter the market
(see sidebar). The surprising result is that it is not just
the big streaming networks that are growing, it is the
rest of the pack that are represented by some of our
generic streaming protocols for the thousands of
content providers worldwide.
There has also been a marked increase in operator
IPTV services that are being taken advantage of by
consumers. As you will see in the numbers, the overall
percentage of video has not increased (there are only
so many viewing hours in the day!), but consumers are
shifting some time from Netflix to their IPTV services,
and the operator is delivering greater value in their
set-top boxes. As shown in the graph to the right,
the share of the major OTT players remained fairly
consistent through the year, but on fixed networks at
least, the share of mobile video declined as the share
of operator video grew.
Is this a good thing? For IPTV operators, it means
that they are getting consumers to stick with their
service rather than cut the cord – which is a win. It
means in the home, people will need more bandwidth
as long form and large screen video requires more
bandwidth to achieve high quality versus social
video on smaller screens. It does, however, raise the
bar and expectations for network quality – as if a
consumer is paying for a video service, they expect
quality. Failure to deliver on that quality expectation,
and the cord will be cut. As 4K and 8K enter the
market, the expectations will grow even more, and
network operators will need to not only sell high speed
packages, but also to deliver on QoE expectations
during peak hours.
This video diversity trend has led directly to the
continued relevance of file sharing, which is still a
major source of internet traffic. Consumers that cannot
afford to subscribe to all of the different services turn
to file sharing to get the latest original content, even as
governments attempt to shut down sharing sites.
Last year, we reported that we saw an uptick in file
sharing for the first time in many years. Since we
had a bit of a lapse in the reports between 2016 and
2018, and the dataset we were drawing on was a
bit different, it was hard to give concrete proof. But
this year, we have rock solid numbers that can’t be
dismissed, even if you discount the final season of
Game of Thrones (GoT) (more on that later!) as an
outlier. We saw the impact of our prediction, so hang
on for a bumpy ride over the next few years as the
market shakes out!
Executive OverviewThe Global Internet
Phenomena ReportSeptember 2019
5
The first half of 2019 shows a marked growth of operator streaming traffic as a percentage of overall
video traffic on the internet. Operator streaming in this context is when an operator allows users
to stream video-on-demand (VOD) or even live broadcasts to their TVs, iPads, phones, etc. For an
operator, this means even if they retain cord cutters, the usage on their networks will go up for high
bandwidth video. The rise in this traffic shows that consumers are getting more comfortable with
cloud DVR services and streaming from their set-top boxes. Comcast has invested heavily in the X1
offering, and other operators are using various systems to offer similar services.
The spikes up and down represent events that shift viewing – the Super Bowl, new Netflix series
releases, the release of Avengers, Game of Thrones, etc. These events shift video from one source to
another then typically go back to normal. There are few events that completely change the landscape,
but it remains to be seen if the launch of Disney+, which is being hyped and is expected to be full of
both attractive existing content as well as original content, can change the landscape, even if for a
short time.
Copyright © 2019 Sandvine. All rights reserved. All other trademarks are property of their respective owners.
0%
10%
20%
30%
40%
50%
60%
70%
80%
90%
100%
Growth of Operator Video
OTT Operator Social
Operator IPTV Growth: Driven by live streaming and VOD “catchup”
Coming Attractions
There are a number of new services that will
be launching in the next year that may yet
again change the traffic landscape by the
next Phenomena Report:
• Disney+: Star Wars, Marvel, Pixar, and
decades of TV and movies, all priced
extremely well with compelling original
content. How could this fail?
• Apple: With the offer of free original
content with purchase of an Apple
device, this could drive up usage in
Apple-heavy markets.
• Universal: Another library with decades of
content, with attention being given to “The
Office,” which was one of Netflix’s most
watched TV shows.
• HBO Max: Warner Bro’s offer with another
massive content library that will build on
HBO Go and will leverage popular TV series,
especially “Friends”, this service promises to
be, “there for you when the rain starts to fall.”
• Other video services: DC Universe,
Facebook Watch, and Discovery have all
announced planned services.
• Google Stadia: It’s not just streaming
video that is coming, Stadia is maybe the
“Netflix of Gaming,” perhaps something
totally unique with bandwidth requirements
between 10-35Mbps and expectations of
low latency. Could this be the first tangible
monetization opportunity for QoE?

How much video can you watch?There are many predictions about how much video will be on the internet, with numbers as high as 80%
quoted by some reports. This year, there was a small jump (from 58% to 60%) in the overall percentage of
video traffic, but it sparked a few questions in our minds: “How much video can a consumer watch?”, “Will
4K/8K be the tipping point to hit 70%?”, “What else is coming that changes the consumption equation?” (I
know, curiosity killed the cat, but we need to know these things!). There were not huge shifts from last year,
but some significant movement occurred that signal further shifts in how bandwidth is being consumed.
The dynamic in the 2019 Global Internet Phenomena
Report is not that more video is being consumed,
but the shift in where that video is coming from. The
number of hours that a consumer can watch video
is limited, and other traffic types are still growing,
especially social networking and gaming.
As we will see in the individual application breakdown,
the percentage of internet traffic consumed by video
is pretty consistent with last year. Overall, traffic
volume is up (as it always is in broadband networks),
but the comparative usage by different applications
has shifted only slightly from 2018. The thing that can
change this will be when 4K and 8K go mainstream.
When 4K hits, a single video will grow 3-5x in size
from a HD video. 8K videos grow another 3-5x
from a 4K video. In this scenario, a single user will
not only consume more volume, but the rate they
consume this will increase, driving peak bandwidth
requirements up for network operators.
There will always be web browsing – although
increasingly through applications and embedded
browsers (like in social networking applications). This
number fell from 17% downstream and ~21% upstream
to much lower numbers this year, reflecting increasing
social networking and gaming volume.
As mentioned in last years’ report, a single download of
Call of Duty: Black Ops is equivalent to 14 hours of 4K
viewing, and because of the continued drive to digital
game delivery, gaming volume is up slightly on the
downstream, and more on the upstream in 2019. The
popularity and mainstreaming of eSports is growing,
and now this shows not only in the growth of Twitch
and gaming traffic, but also the prize money awarded
in eSports competitions (Bugha winning $3M for the
Fortnite championship held in Arthur Ashe Stadium was
a game changer). This growth is occurring even before
the launch of Google Stadia, which promises to change
the landscape for gaming, possibly forever.
We will talk more about file sharing later, but the
consumption is growing and shows no signs of slowing
due to all of the fragmentation and changes in the video
streaming landscape. The percentage for this traffic
type topped 4% downstream and over 30% on the
upstream, both larger than last year.
Outside the main categories, there were small shifts
in the rest of the traffic with marketplace, VPNs,
messaging, cloud, and audio streaming filling out the
traffic categories but essentially being lost in the noise
of massive amounts of video streaming, gaming, and
social networking.
GLOBAL APPLICATION CATEGORY TRAFFIC SHARE
VIDEO STREAMING 60.6%(+2.9) 22.2%(-0.1)
WEB 13.1%(-3.8) 10.3%(-10.6)
GAMING 8.0%(0.2) 4.9%(+2.2)
SOCIAL 6.1%(+1.1) 7.6%(+3.8)
FILE SHARING 4.2%(+1.4) 30.2%(+8.1)
MARKETPLACE 2.6%(-1.9) 1.6%(-0.2)
SECURITY AND VPN 1.6%(+0.2) 5.3%(-2.1)
MESSAGING 1.6%(-0.1) 8.3%(-0.1)
CLOUD 1.4%(+0.01) 9.0%(-0.3)
AUDIO STREAMING 0.4%(-0.5) 0.3%(-0.1)
Global Application Category Traffic ShareThe Global Internet
Phenomena ReportSeptember 2019
6
1
4
7
2
5
8
3
6
9
10
Copyright © 2019 Sandvine. All rights reserved. All other trademarks are property of their respective owners.
Standard Definition 1.4GB
High Definition6GB
Ultra-High Definition18GB
4K - 54GB
8K - 162GB
Conservative video sizes for a
service like Amazon Prime to
stream different video resolutions.
Netflix is generally the most
efficient video streaming service
on the market.

The long tail overtakes the short tail For every action, there is an equal and opposite reaction – and the market success of Netflix has
caused a massive pendulum swing in the market. Netflix grew popular as an aggregator of video,
essentially giving users the ability to watch a wide variety of content in from a single account. Amazon
and Hulu followed, and now every content owner is looking to monetize their content and deliver
originals as part of an exclusive streaming service.
In statistics and big data, we often talk about
the long tail and the short tail. Well, this year, the
aggregate volume of the long tail is actually greater
than the largest of the short tail providers. Last
year, Netflix was the largest traffic source with
almost 15% of downstream traffic. In 2019, Netflix
was edged out (slightly) by HTTP Media Stream,
which represents that long tail (which was a few
percentage points behind last year).
Sandvine has over 250 unique video signatures in
this report, and we are barely touching the surface
(something for us to expand on next year!). Our
signatures include the big services that you expect:
Netflix, YouTube, Twitch, Hulu, HBO Go, Instagram,
Facebook, BBC iPlayer, and DirecTV Now. It also
includes international channels and services like
Rakuten TV, Azteca TV, Daum Pot Player, Sky Go,
ZDF Mediathek, Kartina TV, and even Red Bull TV.
So, what video content and providers are in the long
tail? Since we are covering the global market, this is
not only something like Adult Swim and AMC in the
US, but NHK in Japan, Canal+ in France, and Foxtel
in Australia, which historically have not registered
enough volume both globally or in their own
countries. The long tail includes video ads that you
see (seemingly everywhere in your browser) when
you are on most websites. It also includes video
sharing sites that are all over the internet.
We are also seeing a big uptick in operator IPTV
traffic, driven by big volumes mostly in North
America. When we say “operator IPTV,” what we
mean is when your fixed line operator offers both
live TV streaming and VOD/catch up video offerings
through their set-top box or through app/web
portal. This is also where cloud DVR offerings come
into play, and these replay options are helping retain
cord cutters who value live TV and DVR playback.
The other big story is the continued growth in
file sharing, which is up significantly from last
year, with BitTorrent alone representing 2.46% of
downstream and 27.58% of upstream traffic. When
Netflix aggregated video, we saw a decline in file
sharing worldwide, especially in the US, where
Netflix’s library was large and comprehensive. As
new original content has become more exclusive to
other streaming services, consumers are turning to
file sharing to get access to those exclusives since
they can’t or won’t pay money just for a few shows.
File sharing is growing in all regions, and one of the
drivers during this report period was GoT (which we
will spotlight later). Is this the new normal, or is GoT
a unicorn?
Global Application Traffic ShareThe Global Internet
Phenomena ReportSeptember 2019
7Copyright © 2019 Sandvine. All rights reserved. All other trademarks are property of their respective owners.
GLOBAL APPLICATION TRAFFIC SHARE
HTTP MEDIA STREAM 12.8%(-0.1) 6.3%(+1.4)
NETFLIX 12.6%(-2.3) 2.1%(-0.8)
YOUTUBE 8.7%(-2.9) 2.4%(-0.6)
OPERATOR IPTV 7.2%(+2.8) 3.5%(-0.6)
HTTP DOWNLOAD 4.5%(+0.8) 1.0%(-0.3)
HTTP (TLS) 4.4%(+0.4) 2.2%(+0.1)
HTTP 3.0%(-0.1) 3.5%(-1.2)
FACEBOOK 3.0%(+1.2) 2.2%(+0.7)
PLAYSTATION DOWNLOAD 2.8%(+0.2) 0.4%(+0.0)
BITTORRENT 2.4%(+0.2) 27.5%(+6.4)
1
4
7
2
5
8
3
6
9
10
0
4
8
12
2
6
10
14
Per
cent
age
Netflix YouTube Operator IPTV
HTTP Download
HTTP (TLS) BitTorrent HTTP Facebook HTTP Media Stream
Nest Thermostat: 37th place for connections at 0.36% and at of 298th of all upload bandwidth at 0.01% - up from last year
HIGHLIGHTS
Nest Thermostat: The most significant
IoT device pops up as 37th on the list of
connections at .36% and 298th on the list
of upload bandwidth at .01% – up from
last year’s numbers just a bit.
Voice Assistants: Siri (80th) pulls a little
ahead of Alexa (96th) this year in the race
for the most frequent use and volume of
bandwidth.
Mobile Advertising: DoubleClick is 22nd
worldwide for number of connections,
showing just how powerful Google
advertising is.
Mobile Crashes: Crashlytics was .44%
of all connections (33rd worldwide), and
it was also .06% of upload traffic (110th
worldwide) for upstream bandwidth
– actually moving up from last year’s
numbers.
Tik Tok: Mobile-centric applications tend
to do poorly in the Global Report, but
Tik Tok, which was 11th worldwide in
the Mobile Report, rode video traffic all
the way to 34th worldwide (right behind
Snapchat) with a strong growth from last
year, when it was not even in the top 50
worldwide.
Global Trends: Beyond the Top 10
8
The Global Internet
Phenomena ReportSeptember 2019
96th position in connections worldwide
>0.01% of all upstream448th worldwide
80th position in connections worldwide
0.04% of all upstream 143rd worldwide
vsAlexa Siri
0.44% of all connections
0.06% of upstream bandwidth
Copyright © 2019 Sandvine. All rights reserved. All other trademarks are property of their respective owners.
34th Worldwide (up from 65th in 2018)

IPTV and Cloud DVRsWhat do we mean by IPTV and how is this different from other video streaming? As the image
below shows, the set-top boxes deployed by most cable video operators not only support the
classic CATV video streaming, but also VOD and increasingly other video applications (like
Netflix, Amazon, and YouTube).
When the user is watching normal live TV channels,
the video is delivered via the standard CATV
video distribution system. When the VOD menu is
launched and a video is selected, the set-top box
gets an IPTV stream from the operator’s internal
IPTV system. When a video application is launched,
the video is fed from the content provider’s video
CDN (or a cache if one is deployed in the operator
network). If the operator is not a cable operator,
then even live TV is delivered via an IPTV stream
(e.g., like a Verizon FIOS customer). The operator
has ultimate flexibility in this scenario,
as they can even deliver live channels or content
that they cannot offer through their existing video
delivery system simply by loading an application on
the set-top box.
One possible resolution to the fragmentation of
video providers is an application or set-top box that
not only aggregates selection of shows and video
providers though a single interface, but also billing.
In this scenario, the consumer has a single visual
and billing interface, simplifying the experience and
removing friction for consumers.
Video and gaming drive the Americas downstreamThe Americas, like the other regions, is led by
streaming video on the downstream, but with
more operator IPTV than other regions. Sandvine
has a very good installed base in cable and
fixed line operators in the Americas that feed
this report, and that certainly colors the regional
results heavily towards video, but gaming is also
an important player driving consumption.
Netflix is down from last year’s number in the
Americas, with viewing patterns diversifying from
mostly “netflix and chill” back to “what’s on tonight?”.
Many households have multiple streaming options
– both paid and free – that they take advantage
of. The cord cutting services in the US (DirecTV
Now, PlayStation Vue, Hulu + Live TV, and YouTube
TV among others) are still a drop in the bucket
compared to other streaming services, and operator
IPTV has grown significantly (see sidebar).
Gaming is very popular in the Americas, with both
PlayStation and Xbox download traffic in the top
10. With game delivery increasingly digital rather
than through the purchase of discs, and the size of
games (not to mention the frequency of updates and
expansion packs) escalating usage. As the graphic
shows, the size of downloads and the frequency of
patches is growing. The Division 2 initial patch (even
if you bought the disc) was 92BG, a big hit for any
consumer on a capped plan!
Twitch (which was in the top 20 in the Americas)
is actually lower in the region than others because
many eSports competitions can be viewed on
broadcast TV channels, but the popularity of eSports
among teens is growing (especially as the potential
for sponsorships and prize money grows) and driving
franchise growth.
Americas: Downstream Application Traffic ShareThe Global Internet
Phenomena ReportSeptember 2019
9Copyright © 2019 Sandvine. All rights reserved. All other trademarks are property of their respective owners.
AMERICAS TRAFFIC SHARE TOP 10
HTTP MEDIA STREAM 17.3%
OPERATOR IPTV 15.0%
NETFLIX 12.87%
YOUTUBE 6.3%
HTTP DOWNLOAD 4.5%
HTTP (TLS) 4.4%
HTTP 3.2%
PLAYSTATION DOWNLOAD 2.6%
XBOX LIVE DOWNLOAD 2.6%
FACEBOOK 2.2%
1
4
7
2
5
8
3
6
9
10
89GB 92GB (Initial Patch!)
76GB89GB (Patch Only!)
105GB

Exclusive content from the AmericasThe US is the source for a large quantity of the
highly desired video content in the world, so it is not
surprising that BitTorrent is growing again as the
exclusives begin to flood the market. As shown in
the image to the right, when GoT aired in the US, an
hour after the episode, you would see over 100,000
shares of the episodes on file sharing sites. Every
single episode of GoT generated similar volumes of
traffic (more on that in a spotlight later!).
Some of the exclusives that drove the increase
in filesharing (if you didn’t have the OTT server)
included: Jack Ryan and The Boys on Amazon
Prime, The Handmaid’s Tale on Hulu, Stranger
Things on Netflix, GoT on HBO, Star Trek Discovery
on CBS All Access, and Cobra Kai on YouTube.
Disney+ has a number of Marvel and Star Wars
exclusives planned that will also fuel this growth.
What is unexpected and interesting in the Americas
is the growth of IPSec VPN traffic, which is almost
as large as the volume of BitTorrent. Last year,
IPSec was just at ~2.5%, and this year it is 3x that
percentage. With the rising popularity of VPN services
designed to hide consumer activities, the usage
volume of VPNs has grown significantly.
Any consumer that has received a DMCA notice
from their service provider has quickly invested in a
$5-$15 a month VPN service, and then tunnelled
their file sharing (and sometimes ALL) traffic through
the VPN. The performance of the VPN services has
improved dramatically over the past few years to
support location shifting of video streaming (to get
around region locks for many streaming services) and
also works well to hide file sharing activities. Some
VPN usage is business traffic, as telecommuting and
remote work is growing, but not nearly enough to
account for this volume of traffic.
Other significant upstream traffic in the region is
for RTP (for voice and video messaging) and cloud
services from Apple (iCloud) and Dropbox, which
are widely used and integrated in with photo and
video devices for automated uploads by consumers.
Several other cloud services sit right outside the
top 10, demonstrating not only the popularity
of the services, but also the volume of data that
consumers are syncing to the cloud for backup and
security purposes.
Americas: Upstream Application Traffic Share
Popular Exclusives by OTT Service Coming soon!
10
The Global Internet
Phenomena ReportSeptember 2019
Copyright © 2019 Sandvine. All rights reserved. All other trademarks are property of their respective owners.
AMERICAS TRAFFIC SHARE TOP 10
OPERATOR IPTV 9.4%
BITTORRENT UPLOAD 8.5%
IPSEC VPN 7.7%
NETFLIX 4.5%
HTTP 4.4%
RTP 4.3%
HTTP MEDIA STREAM 3.9%
ICLOUD 3.7%
HTTP (TLS) 3.6%
DROPBOX 2.5%
1
4
7
2
5
8
3
6
9
10

The Global Internet
Phenomena ReportSeptember 2019
Video Piracy: It’s as easy as 1, 2, 3!Over the past 10 years, the landscape for video services has changed massively for consumers. The
simple choice of cable versus satellite has morphed into a massively confusing array of choices of
providers and channel packages. Basic packages are often quite expensive, and Netflix has slowly
but steadily chipped away with cord cutters. Over the past two years, streaming replacements for
live TV have begun to penetrate the market (still very small amounts of traffic) from Hulu, DirecTV,
YouTube, and Sony. Broadband speeds have increased and experience has improved to the point at
which consumers are willing to completely cut the cord.
Today, despite the continued growth in licensed
services, there are still consumers committing
content fraud and using piracy services offered for
below the cost of legal content. This new breed of
piracy providers is penetrating the market, and their
network usage is of the same order of magnitude as
many live TV streaming services.
We refer to these as fraudulent IPTV services and
fully-loaded Kodi boxes. Both platforms can use
completely legal, fee-paid services, as an alternative
to a cable or satellite connection, but modified
with piracy configured add-ons to access premium
content. Pirate IPTV and Kodi providers take live TV
streams from legitimate services and rebroadcast
them from cloud CDNs to subscribers that pay
anywhere from $5-$50/month, often for a channel
selection that is better than they can get from their
local provider, at a lower price; live sporting events
(including pay-per-view events), premium channels
like HBO, and international content that often costs
as much as $15/channel from cable operators. The
channel guides look almost exactly the same as the
one on your cable or satellite system, and the boxes
you can buy (even from places like Amazon.com)
are easy to install and operate.
Openload is a service that takes pirated movies
and original content from BitTorrent networks and
offering them as VOD. “Three weeks ago the new
Avengers movie came out, watch it on your box
now!” is a pretty compelling service offering. They
also build up a similar library for the latest seasons
of shows from broadcast, cable, and OTT providers
– GoT, Stranger Things, NCIS, Saturday Night Live –
just about anything you can think of.
We will be doing a special Phenomena Report on
this later in 2019, but we have seen anywhere from
4-25% of subscribers partaking in at least one illegal
stream on a weekly basis in networks surveyed
in North America, Europe, and the Middle East.
Consumption and participation vary by region, in rural
and metropolitan areas, by access type, and even
in hospitality networks, where travellers cannot get
legal access to content (especially sports) that they
want to watch while traveling. These services are
concerning to both network operators (who struggle
with bandwidth consumed) and content providers
(who are not getting revenue for their content), and
with increasing fragmentation of the market, we
expect this to grow over the next few years.
Spotlight: Video and IPTV Fraud
11Copyright © 2019 Sandvine. All rights reserved. All other trademarks are property of their respective owners.
Today, reliable broadband connections and simplified technology let users easily access content (including live TV) in a manner that violates content
licensing agreements. This trend is expected to grow due to the ease and relative low cost of accessing unlicensed content.
An extensive content library of select
television shows and movies available for
playback at any time.
Example: All GoT episodes
A sliding window of on-demand content,
acting like a DVR in the cloud.
Example: All programs that aired on a
channel in the previous seven days
Video streams that are available as something
is aired/broadcast/transmitted.
Example: Sunday night’s new episode of
GoT; professional sports
Note: Though the devices are called “Kodi boxes” in common parlance, Kodi is actually the application and can run on different kinds of hardware including
set-top boxes such as MAGbox but also Android, Windows, Amazon Fire TV, etc.
Amazon Fire TV Stick1
Top Devices by Tonnage
Kodi1
Top Applications by Tonnage
Android Device3 App (APK-based)3
MAG Box2 Infomir (Stalker Middleware)2
Windows PC4 Browser4
Apple Device5 VLC5
Video on Demand Catch-Up Live Video

EMEA: Downstream Application Traffic ShareThe Global Internet
Phenomena ReportSeptember 2019
12
Amazon, Twitch, and eSportsIn EMEA, if you combine Amazon Prime and
Twitch, Amazon is #4 overall behind YouTube
for video streaming on the downstream. The
popularity of Twitch has grown in concert with
the rise of eSports, and the purchase of Twitch
looks like a great buy for Amazon as it is in a fast
growing market. As with any new market though,
new competitors in this space are popping up
and will likely continue to arise until the market
is saturated and settles down.
Microsoft recently signed eSports star Ninja, a major
Twitch attraction, to their Mixer service to raise its
profile. Other prominent names in the space include
Caffeine and YouTube Gaming, all who are seeking
to attract the attention of eSports stars through
exclusive deals in the same way that athletes
are pursued by athletic shoes and clothing lines
(eSports stars get laptop and mouse endorsements
instead!).
Continuing the theme from the Americas, PlayStation
Download is again higher in volume than the Xbox,
helping drive the sales of hard drive upgrades to PS4s
all over EMEA! In the Mobile Report, we actually saw
PlayStation Download in the Middle East reach the top
10, so this is likely a factor even in the Global Report.
The rest of the top 10 in EMEA when it comes to
video is similar to the rest of the world. HTTP Media
Stream, Netflix, and YouTube are the top 3, and
Amazon Prime makes its best worldwide showing
at #5 with 4.21% of overall downstream traffic.
The popularity of several new series and ongoing
acquisition of content has enabled Amazon to
take market share in EMEA from other streaming
services. Amazon is investing in a highly anticipated
Lord of the Rings series, so we expect to see that
impact traffic when it is released.
Amazon is also attempting to offer aggregation
services by allowing users to purchase other
streaming services content inside the Amazon
interface (like HBO Go, Starz, Showtime, BritBox,
and a host of other small content providers). This
does not show up as Amazon traffic, but may
give Amazon a usability advantage as a content
aggregator. It will be interesting to see if Amazon
traffic builds as a result of being the “interface of
choice” and leveraging that position as a way to
increase the viewing of their own content.
The other notable traffic contributor in EMEA on
the downstream is BitTorrent, which was not in the
top 10 last year on the downstream. The obvious
question (which we will discuss more in a minute) is
if 2019 is an outlier due to the final season of GoT,
or is this the new normal? Time will tell, and we look
forward to learning the outcome!
Facebook makes an appearance in EMEA at #6
(not Facebook Video). Interestingly enough, in the
Mobile Report, Instagram was a bigger contributor to
traffic in EMEA, but there is still a lot of Facebook on
non-mobile devices, where there is very little Instagram
on non-mobile devices. Generally speaking, mobile-
specific applications tend to perform poorly in the
Global Report because they get lost in the flood of
video traffic. Facebook is often the exemption to that
rule as it has become an integral part of the desktop
experience for many users, especially older Facebook
users, who can’t see those small mobile screens.
Copyright © 2019 Sandvine. All rights reserved. All other trademarks are property of their respective owners.
EMEA APPLICATION TRAFFIC SHARE TOP 10
HTTP MEDIA STREAM 16.4%
NETFLIX 13.8%
YOUTUBE 11.8%
BITTORRENT 5.3%
AMAZON PRIME 4.2%
FACEBOOK 3.2%
PLAYSTATION DOWNLOAD 3.1%
QUIC 3.1%
HTTP (TLS) 3.0%
TWITCH 3.0%
1
4
7
2
5
8
3
6
9
10

EMEA: Upstream Application Traffic ShareThe Global Internet
Phenomena ReportSeptember 2019
13
Can you share Game of Thrones? Message me! We will specifically explore GoT on the next spotlight, but it is absolutely impossible to talk about the
EMEA upstream without mentioning it. Last year, we were shocked to see BitTorrent hit 31% on the
upstream and, in 2019, it crushed that number with almost 45% of upstream volume being consumed
by file sharing. Those kind of numbers have not been seen for years, especially in EMEA.
EMEA also had a top 10 appearance by IPSec
VPN traffic at #7, and it is likely that file sharing and
location shifting was a big part of this traffic volume.
The Middle East is always larger than other regions
for VPN traffic, as users seek to avoid content and
application filtering.
The other trend that stands out in EMEA is the
volume of messaging traffic on the upstream. Web
RTC, RTP, and WhatsApp are all in the top 10 on the
upstream. The Mobile Report earlier in 2019 showed
that messaging applications are specifically very
popular in the Middle East region, as they are used to
avoid voice tolls and high international charges.
Even though the cost of voice calls is now
approaching zero, the ubiquity of messaging
capabilities in browsers, in apps, and as companions
to social networking applications, consumers are
using voice and messaging services from network
operators far less and turning to OTT applications.
Increasingly, these calls are not just text or even
voice, but the volume and percentage of calls that are
video is growing as well. The main challenge in this
space is that there the market is still very fragmented
with hundreds of messaging applications.
Copyright © 2019 Sandvine. All rights reserved. All other trademarks are property of their respective owners.
BitTorrent in the clear and through an IPsec VPN
EMEA APPLICATION TRAFFIC SHARE TOP 10
BITTORRENT TRANSFER 44.2%
HTTP MEDIA STREAM 10.6%
WEB RTC 3.8%
GOOGLE 3.8%
YOUTUBE 2.1%
RTP 2.1%
IPSEC VPN 1.9%
FACEBOOK 1.8%
WHATSAPP 1.7%
HTTP 1.3%
1
4
7
2
5
8
3
6
9
10

The Global Internet
Phenomena ReportSeptember 2019
Is Game of Thrones an anomaly or the new normal?Last year, we reported that we saw an uptick in file sharing for the first time in several years. Since we had changed the way that we do the Global Internet
Phenomena Report, specifically from a much larger sample size, it was hard to compare apples to apples to provide hard proof. Well, this year we have it,
and a big driver was exactly what you would expect it to be – Game of Thrones (GoT).
One of my favorite topics is file sharing (along with
gaming!). Last year, I made an assertion in the
Phenomena Report that the reason we saw that
uptick in file sharing was due to the beginning of the
fragmentation of video streaming providers. With
so many high quality exclusive shows on different
streaming services, as an avid consumer of video
content, it is challenging for me to get access to all
the shows I want to watch without purchasing not
just one or two streaming services, but sometimes
even four or five.
Here’s what I consider must watch off the top
of my head in the past year: Jack Ryan and The Boys
on Amazon Prime, The Handmaid’s Tale on Hulu,
Stranger Things on Netflix, GoT on HBO, Star Trek
Discovery on CBS All Access, and Cobra Kai on
YouTube Red. Last year, Hulu and Amazon Prime
made major investments in content, and more and
more streaming services are launching and
announced (like Disney+) that will continue this trend.
But the king of 2019 has been GoT. No matter your
opinion of the final season, it was hotly anticipated,
and people wanted to watch it immediately. They
knew that if they waited, they would be spoiled by
tweets, articles, social networking posts, and even
broadcast news stories. So, people endeavored to
get access to the shows through whatever means
necessary. For old school video consumers, they
had HBO on their cable or maybe IPTV package.
Some cord cutters had HBO Go service. Yet others
used piracy, either a Kodi service offering or using
BitTorrent file sharing. Let’s look at how these
different services appeared to network operators
from a usage perspective.
The top graph on the right is how both HBO Go
and Kodi traffic changed over the first half 2019.
As you would expect, HBO Go peaked during the
GoT season, and has fallen precipitously since then.
The interesting thing to note is that the volume of
Kodi traffic (which is typically a pirated IPTV service)
exceeds the volume of HBO Go normally.
What is slightly scary is that if you look at the file
sharing trends for 2019, it shows a very similar
pattern that aligns with GoT in the bottom graph.
Notice the big spike during the GoT season (it is also
worth noting that on April 22, Avengers: Endgame
was released). It is also important to note that I could
not make these graphs overlay each other, because
the volume of file sharing was orders of magnitude
greater than both Kodi and HBO Go and they would
have appeared to almost be zero by comparison.
This is a stark demonstration of what the “streaming
wars” will result in for network operators — not just
more video streaming, but the revival of file sharing,
which will take every bit of bandwidth that it can
when it is used. GoT is something special, but as
more and more event content hits the market, this
pattern will repeat.
So, the question for both content owners and
network operators – “is this the new normal?”. If it
is, then network operators are in for a rough road,
as streaming video traffic is actually easier for their
network to handle than file sharing. With network
neutrality and traffic management a topic of much
interest worldwide, many network operators have
restrictions on how they can manage QoE, and
growth in file sharing will result in poor QoE.
Video streaming (especially adaptive streaming) is
generally well behaved, and will burst to fill the media
player buffer but then back off until the buffer is
partially drained (giving a sawtooth pattern of usage).
If the buffer cannot keep up with playback, the video
will downshift to a lower resolution to avoid a stall and
therefore deliver a bad experience to the consumer.
File sharing is designed to take as much bandwidth as
possible from as many sources (often ~300) that it can
as fast as the network can deliver it. Many clients have
speed controls built in, but they are seldom used by
consumers, who want to download as fast as possible
to leave minimal footprint on the P2P network. Bad
behaving applications can wreak havoc on network
QoE, and visibility into this is critical.
Spotlight: Game of Thrones
14Copyright © 2019 Sandvine. All rights reserved. All other trademarks are property of their respective owners.

APAC: Downstream Application Traffic ShareThe Global Internet
Phenomena ReportSeptember 2019
15
Facebook: The BrandBrands are powerful on the internet (more on that in the next spotlight), but in APAC, Facebook rules the
roost with over 17% of all regional downstream traffic. Three of Facebook’s attractions are in the top 10 in
APAC: Facebook Video, Facebook, and Instagram. While the power of Facebook’s brand is demonstrated
by applications like WhatsApp, Facebook Messenger, and Oculus also being in the top 100, “By Facebook”
is being added to Instagram and WhatsApp (it already has for Oculus) to build the brand further.
APAC is one of the biggest markets for Facebook, with
India, Indonesia, Phillipines, Vietnam, and Thailand all
usually listed in the top 10 for active users worldwide.
For Instagram, India, Indonesia, and Japan are in the
top 10 globally by user count. APAC is the top region
for Facebook Video traffic, with direct traffic share
being taken from YouTube as users replace YouTube
shares with Facebook video sharing, as Sandvine
distinguishes between the two traffic types since they
do require different QoE measurements and QoE
assurance techniques for consumers. Facebook Video
showed very strongly in APAC in the Mobile Report,
and also increased shared in the Global Report.
As targeted advertising on social media becomes
the medium of choice to attract young buyers, we
expect to see the social networking numbers in APAC
continue to grow, which will grow Facebook’s share in
the region even more. The region has an abundance
of bandwidth in many countries (South Korea, Japan,
and Singapore to name a few) and broadband plans
are increasingly generous in volume allowances.
Despite the presence of many regional- or country-
focused social networks (WeChat, Sina Weibo, LINE,
SNOW, Naver, Tencent QQ, and Youku among many),
the pure global brand of Facebook is still very strong,
and is expected to remain that way for some time,
unless regulatory changes hit the company.
As in the other regions, HTTP Media Stream is the
top video source, with Netflix, Facebook Video, and
YouTube as the other video streaming leaders. The
long tail of video sources continues to grow in the
region as more content owners, including international
streamers, seek regional offerings to expats and
travellers in APAC. This is an application that again
takes advantage of the high speed of broadband
access in the region, and video will grow in this region,
especially in Japan, South Korea, and Singapore.
Windows Update is in the top 10 in APAC, the
only region it makes a top 10 appearance. As
shown in the Phenomena Spotlight on this topic,
Windows Update generates steady traffic, but the
sheer number of devices in the region push the
updates into the top tier of bandwidth consumption.
Windows Update traffic is a constant “background
noise” on all fixed broadband networks, and can be
considered a necessary evil to help keep Windows
applications both up-to-date and secure.
Continuing the file sharing trend, BitTorrent is #10 in
the region with almost 5% of downstream traffic, as
the appetite for out-of-region pirated content grows.
Historically, APAC has avidly utilized BitTorrrent
through the years, and this has not changed.
Copyright © 2019 Sandvine. All rights reserved. All other trademarks are property of their respective owners.
APAC APPLICATION TRAFFIC SHARE TOP 10
HTTP MEDIA STREAM 10.9%
HTTP DOWNLOAD 7.3%
HTTP (TLS) 6.8%
NETFLIX 6.4%
FACEBOOK VIDEO 6.0%
FACEBOOK 5.5%
INSTAGRAM 5.3%
WINDOWS UPDATE 4.6%
YOUTUBE 4.6%
BITTORRENT 4.5%
1
4
7
2
5
8
3
6
9
10Facebook is a major force in APAC, with some of the largest Facebook cities and countries worldwide.
Facebook Video is also strongest in this region compared to the rest of the world.

APAC: Upstream Application Traffic ShareThe Global Internet
Phenomena ReportSeptember 2019
16
Let’s put it all in the CloudWhen we think about the upstream in
most regions, we see a lot of video traffic
consisting of packet acknowledgements and
bookmarking of progress in watching videos as
well as messaging traffic. In APAC, cloud traffic
consumes more than 50% of all upstream
traffic. In this context, we are defining three
types of cloud traffic:
Cloud Storage: Services that are used to
automatically or manually store files for a
consumer or business to enable access from
multiple systems, as well as to have backup in
case of local system failures. This includes services
like iCloud, Google Cloud, and Samsung Cloud
that are commonly offered as part of a mobile
device and automatically sync files, videos, and
pictures as an integral part of the OS.
Cloud Sharing: This can be thought of in this
context as file sharing. Technically peer-to-peer
file sharing is a cloud application – just the cloud
is literally anyone’s computer that is connected
to the P2P mesh rather than specific servers in
a datacenter somewhere. Any device connected
becomes part of the cloud and available to all.
Cloud Updates: We included this category as
cloud, because essentially the upstream traffic for
this type of traffic is the result of either a system
checking with the software update server to see if
there is a newer version of an application available
or the acknowledgement during a download (and
since Windows Update was in the top 10 for
download, this is statistically significant!).
Outside file sharing and cloud, social networking
through Facebook and YouTube make up much
of the rest of the top 10 in APAC. As we saw on
the downstream, Facebook’s brand is strong
in the region, and to keep a social network
vibrant, you need upload traffic to feed browsing.
Facebook Video is right outside the top 10, so that
contributes to the overall volume of Facebook in
the region.
One interesting result for APAC is that there are
no messaging applications in the top 10 on the
upstream. As popular as we know that messaging
is in the region, there are too many messaging
applications for one to build enough critical mass
to break the top 10. This is another example of
fragmentation and a difference in APAC patterns.
Copyright © 2019 Sandvine. All rights reserved. All other trademarks are property of their respective owners.
APAC APPLICATION TRAFFIC SHARE TOP 10
BITTORENT UPLOAD 24.8%
GOOGLE 15.9%
HTTP 7.9%
HTTP MEDIA STREAM 4.8%
ICLOUD 4.8%
FACEBOOK 4.4%
YOUTUBE 4.2%
KGRID 3.5%
ICLOUD PHOTO STREAM 2.8%
INSTAGRAM 2.2%
1
4
7
2
5
8
3
6
9
10
CLOUD TRAFFIC
is more than 50% of all APAC
upstream traffic
CLOUD STORAGE CLOUD SHARING CLOUD UPDATES
iCloud

The Global Internet
Phenomena ReportSeptember 2019
Brands on the internetWe often talk about the big brands on the
internet and their dominance. Last year, I did a
spotlight on Asia that showed that Google was
over 40% of the connections in Asia, and in
the Mobile Report, Facebook was over 20% of
all mobile traffic. I decided to dig through the
Phenomena data to discover how the internet
brands would stack up against each other.
The internet brand giants are not always just a single
thing anymore. For each of these brands, there is a
collection of content and applications that combine
to build the overall brand. I took all of the statistically
significant contributors from each brand (essentially
anything that contributed over .01% of connections
or volume) and decided to compare their impact
on internet traffic. Some of the biggest bandwidth
consumption for each brand included:
Google (Alphabet): YouTube, Google Cloud,
Google Play, Google Search, Google Docs, Google
Drive, DoubleClick, Gmail, and Crashlytics
Netflix: Netflix Video
Facebook: Facebook, Instagram, Facebook Video,
WhatsApp, Facebook Messenger, Oculus Rift
Microsoft: Xbox Live, Windows Update, Skype,
Outlook 365, Office 365, SharePoint, OneDrive,
Windows Store, LinkedIn
Apple: iTunes, iCloud, Apple Software Update,
FaceTime, Apple Music, Apple.com, iCloud Photo
Stream, Mac App Store
The brands with video traffic have a significant
advantage on the downstream. Google (YouTube),
Netflix, Facebook, and Amazon (Amazon Prime)
have strong video offerings. Apple soon will, and
Microsoft’s entry into gaming streaming (Mixer) will
likely move them up this list if they can continue to
recruit high profile gamers.
As shown in the chart, Google is #1 overall and
on the upstream. The combination of YouTube,
Google Search, and Google Cloud are the biggest
contributors to the upstream traffic, as they are an
integral part of any Android device’s experience.
Netflix is the #1 on the downstream and #2 overall
as the only pure play in the bunch. As we mentioned
last year, if Netflix was not the most efficient
streamer at every resolution, their total could easily
be twice what it is today, and they continue to excel
in video codec work and efficiency in resolution
downshifts and upshifts.
Google is also #1 on connections. This is a much
more collaborative effort among Google apps.
YouTube, Google Cloud Messaging, Google
Search, Crashlytics, DoubleClick, and even Nest
are the biggest contributors to Google connections
per device.
Amazon: Amazon Prime, Twitch, Amazon.com,
Alexa, Amazon Glacier, Amazon Music
When combined, these brands took up over 43%
of all traffic volume on the internet: The details are
interesting. Overall, Google edged out Netflix as
the top consumer of bandwidth on the internet (as
well as upstream) and dominated in the percentage
of connections. Unsurprisingly, Netflix was the
single largest consumer of traffic downstream, but
Google was not far behind. This is confirmation
that brands can build synergies, expand their
business, and succeed.
The obvious outlier in this case is Netflix, which does
one thing and does it exceedingly well, albeit at very
high volume. With new streaming services coming
out from Facebook and Apple, with 4K and live
streaming taking hold, these numbers might climb
even higher next year.
Spotlight: The Brand Ecosystem
17Copyright © 2019 Sandvine. All rights reserved. All other trademarks are property of their respective owners.
Each brand’s connection, downstream, and
upstream share, as well as overall share is
shown in the table. Google (on the strength of
YouTube) is the overall leader (as well as the
upstream leader, followed closely by Netflix).
Google is also the leader in connections,
not only fuelled by Google Search, but also
DoubleClick and the Android Market. Netflix,
the one “pure play” in the group, is #1 on the
downstream with 12.60% of overall volume.
The rest of the internet combined is barely
larger than the traffic from this collection
of powerhouse brands. If you do the math,
these brands are also over 45% of the total
connections on the internet as well.

18
The Global Internet
Phenomena ReportSeptember 2019
Spotlight: Streaming Video Traffic Share
Copyright © 2019 Sandvine. All rights reserved. All other trademarks are property of their respective owners.
EMEA Video
HTTP Media Stream
Netflix
YouTube
Amazon Prime
Twitch
0% 20%10% 30% 40% 0% 20%10% 30% 40%DOWNSTREAM PERCENTAGE UPSTREAM PERCENTAGE
26.09% 11.43%
20.14% 6.41%
6.61% 6.28%
5.01% 5.55%
28.53% 46.53%
Americas Video
HTTP Media Stream
Operator IPTV
Netflix
YouTube
Amazon Prime
0% 20%10% 30% 40%DOWNSTREAM PERCENTAGE
22.98%
19.20%
15.81%
3.87%
25.07%
0% 20%10% 30% 40%UPSTREAM PERCENTAGE
33.42%
24.45%
14.76%
8.60%
3.10%
APAC Video
HTTP Media Stream
Netflix
Facebook Video
YouTube
Twitch
0% 20%10% 30% 40% 0% 20%10% 30% 40%
DOWNSTREAM PERCENTAGE UPSTREAM PERCENTAGE
16.65% 15.95%
15.49% 15.40%
13.22% 15.14%
5.00%
30.58% 18.95%
7.65%
Americas Video
Operator IPTV
Netflix
HTTP Media Stream
YouTube
FaceTime
EMEA Video
HTTP Media Stream
YouTube
Netflix
Twitch
Amazon Prime
APAC Video
HTTP Media Stream
YouTube
Netflix
Facebook Video
Twitch
GLOBAL VIDEO STREAMING TRAFFIC SHARE
HTTP MEDIA STREAM 23.8%
NETFLIX 23.1%
YOUTUBE 12.7%
OPERATOR IPTV 10.0%
FACEBOOK VIDEO 5.0%
AMAZON PRIME 4.3%
TWITCH 4.2%
TIK TOK 3.4%
OPENLOAD 2.4%
DAILY MOTION 1.3%
1
4
7
2
5
8
3
6
9
10
Streaming VideoWith video being over 60% of all traffic on the
internet, operators clearly need visibility into
which providers are dominating their network,
as each provider has different requirements for
bandwidth at different resolutions. Even more
frightening is that 4K content streams are a drop
in the bucket so far, and 8K is not yet a reality –
when it is, all bets are off!
This spotlight takes all video traffic and measures
market share of streaming video in each region.
HTTP Media Stream, Netflix, and YouTube are in
the top 5 for downstream bandwidth in each region,
and they drive overall video consumption.
As mentioned previously, this year takes the trend
we saw last year in the increase in the number
of video streaming services that are offered to
consumers. HTTP Media Stream represents the
growth in streaming services that Sandvine has
not yet tracked individually (like we do Netflix, Hulu,
etc.). In general, you can think of these as services
where content owners (often cable or broadcast
channels) stream their content to users. Some of
these services require the user authenticate with
a TV provider account to stream traffic (like ESPN
does for example), others are simply free to all.
The surprise entrant from last year, Openload, is still on
this list, and is actually a higher percentage of overall
video traffic than last year. This is the most popular
Kodi provider that we see worldwide, and reflects the
growing popularity of IPTV piracy.
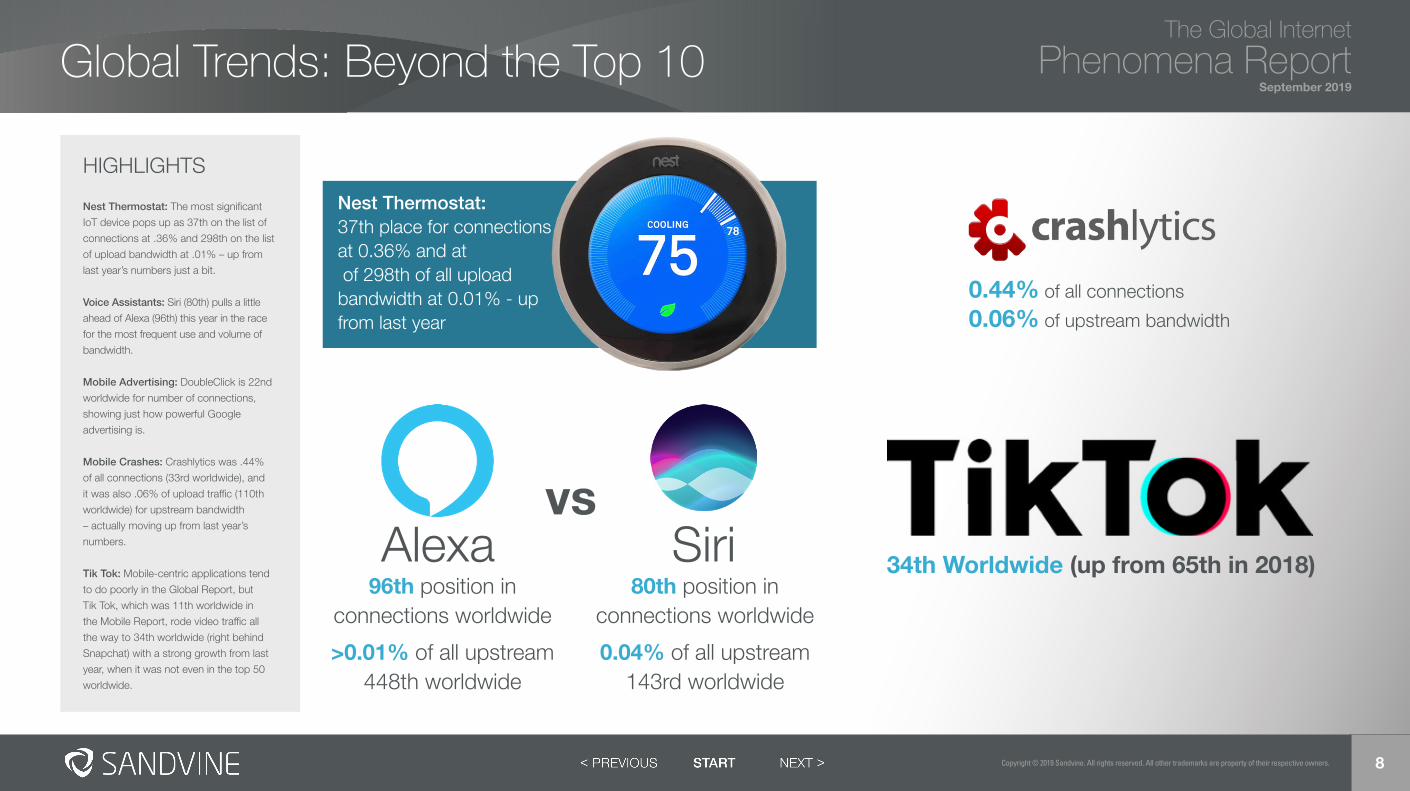
GamingGaming continues the growth trend from last
year, but what is significant and demonstrates
the changing of the gaming landscape is the
consistency from year to year for the top games.
In the old days, gaming companies’ success was built
on new versions of games on a yearly cadence. This
is still the case for many sports games, but for other
genres, expansion packs and simple updates to the
gameplay are fueling continued dominance.
It is no surprise that League of Legends remains
#1 worldwide, followed by Player Unknown’s
Battlegrounds (PUBG) and Fortnite, with Overwatch
and Destiny not far behind the leading pack. The
prize money given at tournaments in 2019 was
staggering, with Fortnite having a pool of $30.4M ($3M
for Bugha) in their recent championship.
Minecraft, despite its age, is still going strong, and is
still updated on a regular basis. It is supported on
multiple platforms, and has a dedicated and loyal
following has invested a lot of time in their worlds.
World of Warcraft (WoW) is also still generating
traffic, and WoW Classic might bump that up.
The mobile games Respawnables and Clash
Royale/Clash of Clans are both in the top 10,
demonstrating how popular real-time strategy
games are, despite being mobile-centric. People
in airports, restaurants, at work, and at home, are
keeping their fortress safe from attack. Mobile games
that capture a sense of urgency and “can’t-miss,”
generate substantial traffic as users engage often.
19
The Global Internet
Phenomena ReportSeptember 2019
Spotlight: Gaming Traffic Share
Copyright © 2019 Sandvine. All rights reserved. All other trademarks are property of their respective owners.
GLOBAL GAMING TRAFFIC SHARE
LEAGUE OF LEGENDS 14.5 8.6% PLAYER UNKNOWN 10.7% 12.3%
FORTNITE 9.5% 5.6%
OVERWATCH 7.8% 8.9%
DESTINY 6.5% 1.9%
MINECRAFT 6.4% 7.2%
RESPAWNABLES 6.3% 4.9%
WARFRAME 2.9% 0.8%
CLASH ROYALE/CLANS 2.7% 1.9%
WORLD OF WARCRAFT 2.6% 2.2%
1
4
7
2
5
8
3
6
9
10
EMEA Gaming
Fortnite
PUBG
Minecraft
CS:GO
Warframe
0% 20%10% 30% 40%DOWNSTREAM PERCENTAGE
16.63%
10.76%
8.75%
7.32%
19.06%
Americas Gaming
Fortnite
League of Legends
Minecraft
Overwatch
PS Now
0% 20%10% 30% 40%DOWNSTREAM PERCENTAGE
15.30%
11.44%
8.56%
7.48%
17.18%
APAC Gaming
PUBG
League of Legends
Overwatch
Fortnite
Minecraft
0% 20%10% 30% 40%DOWNSTREAM PERCENTAGE
15.54%
14.36%
10.32%
5.71%
20.85%
6.85%
0% 20%10% 30% 40%UPSTREAM PERCENTAGE
13.00%
11.99%
10.59%
9.62%
9.22%
Americas Gaming
Minecraft
Fortnite
League of Legends
Overwatch
Destiny
0% 20%10% 30% 40%UPSTREAM PERCENTAGE
12.89%
8.14%
7.09%
7.05%
20.49%
EMEA Gaming
PUBG
Fortnite
CS:GO
Destiny
Minecraft
0% 20%10% 30% 40%UPSTREAM PERCENTAGE
13.82%
8.23%
7.10%
15.57%
APAC Gaming
League of Legends
Overwatch
Pokemon Go
Fortnite
Minecraft

Social NetworkingThe social network rankings flip a bit this year
because of a change made in calculating the
usage. To be even-handed, the rankings this
year combine all traffic for the service except
dedicated messaging apps (which we cover
separately). The impact of this is that it rewards
social networks that have video offerings, but
we excluded both TikTok and YouTube from this
category, since they are as much video sharing
as pure social networking.
With this setup, it is again no surprise that Facebook,
(especially with Facebook Video included) is #1.
Facebook shows no signs of slowing down despite
some of the issues that have occurred in the past
year. Instagram, Facebook’s sibling, is #2 worldwide
and is becoming the marketing channel of choice
for brands going after millennials and the younger
generation, who only want to see advertising that is
relevant to their interests.
Snapchat (which is covered both as a social
network and a messaging app) remains strong,
and continues to hog rates of engagement on a
smaller installed base. Several international social
networks make an appearance in the top 10: VK,
Odnoklassniki, YY, and YouKu. Although not at the
volume of Facebook and Instagram, today’s users
have presence on multiple social networks.
Honorable mention to Tinder which was #11,
ensuring that we will continue to see crazy Tinder
stories for at least a little longer.
20
The Global Internet
Phenomena ReportSeptember 2019
Spotlight: Social Networking Traffic Share
0% 20%10% 30% 40% 50%EMEA Social Networking
VK
Odnoklassniki
Snapchat
DOWNSTREAM PERCENTAGE
20.49%
10.15%
9.65%
1.99%
55.90%
0% 20%10% 30% 40% 50%Americas Social Networking
Snapchat
Tumblr
DOWNSTREAM PERCENTAGE
23.69%
2.31%
1.11%
1.10%
68.54%
0% 20%10% 30% 40% 50%APAC Social Networking
Tumblr
Snapchat
DOWNSTREAM PERCENTAGE
25.61%
3.26%
2.56%
1.47%
62.85%
Copyright © 2019 Sandvine. All rights reserved. All other trademarks are property of their respective owners.
GLOBAL SOCIAL NETWORKING TRAFFIC SHARE
FACEBOOK 60.6% 5 8.1%
INSTAGRAM 26.2% 25.1%
SNAPCHAT 3.7% 8.0%
VK 2.4% 2.2%
TUMBLR 1.7% 0.5%
TWITTER 0.9% 1.6%
ODNOKLASSNIKI 0.8% 0.5%
PINTEREST 0.4% 0.3%
YY 0.3% 0.2%
YOUKU 0.2% 0.1%
1
4
7
2
5
8
3
6
9
10
0% 20%10% 30% 40% 50%UPSTREAM PERCENTAGE
21.87%
12.31%
4.67%
1.80%
57.44%
0% 20%10% 30% 40% 50%UPSTREAM PERCENTAGE
57.10%
30.99%
5.18%
1.95%
1.79%
0% 20%10% 30% 40% 50%UPSTREAM PERCENTAGE
33.24%
7.01%
6.97%
44.14%
3.36%
Americas Social Networking
Snapchat
Tumblr
EMEA Social Networking
VK
Odnoklassniki
Snapchat
APAC Social Networking
Snapchat
Tumblr
The Global Internet
Phenomena ReportSeptember 2019
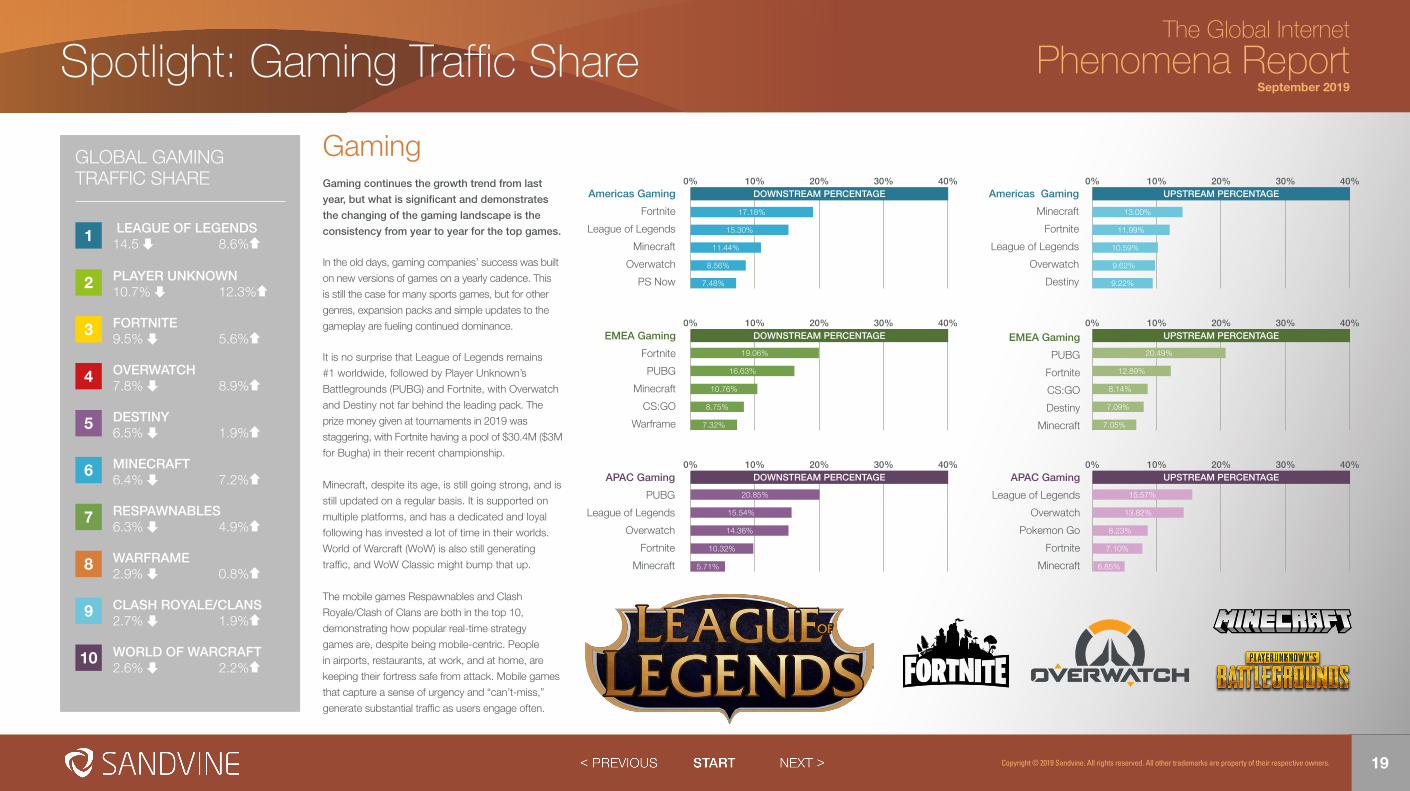
MessagingMessaging and VoIP applications have become
staples of the consumer experience, for both
business and personal usage. Business usage
tends to be more long form, video and voice
heavy, and generally higher volume than
consumer and social network applications.
Messaging apps that emphasize voice and video
always will occupy more traffic share than pure text
applications. This is why Skype, WhatsApp, Snapchat,
and FaceTime are the leading sources of downstream
and upstream traffic share since video usage is very
common among their sizeable user base.
In many parts of the world, messaging apps have
essentially replaced voice and SMS traffic on carrier
networks, with WhatsApp being a poster child for
this type of full replacement of carrier services.
WebRTC moves up to #3 worldwide (from #4 last
year) as the leading “open protocol” for messaging.
WebRTC is used in services like GoTo Meeting,
Amazon Chime, and in major web browsers. The
usage of WebRTC is growing rapidly worldwide, and
the generic use of this will likely begin to be broken
out into unique applications as they gain popularity.
WeChat, KakaoTalk, and Line are all popular regional
applications that are used worldwide.
Discord is a popular messaging service that is often
used in concert with gaming, both to communicate
in real-time games as well as forums to discuss
gaming strategy.
Spotlight: Messaging Traffic Share
21Copyright © 2019 Sandvine. All rights reserved. All other trademarks are property of their respective owners.
GLOBAL MESSAGING TRAFFIC SHARE
SKYPE 21.7% 6.5% WHATSAPP 16.2% 13.1% WEBRTC 14.4% 21.3%
SNAPCHAT 13.2% 4.0%
FACETIME 5.2% 10.7%
FACEBOOK MESSENGER 2.6% 5.0% WECHAT 1.8% 2.0%
KAKAOTALK 1.3% 0.6%
DISCORD 1.1% 0.5%
LINE 0.6% 0.4%
1
4
7
2
5
8
3
6
9
10
Americas Messaging
Skype
WebRTC
Snapchat
FaceTime
0% 20%10% 30% 40% 0% 20%10% 30% 40%DOWNSTREAM PERCENTAGE UPSTREAM PERCENTAGE
28.43%
15.88%
9.08%
3.17%
34.95% 32.22%
27.21%
11.23%
7.73%
EMEA Messaging
WebRTC
Skype
Snapchat
Telegram
0% 20%10% 30% 40% 0% 20%10% 30% 40%DOWNSTREAM PERCENTAGE UPSTREAM PERCENTAGE
27.12% 35.94%
22.87% 11.34%
4.83% 4.30%
4.14%
36.42% 38.24%
APAC Messaging
Skype
Kakao Talk
Snapchat
LINE
0% 20%10% 30% 40% 0% 20%10% 30% 40%DOWNSTREAM PERCENTAGE UPSTREAM PERCENTAGE
18.41% 15.43%
16.68% 13.86%
10.37% 11.31%
7.69%
22.34% 25.46%
7.47%
10.58%
1.72%
Americas Messaging
WebRTC
Skype
FaceTime
Snapchat
EMEA Messaging
WebRTC
Skype
Facebook Messenger
Snapchat
APAC Messaging
Skype
Kakao Talk
Snapchat
LINE

Audio StreamingThe interesting result of a traffic share analysis
for audio streaming is how it does not align
with a subscriber-based view of market share.
Instead, it shows how much users consume
on their subscriptions, which is a better gauge
for a network operator and usually why audio
streaming is one of the first applications that is
offered as zero-rated.
Spotify remains the leading audio streaming provider
in the world, maintaining their position from 2018.
SHOUTcast, HTTP audio streaming, and SoundCloud
are all top sources of audio streaming that reflect the
popularity of podcasts and internet radio services
(often directly from the station’s app or web page).
Podcasts continue to be popular content, and both
HTTP audio streaming and SoundCloud benefit from
this, most noticeably on the upstream.
Apple Music is up significantly from last year,
clocking in at #3 and #1 in the Americas, which the
Mobile Report showed as an Apple-heavy market.
Apple has been pushing the service, and the market
effort is paying off in traffic share.
The rest of the rankings represent many of the more
popular music streaming services. Tidal, Deezer,
Google Play Music, Pandora, and NetEase Cloud
Music (a Chinese streaming service) are all top 10
audio services worldwide. Amazon Music is right
outside the top 10, benefiting from the pervasive
Prime services presence and most specifically from
the ease of asking Alexa to “play rock music.”
Audio Streaming Traffic ShareThe Global Internet
Phenomena ReportSeptember 2019
22Copyright © 2019 Sandvine. All rights reserved. All other trademarks are property of their respective owners.
GLOBAL AUDIO STREAMING TRAFFIC SHARE
SPOTIFY 28.0% 26.8%
HTTP AUDIO STREAMING 22.8% 31.4%
SHOUTCAST 22.8% 31.1%
APPLE MUSIC 15.6% 4.40%
SOUNDCLOUD 3.9% 1.7%
DEEZER 1.7% 0.6%
PANDORA 1.5% 1.3%
TIDAL 1.1% 0.3%
GOOGLE PLAY MUSIC 1.1% 0.4%
NETEASE CLOUD MUSIC 0.2% 0.2%
1
4
7
2
5
8
3
6
9
10
Americas Audio Stream
Apple Music
SHOUTcast
HTTP audio streaming
Spotify
SoundCloud
0% 20%10% 30% 40%DOWNSTREAM PERCENTAGE
19.62%
16.47%
13.95%
8.48%
26.89%
0.50%
EMEA Audio Stream
HTTP audio streaming
SHOUTcast
Spotify
Apple Music
SoundCloud
0% 20%10% 30% 40%DOWNSTREAM PERCENTAGE
19.45%
12.38%
11.15%
3.70%
49.50%
APAC Audio Stream
HTTP audio streaming
Spotify
Apple Music
Melon
SoundCloud
0% 20%10% 30% 40%DOWNSTREAM PERCENTAGE
19.76%
10.30%
3.54%
2.83%
53.97%
3.80%
0% 20%10% 30% 40%UPSTREAM PERCENTAGE
37.76%
32.57%
14.37%
4.69%
3.33%
Americas Audio Stream
SHOUTcast
Spotify
HTTP audio streaming
Pandora
SoundCloud
0% 20%10% 30% 40%UPSTREAM PERCENTAGE
8.52%
3.28%
0.74%
86.52%
EMEA Audio Stream
SHOUTcast
HTTP audio streaming
Spotify
Apple Music
SoundCloud
0% 20%10% 30% 40%UPSTREAM PERCENTAGE
27.08%
47.70%
6.29%
5.99%
APAC Audio Stream
Melon
HTTP audio streaming
Apple Music
Spotify
SHOUTcast

Infographic links Phenomena RoadmapWant to know more about Sandvine?
GRAPH PACKTop 10 lists for all sections if you want to show the traffic share for any specific geography or class of application.CLICK HERE
INFOGRAPHICS PACKWhat application categories are the leading consumers of internet bandwidth? The real question is, how much traffic on the internet is video?CLICK HERE
SANDVINE LOGO PACKNeed Sandvine logos for attribution?CLICK HERE
WHERE TO NEXT? The plan for the Global Internet Phenomena Report is to regain
a regular cadence with two main reports each year, and several
spotlight reports when the data speaks to us.
We have plans for a mobile and a fixed network report later this
year or early next year to break out the differences between the two
network types. We believed it was important to start with a global
view of network traffic, as consumers do not care what network they
are on anymore when they access data – unless the network fails to
deliver a good experience, and then they notice.
DO YOU HAVE REQUESTS FOR INSIGHTS?We love inbound requests for data from our customers, prospects,
industry analysts, and press. Many of the topics we cover in the
Phenomena Report cross boundaries from tech into entertainment,
and we welcome inquiries where we can help give clarity to the
market. If you have questions, please reach out to Sandvine at
We will also blog regularly; if you missed some of our recent ones,
check out the Phenomena Spotlights:
https://www.sandvine.com/blog
SANDVINE’S API GATEWAYWant to make sure Sandvine has your application covered in our report? We have an API that you can use to keep us up-to-date:https://www.sandvine.com/api-gateway
ACTIVE NETWORK INTELLIGENCEVisit www.sandvine.com to learn about our Active Network Intelligence solutions.
ACTIONABLE DATAHow can the Global Internet Phenomena data become actionable in your network? Check out our Use Case eBook to find out!https://www.sandvine.com/use-case-ebook
RESOURCESCome see our Resources page for a wide range of videos, webinars, and whitepapers:www.sandvine.com/resources
Resources: Infographics and Other LinksThe Global Internet
Phenomena ReportSeptember 2019
23Copyright © 2019 Sandvine. All rights reserved. All other trademarks are property of their respective owners.