Embed Size (px)
Citation preview

Chapter 1 1
Since the release of the Global Innovation Index (GII) 2018, global economic growth has weakened and new risks have emerged. The global innovation landscape, in turn, has further evolved.
This scene-setting chapter of the GII 2019 takes a look at the pulse of innovation around the world, before revealing the innovation performance of economies. Chapter 1 is complemented by two additional sections this year. First, we present the Theme Section: Creating Healthy Lives— The Future of Medical Innovation main findings and take a look at the role of innovation for health, which is covered by world experts in the chapters that follow. Second, we present the new ranking of the world’s largest science and technology clusters in the Special Section: Identifying and Ranking the World’s Largest Science and Technology Clusters (Cluster Rankings).
CHAPTER 1
THE GLOBAL INNOVATION INDEX 2019Soumitra Dutta, Rafael Escalona Reynoso, and Antanina Garanasvili, SC Johnson College of Business, Cornell UniversityBruno Lanvin, INSEADSacha Wunsch-Vincent, Lorena Rivera León, Cashelle Hardman, and Francesca Guadagno1, World Intellectual Property Organization (WIPO)
Key findings in brief
1. Amid economic slowdown, innovation is blossoming around the world; but new obstacles pose risks to global innovation.
2. Shifts in the global innovation landscape are materializing; some middle-income economies are on the rise.
3. Innovation inputs and outputs are still concentrated in very few economies; a global innovation divide persists.
4. Some economies get more return on their innovation investments than others.
5. Shifting focus from innovation quantity to innovation quality remains a priority.
6. Most top science and technology clusters are in the U.S., China, and Germany; Brazil, India, Iran, the Russian Federation, and Turkey also make the top 100 list.
7. Creating healthy lives through medical innovation requires more investment in innovation and increased diffusion efforts.

The Global Innovation Index 20192
As a result, encouragingly, many developing economies— including low-income economies—increasingly monitor their innovation performance closely and work on improving it.
In that same vein, there is a better understanding that innovation is taking place in all realms of the economy, including sectors originally—and possibly erroneously—classified as low-tech. As previous editions of the GII have shown, countries are well-advised to see the potential for innovation in all economic sectors, including agriculture, food, energy, and tourism, be they classified as high- or low-tech.10 This entails breaking the myth that innovation is solely concerned with heavily science-driven and high-tech outputs.
The move towards conceptualizing innovation as something beyond high-tech R&D—to also be a concept that is applicable to local industries and that solves local problems through incremental innovation—is well on its way. Policymakers nowadays take an active interest in promoting local, frugal, and inclusive innovation drawing on local riches, crafts, and skill sets.
Consequently, a number of important trends are visible in modern-day innovation policy.
First, innovation policy is invoked not only in relation to economic objectives related to growth and technological change, but also to cope with modern societal challenges, such as food security, environment, energy transitions, and health, as evidenced in the current and past editions of the GII.11
On the organizational front, innovation policies have moved out of the reserve of one ministry or policy agency only—usually the Science Ministry—into cross-ministerial task forces or various ministries, often with the attention of high-level policymakers, such as the Prime Minister’s office.
Hearteningly, the center of attention is gravitating from fostering science and R&D expenditures alone to striving for the creation and upkeep of sound and dynamic innovation ecosystems. Economies at all development levels now ask questions on how to instill the curiosity of science and entrepreneurship in children and students, how to make public research more relevant to business, how to promote inward technology transfer and foster business innovation expenditures, or how to make intellectual property work for local innovation. The focus of innovation policies has also shifted to increasingly emphasize the adoption of innovation, necessitating investment in enabling conditions, such as infrastructure for research and technology transfer, education and skills, entrepreneurs, and venture capital markets.
Finally, data-based evidence and innovation metrics are increasingly at the center of crafting, deploying, and evaluating innovation policies. The availability and use of innovation metrics has advanced over the last years (Box 3).
These are big steps forward. The determination to anchor policy objectives in innovation across all economies is now strong and growing—not only on paper but also as evidenced by actions on the ground.
Taking the pulse of innovation expenditures and policies around the world Previous editions of the GII have underscored the paramount importance of laying the foundation for innovation-driven growth.2
Current economic figures show a level of uncertainty that contrasts with the optimism observed in the GII 2018 edition. Global economic growth appears to be losing momentum, relative to last year and earlier predictions.3 Investment and productivity growth around the world—of which innovation is a significant engine—are still sluggish by historical standards and certainly compared to the years before the last financial crisis in 2009.4 Global foreign direct investment (FDI) fell last year.5 Despite a short-lived revival in 2017, labor productivity growth is at a record low after a decade of slowdown.6 Yet, an increase in productivity will be one of the most effective ways to prevent global growth from slowing down prematurely.
From an innovation perspective, two possible bottlenecks exist: a decline in the level and speed of innovation—possibly due to sub-par investments in research and development (R&D)—and uneven adoption of innovation across the economy and the world at large.7 While breakthrough innovation related to digital technologies, automation, data processing, and artificial intelligence (AI) are proliferating, some fear that their impact on medium-term productivity growth is likely to be modest.8 Moreover, businesses do not seem to engage in innovative processes, products, and solutions evenly, leading to slow productivity growth.9 Knowledge gaps at the global level are still prominent and possibly growing.
In all likelihood, a combination of both factors is likely the culprit—noting that current economic and geopolitical uncertainties are a possible deterrent to forward-looking innovation investment and adoption. New barriers to international innovation networks, trade, and workforce mobility are likely to negatively impact the formation of more proficient global innovation networks.
As we are at a critical juncture in our search for new sources of innovation-driven growth, it helps to take the pulse of innovation around the world on these matters.
True progress in fostering innovation on the ground Regardless of the economic and geopolitical uncertainties over the last few years, formal and informal innovation seem to be blossoming globally. The news is positive as regards the political determination across the globe to foster innovation and related policies on the ground.
A few years ago, innovation and innovation policies were still the reserve of high-income economies. Today, developed and developing economies—including those with an abundance of natural resources—have placed innovation firmly on their agenda to boost economic and social development. To some extent, the North-South divide of how economies perceive innovation has improved.

Chapter 1 3
Innovation remains concentrated in a few economies, while some others show potential to catch upInnovation is thus finally part of policy ambitions around the world. This good news aside, across countries and economies, divides still exist as to the absolute scale of innovation inputs and outputs.
Change on this front is sparse and slow. Innovation investments and outputs, as we measure them today, continue to be concentrated in a handful of economies—and in specific regional innovation clusters within countries (Special Section: Cluster Rankings).
“Leapfrogging”, the way in which latecomers can catch up with forerunners and become important players worldwide, is not an easy feat. Moving from a successful middle-income economy with innovation potential to an innovation powerhouse remains hard; an impermeable innovation glass ceiling exists between middle- and high-income economies.
But, what do top performers in the GII have in common? For years, we have noted a positive correlation between an economy’s level of development (measured by GDP per capita) and innovation performance. In other words, wealthier economies perform better on innovation. However, we have also found that:12
1. There is a positive and statistically significant relation between economy size and innovation performance that indicates that scale, and thus a large market that is able to sustain innovation activities and the demand for innovation, continues to matter.
2. Economies with a diversified export basket that extends beyond a few commodities are more innovative.
This year, as in the past eleven years of publication, the global innovation divide between income groups and regions persists (Box 2). Historically, only a few countries have managed to join the fray of top innovation nations—notably Japan and the Republic of Korea in the 1980s and 1990s.13 Northern America, and Europe continue to lead in the top 10 global innovation rankings, while Singapore continues to lead in Asia. In general, Asia has made formidable progress over the last decades. Recently, only China—an upper middle-income economy and an exception among the otherwise stable group of high-income economies—had entered the top 20 in the GII. Progress remains slower in other regions, such as Africa, and Latin America and the Caribbean.
Even within the most innovative nations, innovation activities are often concentrated in a few cities, regions, or clusters driven by agglomeration effects, as discussed in the Special Section presenting the Cluster Rankings in this edition.14
Shifting global R&D and the innovation landscapeThe global innovation landscape is changing; innovation expenditures and innovation efforts, including the number of researchers and entrepreneurs who actively drive innovation efforts, have been scaled up massively. Yet innovation remains relatively “spiky”, concentrated in a few countries and regions only. This is reflected in other key innovation indicators, such as R&D, researchers, and intellectual property (IP).
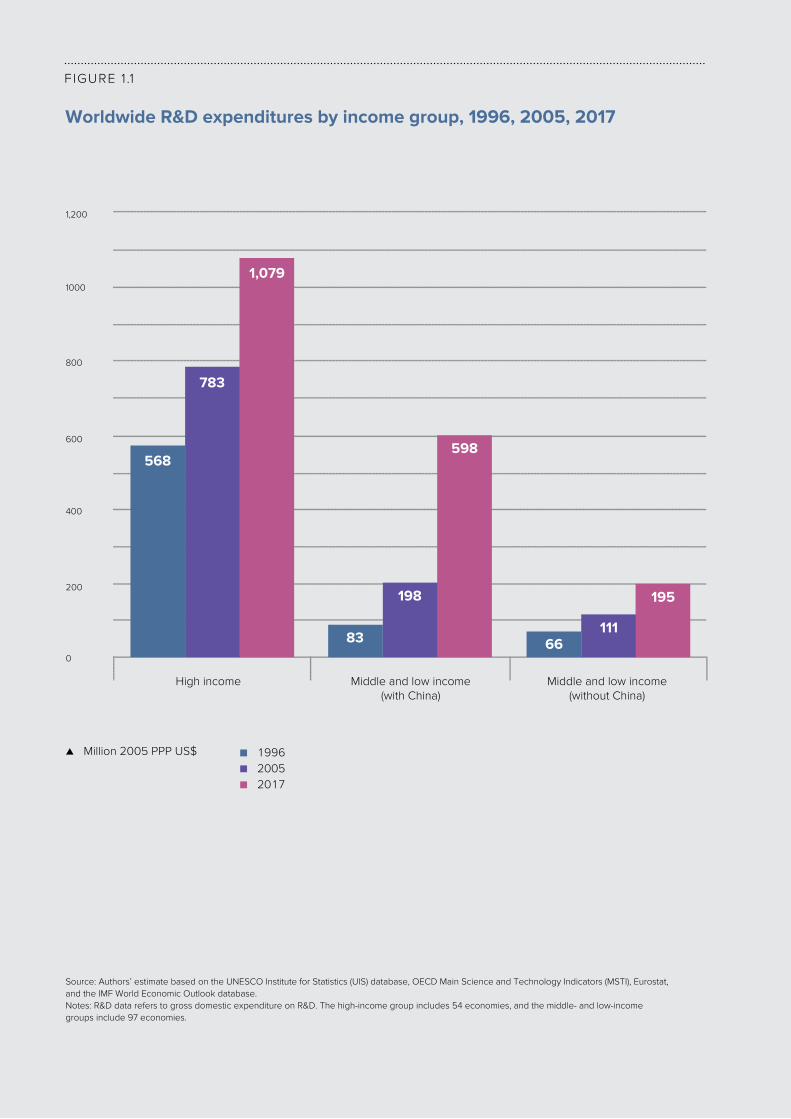
From a historic perspective, the global landscape of science and technology investment, and investments in education and human capital, have undergone important shifts over the last three decades. Global R&D expenditures have continued to rise, more than doubling between 1996 and 2017.
Today, it is not only high-income economies carrying out R&D in earnest. While in 1996 high-income economies accounted for 87% of global R&D, in 2017, they only represented 64% of total investments—the lowest share registered in the last 30 years. In contrast, the share of R&D investments from upper middle-income economies, notably China, has consistently increased, from only 10% of global R&D expenditures in 1996 to 31% in 2017 (Figure 1.1). Middle-income economies represented 35% of total R&D expenditures in 2017. Asian R&D powerhouses, such as China, Japan, the Republic of Korea, and India, contributed to as much as 40% of the world’s R&D in 2017, up from 22% in 1996. Of this 40%, China was responsible for 24% of the world’s R&D expenditures in 2017, up from only 2.6% in 1996.
The world share of other emerging economies, such as India, have also substantially increased—from 1.8% in 1996 to 2.9% in 2017. In contrast, the regional R&D shares of Europe, and Latin America and the Caribbean have fallen with the rise of Asian economies. Sub-Saharan Africa continues to have low levels of R&D investments compared to what other world regions spend.
Private sector R&D funding also remains concentrated but it is evolving too. Only eight countries—the United States of America (U.S.), China, Japan, the Republic of Korea, Germany, France, the United Kingdom (U.K.), and India accounted for 82% of private sector R&D investments in 2017. Private sector R&D investments from China represented 27% of the world’s total in 2017, almost on par with U.S. firms, and up from a negligible 2% in 1996 (Figure 1.2).
Middle-income economies and the South East Asia, East Asia, and Oceania region also played a central role when looking at the top 2,500 private sector companies who invested the largest sums in R&D in the world in the financial year 2017/18. In 2017, 591 companies from middle-income economies made the list of the top 2,500 private spenders.15 Companies located in Argentina, Brazil, China, India, Iraq, Malaysia, Mexico, South Africa, Thailand, Turkey and Venezuela made it into the top ranks.
The Global Innovation Index 20194
FIGURE 1 .1
Worldwide R&D expenditures by income group, 1996, 2005, 2017
1000
800
600
400
200
0
1,200
Source: Authors’ estimate based on the UNESCO Institute for Statistics (UIS) database, OECD Main Science and Technology Indicators (MSTI), Eurostat, and the IMF World Economic Outlook database.Notes: R&D data refers to gross domestic expenditure on R&D. The high-income group includes 54 economies, and the middle- and low-income groups include 97 economies.
High income Middle and low income(with China)
Middle and low income(without China)
▲ Million 2005 PPP US$ ■ 1996■ 2005■ 2017
568
783
1,079
83
198
598
66111
195

Chapter 1 5
FIGURE 1.2
Regional and economy shares in world business expenditures, 2017
Source: Authors’ estimate based on the UNESCO Institute for Statistics (UIS) database, OECD Main Science and Technology Indicators (MSTI), Eurostat, and the IMF World Economic Outlook database.Note: In PPP US$ in constant prices, 2015.
United States of America
Canada
● South East Asia, East Asia, and Oceania● Northern Africa and Western Asia● Latin America and the Caribbean
● Central and Southern Asia● Sub-Saharan Africa
● Northern America● Europe
Switzerland
Sweden
SpainRussian
FederationOther
Poland
Norway
Italy
Netherlands
Ireland
Germany
France
Finland
Denmark
Austria
Belgium
China
Australia
Hong Kong, China
Indonesia
Japan
Malaysia Other
Philippines
Republic of Korea
Singapore
Thailand
IsraelEgypt
Other
SaudiArabia Turkey
United Arab Emirates
South Africa
Other
Mexico
Colombia
Chile
Argentina
Brazil
Other
India
BangladeshIran
Other
Pakistan

The Global Innovation Index 20196
Are global R&D expenditures at risk to falter again, in line with slower GDP growth? Global government expenditures in R&D (GERD) fell on three occasions: in 2002, after a marked slowdown of the world economy; in 2009, with the aftermath of the global financial crisis; and most recently, in 2016, because of tighter government budgets in certain high-income economies and slower spending growth in key emerging economies. On these three occasions, public and private R&D followed the downward trajectory of global GDP growth. As global economic growth is declining in 2019, the question is whether R&D expenditures will remain resilient in light of the economic cycle this time around.
Another question is how to spread innovation expenditures more equally. R&D intensity, defined as global R&D expenditures divided by global GDP, has been relatively stable, increasing from 1.4% in 1996 to 1.7% since 2013. Most of the growth in R&D intensity has been registered among upper middle-income economies, with intensities passing from 0.6% in 1996 to 1.5% in 2017. Growth in R&D intensity is concentrated in a few countries, notably China, which increased from 0.6% in 1996 to 2.1% in 2017, and Malaysia, which increased from 0.2% to 1.3% in the same period. In contrast, R&D intensity has only improved marginally among middle-income economies, excluding China, from 0.5% in 1996 to 0.6% in 2017, and in low-income economies from 0.2% to 0.4%.
One additional worry is the waning public support for R&D, also relative to the strong expenditure increases in the post-crisis years (Box 1 in GII 2017 and 2018). R&D funding allocated by governments in the Organisation for Economic Co-operation and Development (OECD) countries show an increase of 0.9% in real terms in 2017, which is considerably lower than the 3.3% growth in 2016. R&D budgets decreased in the U.S. in 2017 relative to 2016. Moreover, even if public R&D in China grew by 7.9% in 2017, this is the lowest reported growth since 1997. In sum, most R&D budgets of governments in high-investing R&D countries remain below their pre-crisis levels. While companies become increasingly more important in driving global R&D expenditure growth—sometimes more important than countries (Box 1)—public R&D funding remains central to creating future breakthrough technologies. Public expenditures focus more on blue sky and basic research, which is critical to progress in the next decades, while private sector R&D is closer to product development. The importance of public and basic R&D—and current budgetary cuts to R&D programs—are further discussed in the Theme Section.
The number of researchers is also growing, again largely driven by China and emerging Asian innovation economies. In the period from 2008 to 2016, the number of researchers per million inhabitants grew by 19% worldwide. The largest contributors to this increase were middle-income economies, whose number of researchers increased by 34% in the same period.16
The same trends are true for intellectual property. Worldwide demand for IP reached record highs in 2017 and 2018, including for patents, trademarks, industrial designs, and other IP rights that are at the heart of the global innovation economy.17 While in 1997, 88% of all patent applications originated from high-income economies, in 2017—largely driven by China—the origin of patent applications was almost equally distributed between high-income and upper middle-income economies. While in 1997 China accounted for 2% of all patent applications, in 2017 it represented 44% of the total.
Uncertainty around R&D and innovation in the years to come So, what can we expect in terms of innovation efforts and R&D in the years to come? How will modest medium-term growth and world R&D intensities affect innovation in the future?
Last year, we warned of the challenge of keeping the global economy at sustained levels of economic growth in the years to come. We also warned that year-on-year growth of corporate and public R&D spending was still lower in 2016 than it was before the financial crisis.18
The good news this year is that global R&D expenditures have been growing faster than the global economy in real terms. Despite economic uncertainty and mirroring the determination of economies to stay true to their innovation agendas, innovation expenditures have been growing and are surprisingly resilient, suggesting a possible decoupling from economic cycles.
R&D grew in 2017 by 5.2%, the highest growth registered since 2011. These levels are more in line with the pre-crisis period (Figure 1.3). Projections show that this positive trend could continue: the 2018 Global R&D Outlook forecasts global R&D budgets to increase over the next five years.19 By the same token, private sector funding has also been growing at a faster rate than the world economy and total R&D (Figure 1.3). 20 The world’s business expenditures in R&D (BERD) grew by 6.7% in 2017, the largest increase registered since 2011 (Figure 1.2 and Figure 1.3). Private sector R&D also increased by 8.3% in the financial year 2017/18 relative to 2016/17.21

Chapter 1 7
FIGURE 1.3
R&D expenditure growth, 2000-2017
2000 2002
1
2
0
-1
4
5
7
6
8
9
3
Source: Authors’ estimate based on the UNESCO Institute for Statistics (UIS) database, OECD Main Science and Technology Indicators (MSTI), Eurostat, and the IMF World Economic Outlook database.
▲ % ⊲ Year
2004 2006 2008 2010 2012 2014 2016 2018 2019
GDP growth forecast
Business R&D growth
Total R&D growth
GDP growth

The Global Innovation Index 20198
BOX 1, FIGURE 1
Public and private R&D expenditures, 2017 (or latest available year)
1000 200 300 400 500 600
United States of America
China
Japan
Germany
Republic of Korea
France
India
United Kingdom
Brazil
Russian Federation
Italy
Canada
Australia
Spain
Netherlands
Switzerland
Turkey
Samsung (Republic of Korea)
Alphabet (United States of America)
Sweden
Volkswagen (Germany)
Microsoft (United States of America)
Israel
Austria
Huawei (China)
⊲ Billion US$ ■ Economy ■ Company
Source: Authors’ estimates, based on data from UNESCO Institute for Statistics (UIS); and EU Industrial R&D investment Scoreboard 2018.
511
452
166
119
78
62
50
48
41
37
30
26
21
20
18
18
17
16
16
16
16
16
15
14
14
Today, the R&D expenditure levels of a number of private sector companies are as high as government expenditures in R&D of a number of economies (Box 1, Figure 1). Companies such as Samsung (Republic of Korea), Alphabet (U.S.), Volkswagen
BOX 1
Private sector R&D investments on par with countries
(Germany), Microsoft (U.S.) and Huawei (China) are investing more, or almost the same, in R&D as governments located in the top-ranked countries in the GII 2019, including Sweden, Israel, Austria, and Switzerland.

Chapter 1 9
Each pillar is divided into three sub-pillars and each sub-pillar is composed of individual indicators, a total of 80 this year.26
The development of fitting and accurate innovation indicators is an ongoing priority for the GII (Box 3).
Results
The main GII 2019 findings are discussed in the following sections. The Rankings Section presents the GII results in tabular form for all economies covered this year, for the GII and for the Innovation Input and Output Sub-Indices.
Movement at the top: Switzerland, Sweden, and the United States of America leadThere are important changes to the top 10 in the GII 2019.
Switzerland leads the rankings for the ninth consecutive year, while Sweden returns to the 2nd position, as held already six times in the past. The U.S. moves up to 3rd. The Netherlands ranks 4th with the U.K. moving into 5th position. Finland and Denmark follow, each gaining one position from 2018, taking 6th and 7th place respectively. Singapore ranks 8th this year and, for the third consecutive year, Germany holds the 9th spot. Israel enters the top 10 for the first time, moving up one spot from 2018, marking the first occasion an economy from the Northern Africa and Western Asia region has featured in the top 10 rankings. Ireland leaves the top 10 and ranks 12th this year.
Figure 1.5 shows movement in the top 10 ranked economies over the last four years:
1. Switzerland2. Sweden3. The United States of America4. The Netherlands5. The United Kingdom6. Finland7. Denmark8. Singapore9. Germany10. Israel
In the top 20, a notable move is the Republic of Korea, which edges closer to the top 10. Most notably, China continues its upward rise, moving to 14th (up from the 17th rank in 2018), and firmly establishes itself as one of the innovation leaders.
In the top 25, Hong Kong (China) (13th), Canada (17th), Iceland (20th), and Belgium (23rd) all move up, gaining between one and three spots each. Ireland (12th), Japan (15th), Luxembourg (18th), Australia (22nd), and New Zealand (25th) move down, while France (16th), Norway (19th), Austria (21st), and Estonia (24th) remain stable.
In an environment dominated by uncertainty, the role of policymakers remains central in ensuring that this does not weaken R&D investments.22
While innovation remains concentrated in a few economies— although only a few have broken out as innovation leaders— the GII emphasizes the existence of success stories and that these economies need to be encouraged. It will take time and persistence, sometimes over decades, for the above-mentioned innovation policy ambitions to trickle down and make a true dent in the global innovation landscape. History has shown, however, that when developing economies consistently invest in innovation, they can embark on a journey that leads to prosperity. This includes all regions, in particular, certain African economies, such as Kenya or Rwanda, that have made a real difference in the global innovation landscape.
Over the years, the GII has shown that international openness and knowledge flows are critical to the development of success-ful innovation nations and international innovation networks. Economies at all levels of development are more innovative when they have a diversified export basket. The rise of global value chains and of global innovation networks has proven an essential building block of today’s innovation landscape (see also the forthcoming WIPO World IP report).23
Finally, policymakers need to ensure that new barriers to international innovation networks, trade, and workforce mobility do not throttle the positive innovation dynamics at work. If left uncontained, these new obstacles to international trade, investment, and workplace mobility will lead to a slowdown of growth in innovation productivity and diffusion across the globe.
The Global Innovation Index 2019 resultsConceptual framework
The GII helps create an environment in which innovation factors are continually evaluated. This year, it provides detailed innovation metrics for 129 economies. All economies covered represent 91.8% of the world’s population and 96.8% of the world’s GDP.24
Three indices are calculated: the overall GII, the Innovation Input Sub-Index and the Innovation Output Sub-Index (Appendix I).25
• The overall GII score is the average of the Input and Output Sub-Index scores.
• The Innovation Input Sub-Index is comprised of five pillars that capture elements of the national economy that enable innovative activities: (1) Institutions, (2) Human capital and research, (3) Infrastructure, (4) Market sophistication, and (5) Business sophistication.
• The Innovation Output Sub-Index provides information about outputs that are the result of innovative activities within economies. There are two output pillars: (6) Knowledge and technology outputs and (7) Creative outputs.

The Global Innovation Index 201910
FIGURE 1.4
Global leaders in innovation in 2019
Source: Global Innovation Index Database; Cornell, INSEAD, and WIPO. 2019.Notes: World Bank Income Group Classification (July 2018); Year-on-year GII rank changes are influenced by performance and methodological considerations; some economy data are incomplete (Appendix IV).
Every year, the Global Innovation Index ranks the innovation performance of nearly 130 economies around the world.
Top 3 innovation economies by income group
Top 3 innovation economies by region
NORTHERN AMERICA EUROPE NORTHERN AFRICA AND WESTERN ASIA
SOUTH EAST ASIA, EAST ASIA, AND OCEANIA
1. U.S.
2. Canada
1. Switzerland
2. Sweden ↑
3. Netherlands ↓
1. Israel
2. Cyprus
3. United Arab Emirates
1. Singapore
2. Republic of Korea
3. Hong Kong, China ★
2
75
64
UPPER-MIDDLE INCOME LOWER-MIDDLE INCOME LOW INCOME
1. China
2. Malaysia
3. Bulgaria
HIGH INCOME
1. Switzerland
2. Sweden ↑
3. U.S. ★
1. Viet Nam ↑
2. Ukraine ↓
3. Georgia ★
1. Rwanda ↑
2. Senegal ↑
3. Tanzania ↓
3
LATIN AMERICA AND THE CARIBBEAN
SUB-SAHARAN AFRICA CENTRAL AND SOUTHERN ASIA
1. Chile
2. Costa Rica
3. Mexico
1. South Africa
2. Kenya ↑
3. Mauritius ↓
1. India
2. Iran
3. Kazakhstan
1
↑↓ indicates the movement of rank within the top 3 relative to 2018, and ★ indicates a new entrant into the top 3 in 2019.

Chapter 1 11
FIGURE 1.4
Global leaders in innovation in 2019
Source: Global Innovation Index Database; Cornell, INSEAD, and WIPO. 2019.Notes: World Bank Income Group Classification (July 2018); Year-on-year GII rank changes are influenced by performance and methodological considerations; some economy data are incomplete (Appendix IV).
Every year, the Global Innovation Index ranks the innovation performance of nearly 130 economies around the world.
Top 3 innovation economies by income group
Top 3 innovation economies by region
NORTHERN AMERICA EUROPE NORTHERN AFRICA AND WESTERN ASIA
SOUTH EAST ASIA, EAST ASIA, AND OCEANIA
1. U.S.
2. Canada
1. Switzerland
2. Sweden ↑
3. Netherlands ↓
1. Israel
2. Cyprus
3. United Arab Emirates
1. Singapore
2. Republic of Korea
3. Hong Kong, China ★
2
75
64
UPPER-MIDDLE INCOME LOWER-MIDDLE INCOME LOW INCOME
1. China
2. Malaysia
3. Bulgaria
HIGH INCOME
1. Switzerland
2. Sweden ↑
3. U.S. ★
1. Viet Nam ↑
2. Ukraine ↓
3. Georgia ★
1. Rwanda ↑
2. Senegal ↑
3. Tanzania ↓
3
LATIN AMERICA AND THE CARIBBEAN
SUB-SAHARAN AFRICA CENTRAL AND SOUTHERN ASIA
1. Chile
2. Costa Rica
3. Mexico
1. South Africa
2. Kenya ↑
3. Mauritius ↓
1. India
2. Iran
3. Kazakhstan
1
↑↓ indicates the movement of rank within the top 3 relative to 2018, and ★ indicates a new entrant into the top 3 in 2019.
FIGURE 1.5
Movement in the GII, top 10, 2019
2019 CH SE US NL GB FI DK SG DE IL
2018 CH NL SE GB SG US FI DK DE IEIE
2017 CH SE NL US GB DK SG FI DE IE
2016 CH SE GB US FI SG IE DK NL DE
2015 CH GB SE NL US FI SG IE LU DK
Source: Global Innovation Index Database, Cornell, INSEAD, and WIPO, 2019.Note: Year-on-year comparisons of the GII ranks are influenced by changes in the GII model and data availability.
CH SwitzerlandGB United KingdomSE Sweden
Israel enters the top 10
for the first time in 2019.
In 2018, Singapore makes it to the top 5 of the GII.
The Netherlands entered the top 3 in 2017. Sweden
maintained 2nd place for the
second time.
Germany re-entered the top 10 in 2016.
Since 2011, Switzerland has ranked 1st in the GII every year.
NL NetherlandsUS United States of AmericaFI Finland
SG SingaporeIE IrelandLU Luxembourg
DK DenmarkDE GermanyIL Israel
1 2 3 4 5 6 7 8 9 10

The Global Innovation Index 201912
Despite fast movers in terms of innovation “catch-up”, the global innovation divide between income groups and regions remains (Box 2). The catching-up of economies from relatively emergent and fragmented innovation systems to more mature and functional ones is an arduous process.27
Notable changes in GII rankings this year include Viet Nam and Thailand, who each edged closer to the top 40. India moved closer to the top 50, the Philippines broke into the top 55, and the Islamic Republic of Iran stepped closer to the top 60 based on better innovation performance. The United Arab Emirates, 36th, is moving closer to the top 35 of the GII.
As always, it must be noted that year-on-year comparisons of the GII ranks are influenced by various factors, such as changes in the underlying indicators at source and changes in data availability (Appendix IV).
BOX 2
The global innovation divide
China breaks into the top 15 GII economies; otherwise, the gap across income groups and regions largely persists.
1. High-income economies and China in the top 15
The top-performing economies in the GII are almost exclusively from the high-income group. China is the only exception, ranking 14th this year and the only middle-income economy in the top 30. China edged into the top 25 in 2016 and moved to 17th in 2018.
Box 2, Figure 1 shows the average scores for six groups: (1) the top 10, composed of only high-income economies; (2) the top 11-25, also all high-income economies, with the exception of China; (3) other high-income economies; (4) other upper middle-income economies; (5) lower middle-income economies; and (6) low-income economies.
2. China, Malaysia, and Bulgaria continue to lead the middle-income group
Aside from China, Malaysia (35th) and Bulgaria (40th) remain the only other middle-income economies that are close to the top 25. The divide between economies in ranks 11 to 25 and the group of upper middle-income economies remains wide.
Thailand (43rd), Montenegro (45th), and the Russian Federation (46th) are among the upper middle-income economies that are performing above high-income economies in selected GII pillars. Other middle-income economies in the top 50 are: Turkey (49th) and Romania (50th), in the upper middle-income group; and Viet Nam (42nd), Ukraine (47th), and Georgia (48th), in the lower middle-income group. In the latter, Viet Nam continues to show a consistent improvement in its scores in Human capital and research, Market sophistication, and Knowledge and technology outputs.
This year, India (52nd) edges closer to the top 50, performing above the lower middle-income group average in all pillars. India performs higher on Human capital and research, Market and Business sophistication, and Knowledge and technology outputs when compared to the upper middle-income group average. Finally, India scores above the high-income group in Market sophistication.
Generally speaking, however, the innovation systems of most low- and middle-income economies have a set of common characteristics: low education levels, low levels of science and technology investments, reduced exposure to foreign technologies, limited inward knowledge flows, weaker science and industry linkages, challenging business environments with inadequate access to financial resources and underdeveloped venture capital markets, low absorptive and innovative capacity within domestic firms, and limited use of intellectual property. Informality is also widespread, making innovation more difficult to measure and study.28
3. Regional divideThe innovation ranking of geographic regions has been stable since 2014. However, the South East Asia, East Asia, and Oceania region has been edging closer to Northern America and Europe over time. Northern America maintains its position as the top-performing region showing top average scores in all innovation pillars. Europe comes in 2nd, followed by South East Asia, East Asia, and Oceania, 3rd, and Northern Africa and Western Asia, 4th. Latin America and the Caribbean remain in 5th, with Central and Southern Asia, and Sub-Saharan Africa following in at 6th and 7th, respectively.
Scores this year show that Northern America, driven mainly by U.S. prowess, has the largest average score increase. Central and Southern Asia follow, driven by India and the Islamic Republic of Iran.

Chapter 1 13
1 Top 10 high income2 11 to 25 high and upper-middle income
3 Other high income 4 Other upper-middle income
5 Lower-middle income6 Low income
Source: Global Innovation Index Database, Cornell, INSEAD, and WIPO, 2019.
1 89.12 85.23 70.94 61.35 53.86 50.5
1 59.92 51.53 37.34 29.05 21.56 15.2
123456
123456
1 63.42 61.93 53.34 44.25 37.46 29.2
1 66.92 61.53 49.34 47.55 45.96 36.5
1 65.62 51.83 35.64 29.85 26.46 24.3
KNOWLEDGE ANDTECHNOLOGY OUTPUTS
CREATIVE OUTPUTS
INSTITUTIONS HUMAN CAPITAL AND RESEARCH
INFRASTRUCTURE MARKET SOPHISTICATION
BUSINESS SOPHISTICATION
BOX 2, FIGURE 1
Innovation divide across income groups, 2019
57.241.525.919.920.212.8
49.045.432.625.722.715.1

The Global Innovation Index 201914
BOX 3
The importance of timely and apt innovation indicators
The provision of GII economy profiles and briefs—indicating missing and outdated data sources—actively helps policy or statistical officials to monitor their state of innovation metrics and collection efforts more closely. At times, cross-ministerial task forces address data requirements and are involved in the design of innovation policy responses. This interest has helped move innovation metrics to the center of policymaking, including in lower middle- and low-income economies. Accordingly, in the past years, indicator coverage has grown, with some 32 GII economies improving their data coverage by between 5 and 12 indicators.29 Regionally speaking, progress has been widely visible in African economies (Appendix IV).
That said, the GII is only good as its data ingredients—see the Preface. The availability of data to assess innovation outputs and impacts remains medium to weak. Likewise, convincing metrics on key components of national innovation systems—be they from official statistical bodies or the private sector, such as entrepreneurship, venture capital, innovation linkages, or commercialization efforts—are lacking.
The GII appreciates the initiatives of economies seeking to improve the measurement of innovation performance through better data collection and design, and the reports and events of organizations such as the U.S. National Science Foundation’s
Science and Engineering Indicators Report, the African Innovation Outlook, and the OECD Blue Sky Forum on Science and Innovation Indicators.30
Developing economies, for example, regularly suggest additional innovation measurements, particularly as their contexts may be different from high-income contexts, where innovation metrics were originally devised. These metrics include innovation in the informal sector, or measures to capture knowledge and technology diffusion and adaptation efforts.
High-income economies, too, are not content with the state of play. The Australian Innovation Metrics Review, for example, was recently established to identify better innovation metrics.31
The future offers promising venues to also improve the way innovation data are collected. More bottom-up and big data approaches to gathering innovation metrics will become feasible, if certain shortcomings can be overcome (GII 2018, Annex 1, Box 1, developed with the U.K.’s Innovation Foundation Nesta). To improve the state of innovation metrics and the quality of relevant data, the GII will continue to act as a laboratory for novel innovation data.
The top performers by income group
Table 1.1 shows the 10 best-ranked economies by income group in the GII, and the top-ranked in the innovation input and output sub-indices. Switzerland, Sweden, the U.S., the U.K., and Finland are among the high-income top 10 in all indices.
A new entrant in the top 10 upper middle-income group is Mexico (56th). Among the lower middle-income group, Kenya (77th) rejoins the top 10 this year.32
Rwanda becomes the top low-income economy (94th) this year, gaining 5 positions since last year in the GII, and one position among the low-income group. Three economies enter the low-income group top 10: Tajikistan (100th), Ethiopia (111th) and Burkina Faso (117th).33
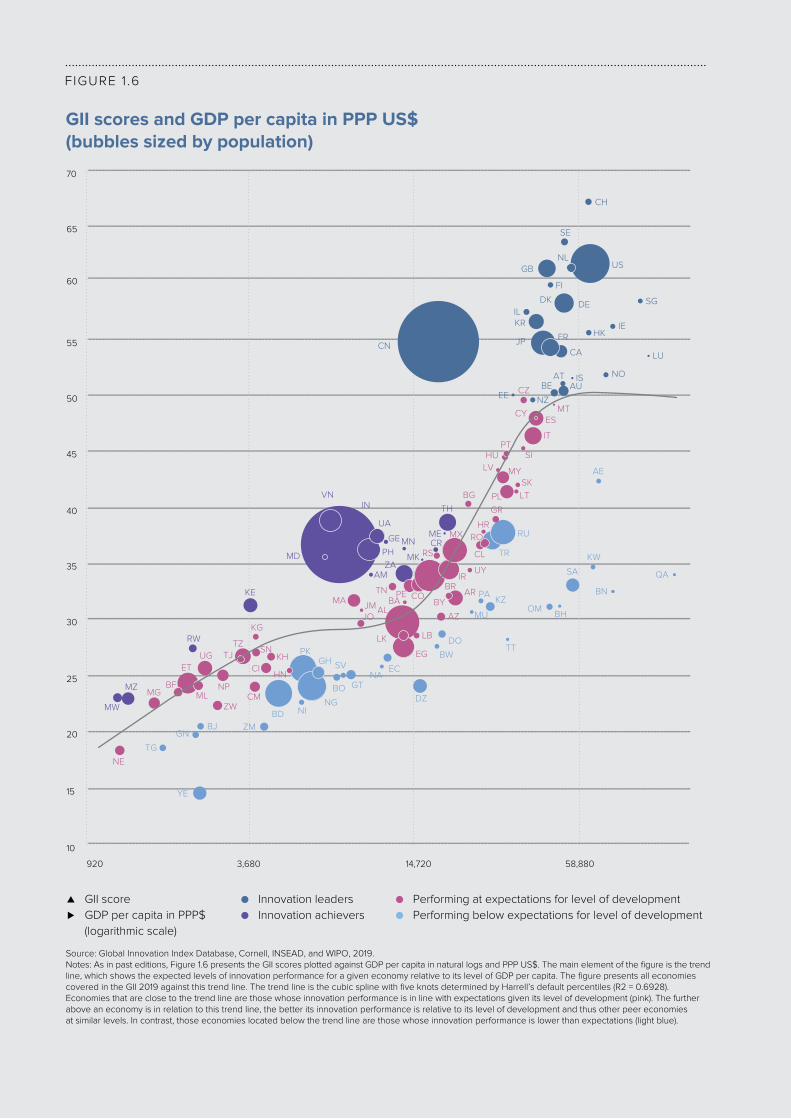
Which economies are outperforming on innovation relative to their peers?The GII also identifies the innovation performance of economies relative to their peers with a similar level of development, as measured by GDP per capita (Figure 1.6). Most economies perform as expected on innovation based on their level of development. Yet, some economies break from this pattern to strongly outperform or underperform, relative to expectations.
All economies that are innovation leaders (dark blue) this year were also in the top 25 in 2018. As observed in previous years, all of them—with the exception of China—are high-income economies.

Chapter 1 15
High-income economies (50 in total)
1 Switzerland (1) Singapore (1) Switzerland (1)2 Sweden (2) Switzerland (2) Netherlands (2)
3 United States of America (3) United States of America (3) Sweden (3)4 Netherlands (4) Sweden (4) United Kingdom (4)5 United Kingdom (5) Denmark (5) United States of America (6)6 Finland (6) United Kingdom (6) Finland (7)7 Denmark (7) Finland (7) Israel (8)
8 Singapore (8) Hong Kong, China (8) Germany (9)
9 Germany (9) Canada (9) Ireland (10)
10 Israel (10) Republic of Korea (10) Luxembourg (11)
TABLE 1 .1
10 best-ranked economies by income group (rank)
Note: Economies with top 10 positions in the GII, the Input Sub-Index, and the Output Sub-Index within their income group are highlighted.
Global Innovation Index Innovation Input Sub-index Innovation Output Sub-indexRank
Upper middle-income economies (34 in total) 1 China (14) China (26) China (5)2 Malaysia (35) Malaysia (34) Bulgaria (38)3 Bulgaria (40) Russian Federation (41) Malaysia (39)4 Thailand (43) Bulgaria (45) Thailand (43)5 Montenegro (45) Thailand (47) Montenegro (46)
6 Russian Federation (46) Peru (48) Iran (Islamic Republic of) (47)
7 Turkey (49) Belarus (50) Costa Rica (48)
8 Romania (50) South Africa (51) Turkey (49)
9 Costa Rica (55) North Macedonia (52) Armenia (50)
10 Mexico (56) Romania (54) Romania (53)
Lower middle-income economies (26 in total)
1 Viet Nam (42) Georgia (44) Ukraine (36)2 Ukraine (47) India (61) Viet Nam (37)3 Georgia (48) Viet Nam (63) Philippines (42)4 India (52) Mongolia (73) Mongolia (44)5 Mongolia (53) Tunisia (74) Republic of Moldova (45)6 Philippines (54) Philippines (76) India (51)7 Republic of Moldova (58) Kyrgyzstan (78) Georgia (60)8 Tunisia (70) Republic of Moldova (81) Kenya (64)
9 Morocco (74) Ukraine (82) Tunisia (65)10 Kenya (77) Morocco (83) Morocco (66)
Low-income economies (19 in total)
1 Rwanda (94) Rwanda (65) United Republic of Tanzania (73)2 Senegal (96) Nepal (93) Ethiopia (80)
3 United Republic of Tanzania (97) Uganda (96) Senegal (81)4 Tajikistan (100) Senegal (103) Tajikistan (83)5 Uganda (102) Tajikistan (107) Mali (100)
6 Nepal (109) Burkina Faso (111) Uganda (107)7 Ethiopia (111) Benin (114) Madagascar (109)
8 Mali (112) United Republic of Tanzania (115) Zimbabwe (110)
9 Burkina Faso (117) Mozambique (118) Malawi (112)10 Malawi (118) Malawi (119) Mozambique (114)
The Global Innovation Index 201916
FIGURE 1 .6
GII scores and GDP per capita in PPP US$(bubbles sized by population)
Source: Global Innovation Index Database, Cornell, INSEAD, and WIPO, 2019.Notes: As in past editions, Figure 1.6 presents the GII scores plotted against GDP per capita in natural logs and PPP US$. The main element of the figure is the trend line, which shows the expected levels of innovation performance for a given economy relative to its level of GDP per capita. The figure presents all economies covered in the GII 2019 against this trend line. The trend line is the cubic spline with five knots determined by Harrell’s default percentiles (R2 = 0.6928). Economies that are close to the trend line are those whose innovation performance is in line with expectations given its level of development (pink). The further above an economy is in relation to this trend line, the better its innovation performance is relative to its level of development and thus other peer economies at similar levels. In contrast, those economies located below the trend line are those whose innovation performance is lower than expectations (light blue).
▲ GII score ⊲ GDP per capita in PPP$ (logarithmic scale)
65
70
60
55
50
45
40
35
30
25
20
15
10
920 3,680 14,720 58,880
● Performing at expectations for level of development● Performing below expectations for level of development
● Innovation leaders● Innovation achievers
CH
US
SE
NLGB
FI
DEDK
KRIL
HKIE
AU
LU
SG
NOISATBE
EE NZ
CNCA
FRJP
MW
MZ
RW
KE
VNIN
MD
UA
PHZA
TH
CR
MK
ME
AM
GE MN
TG
YE
GNBJ ZM
BD NING
PKGH
BO
SV
GTNA
EC
DZ
BW
DO
MU
PAKZ
TT
TR
RU
BHOM
SA
KW
BN
QA
AE
NE
MGBF
ET
MLZW
UG
NPCM
TZTJ
KG
SNKH
CI
MA
JOJM AL
TNBA
EG
LK LB
COPEBR
RS
MX
IRUY
BYAR
AZ
BG
GR
HRRO
CL
MYSKLTPL
PTHU
LVSI
CZ
IT
ESMT
HN
CY

Chapter 1 17
AE United Arab Emirates (the)
AL Albania
AM Armenia
AR Argentina
AT Austria
AU Australia
AZ Azerbaijan
BA Bosnia and Herzegovina
BD Bangladesh
BE Belgium
BF Burkina Faso
BG Bulgaria
BH Bahrain
BI Burundi
BJ Benin
BN Brunei Darussalam
BO Bolivia (Plurinational State of)
BR Brazil
BW Botswana
BY Belarus
CA Canada
CH Switzerland
CI Côte d’Ivoire
CL Chile
CM Cameroon
CN China
CO Colombia
CR Costa Rica
CY Cyprus
CZ Czech Republic (the)
DE Germany
DK Denmark
DO Dominican Republic (the)
DZ Algeria
EC Ecuador
EE Estonia
EG Egypt
ES Spain
ET Ethiopia
FI Finland
FR France
GB United Kingdom (the)
GE Georgia
Code Country/Economy
ISO-2 codes
GH Ghana
GN Guinea
GR Greece
GT Guatemala
HK Hong Kong, China
HN Honduras
HR Croatia
HU Hungary
ID Indonesia
IE Ireland
IL Israel
IN India
IR Iran (Islamic Republic of)
IS Iceland
IT Italy
JM Jamaica
JO Jordan
JP Japan
KE Kenya
KG Kyrgyzstan
KH Cambodia
KR Republic of Korea (the)
KW Kuwait
KZ Kazakhstan
LB Lebanon
LK Sri Lanka
LT Lithuania
LU Luxembourg
LV Latvia
MA Morocco
MD Republic of Moldova (the)
ME Montenegro
MG Madagascar
MK North Macedonia
ML Mali
MN Mongolia
MT Malta
MU Mauritius
MW Malawi
MX Mexico
MY Malaysia
MZ Mozambique
NA Namibia
Code Country/Economy
NE Niger (the)
NG Nigeria
NI Nicaragua
NL Netherlands (the)
NO Norway
NP Nepal
NZ New Zealand
OM Oman
PA Panama
PE Peru
PH Philippines
PK Pakistan
PL Poland
PT Portugal
PY Paraguay
QA Qatar
RO Romania
RS Serbia
RU Russian Federation (the)
RW Rwanda
SA Saudi Arabia
SE Sweden
SG Singapore
SI Slovenia
SK Slovakia
SN Senegal
SV El Salvador
TG Togo
TH Thailand
TJ Tajikistan
TN Tunisia
TR Turkey
TT Trinidad and Tobago
TZ United Republic of Tanzania (the)
UA Ukraine
UG Uganda
US United States of America (the)
UY Uruguay
VN Viet Nam
YE Yemen
ZA South Africa
ZM Zambia
ZW Zimbabwe
Code Country/Economy
The Global Innovation Index 201918
TABLE 1 .2
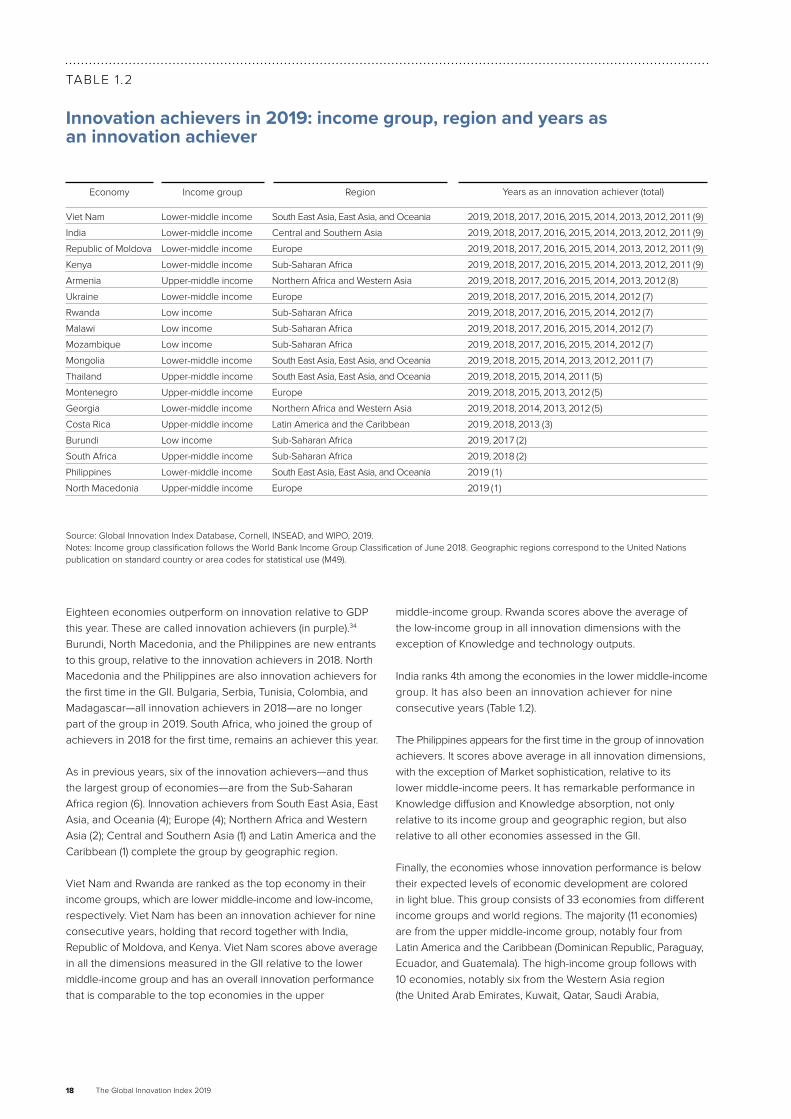
Innovation achievers in 2019: income group, region and years as an innovation achiever
Viet Nam Lower-middle income South East Asia, East Asia, and Oceania 2019, 2018, 2017, 2016, 2015, 2014, 2013, 2012, 2011 (9)
India Lower-middle income Central and Southern Asia 2019, 2018, 2017, 2016, 2015, 2014, 2013, 2012, 2011 (9)
Republic of Moldova Lower-middle income Europe 2019, 2018, 2017, 2016, 2015, 2014, 2013, 2012, 2011 (9)
Kenya Lower-middle income Sub-Saharan Africa 2019, 2018, 2017, 2016, 2015, 2014, 2013, 2012, 2011 (9)
Armenia Upper-middle income Northern Africa and Western Asia 2019, 2018, 2017, 2016, 2015, 2014, 2013, 2012 (8)
Ukraine Lower-middle income Europe 2019, 2018, 2017, 2016, 2015, 2014, 2012 (7)
Rwanda Low income Sub-Saharan Africa 2019, 2018, 2017, 2016, 2015, 2014, 2012 (7)
Malawi Low income Sub-Saharan Africa 2019, 2018, 2017, 2016, 2015, 2014, 2012 (7)
Mozambique Low income Sub-Saharan Africa 2019, 2018, 2017, 2016, 2015, 2014, 2012 (7)
Mongolia Lower-middle income South East Asia, East Asia, and Oceania 2019, 2018, 2015, 2014, 2013, 2012, 2011 (7)
Thailand Upper-middle income South East Asia, East Asia, and Oceania 2019, 2018, 2015, 2014, 2011 (5)
Montenegro Upper-middle income Europe 2019, 2018, 2015, 2013, 2012 (5)
Georgia Lower-middle income Northern Africa and Western Asia 2019, 2018, 2014, 2013, 2012 (5)
Costa Rica Upper-middle income Latin America and the Caribbean 2019, 2018, 2013 (3)
Burundi Low income Sub-Saharan Africa 2019, 2017 (2)
South Africa Upper-middle income Sub-Saharan Africa 2019, 2018 (2)
Philippines Lower-middle income South East Asia, East Asia, and Oceania 2019 (1)
North Macedonia Upper-middle income Europe 2019 (1)
Economy Income group
Source: Global Innovation Index Database, Cornell, INSEAD, and WIPO, 2019.Notes: Income group classification follows the World Bank Income Group Classification of June 2018. Geographic regions correspond to the United Nations publication on standard country or area codes for statistical use (M49).
Region Years as an innovation achiever (total)
Eighteen economies outperform on innovation relative to GDP this year. These are called innovation achievers (in purple).34 Burundi, North Macedonia, and the Philippines are new entrants to this group, relative to the innovation achievers in 2018. North Macedonia and the Philippines are also innovation achievers for the first time in the GII. Bulgaria, Serbia, Tunisia, Colombia, and Madagascar—all innovation achievers in 2018—are no longer part of the group in 2019. South Africa, who joined the group of achievers in 2018 for the first time, remains an achiever this year.
As in previous years, six of the innovation achievers—and thus the largest group of economies—are from the Sub-Saharan Africa region (6). Innovation achievers from South East Asia, East Asia, and Oceania (4); Europe (4); Northern Africa and Western Asia (2); Central and Southern Asia (1) and Latin America and the Caribbean (1) complete the group by geographic region.
Viet Nam and Rwanda are ranked as the top economy in their income groups, which are lower middle-income and low-income, respectively. Viet Nam has been an innovation achiever for nine consecutive years, holding that record together with India, Republic of Moldova, and Kenya. Viet Nam scores above average in all the dimensions measured in the GII relative to the lower middle-income group and has an overall innovation performance that is comparable to the top economies in the upper
middle-income group. Rwanda scores above the average of the low-income group in all innovation dimensions with the exception of Knowledge and technology outputs.
India ranks 4th among the economies in the lower middle-income group. It has also been an innovation achiever for nine consecutive years (Table 1.2).
The Philippines appears for the first time in the group of innovation achievers. It scores above average in all innovation dimensions, with the exception of Market sophistication, relative to its lower middle-income peers. It has remarkable performance in Knowledge diffusion and Knowledge absorption, not only relative to its income group and geographic region, but also relative to all other economies assessed in the GII.
Finally, the economies whose innovation performance is below their expected levels of economic development are colored in light blue. This group consists of 33 economies from different income groups and world regions. The majority (11 economies) are from the upper middle-income group, notably four from Latin America and the Caribbean (Dominican Republic, Paraguay, Ecuador, and Guatemala). The high-income group follows with 10 economies, notably six from the Western Asia region (the United Arab Emirates, Kuwait, Qatar, Saudi Arabia,

Chapter 1 19
and research (6th). Sweden makes remarkable improvements in Knowledge absorption (6th), Education (6th), ICTs (12th), and Knowledge diffusion (6th). The significant improvements in the Knowledge absorption sub-pillar are mainly due to improvements in the indicator FDI inflows, which remains a relative weakness for Sweden.
At the indicator level, Sweden keeps its 1st position in PCT patent applications by origin and IP receipts; and gains the 1st position on patent families (up from 5th). Sweden’s areas for improvement include Pupil-teacher ratio, GDP per unit of energy use, Ease of getting credit, GERD financed by abroad, productivity growth (Growth rate of PPP$), and Printing and other media.
The United States of America reaches the 3rd position worldwide, in part due to performance increases and the availability of new U.S. innovation data (see below). The U.S. improves its rank in five of the seven GII pillars: Institutions (11th); Human capital and research (12th); Infrastructure (23rd); Business sophistication (7th); and Knowledge and technology outputs (4th).35
Keeping its world leading position in Market sophistication (1st); it also makes important progress in the Knowledge workers sub-pillar (4th); and in the Innovation linkages sub-pillar (9th). Relative to the top 25, it is strong in the sub-pillars of Business environment (2nd); R&D (3rd); Credit (1st); Knowledge creation (3rd); and Knowledge impact (2nd). It maintains leadership in a series of key innovation metrics such as Global R&D companies, quality of universities (QS university ranking), Venture capital deals, State of cluster development (Special Section: Cluster Rankings), quality of scientific publications (Citable documents H-index), Computer software spending, IP receipts, and Entertainment and media market. The U.S. also reaches 1st in University/industry research collaboration this year. It makes important innovation performance increases in a number of indicators, notably Creative goods exports (up by 17); Knowledge-intensive employment (up by 18); Government’s online service; and E-participation, both up by 7.
The U.S.’ improved ranking in the Human capital and research pillar, notably in sub-pillar Tertiary education, and in Knowledge workers is because of improved data availability in the indicators Tertiary enrolment and Females employed with advanced degrees, for which data was missing in GII 2018 and became available in GII 2019.
With regards to the quality of innovation, the U.S. ranks 1st, above Japan and Switzerland (Figure 1.7). The country achieves this top position thanks to a combination of its sustained world leadership on all innovation quality metrics and because of decreases in the performance of Switzerland (see above) and Japan.
The Netherlands is the 4th most innovative economy in the world. It ranks 11th in the Innovation Input Sub-Index and retains 2nd position in the Innovation Output Sub-Index. Innovation outputs remain a strength for the Netherland’s innovation ecosystem, ranking 3rd in Knowledge and technology outputs, and 5th in Creative outputs.
Bahrain, and Oman). Eight underperformers are from the lower middle-income group, notably three from Sub-Saharan Africa (Ghana, Nigeria, and Zambia) and three from Latin America and the Caribbean (El Salvador, Bolivia, and Nicaragua). Only four economies underperform relative to their levels of development and are from the low-income group (Yemen, Benin, Guinea, and Togo). The regions with the most number of economies performing lower than expectations relative to their level of development are Latin America and the Caribbean (9), Northern Africa and Western Asia (9), and Sub-Saharan Africa (9).
The world’s top innovators in the Global Innovation Index 2019The top 10 economies
Switzerland remains the world’s leader in innovation in 2019. It ranks first in the GII for the ninth consecutive year. It has ranked 1st in the Innovation Output Sub-Index and in the Knowledge and technology output pillar since 2012. It also keeps its 1st rank in the Creative outputs pillar since last year, consolidating once again its leadership in innovation outputs. Switzerland keeps its 2nd position in the Innovation Input Sub-Index. It improves its rank in three innovation input pillars: Market sophistication (up by 1); Business sophistication (up by 2); and notably Infrastructure (up by 5). In the latter, all improvements are In the Information and communication technologies (ICTs) sub-pillar; and notably in the Government’s online service, and E-participation indicators. In contrast, the country drops positions in two innovation inputs pillars: Institutions, and Human capital and research.
In quality of innovation, Switzerland is ranked 4th worldwide, after the U.S., Germany, and Japan. Its rank decreases this year in the metrics for quality of innovation, notably in the quality of local universities and the internationalization of local inventions. Additionally, rank decreases are seen in the General infrastructure sub-pillar, where it positions below the top 25 (28th, down from 25th in 2018); and in Trade, competition, and market scale (26th, down from 19th).
Switzerland is a world leader in several key innovation indicators, including PCT patent applications by origin (a spot it shares with Sweden and Finland); ICT services imports; IP receipts; FDI net outflows; and Environmental performance. Conversely, and relative to the top 25 in the GII 2019, it has opportunities to improve in Ease of starting a business, Ease of resolving insolvency, and Ease of protecting minority investors.
Sweden recovers its 2nd position worldwide this year (up from 3rd), and remains the top Nordic economy in the GII 2019. It drops by one rank in the Innovation Input Sub-Index to 4th position; and retains 3rd in the Innovation Output Sub-Index. It ranks among the top 10 economies in all pillars except for Market sophistication (14th) where it loses two positions. It improves its rank in four pillars: Business sophistication, achieving 1st position in the world; Infrastructure (2nd); Knowledge and technology outputs (2nd); and Human capital

The Global Innovation Index 201920
Finland moves up to the 6th position this year, continuing its upward trend from 2017. It ranks 7th in both the Innovation Input and Output Sub-Indices. On the input side, it improves its position in three of the GII pillars: Human capital and research (2nd, up by 2), Infrastructure (12th, up by 5), and Business sophistication (5th, up by 1). The largest decrease is observed in Market sophistication (27th, down by 12), notably in the Investment sub-pillar (34th); while it loses one position in Institutions (3rd). At the sub-pillar level, the largest increases are in Education (4th, up by 3); and Knowledge absorption (12th, up by 3), notably in indicator FDI inflows (31st, up by 18). On the output side, Finland improves notably in Knowledge diffusion (7th); particularly in the indicator FDI outflows (14th), and in Online creativity (6th). For the latter, changes to the GII model also partially explain the increase, notably in the indicator Mobile app creation, where Finland ranks 1st worldwide (Appendix IV).
Finland maintains its lead in PCT patent applications by origin, while it achieves the 1st rank this year in both Rule of law and E-participation. It remains a world leader in a number of important innovation metrics, such as Patent families, School life expectancy, and Ease of resolving insolvency. Relatively weak performance is observed in Pupil-teacher ratio, Gross capital formation, productivity growth, Trademarks by origin, and Printing and other media.
Denmark ranks 7th in the GII 2019, increasing by one rank from last year. It increases by two spots in the Innovation Input Sub-Index (5th), and by one spot in the Innovation Output Sub-Index (12th). Denmark remains in the top 15 in all GII pillars, and improves its position in 4 of the pillars: Human capital and research (4th, up by 2), Infrastructure (6th, up by 9), Business sophistication (9th, up by 5), and Knowledge and technology outputs (14th, up by 1). In Human capital and research, the most notable improvement is in the Education sub-pillar (2nd), notably because of sustained high levels of expenditure on education. In Infrastructure, increases are observed in ICTs (2nd) and General infrastructure (33rd) and, in particular, in indicators ICT use (1st), Government’s online service (1st), E-participation (1st), and Logistics performance (8th). In Business sophistication, most improvements occurred in the sub-pillars Innovation linkages (7th, up by 11), notably in the indicator GERD financed by abroad; and in Knowledge absorption (20th, up by 6), in particular in ICT services imports. In addition, Denmark ranks in the top 3 in a number of indicators such as Scientific and technical articles (1st), Researchers (2nd) and Environmental performance (3rd). Opportunities for further improvement still exist, notably in indicators such as Graduates in science and engineering, Gross capital formation, Utility models by origin, productivity growth, Trademarks by origin, and Printing and other media.
The Netherlands remains in the top 25 in all innovation input pillars, and in the top 10 worldwide for Institutions (8th) and Business sophistication (6th). At the sub-pillar level, the country’s strengths remain Innovation linkages (5th), ICTs (4th) and Knowledge absorption (2nd). At the indicator level, it remains 1st in IP payments and it is consistently strong on Regulatory quality, E-participation, Intensity of local competition, University/industry collaboration, State of cluster development (Special Section: Cluster Rankings), and FDI inflows. Important improvements are also observed in GERD financed by business, and Females employed with advanced degrees. Conversely, most of the decreases observed this year are in the Human capital and research pillar (17th), and notably on the Education (23rd), and Tertiary education sub-pillars (59th). In Education, the decrease is explained by data availability, notably for the indicator Government funding per pupil, where the country ranks 36th this year, and for which data was previously missing. In Tertiary education—amid the same levels of performance in Tertiary enrolment, Graduates in science and engineering, and Tertiary inbound mobility—the country drops ranks in relative terms as other economies improved their performance in these areas.
In Innovation Outputs, the Netherlands is strong on Knowledge diffusion (2nd) and Online Creativity (2nd), in particular in indicators such as IP receipts, FDI net outflows, ICTs and business model creation, and ICTs and organizational model creation. Progress is also observed in the quality of scientific publications (8th) and in Cultural and creative services exports (10th).
The United Kingdom ranks 5th this year, 6th in the Innovation Input Sub-Index, and gains two spots in the Innovation Output Sub-Index (4th). The U.K. improves its rank in two pillars: Knowledge and technology outputs (8th); and Market sophistication (4th). At the sub-pillar level, important increases are in Knowledge diffusion (12th), Intangible assets (12th), and Knowledge creation (5th). Some indicators that are responsible for rank improvements in these pillars include Industrial designs by origin (16th), IP receipts (8th), ICT services exports (28th), and High-tech net exports (18th). Despite these important gains, the U.K. loses between one and four positions in four of the GII pillars: Business sophistication (16th), Creative outputs (6th), Infrastructure (8th), and Human capital and research (9th). The country maintains its lead in the quality of scientific publications and remains strong in indicators, such as School life expectancy, the quality of its universities, ICT access, Government’s online service, Environmental performance, Venture capital deals, Computer software spending, and Cultural and creative services exports. Due to its historic universities and the quality of its scientific publications, the U.K. is still the 5th world economy in quality of innovation (Figure 1.7). A frequent question these days is how the U.K.’s planned withdrawal from the European Union affects the country’s GII rank. As noted in previous years, the causal relations between plans or the actual withdrawal from the EU and the GII indicators are complex and uncertain in size and direction.

Chapter 1 21
Singapore ranks 8th this year. It remains first in the world in the Innovation Input Sub-Index and keeps its 15th position in the Innovation Output Sub-Index. However, Singapore loses positions in all Inputs pillars, with the exception of Institutions, in which it still ranks 1st. Improved data availability partially explains ranking decreases. Some indicators that were unavailable last year became available this year, notably in the Human capital and research pillar (5th), in which Singapore loses 4 ranks. In this pillar, there is an important decrease in the indicator Global R&D companies (30th). Drops in this indicator are caused by a re-location back to the U.S. of Broadcom, a technology hardware and equipment company. Broadcom was the largest R&D spender in Singapore until last year.36 Singapore loses two ranks in the pillars Infrastructure (7th) and Business sophistication (4th). In Infrastructure, ICTs (11th) and Ecological sustainability (22nd) are the weaker performing sub-pillars, with several indicators decreasing—notably E-participation, ICT use, and ISO 14001 environmental certificates. In Business sophistication, the country loses several ranks, particularly in the indicator Females employed with advanced degrees, but also in FDI inflows and IP payments. It loses one rank in the Market sophistication pillar (5th). Ease of getting credit and Market capitalization are the indicators where the country loses most positions in this pillar.
Singapore increases its performance in several indicators within the Knowledge and technology outputs pillar (11th), notably in labor productivity growth, and ICT services exports. However, other indicators, such as ISO 9001 quality certificates, FDI net outflows and Computer software spending, have decreased, leaving performance in this pillar unchanged relative to last year. Singapore improves its position by one rank in the Creative outputs pillar (34th), thanks to the indicator of Mobile app creation, in which it ranks 10th worldwide.
Singapore becomes the global leader (1st) in a number of important innovation parameters, notably in Tertiary inbound mobility (up from 5th), Knowledge-intensive employment (up from 2nd), and JV-strategic alliances deals (up from 3rd).
Germany retains 9th place for the third consecutive year. It improves to 12th position in the Innovation Input Sub-Index (up by 5 positions), and ranks 9th in the Innovation Output Sub-Index. It ranks in the top 20 across all GII pillars, and in the top 10 worldwide in both innovation output pillars. Germany improves its performance in three pillars: notably in Human capital and research, where it gains 7 positions and moves into the top 3; Infrastructure (13th); and Business sophistication (12th). In these three pillars, it improves the most in Tertiary education (5th), Innovation linkages (10th) and Information and communication technologies (15th). The largest increase in the Tertiary education sub-pillar is mainly due to better data coverage. For the indicator Graduates in science and engineering—for which data was missing in the GII 2018— Germany ranks 4th worldwide. On the output side, Germany keeps its 10th rank in Knowledge and technology outputs and loses three spots in Creative outputs (10th).
As in previous years, Germany remains 1st in Logistics performance and in Patents by origin. It remains 2nd in Global R&D companies; improves to 2nd in State of cluster development (up by 1); and remains 3rd in the quality of scientific publications. Thanks to these high ranks, Germany ranks 2nd in the quality of innovation. This increase is partly due to the increased quality of its scientific publications, but also to the relative decrease of innovation quality in Switzerland and Japan (Figure 1.7).
Despite important achievements, there is still opportunity for improvement in some innovation areas, such as the Ease of starting a business, Expenditure on education, Gross capital formation, GERD financed by abroad, FDI net inflows, productivity growth, New businesses, and Printing and other media. These opportunities for improvement have remained unchanged since last year.
Israel breaks into the top 10 of the most innovative economies in the world for the first time, after several years of increased performance. It remains 1st in the Northern Africa and Western Asia region, and keeps its position in the top 10 worldwide in two pillars: Business sophistication (3rd) and Knowledge and technology outputs (7th). This year it improves its rank in two pillars, Institutions (31st) and Creative outputs (14th). At the sub-pillar level, Israel improves in Research and development (2nd), and keeps its top rank in Innovation linkages. It also retains its 1st position in a number of important indicators, such Researchers, R&D intensity (GERD performed by business, % GDP), Research talent in business enterprise, ICT services exports, and Wikipedia edits. It also reaches the 1st rank in Mobile app creation.37 Other indicators where Israel ranks in the top 3 include Patent families (2nd), a notable performance increase relative to last year; Females employed with advanced degrees (3rd); University/industry research collaboration (2nd), GERD financed by abroad (3rd); and Venture capital deals (3rd).
Israel’s innovation weaknesses are mostly in innovation inputs. The Tertiary education sub-pillar is a weakness, and notably the indicator Tertiary inbound mobility. Other areas for improvement include Government funding per pupil, PISA results, Gross capital formation, Firms offering formal training, GERD financed by business, and IP payments. On the output side, there are two areas for improvement in the pillar Creative outputs: Trademarks by origin, and Printing and other media.

The Global Innovation Index 201922
BOX 4
What is the innovation secret of small economies?
Why do a number of city-states or small economies—measured by their population or geographic size—make it into the GII top 20?
Here we look more in-depth at three examples to seek an answer: Singapore—ranked 8th with a population of 5.6 million; Hong Kong (China)—ranked 13th with a population of 7.5 million; and Luxembourg—ranked 18th with a population of 0.6 million. All three small economies share similar traits— reduced geographical space, no natural resources, and extremely open economies. They act as regional hubs for trade and investment and are strong in services—in particular, financial services. Relative to all high-income economies, these three economies score high in Institutions—in particular, Singapore and Hong Kong (China), Infrastructure—Hong Kong (China) and Singapore, and Business sophistication—Singapore and Luxembourg. Their high scores demonstrate an excellent environment that, for example, is supportive of innovation, has good regulatory quality, and ranks well in the ease of starting a business. In the pillar Human capital and research, Singapore stands out.
For innovation outputs, Singapore and Hong Kong (China) score high relative to other high-income economies in the pillar Knowledge and technology outputs. Yet, only Singapore has a strong lead. Except for Singapore, these economies are often not directly involved in high-tech manufacturing and their manufacturing base is small. They export few locally produced high-tech products.38 In Creative outputs, in turn, Luxembourg and Hong Kong (China) perform best (Box 5).
What innovation ambitions and policies do these economies harbor for the near future? 39
Singapore aims to be a center of innovation and a key node along the global innovation supply chain where innovative firms thrive on the basis of intellectual property and intangible assets. To achieve this ambition, one strategy is to strengthen Singapore’s innovation ecosystem by helping enterprises to innovate and scale up. Singapore envisages advancing its conducive environment, international linkages, capabilities in intangible asset management, IP commercialization, and skilled workforce. In 2016, the Government of Singapore committed US$14 billion for research, innovation, and enterprise activities. It identified four strategic domains for prioritized research funding: (1) advanced manufacturing and engineering, (2) health and biomedical sciences, (3) services and digital economy, and (4) urban solutions and sustainability.40 The Intellectual Property Office of Singapore (IPOS) has also transformed to better serve global innovation communities by conducting regular reviews of Singapore’s IP policies and building capabilities in intangible asset management and IP commercialization, including IP skills.41
Hong Kong, China also plans to develop into a leading international innovation hub, benefiting from its position in Asia and its proximity and links to other parts of China. There are plans by China and Hong Kong (China) to further develop the Guangdong-Hong Kong-Macao Greater Bay Area (Bay Area)—which encapsulates the city of Hong Kong and Shenzhen—as a major global innovation cluster. The Government of Hong Kong (China) has committed over US$13.5 billion since 2017 to promote innovation and technology. Two research clusters are to be established—one on healthcare technologies and the other on artificial intelligence and robotics. In addition, the government has promoted re-industrialization to develop high-end manufacturing. In sum, innovation and technology development is pressing ahead swiftly under an eight-pronged strategy, including (1) increasing resources for R&D, (2) pooling technology talent, (3) providing investment funding, (4) providing technological research infrastructure, (5) reviewing legislations and regulations, (6) opening up government data, (7) enhancing government procurement arrangements, and (8) promoting science education. A Technology Talent Admission Scheme was set up to attract non-local talent. The government has also put emphasis on fostering smart city innovations.
Luxembourg, in turn, aims to develop its innovation leadership through its strong infrastructure, its location in the heart of Europe, its strong services economy, and its talent base. Luxembourg’s efforts are focused on five key areas: infrastructure, skills, government, ecosystem, and policy. Luxembourg aims to invest around 2.5% of its GDP in research in 2020. New financing programs will be launched to foster digital high-tech start-ups. In May 2019, Luxembourg presented its national AI strategy and is rolling out its data-driven innovation strategy with focus on seven specific sectors: ICT, manufacturing industry, eco technologies, health technology, space, logistics, and financial services.42 Examples of innovative initiatives are the rollout of fiber optic cable to homes, 5th generation networks, and its National CyberSecurity Strategy. Other areas of policy focus include increasing investments and strides in high-performance computing,43 creating a national strategy for AI,44 boosting the commercial adoption of block chain,45 fostering digital skills,46 and developing further the local space industry.47 Luxembourg also prioritizes the exploitation of public sector information and open data to spur innovation. In the area of talent, Luxembourg has simplified residence permits for highly qualified workers.

Chapter 1 23
What are the top 10 economies in innovation inputs?The top 10 economies in the Innovation Input Sub-Index are Singapore, Switzerland, the U.S., Sweden, Denmark, the U.K., Finland, Hong Kong (China), Canada, and the Republic of Korea. Hong Kong (China), Canada, and the Republic of Korea are the only economies in this group that are not in the GII top 10.
Box 4 takes an in-depth look at the relationship between economy size and innovation performance.
Hong Kong, China keeps the 8th spot in the Innovation Input Sub-Index for the third consecutive year and ranks 13th in the GII overall, up from 14th in 2018. It moves downward in all input pillars except for Institutions (7th, up by 3) where it benefits from the introduction of the new indicator of Political and operational stability (Appendix IV). In this pillar, it keeps its top rank in the indicator of Cost of redundancy dismissal and gains in Regulatory quality. Government effectiveness and Ease of starting a business also rank well (5th rank overall). Hong Kong (China) also retains good rankings in Market sophistication (3rd) and Infrastructure (4th). In five of the 15 input sub-pillars, it ranks in the top 10; these are Political environment (4th), Regulatory environment (3rd), Ecological sustainability (2nd), Credit (2nd), and Knowledge absorption (8th). It ranks in the top 3 in several indicators, such as PISA results, GDP per unit of energy use, Domestic credit to private sector, High-tech imports, and FDI net inflows. Relative weaknesses on the input side include Expenditure on education, Global R&D companies, GERD financed by abroad, IP payments, and ICT services imports.
Canada moves up to the 9th position in the Innovation Input Sub-Index and to the 17th in the GII ranking, up one from 2018. Its strengths on the input side are a result of high and improved rankings in two pillars: Market sophistication (2nd) and Institutions (4th). This year, the country also improves in Business sophistication (22nd), where it gains the top rank in JV-strategic alliance deals. In Market sophistication, Canada maintains its top rank in Venture capital deals. However, country data for indicators Domestic credit to private sector and Microfinance gross loans were unavailable, making the Credit sub-pillar difficult to measure. In Institutions, the country ranks 3rd in Ease of starting a business and is in the top 10 in Political and operational stability, Government effectiveness, Regulatory quality, and Rule of law. Interesting changes occur also in Human capital and research, where data for four variables became available this year. This allows a better measurement of Canada’s performance in Education (51st) and Tertiary education (32nd). In this pillar, the country takes the 6th spot in the quality of universities. Thanks to this higher score and to a higher score in quality of scientific publications, Canada also joins the top 10 in the quality of innovation this year (Figure 1.7). Canada’s relative weak areas include Graduates in science and engineering, GDP per unit of energy use, and ICT services imports.
The Republic of Korea (Korea) enters the top 10 in the Innovation Input Sub-Index this year, keeping up its good performance and gaining four positions since 2018. In the overall GII ranking, it moves closer to the top 10 (11th, up by 1). On the input side, Korea improves the most in Business sophistication (10th, up by 10) and gains positions in Human capital and research—where it becomes the top economy in the world—and in Market sophistication (11th, up by 3). In these pillars, the indicators that see the largest gains include Knowledge-intensive employment, JV-strategic alliance deals, Expenditure on education, and Venture capital deals. Korea maintains its good ranks in a number of crucial variables, including most of the R&D-related indicators, as well as Tertiary enrolment, Researchers, Research talent in business enterprises, E-participation, ICT use, and Patent families in two or more offices. Despite this good performance, the country presents areas of relative weakness, which include Tertiary inbound mobility, GDP per unit of energy use, GERD financed by abroad, ICT services imports, and FDI net inflows.
What are the top 10 economies in innovation outputs?The top 10 economies in the Innovation Output Sub-Index this year are Switzerland, the Netherlands, Sweden, the U.K., China, the U.S., Finland, Israel, Germany, and Ireland.
The 10 economies leading the Innovation Output Sub-Index remain broadly the same as in 2018, with six shifts and one substitution: the U.K., China, the U.S., and Finland move upward within the top 10; while Germany and Ireland move downward. Israel enters the top 10, while Luxembourg exits. Eight of these economies are ranked in the GII top 10. The innovation profile of the other two economies, China and Ireland, are discussed below. Box 5 presents an in-depth look at this year’s results on the Creative outputs pillar.
China makes an impressive improvement in the Innovation Output Sub-Index this year, reaching the 5th position worldwide, up five positions from 2018—the year in which it reached the top 10 in the GII Output Sub-Index for the first time.
In Knowledge and technology outputs, it moves up one place in Knowledge impact to regain its 1st rank worldwide, and maintains its position in Knowledge creation (4th) and Knowledge diffusion (22nd). Most improvements in this pillar are due to sustained and increased performance in variables such as PCT patents (17th), ISO 9001 quality certificates (20th), and ICT services exports (75th). Improvements in this pillar are partially due to model changes, notably in the productivity growth variable, where China ranks 1st this year (up by 3). In this same pillar, China remains 1st in other key innovation metrics: Patents by origin, Utility models by origin, and High-tech net exports.
In Creative outputs, China improves in two sub-pillars: Creative goods and services (15th, up by 13); and Online creativity (79th, up by 5). It keeps its 1st position in Intangible assets. It remains top-ranked in Industrial designs by origin and

The Global Innovation Index 201924
Creative goods exports, and achieves the 1st rank this year in Trademarks by origin (up by 2). China also maintains its first place in quality of innovation among middle-income economies for the seventh consecutive year (Figure 1.7). It improves its performance in all innovation quality metrics and ranks 3rd globally in the quality of universities.
Areas of improvement in the innovation output side include National feature films, Printing and other media, and Wikipedia edits.
Ireland ranks 10th in the Innovation Output Sub-Index this year. It is 6th in the Knowledge and technology outputs pillar— despite progress in a few areas, Ireland loses two ranks since last year, in part driven by better innovation performance in other economies. Ireland keeps its 19th position in Creative outputs.
In Knowledge and technology outputs, it moves up in Knowledge creation (31st, up by 6), and Knowledge impact (3rd, up by 2). It remains the top economy worldwide in Knowledge diffusion (1st). The most important improvements in this pillar are in PCT patents (22nd, up by 4), and High- and medium-high-tech manufactures (2nd, up by 1). Conversely, weaker performance is observed in Patents by origin (39th, down by 3), Scientific and technical articles (39th, down by 2), and High-tech net exports (16th, down by 1). In this pillar, Ireland remains 1st in the world in ICT services exports and FDI net outflows, and 2nd in Computer software spending.
In Creative outputs, Ireland improves in Intangible assets (8th, up by 4), but decreases in Creative goods and services (59th, down by 11), and Online creativity (24th, down by 2). Some of the areas responsible for the decreases are National feature films (21st) and Creative goods exports (40th). In contrast, progress is observed in Industrial designs by origin (59th, up by 9).
BOX 5
Which economies rank high on Creative outputs?
The GII considers creativity, and non-technological forms of innovation, as important ingredients befitting innovative economies and societies.
China leads in Intangible assets, Hong Kong (China) in Creative goods & services, and Luxembourg in Online creativity. Few economies rank in the top 10 for all three categories, but Luxembourg and Switzerland stand out with a top 10 position in all three. Hong Kong (China), and Malta each hold top 10 positions in two categories. The strength of small economies is particularly true in Online creativity, where Luxembourg trumps the list among other similarly small economies (Box 4). However, there are exceptions as large economies scoring high in Online creativity include Germany, France, the U.S., and the U.K.
Since last year, in collaboration with App Annie and its mobile data platform, which tracks Google Play store and iOS App Store activity in each economy, the GII has been generating performance metrics based on the creation of mobile apps (Appendix IV). In absolute numbers, the U.S. is the uncontested leader in app creation, followed by France, India, the Republic of Korea, the U.K., and the Russian Federation (Box 5, Figure 1). Complete data for China is not available, but it would occupy a top slot.
When the GII scales this data for GDP, a different picture emerges. Cyprus, Finland, and Israel lead followed by economies in Eastern Europe (Lithuania and Estonia), and Asian economies such as Hong Kong (China) and Singapore.
Frequently, markets with companies that perform well in the app world are also ones with strong enough economies to attract entrepreneurs. The U.S. is where many tech companies are located and where the world’s largest app stores began. For companies headquartered outside the U.S., their success represents both the size of their home markets and their ability to carve out a sizable share when it comes to app creation. While India, Brazil, and the Russian Federation are near the top, other large countries, such as Indonesia, primarily utilize apps created by companies from other countries. It is easier to create apps that address needs in local markets and then expand internationally from there. Gaming apps are unique in that, while regional preferences and localization influence success, they are generally scalable globally. In gaming, one or two successful companies have the potential to move the needle for an entire country.48

Chapter 1 25
BOX 5, F IGURE 1
Global app downloads (billions) produced by local companies, 2018
18
14
10
6
2
16
12
8
4
0
Source: App Annie, 2019.
United States of America
France India Republic of Korea
UnitedKingdom
RussianFederation
Japan Germany Turkey Brazil
▲ Global app download (billions) produced by local companies
Who is best on the quality of innovation?Moving beyond quantity to quality indicators of innovation has become an overarching concern to the innovation policy community. With this in mind, three indicators that measure the quality of innovation were introduced into the GII in 2013: 1) quality of local universities (indicator 2.3.4, QS university ranking, average score of top 3 universities); (2) the internationalization of local inventions (indicator 5.2.5, Patent families filed in at least two offices); and (3) the quality of scientific publications, as measured by the number of citations that locally produced research documents receive abroad (indicator 6.1.5, Citable documents H-index).
Figure 1.7 shows how the scores of these three indicators are added to capture the top 10 highest performing high- and middle-income economies in the quality of innovation.
Among the high-income economies, the U.S. regains the top rank for quality of innovation, moving ahead of Japan, which
moves down to 3rd this year. Germany is 2nd for the first time, above both Japan and Switzerland. The U.K. is stable at 5th, while the Netherlands moves up to 6th—its highest ranking in the quality of innovation to date. Sweden and the Republic of Korea rank 7th and 8th, respectively. France is stable at 9th and Canada, whose last appearance in this group was in 2016, re-enters in 10th, replacing Finland.
The U.S. returns this year to the top position in quality of innovation among the high-income economies. This achievement, seen before in 2017, reflects consistent performance in the quality of publications and high scores for the top 3 U.S. universities: The Massachusetts Institute of Technology (MIT), Stanford University, and Harvard University.
Germany improves this year in the quality of innovation (2nd) with a higher score in quality of scientific publications H-Index (1,059 to 1,131) and better scores for its top three universities: the Technical University of Munich (TUM), the Ludwig Maximilian University of Munich, and Heidelberg University.

The Global Innovation Index 201926
FIGURE 1.7
Metrics for quality of innovation: top 10 high- and middle-income economies, 2019
500 100 150 200 250 300
1 United States of America
2 Germany
3 Japan
4 Switzerland
5 United Kingdom
6 Netherlands
7 Sweden
8 Republic of Korea
9 France
10 Canada
Average (50 economies)
15 China
26 India
27 Russian Federation
28 Brazil
32 Malaysia
33 Mexico
36 South Africa
41 Turkey
43 Colombia
44 Thailand
Average (60 economies)
High-income economies
Middle-income economies
⊲ Sum of scores ■ 2.3.4: QS university ranking average score of top 3 universities ■ 5.2.5: Patent famililes filed in two or more offices■ 6.1.5: Citable documents H-index
Source: Global Innovation Index Database, Cornell, INSEAD, and WIPO, 2019.Notes: Numbers to the left of the economy name are the innovation quality rank. Economies are classified by income according to the World Bank Income Group Classification (July 2018). Upper- and lower middle-income categories are grouped together as middle-income economies.

Chapter 1 27
FIGURE 1.7
Metrics for quality of innovation: top 10 high- and middle-income economies, 2019
500 100 150 200 250 300
1 United States of America
2 Germany
3 Japan
4 Switzerland
5 United Kingdom
6 Netherlands
7 Sweden
8 Republic of Korea
9 France
10 Canada
Average (50 economies)
15 China
26 India
27 Russian Federation
28 Brazil
32 Malaysia
33 Mexico
36 South Africa
41 Turkey
43 Colombia
44 Thailand
Average (60 economies)
High-income economies
Middle-income economies
⊲ Sum of scores ■ 2.3.4: QS university ranking average score of top 3 universities ■ 5.2.5: Patent famililes filed in two or more offices■ 6.1.5: Citable documents H-index
Source: Global Innovation Index Database, Cornell, INSEAD, and WIPO, 2019.Notes: Numbers to the left of the economy name are the innovation quality rank. Economies are classified by income according to the World Bank Income Group Classification (July 2018). Upper- and lower middle-income categories are grouped together as middle-income economies.
The U.K. remains stable in quality of innovation (5th) and remains 2nd in the quality of universities, with top scores for University of Oxford, University of Cambridge, and Imperial College London. The U.K. shares 1st place in quality of scientific publications with the U.S.—for the sixth consecutive year.
Sweden reaches the top position in patent families for the first time.
Canada joins the top 10 in quality of innovation with higher scores in the quality of scientific publications.
The ranking of middle-income economies in these innovation quality indicators remains steady, with China (15th), India (26th), and the Russian Federation (27th) in the top 3 positions. Brazil (28th), Malaysia (32nd), and Mexico (33rd) are next in line, followed by South Africa (36th), Turkey (41st), Colombia (43rd), and Thailand (44th). This year, aside from China, Malaysia and Thailand are the fastest movers in this group. Colombia is the third economy from Latin America and the Caribbean in this list.
China remains as the top middle-income economy in the quality of innovation for the seventh consecutive year. Positioned 15th, China is the only middle-income economy that is closing the gap with the high-income group in all three indicators. China ranks 3rd in quality of universities. Similarly, China’s score for quality of scientific publications stands above the high-income group average.
India ranks 2nd in the quality of innovation among the middle-income economies for the fourth consecutive year, with top positions in quality of scientific publications (2nd) and in the quality of universities (3rd), notably due to the performance of its top 3 universities: the Indian Institute of Technology (Delhi and Bombay) and the Indian Institute of Science Bengaluru.
Brazil retains its 4th place among its middle-income peers and 28th globally, although displaying lower scores in the quality of universities this year.
Malaysia is 5th among middle-income economies and 32nd overall in the quality of innovation.
Colombia, 9th in this group, enters the middle-income top 10 for the first time since 2016. Higher scores in both international patents and the quality of scientific publications assist Colombia’s performance, leading to an overall ranking of 43rd. Colombia is 8th among its income group peers in the quality of its universities, with notable scores for Los Andes University of Colombia, National University of Colombia, and Externado University of Colombia.
With regards to the quality of universities, high-income economies hold almost all top ranks. The U.S. and the U.K. take the top 5 positions for individual universities. Singapore is the only non-Northern American or European economy with universities in the top 15 worldwide (National University of Singapore and Nanyang Technological University).
In the middle-income group, the top 3 universities are located in China, after which, India holds the most top slots. India is also the only lower middle-income economy with a university in the top 10 among middle-income economies (Table 1.3).
Regarding the quality of scientific publications (Citable documents H-index), among the top 5 in the high-income group, only the U.S. and Canada are non-European economies. In the middle-income group, China takes the top position. India is 2nd, as the only lower middle-income economy in the top ranks. The Islamic Republic of Iran ranks 9th among middle-income economies in the quality of publications and 12th overall in the quality of innovation among middle-income economies.
TABLE 1 .3
Top 10 universities in middle-income economies
China Tsinghua University 87.2
China Peking University 82.6
China Fudan University 77.6
Malaysia Universiti Malaya (UM)* 62.6
Russian Federation Lomonosov Moscow State University 62.3
Mexico Universidad Nacional Autónoma de México (UNAM) 56.8
Brazil Universidade de São Paulo (USP) 55.5
India Indian Institute of Technology Bombay (IITB) 48.2
India Indian Institute of Science (IISC) Bengaluru 47.1
India Indian Institute of Technology Delhi (IITD)** 46.6
Location
Source: QS Quacquarelli Symonds Ltd, QS World University Ranking 2018/2019Notes: Only universities among the top 3 in each economy are considered. *Shares the same rank (87th worldwide) with Rice University in the U.S.**Shares the same rank (172nd worldwide) with the University of Aberdeen in the U.K. and University of Twente in the Netherlands.
University Score

The Global Innovation Index 201928
On international patents, European economies take seven of the top 10 positions, with the other three spots going to Israel, Japan, and the Republic of Korea. Among middle-income economies, China and South Africa take the top two positions, with India and Turkey registering improvements in this indicator.
Which economies get more return on their innovation investments?On the basis of the GII data, we analyze which economies most effectively translate innovation inputs into innovation outputs.
In 2018, the GII started plotting the input-output performance of economies against each other (Figure 1.8) based on advice from the European Commission’s Competence Centre on Composite Indicators and Scoreboards (COIN) at the Joint Research Centre (JRC).
Among the high-income economies, located more towards the right of Figure 1.8, economies like Switzerland (CH), the Netherlands (NL) and Sweden (SE) produce more outputs relative to their levels of innovation inputs. In turn, Singapore (SG), the United Arab Emirates, Brunei Darussalam (BN), and Trinidad and Tobago (TT) are producing less outputs for their levels of inputs invested in innovation.
Viet Nam (VN) and India (IN) stand out as lower middle-income economies that are getting much more outputs for their inputs. Their levels are above those of high-income oil-rich economies like Kuwait (KW), Qatar (QA), Bahrain (BH), and Oman (OM) (Figure 1.8, Highlight 1).
Within upper middle-income economies, China stands out for producing innovation outputs that are comparable to those of Germany (DE), the U.K., Finland (FI), and Israel (IL), but at a lower level of innovation inputs invested. Assuming that both inputs and outputs are properly measured, both the U.S. and China produce similar outputs, with the U.S. investing more on the input side (Figure 1.8, Highlight 2).
Various economies at different levels of development have comparable output levels, although the efforts on the input side differ. With significantly lower investments on the input side, Zambia (ZM), a low-income economy, achieves the same level of outputs as Brunei, a high-income economy (Group 1). The Czech Republic (CZ) also achieves the same level of outputs as Singapore (SG), yet at much lower levels of input (Group 3).
Which countries lead their respective regions?Sub-Saharan Africa (24 economies)
For several editions, the GII has noted that Sub-Saharan Africa performs relatively well on innovation (Table 1.2). Since 2012, Sub-Saharan Africa has had more economies among the group of innovation achievers than any other world region.
As in 2018, South Africa takes the top spot among all economies in the region (63rd), followed by Kenya (77th), Mauritius (82nd), Botswana (93rd), Rwanda (94th), Senegal (96th), and the United Republic of Tanzania (97th). Among these, Kenya, Rwanda, and Senegal improve their GII ranking compared to 2018, while South Africa, Mauritius, Botswana, and the Republic of Tanzania drop positions.
The remaining 19 economies in this region can be found at ranks lower than 100. Five of them have improved since 2018: Uganda (102nd), Côte d’Ivoire (103rd), Ghana (106th), Nigeria (114th), and Burkina Faso (117th).
Because of improved data coverage, Ethiopia (111th) and Burundi (128th) are covered in the GII rankings this year (Appendix IV).
Central and Southern Asia (9 economies)
Economies of the Central and Southern Asia region have seen further improvements in their GII rankings in 2019, with five economies improving their rankings and India moving forward into the top half of the GII.
India maintains its top place in the region, moving up five spots—from 57th last year to 52nd this year. The Islamic Republic of Iran remains 2nd in the region, moving up four positions to take the 61st spot. Kazakhstan moves down five positions, ranking 79th this year. The remaining economies rank in order within the region as follows: Sri Lanka ranks 89th this year, followed by Kyrgyzstan (90th), Tajikistan (100th), Pakistan (105th), Nepal (109th), and Bangladesh (116th).
India ranks 52nd in the GII this year, gaining five positions since 2018. It remains 1st in the region and moves up to the 4th position in the GII rankings among lower-middle-income economies. India has also outperformed on innovation relative to its GDP per capita for nine years in a row, as shown in Table 1.2. The country confirms its rank among the top 50 economies in two pillars—Market sophistication (33rd) and Knowledge and technology outputs (32nd)—with the latter being the pillar in which India ranks the highest this year. Thanks to higher scores in patent families in two or more offices and the quality of scientific publications, India remains the 26th economy in the quality of innovation aggregate and the 2nd after China among middle-income economies (Figure 1.7).
India's improvement this year is largely due to its relative performance and less so to new GII data or methods. It improves in four of the seven GII pillars.
The pillar that improves the most is Knowledge and technology outputs, where the country gains 11 spots. Ranking improves for several variables—the most notable gains are in IP-related variables, notably Patents by origin and PCT patents by origin, and IP receipts, which benefits from a methodological changes (Appendix IV). In this pillar, India maintains its top position in ICT services exports, where it ranks 1st in the world, and in labor productivity growth (4th).

Chapter 1 29
FIGURE 1 .8
Innovation input/output performance by income group, 2019
Source: Global Innovation Index Database, Cornell, INSEAD, and WIPO, 2019.
70
60
50
40
30
20
10
0
20 30 40 50 60 70 80
▲ Output score⊲ Input score
● Lower-middle income● Low income
— Fitted values● High income● Upper-middle income
AE United Arab EmiratesBH BahrainBN Brunei DarussalamCH SwitzerlandCN China
CZ Czech RepublicDE GermanyFI FinlandIL IsraelIN IndiaKW Kuwait
NL NetherlandsOM Oman QA QatarSE SwedenSG SingaporeTT Trinidad and Tobago
TZ United Republic of TanzaniaUS United States of AmericaVN Viet NamZM Zambia
Group 1
Group 3
Group 2
CH
SENL
USFI
DE
SGCZ
AEKW
QABH
OMTT
BN
ILCN
VN
IN
ZM
TZ
Highlight 2
Highlight 1

The Global Innovation Index 201930
FIGURE 1 .9
India ahead of average lower middle-, upper middle-, and high-income economies, 2019
100
80
60
40
20
0
Source: Global Innovation Index Database, Cornell, INSEAD, and WIPO, 2019.
Gross expenditure
on R&D
Intellectualproperty
payments
▲ GII 2019 Score
High-tech imports
Citabledocuments
H-index
High- & medium-high
tech manufactures
QS top 3 universityrankings
Gross capital formation
Graduates in science &
engineering
Growth rate GDP per person
engaged
E-participation
ICT servicesexports
● Upper-middle income● Lower-middle income
● India● High income
The other three GII pillars that move up this year are all related to innovation inputs; these are Institutions (77th, up by 3), Human capital and research (53rd, up by 3), and Market sophistication (33rd, up by 3).
In Institutions, the majority of the indicators present a better ranking this year. The most notable gains are found in Political and operational stability where a new indicator is used this year (Appendix IV) and in Ease of starting a business, thanks to important reforms aimed at streamlining bureaucratic procedures.49
In Human capital and research, two important variables improve: Gross expenditure on R&D and Global R&D companies (a relative strength for the country). In the former, despite improvement, India is still 50th. Its share in world R&D expenditures has increased since the mid-1990s, but less sharply than other middle-income countries, such as China, or other Asian powerhouses, such as the Republic of Korea (Figure 1.9). In Global R&D companies, India reaches the 15th spot as the
second middle-income economy. In this pillar, the indicator Graduates in science and engineering (7th) remains a relative strength for the country. Thanks to the quality of its top 3 universities—the Indian Institute of Technology (Delhi and Bombay) and the Indian Institute of Science in Bengaluru, India achieves a relatively strong ranking in the indicator quality of universities (21st).
In Market sophistication, six of the nine indicators improve, and some quite substantially. Ease of getting credit (20th), Microfinance gross loans (23rd), Market capitalization (20th), and Venture capital deals (30th) all gain positions. In this pillar, Intensity of local competition also contributes to the improved performance of the country, moving up 23 positions.
The other three GII pillars—Infrastructure (79th), Business sophistication (65th), and Creative outputs (78th)—lose in relative strengths to other countries. In these pillars, the largest drops are found in Logistics performance, Females employed with advanced degrees, and Printing and other media.

Chapter 1 31
Significant improvements are found in some pillars—for example, in State of cluster development. This is also confirmed in the Special Section: Cluster Rankings, highlighting the performance of Bengaluru, New Delhi, and Mumbai. In addition, High-tech imports move up by 24 spots, in part reflecting improved data (Appendix IV).
While India improved in the GII ranking, some relative weaknesses still persist. These include Environmental performance, New businesses, and Entertainment and media market.
Finally, it is worth noting that while India’s data coverage is among the highest in the GII, two important indicators—notably GERD financed by business and GERD financed by abroad—are still missing. Moreover, a significant number of indicators are outdated. Almost half of them are in the pillar Human capital and research, with Education having 4 out of 5 variables outdated.
Many relate to research—Researchers, R&D intensity (GERD as a percentage of GDP), R&D performed by business, and
Research talent in business enterprise. The availability of complete innovation metrics would help obtain a fuller picture of India’s performance. The country could also benefit greatly from updating and measuring all aspects of R&D more systematically. One example is the indicator on Global R&D companies’ expenditures, which improved further this year and reflects the efforts of the Indian private sector in R&D.
The sub-region of Central Asia is noteworthy for starting to prioritize innovation activities and related policies in a sustained manner. Three economies in the sub-region are covered in the GII 2019: Kazakhstan (79th), Kyrgyzstan (90th) and Tajikistan (100th) (Figure 1.10). Uzbekistan is making continuous progress in data collection to be included in the GII rankings.
FIGURE 1.10
GII 2019 rankings of economies in Central Asia
Source: Global Innovation Index Database, Cornell, INSEAD, and WIPO, 2019.
■ Top 80 ■ Top 90 ■ Top 100 ■ Not covered
Kazakhstan
Turkmenistan
Uzbekistan
Kyrgyzstan
Tajikistan

The Global Innovation Index 201932
Infrastructure (64th), Market sophistication (84th), Business sophistication (40th), and Knowledge and technology outputs (58th). Most of Brazil’s strengths are in Human capital and research, mainly in Expenditure on education (18th), Gross expenditure on R&D (28th), Global R&D companies (22nd), and the Quality of universities (25th). Other input strengths for Brazil are Government’s online service (22nd), E-participation (12th), Domestic market scale (8th), Intellectual property payments (10th) and High-tech imports (28th). The quality of publications measured through the H-index (24th) is the only Innovation output strength for Brazil. Two areas of opportunity are also noted among Innovation inputs in the General infrastructure (102nd) and Credit (105th) sub-pillars: Gross capital formation (115th) and Microfinance gross loans (74th). Relative weaknesses in Innovation Outputs include the labor productivity growth (96th) and New businesses (98th).
Peru ranks 69th in the GII 2019, moving up two positions from 2018. The economy progresses the most in Human capital and research (66th), Infrastructure (65th), and Creative outputs (79th). Peru gains positions in Human capital and research due in part to available coverage for indicators in Tertiary education (21st)—mainly Tertiary enrolment (28th), and Graduates in science & engineering (36th). Peru has available data this year for School life expectancy, also located in this pillar. In Infrastructure, the country gains the most positions in Information and communication technologies (70th) and, in particular, in Government’s online service (41st), and E-participation (36th). In Market sophistication, Peru moves up various positions in Trade, competition, and market scale (30th) due in part to a higher performance in Applied tariff rate (6th). Also in that pillar, it gains the most positions in Venture capital deals and the Intensity of local competition. In Business sophistication, Knowledge workers (27th) remains a strength for Peru, assisted by Females employed with advanced degrees (38th). On Innovation Outputs, Peru moves up in Creative outputs with gains in Entertainment & media market (41st) and Printing and other media (10th). Despite these improvements, Peru is relatively weak in Gross expenditure on R&D, Global R&D companies, University/industry research collaboration, and Joint venture-strategic alliance deals. Knowledge diffusion is also a relative weakness, both in ICT services exports and FDI net outflows.
Northern Africa and Western Asia (19 economies)
Israel, ranking 10th worldwide (up by 1), continues to be the most innovative economy in Northern Africa and Western Asia region since 2009. Cyprus (28th, up by 1) is second in the region, while the United Arab Emirates (36th, up by 2) achieves the third spot for the fourth consecutive year.
Five of the 19 economies in the region, including Cyprus (28th)—the only European Union member state in the region, the United Arab Emirates (36th), Georgia (48th), and Turkey (49th) rank within the top 50 of the GII. All of these countries exhibit an improvement in their global GII rank. Other countries which demonstrate an upward movement in the innovation landscape are Armenia (64th), Morocco (74th), Lebanon (88th), and Egypt (92nd).
Latin America and the Caribbean (18 economies)
Latin America and the Caribbean economies all position below the top 50 in the GII ranking. Most economies in this region are either among the upper middle- or lower middle-income groups, with five exceptions in the high-income group: Chile, Uruguay, Trinidad and Tobago, Argentina, and Panama, which are now classified in this group. The top 3 economies in the region are Chile (51st), followed by Costa Rica (55th), and Mexico (56th). Following this group are Uruguay (62nd), Brazil (66th), and Colombia (67th). An additional eight economies in the region stand in the top 100. These are Peru (69th), Argentina (73rd), Panama (75th), Jamaica (81st), the Dominican Republic (87th), Trinidad and Tobago (91st), Paraguay (95th), and Ecuador (99th).
Despite incremental improvements and encouraging initiatives, no clear signs for significant take-off are visible in Latin America and the Caribbean.50 The GII has insisted that Latin America’s innovation potential remains largely untapped.51
Despite these concerns, this year, one economy from this region—Costa Rica—continues to outperform on innovation relative to its level of development (Figure 1.6). Chile is the only country in the region that scores above the regional average in all GII pillars. Colombia and Peru score above the regional average in all innovation input pillars, showing potential for take-off in the future. Costa Rica, Mexico, and Uruguay show higher scores than the regional average in the innovation output pillars.
Chile ranks 51st, down from last year but remaining at the top of the region for the fourth consecutive year. It has rankings in the top 50 in three pillars: Institutions (39th), Infrastructure (50th), and Market sophistication (49th), and also shows an improved position in the latter two and Human capital and research (57th). Chile’s best improvement at the pillar level is in Market sophistication, with higher rankings in Credit (51st) assisted by the indicators Microfinance gross loans, and in Trade, competition, and market scale, with improved Applied tariff rate and better perceived Intensity of local competition. On the Input side, it shows higher performance in Education (60th) with improvement in the Expenditure on education, Government funding per pupil, and School life expectancy (20th). In the Outputs, Chile advances in Knowledge creation (56th), with better rankings in Patents by origin, PCT patents by origin, and Utility models. It does well in Online creativity (58th), thanks to an improved measurement of Mobile app creation introduced this year. Chile shows areas of weakness in Business sophistication (53rd), particularly in high-tech imports, and ICT services imports (88th), both part of Knowledge absorption (49th). Outputs weaknesses for Chile are ICT services exports, Industrial designs by origin, and Creative goods exports.
Brazil ranks 66th in the GII this year, down two positions from 2018. In the Innovation Input Sub-Index, it improves in Institutions (80th) and Human capital and research (48th). In the Innovation Output Sub-Index, it improves in Knowledge and technology outputs (58th). Brazil ranks in the top 25 in several indicators in the 5 GII pillars: Human capital and research (48th),

Chapter 1 33
one position this year, ranking 43rd overall. Following next are Mongolia (53rd), the Philippines (54th), Brunei Darussalam (71st), Indonesia (85th) and Cambodia (98th).
As noted in previous editions of the GII, most economies in the ASEAN region continue to improve their GII rankings through better performance in innovation, R&D, and economic development indicators. Figure 1.11 shows the scores for selected input and output indicators for the ASEAN economies featured in the GII this year. Singapore is the top performer in most of these indicators. Viet Nam continues to lead in areas like Expenditure on education and trademarks, as well as on High-tech imports. Indonesia does the same in Gross capital formation and Thailand in Creative goods exports, where it shares the top position with Malaysia. With Myanmar still absent from the global innovation landscape, Cambodia is still the newest ASEAN economy to be part of the GII. Cambodia remains 2nd in the group in FDI net inflows and also takes that position in Joint venture-strategic alliance deals, behind Singapore. Yet, Cambodia shows the weakest scores in the group on most of the selected input and output indicators, with its lowest performance in Patents by origin.
In input indicators, Viet Nam performs well in FDI net inflows but shows relatively low scores in Tertiary enrolment and Females employed with advanced degrees. It scores lowest in the group in Knowledge-intensive employment. In outputs, Viet Nam scores well in Scientific and technical publications, Creative goods and exports, and Patents by origin, and shows its lowest score for Citable documents H-index. This year Thailand is 2nd in Tertiary enrolment and quality of scientific publications and 3rd in Trademarks by origin. Malaysia scores well in both selected inputs and outputs, taking the 2nd position in Females employed with advanced degrees, Expenditure on education, High-tech imports, Patents by origin, and Scientific and technical articles. It also scores well in Tertiary enrolment, Knowledge- intensive employment, Joint venture and strategic alliance deals, and the quality of scientific publications. While performing at the top in Gross capital formation and relatively well in Tertiary enrolment, Indonesia shows relatively low scores for most of the other selected indicators. Philippines also displays relatively good scores for over half of the selected indicators, achieving 2nd in Trademarks and 3rd in Females employed with advanced degrees, High-tech imports, and Creative goods exports.
Lastly, in input indicators, Brunei Darussalam ranks 2nd in both Gross capital formation and Knowledge-intensive employment, and 3rd in Expenditure on education. The difference between the top performers and the other economies for these selected indicators is slightly larger for input indicators than for output indicators.
Malaysia ranks 35th, keeping the same position as last year. It remains among the middle-income economies that are bridging the innovation divide, thanks to its first rank in indicators such as High-tech net exports and Creative goods exports (Box 2). This year, Malaysia improves its rankings in four of the seven GII pillars: Institutions (40th), Infrastructure (42nd), Business sophistication (36th), and Creative outputs (44th). At the indicator level, the most significant improvements are in
Qatar (65th, down by 14) and Oman (80th, down by 11) experience the largest decrease in their global ranking relative to other countries in the region. Saudi Arabia (68th), Tunisia (70th), Bahrain (78th), Azerbaijan (84th), Jordan (86th), Algeria (113th) and Yemen (129th) see a more modest decline in their GII position.
Georgia (48th) leaps 11 positions—the highest move in the region. Such improvements are reinforced by Georgia’s productivity growth rate where it ranks 8th, positive FDI net inflows (11th), and Ease of starting a business, where it positions 2nd globally. At the pillar level, Georgia improved its position in six of seven pillars, most remarkably in Market sophistication (15th). In the Investment sub-pillar, Georgia now places 1st globally (up from 21st last year), and is the 2nd top economy for the ease of protecting minority investors.
Algeria (113) sees its ranking decrease in all but one pillar this year—Human capital and research (74th), where it moves up by 6 spots. At the sub-pillar level, a weakening position is seen in Innovation linkages (122nd, down from 104th) and Knowledge absorption (117th, down from 86th). More notably, Algeria moves down in indicator High-tech net imports, placing 53rd (down from 28th last year). Algeria remains strong in its position of Infrastructure (81st), particularly in indicator Gross capital formation, where it has a 2nd spot globally, and in Human capital and research (74th), where it places as the 9th economy in Graduates in science and engineering.
Algeria is currently implementing a new innovation strategy in a move towards a knowledge-based society. The aim is to put firms at the center of innovation, to foster the innovation of small- and medium-sized enterprises, to aim at better integration of science and innovation policies, and to achieve better linkages between scientific research and innovation in firms. Several legislative changes are on the way in this regard.52
South East Asia, East Asia, and Oceania (15 economies)
This year, as in last year, all economies in the South East Asia, East Asia, and Oceania region rank in the top 100 of the GII. All economies in the region, except for Cambodia and Brunei Darussalam, are also in the top 100 of the Innovation Input and Innovation Output Sub-Indices.
Seven of the 15 economies in the region rank in the top 25 of the GII: Singapore (8th), the Republic of Korea (11th), Hong Kong (China) (13th), China (14th), Japan (15th), Australia (22nd) and New Zealand (25th). The top three economies in the region—Singapore, the Republic of Korea, and Hong Kong (China)—also rank in the top 25 of the GII in both the Innovation Input and Output Sub-Indices.
Malaysia ranks 8th in the region after New Zealand, and 35th overall in the GII. Viet Nam makes important progress this year, moving up three positions and reaching the 42nd place overall. It gains between 4 and 8 positions in three of the GII pillars: Human capital and research (61st), Market sophistication (29th) and Knowledge and technology outputs (27th). Thailand gains

The Global Innovation Index 201934
FIGURE 1 . 1 1
ASEAN in selected innovation indicators, 2019
100
80
60
40
20
0
Source: Global Innovation Index Database, Cornell, INSEAD, and WIPO, 2019.
Patents by origin
▲ GII 2019 Score
Scientific & technical articles
Citable documents H-index
Trademarks by origin
Creative goods exports
● Viet Nam● Thailand
● Singapore● Malaysia
● Indonesia● Cambodia
● Philippines● Brunei Darussalam
▲ GII 2019 Score ● Viet Nam● Thailand
● Singapore● Malaysia
● Indonesia● Cambodia
● Philippines● Brunei Darussalam
100
80
60
40
20
0
Tertiary enrolment
Expenditure on education
Gross capital formation
Knowledge-intensive
employment
Joint venture-strategic
alliance deals
High-tech imports
FDI net inflows
Females employed
with advanced degrees

Chapter 1 35
Belgium (23rd), and Estonia (24th). It should be noted that most of the economies in this region have the fewest missing values, leading them to display the most accurate GII rankings (Appendix IV). This includes the following economies with 100% data coverage in the Innovation Input Sub-Index, the Innovation Output Sub-Index, or both: Finland, Denmark, Germany, France, Austria, the Czech Republic, Spain, Italy, Portugal, Hungary, Poland, Romania, and the Russian Federation.
The following 18 economies are among the top 50, with most of them maintaining relatively stable rankings since 2014: the Czech Republic (26th), Malta (27th), Spain (29th), Italy (30th), Slovenia (31st), Portugal (32nd), Hungary (33rd), Latvia (34th), Slovakia (37th), Lithuania (38th), Poland (39th), Bulgaria (40th), Greece (41st), Croatia (44th), Montenegro (45th), the Russian Federation (46th), Ukraine (47th), and Romania (50th).
The remaining European economies remain among the top 100 economies overall. The region’s rankings continue as follows: Serbia (57th), the Republic of Moldova (58th), North Macedonia (59th), Belarus (72nd), Bosnia and Herzegovina (76th), and Albania (83rd).
France remains stable in 16th position in the GII 2019. It ranks in the top 15 economies in four of the seven GII pillars: Human capital and research and Infrastructure (11th in both), Market sophistication (12th), and Knowledge and technology outputs (15th). It shows top ranks in indicators such as Global R&D companies (7th), Environmental performance (2nd), and Venture capital deals (5th). This year, France gains most positions in Knowledge and technology outputs (15th, up by 4) where High- and medium-high-tech manufactures move to the 13th spot. At the indicator level, the most remarkable improvements are found in JV–strategic alliance deals and FDI net inflows, although the latter is also a weakness. Possibly benefiting from a new turn in French innovation and science policies, important gains are also visible in other areas related to universities and research, such as Graduates in science and engineering, Researchers, Quality of universities, and University/industry research collaboration. Despite these encouraging trends, France presents relatively weak ranks in Pupil-teacher ratio, Gross capital formation, Ease of getting credit, GERD financed by abroad, Utility models by origin, productivity growth, New businesses, ICT services exports, and Printing and other media.
The Russian Federation maintains the 46th position in the GII this year. The Russian Federation improves two positions in the Innovation Inputs Sub-index (41st) and ranks 59th in the Innovation Outputs Sub-Index, losing three positions from last year. On the inputs side, it increases its rank in Infrastructure pillar (62nd, up by 1), with higher rankings in Information and communication technologies (29th, up by 8), and in indicators ICT use (45th), Government’s online services (25th), and E-participation (23rd). Although losing one position in Human capital and research (23rd), this year the Russian Federation shows strengths in Tertiary education (14th) due to its high levels of Tertiary enrolment (17th) and Graduates in science and engineering (10th). Pupil-teacher ratio is also a strength for the Russian Federation in the sub-pillar Education. In Market sophistication, its rank in Trade, competition, and domestic market scale are signaled as a relative strength
quality of universities, where it ranks 17th this year, and GERD performed by business as well as GERD financed by business, where it takes the 25th and 16th positions respectively. In several indicators, Malaysia ranks in the top 10; these include Graduates in science and engineering (8th), University-industry research collaboration (8th), State of cluster development (8th), and several trade-related variables—such as High-tech imports and High-tech net exports (respectively 3rd and 1st) and Creative goods exports (1st). Despite these top ranks, areas of relative weakness include PISA results, GERD financed by abroad, and Trademarks and industrial designs by origin.
Thailand ranks 43rd, gaining one position from last year. Like last year, the country remains among the innovation achievers of the GII 2019 and among the middle-income economies that are bridging the innovation divide (Box 2 and Table 1.2). This year, four of the seven GII pillars see improvements: Institutions (57th), Human capital and research (52nd), Business sophisti-cation (60th), and Knowledge and technology outputs (38th). Thailand benefits from improvements in important indicators such as R&D expenditures, Research talent, and GERD financed by business, where it ranks 4th, as well as Tertiary enrolment, Researchers, and Patent families. As for other ASEAN economies, Thailand is exceptionally strong in trade-related variables, ranking 8th in High-tech net exports and 1st in Creative goods exports. If addressed, some weak areas—including PISA results, Venture capital deals, GERD financed by abroad, and ICT services imports and exports—could help the economy progress even faster on its path to catch up.
Philippines ranks 54th this year, gaining several positions from last year. While some changes to the GII model explain a small part of this leap, newly available metrics give a more thorough assessment of the country’s innovation performance, which itself shows some signs of progress. Almost all GII pillars move up, except for Market sophistication. In the Business sophistication (32nd) pillar, the Philippines improves in almost all the indicators related to Innovation linkages and gains top ranks in High-tech imports (5th) and Research talent (6th). In Knowledge and technology outputs (31st), the data for indicator High-tech net exports became available this year and the country ranks 1st. Four other indicators rank in the top 10: Firms offering formal training (9th), productivity growth (10th), ICT services exports (8th), and Creative goods exports (8th). Despite these top ranks, Philippines presents a number of weak areas, which are concentrated in the innovation input side; these include Ease of starting a business, Ease of getting credit, Expenditure on education, and Global R&D companies. Scientific and technical articles and New businesses are relatively weak on the innovation output side. Europe (39 economies)
As in the last two years, in this year’s edition of the GII, 15 of the top 25 economies are from Europe. Seven of them are in the top 10 of the GII 2019: Switzerland (1st), Sweden (2nd), the Netherlands (4th), the U.K. (5th), Finland (6th), Denmark (7th), and Germany (9th). Following these innovation leaders, top 25 economies from the region are Ireland (12th), France (16th), Luxembourg (18th), Norway (19th), Iceland (20th), Austria (21st),
FIGURE 1 . 1 1
ASEAN in selected innovation indicators, 2019
100
80
60
40
20
0
Source: Global Innovation Index Database, Cornell, INSEAD, and WIPO, 2019.
Patents by origin
▲ GII 2019 Score
Scientific & technical articles
Citable documents H-index
Trademarks by origin
Creative goods exports
● Viet Nam● Thailand
● Singapore● Malaysia
● Indonesia● Cambodia
● Philippines● Brunei Darussalam
▲ GII 2019 Score ● Viet Nam● Thailand
● Singapore● Malaysia
● Indonesia● Cambodia
● Philippines● Brunei Darussalam
100
80
60
40
20
0
Tertiary enrolment
Expenditure on education
Gross capital formation
Knowledge-intensive
employment
Joint venture-strategic
alliance deals
High-tech imports
FDI net inflows
Females employed
with advanced degrees
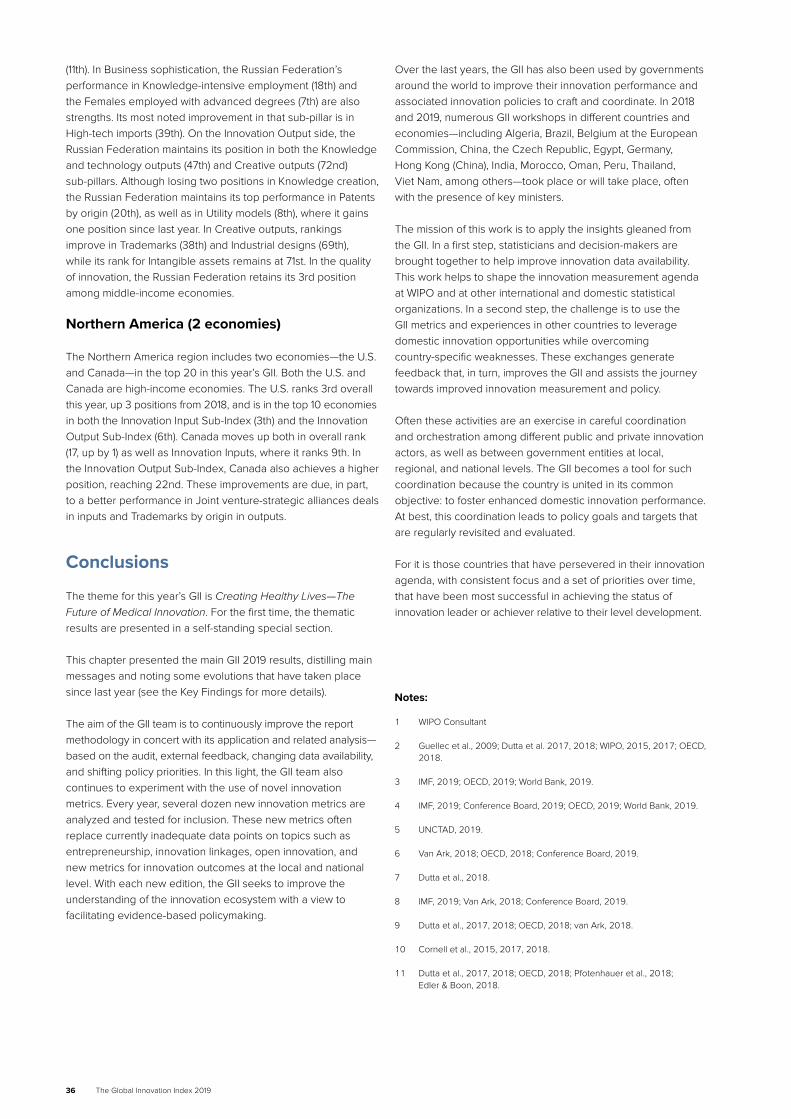
The Global Innovation Index 201936
Over the last years, the GII has also been used by governments around the world to improve their innovation performance and associated innovation policies to craft and coordinate. In 2018 and 2019, numerous GII workshops in different countries and economies—including Algeria, Brazil, Belgium at the European Commission, China, the Czech Republic, Egypt, Germany, Hong Kong (China), India, Morocco, Oman, Peru, Thailand, Viet Nam, among others—took place or will take place, often with the presence of key ministers.
The mission of this work is to apply the insights gleaned from the GII. In a first step, statisticians and decision-makers are brought together to help improve innovation data availability. This work helps to shape the innovation measurement agenda at WIPO and at other international and domestic statistical organizations. In a second step, the challenge is to use the GII metrics and experiences in other countries to leverage domestic innovation opportunities while overcoming country-specific weaknesses. These exchanges generate feedback that, in turn, improves the GII and assists the journey towards improved innovation measurement and policy.
Often these activities are an exercise in careful coordination and orchestration among different public and private innovation actors, as well as between government entities at local, regional, and national levels. The GII becomes a tool for such coordination because the country is united in its common objective: to foster enhanced domestic innovation performance. At best, this coordination leads to policy goals and targets that are regularly revisited and evaluated.
For it is those countries that have persevered in their innovation agenda, with consistent focus and a set of priorities over time, that have been most successful in achieving the status of innovation leader or achiever relative to their level development.
(11th). In Business sophistication, the Russian Federation’s performance in Knowledge-intensive employment (18th) and the Females employed with advanced degrees (7th) are also strengths. Its most noted improvement in that sub-pillar is in High-tech imports (39th). On the Innovation Output side, the Russian Federation maintains its position in both the Knowledge and technology outputs (47th) and Creative outputs (72nd) sub-pillars. Although losing two positions in Knowledge creation, the Russian Federation maintains its top performance in Patents by origin (20th), as well as in Utility models (8th), where it gains one position since last year. In Creative outputs, rankings improve in Trademarks (38th) and Industrial designs (69th), while its rank for Intangible assets remains at 71st. In the quality of innovation, the Russian Federation retains its 3rd position among middle-income economies.
Northern America (2 economies)
The Northern America region includes two economies—the U.S. and Canada—in the top 20 in this year’s GII. Both the U.S. and Canada are high-income economies. The U.S. ranks 3rd overall this year, up 3 positions from 2018, and is in the top 10 economies in both the Innovation Input Sub-Index (3th) and the Innovation Output Sub-Index (6th). Canada moves up both in overall rank (17, up by 1) as well as Innovation Inputs, where it ranks 9th. In the Innovation Output Sub-Index, Canada also achieves a higher position, reaching 22nd. These improvements are due, in part, to a better performance in Joint venture-strategic alliances deals in inputs and Trademarks by origin in outputs.
Conclusions
The theme for this year’s GII is Creating Healthy Lives—The Future of Medical Innovation. For the first time, the thematic results are presented in a self-standing special section.
This chapter presented the main GII 2019 results, distilling main messages and noting some evolutions that have taken place since last year (see the Key Findings for more details).
The aim of the GII team is to continuously improve the report methodology in concert with its application and related analysis— based on the audit, external feedback, changing data availability, and shifting policy priorities. In this light, the GII team also continues to experiment with the use of novel innovation metrics. Every year, several dozen new innovation metrics are analyzed and tested for inclusion. These new metrics often replace currently inadequate data points on topics such as entrepreneurship, innovation linkages, open innovation, and new metrics for innovation outcomes at the local and national level. With each new edition, the GII seeks to improve the understanding of the innovation ecosystem with a view to facilitating evidence-based policymaking.
Notes:
1 WIPO Consultant
2 Guellec et al., 2009; Dutta et al. 2017, 2018; WIPO, 2015, 2017; OECD, 2018.
3 IMF, 2019; OECD, 2019; World Bank, 2019.
4 IMF, 2019; Conference Board, 2019; OECD, 2019; World Bank, 2019.
5 UNCTAD, 2019.
6 Van Ark, 2018; OECD, 2018; Conference Board, 2019.
7 Dutta et al., 2018.
8 IMF, 2019; Van Ark, 2018; Conference Board, 2019.
9 Dutta et al., 2017, 2018; OECD, 2018; van Ark, 2018.
10 Cornell et al., 2015, 2017, 2018.
11 Dutta et al., 2017, 2018; OECD, 2018; Pfotenhauer et al., 2018; Edler & Boon, 2018.
Chapter 1 37
12 The relationship between innovation (as measured by GII scores) and country characteristics such as size and economic structure was initially explored in Box 3 of the GII 2018 (Cornell et al., 2018). We have updated this analysis with the most recent data from GII 2019.
13 Lee, 2019.
14 Dutta et al., 2013; Bergquist et al., 2017, 2018.
15 In 2003, only 5 companies in middle-income economies made it to the top private sector R&D spenders (Hernández et al., 2018)
16 The number of researchers in countries like Brazil, China, India and Turkey, even if still low relative to the global stock of knowledge, have been rapidly increasing. These increases have been equal to 40% in China in the period 2008-2016, 38% in India between 2010-2015; 62% in Turkey between 2008-2016, and will be likely to continue rising given the countries’ increased financial investments in R&D (UNESCO-UIS, 2019).
17 Innovators across the globe filed 3.17 million patent applications in 2017, up 5.8% for an eighth straight yearly increase. International patent applications filed under WIPO’s Patent Cooperation Treaty (PCT) in 2018 grew at an annual growth of 3.9%, a ninth consecutive year of growth (WIPO, 2018; WIPO, 2019a).
18 Dutta et al., 2018.
19 R&D Magazine, 2018.
20 OECD, 2019.
21 Hernandez et al., 2018. R&D by the Higher Education sector and government institutions grew by 1.6% and 1.3% respectively (OECD, 2019)
22 In particular given that innovation is a long-term investment that requires action in the short-term, but with impacts that are noticeable in the medium- to long-term.
23 WIPO, 2017; Chen et al., 2017; WIPO, 2019b.
24 In current U.S. dollars.
25 This year the Innovation Efficiency Ratio has been replaced by an analysis of the connection between Innovation Inputs and Innovation Outputs, initially introduced in the GII 2018 (see Section “Which economies are best in translating innovation investments into innovation outputs?”).
26 Further details on the GII framework and the indicators used are provided in Appendix I. It is important to note that each year the indicators included in the computation of the GII are reviewed and updated to provide the best and most current assessment of innovation. Methodological issues—such as missing data, the revision of scaling factors, and the number of economies covered in the sample—also impact the year-on-year comparability of the rankings. Details on the changes done this year to the methodological framework and an analysis of the factors impacting year-on-year comparability are provided in the Appendix IV.
Most notably, a more stringent criterion for the inclusion of countries in the GII was adopted in 2016, following the Joint Research Centre (JRC) recommendation of past GII audits (Appendix IV). Economies were included in the GII 2019 only if 66% of data were available within each of the two sub-indices and if at least two sub-pillars in each pillar could be computed.
27 See also Chaminade et al. (2018), and in particular Box 6.1; Lee, 2019.
28 On innovation in informal settings, see also Kraemer-Mbula and Wunsch-Vincent, 2016.
29 One caveat applies: the indicator framework of the GII is adapted marginally every year. This year-on-year comparison of data completeness is based on the given data requirements of the year in question, and not a fully stable list of indicators over time. For the most part, however, the indicators are the same; coverage is comparable. That caveat aside, Algeria, Brunei Darussalam, Burkina Faso, Mozambique, the United Arab Emirates, Yemen and Zimbabwe stand out as economies where data coverage has improved the most.
30 See: http://www.oecd.org/innovation/blue-sky.htm; https://www.nsf.gov/statistics/2018/nsb20181/
31 Australian Department of Industry, Innovation and Science and Australian Academy of Technology and Engineering (2019). WIPO is a contributor to this process. The review singles out a few areas where innovation data is in need of urgent improvement and in particular the following:
• non-R&D-based knowledge and idea creation• capability to implement innovation • new products and processes • start-ups and spinouts • stocks and flows of intangible capital• employee skills• innovation outputs and impacts• entrepreneurship culture
32 Armenia is no longer part of the top 10 lower middle-income economies this year, as it has been reclassified as an upper middle-income economy. It ranks 15th among the 34 upper middle-income economies covered in the GII 2019.
33 Tajikistan was reclassified into the low-income group this year by the World Bank, after being part of the lower middle-income group up until 2018. See: https://datahelpdesk.worldbank.org/knowledgebase/arti-cles/906519-world-bank-country-and-lending-groups
34 Economies that outperform on innovation relative to their level of development (by at least 10% relative to their peers at the same levels of GDP).
35 This year, the U.S. had no available data for four indicators used in the GII (in GII 2018 it did not have available data for six indicators). Data availability is crucial in interpreting the GII results in particular across years.
36 See also https://www.reuters.com/article/us-broadcom-domicile/broad-com-completes-move-to-u-s-from-singapore-idUSKCN1HB34G
37 Note that model changes influence Israel’s improvement in this indicator. See Appendix IV for more information.
38 Particularly, Hong Kong (China) re-exports high-tech products previously imported from elsewhere, notably from China, resulting in high levels of so-called re-exports.
39 For this Box, contributions have also been received from the Innovation and Technology Bureau, Government of the Hong Kong Special Administrative Region from Hong Kong (China), from the Ministry of State and Ministry of the Economy, Luxembourg Government, Grand Duchy of Luxembourg and from the Intellectual Property Office of Singapore (IPOS), Government of Singapore.
40 See also https://www.nrf.gov.sg/rie2020/advanced-manu-facturing-and-engineering; https://www.nrf.gov.sg/rie2020/health-and-biomedical-science; https://www.nrf.gov.sg/rie2020/services-and-digital-economy; and https://www.nrf.gov.sg/rie2020/ur-ban-solutions-and-sustainability.
41 See also https://www.ssg.gov.sg/wsq/Industry-and-Occupational-Skills/intellectual-property.html
42 See https://digital-luxembourg.public.lu/news/national-ai-vision-prioritiz-es-people

The Global Innovation Index 201938
43 On June 25, 2018, the European Commission decided to establish the EuroHPC joint headquarters in Luxembourg. It will equip the EU with a pre-exascale and petascale infrastructure (1015 calculation operations per second) by 2020, and develop the technologies and applications needed to reach the exascale level (1018 calculation operations per second) by 2023. Lastly, the University of Luxembourg is home to an HPC and a €10 million budget was allocated for a new, faster one. More information is available at: https://meco.gouvernement.lu/
44 See https://digital-luxembourg.public.lu/news/luxembourg-gains-ac-cess-ai-technology-expertise-new-nvidia-partnership
45 See https://infrachain.com
46 More information available at: https://portal.education.lu/digital4educa-tion/; and https://www.skillsbridge.lu/
47 See https://space-agency.public.lu/en.html; and https://spaceresources.public.lu/en.html
48 For additional insights from App Annie on the mobile economy, check out App Annie’s State of Mobile in 2019 report, available at: https://www.appannie.com/insights/market-data/the-state-of-mobile-2019/
49 See http://www.doingbusiness.org/content/dam/doingBusiness/coun-try/i/india/IND.pdf
50 De la Torre and Ize, 2019 have argued that success in international markets, as measured by rising share of world exports, has been the route to income convergence in Latin American countries, including Peru, Chile, Uruguay, Costa Rica, the Dominican Republic,and Panama. See also: https://www.economist.com/the-americas/2019/05/30/why-lat-in-americas-economies-are-stagnating
51 See http://www.tradeforum.org/news/Latin-Americas-innovation-poten-tial-remains-largely-untapped/
52 In December 2018, Algeria hosted a two-day GII conference to build on its innovation strength in the formulation of new innovation policies.
References
Australian Department of Industry, Innovation and Science and Australian Academy of Technology and Engineering. (2019, March). Improving Innovation Indicators, Consultation paper. Retrieved from https://consult.industry.gov.au/office-of-innovation-and-science-australia/innova-tion-metrics-review-further-consultation/.
Bergquist, K., Fink, C., & Raffo, J. (2017). Special Section: Identifying and Ranking the World’s Largest Clusters of Inventive Activity. In S. Dutta, B. Lanvin, and S. Wunsch-Vincent (Eds.), Global Innovation Index 2017: Innovation Feeding the World. Ithaca, Fontainebleau, and Geneva: Cornell, INSEAD, and WIPO.
——— . (2018). Special Section: Identifying and Ranking the World’s Largest Science and Technology Clusters. In S. Dutta, B. Lanvin, and S. Wunsch-Vincent (Eds.), Global Innovation Index 2018: Energizing the World with Innovation. Ithaca, Fontainebleau, and Geneva: Cornell, INSEAD, and WIPO.
Chaminade, C., Lundvall, B-A., & Haneef, S. (2018). National Innovation Systems and Economic Development. Advanced Introduction to National Innovation Systems. Cheltenham: Edward Elgar.
Chen, W., Gouma, R., Los, B. et al. (2017). Measuring the income to intangibles in goods production: A global value chain approach. WIPO Economic Research Working Paper No. 36. Retrieved from https://www.wipo.int/edocs/pubdocs/en/wipo_pub_econstat_wp_36.pdf.
Conference Board. (2019, April). The Conference Board Productivity Brief 2019.
Cornell University, INSEAD, & WIPO. (2015). Global Innovation Index 2015: Effective Innovation Policies for Development. S. Dutta, B. Lanvin, & S. Wunsch-Vincent (Eds.). Ithaca, Fontainebleau, and Geneva: Cornell, INSEAD, and WIPO.
——— . (2017). Global Innovation Index 2017: Innovation Feeding the World. S. Dutta, B. Lanvin, & S. Wunsch-Vincent (Eds.). Ithaca, Fontainebleau, and Geneva: Cornell, INSEAD, and WIPO.
——— . (2018). Global Innovation Index 2018: Energizing the World with Innovation. S. Dutta, B. Lanvin, & S. Wunsch-Vincent (Eds.). Ithaca, Fontainebleau, and Geneva: Cornell, INSEAD, and WIPO.
De la Torre, A. & Ize A. (2019). Latin American Economic Growth: Hopes, Disappointments, and Prospects. In M. Shifter and B. Binetti (Eds.), Unfulfilled Promises—Latin America Today. Inter-American Dialogue. Retrieved from: https://www.thedialogue.org/analysis/unfulfilled-promis-es-latin-america-today/
Dutta, S., Benavente, D., Lanvin, B. et al. (2013). Local Dynamics Keep Innovation Strong in the Face of Crisis. In S. Dutta and B. Lanvin (Eds.), Global Innovation Index 2013: The Local Dynamics of Innovation. Ithaca and Fontainebleau: Cornell, INSEAD.
Dutta, S., Escalona Reynoso, R., Garanasvili, A. et al. (2018). The Global Innovation Index 2018: Energizing the World with Innovation [Chapter 1]. In S. Dutta, B. Lanvin, & S. Wunsch-Vincent (Eds.), The Global Innovation Index 2018: Energizing the World with Innovation. Ithaca, Fontainebleau, and Geneva: Cornell, INSEAD, and WIPO.
Dutta, S., Escalona Reynoso, R., Litner, J. et al. (2016). Winning with Global Innovation. In S. Dutta, B. Lanvin, & S. Wunsch-Vincent (Eds.), Global Innovation Index 2016: Winning with Global Innovation. Ithaca, Fontaineb-leau, and Geneva: Cornell, INSEAD, and WIPO.
——— . (2017). The Global Innovation Index 2017: Innovation Feeding the World [Chapter 1]. In S. Dutta, B. Lanvin, & S. Wunsch-Vincent (Eds.), Global Innovation Index 2017: Innovation Feeding the World. Ithaca, Fontainebleau, and Geneva: Cornell, INSEAD, and WIPO.
Edler, J., & Boon, W. P. (2018). The next generation of innovation policy: Directionality and the role of demand-oriented instruments— Introduction to the special section. Science and Public Policy, 45(4): 433–434. DOI: https://doi.org/10.1093/scipol/scy026
Guellec, D., & Wunsch-Vincent, S. (2009). Policy Responses to the Economic Crisis: Investing in Innovation for Long-Term Growth. Paris: OECD Publishing. Retrieved from https://www.oecd.org/sti/42983414.pdf.
Griffith, B. (2011). Middle-Income Trap. In R. Nallari, S. Yusuf., B. Griffith, and R. Bhattacharya (Eds.), Frontiers in Development Policy. A Premier on Emerging Issues. Washington, DC: World Bank.
Hernández, H., Grassano, N., Tübke, A. et al. (2018). The 2018 EU Industrial R&D Investment Scoreboard; EUR 29450 EN; Publications Office of the European Union, Luxembourg, 2018, ISBN 978-92-79-97293-5, doi:10.2760/131813, JRC113807. Retrieved from http://iri.jrc.ec.europa.eu/scoreboard18.html
IMF (International Monetary Fund). (2019, April). World Economic Outlook: Global Prospects and Policies. World Economic Outlook (WEO): Growth Slowdown, Precarious Recovery. Washington, DC: IMF.
Kraemer-Mbula, E., & Wunsch-Vincent, S. (2016). The Informal Economy in Developing Nations: Hidden Engine of Innovation? Cambridge: Cambridge University Press. DOI:10.1017/CBO9781316662076.
Lee, K. (2013). Schumpeterian Analysis of Economic Catch-up: Knowledge, Path-Creation, and the Middle-Income Trap. New York: Cambridge University Press.
——— . (2019). The Art of Economic Catch-Up: Barriers, Detours and Leapfrog-ging in Innovation Systems. Cambridge: Cambridge University Press. DOI:10.1017/9781108588232
National Science Board. (2018). Science and Engineering Indicators 2018.

Chapter 1 39
NSB-2018-1. Alexandria, VA: National Science Foundation. Retrieved from https://www.nsf.gov/statistics/indicators/.https://www.nsf.gov/statis-tics/2018/nsb20181/
OECD (Organisation for Economic Co-operation and Development). (2018). OECD Science, Technology and Innovation Outlook 2018: Adapting to Technological and Societal Disruption. OECD Publishing, Paris. DOI: https://doi.org/10.1787/sti_in_outlook-2018-en
——— . (2019). Interim Economic Outlook: Global Growth Weakening as Some Risks Materialise. OECD Publishing, Paris. Retrieved from https://www.oecd.org/economy/outlook/global-growth-weakening-as-some-risks-ma-terialise-OECD-interim-economic-outlook-handout-march-2019.pdf
Pfotenhauer, S. M., Juhl, J., & Aarden, E. (2018). Challenging the ‘deficit model’ of innovation: Framing policy issues under the innovation imperative. Research Policy, 48(4): 895-904. DOI: https://doi.org/10.1016/j.respol.2018.10.015
R&D Magazine. (2018). 2018 Global R&D Funding Forecast, Winter 2018. Retrieved from: https://digital.rdmag.com/researchanddevelop-ment/2018_global_r_d_funding_forecast?pg=1#pg1
United Nations Conference on Trade and Development (UNCTAD). (2019). UNCTAD’s World Investment Report 2019, Geneva: UNCTAD.
UNESCO (United Nations Educational, Scientific and Cultural Organization). (2015). UNESCO Science Report: Towards 2030. Paris. UNESCO. Retrieved from https://en.unesco.org/unesco_science_report
UNESCO-UIS (UNESCO Institute for Statistics). (2019, April). UNESCO-UIS Science & Technology Data Center.
Van Ark, B. (2018, May 8). We may be missing the productivity revival in the global economy. Stronger demand and more investment bode well for a new phase of growth. Financial Times. Retrieved from https://www.ft.com/content/864b7dba-489b-11e8-8c77-ff51caedcde6
WIPO (World Intellectual Property Organization). (2011). World Intellectual Property Report: The Changing Face of Innovation. Geneva: WIPO.
——— . (2015). World Intellectual Property Report: Breakthrough Innovation and Economic Growth. Geneva: WIPO.
——— . (2017). World Intellectual Property Report: Intangible Assets and Global Value Chains. Geneva: WIPO.
——— . (2018). World Intellectual Property Indicators 2018. Geneva: WIPO. Retrieved from https://www.wipo.int/publications/en/details.jsp?id=4369
——— . (2019a). Patent Cooperation Treaty Yearly Review–2019. Geneva: WIPO. Retrieved from https://www.wipo.int/publications/en/details.jsp?id=4424
——— . (2019b). [Unpublished]. World Intellectual Property Report. Geneva: WIPO.
World Bank. (2019). Global Outlook: Darkening Skies. Global Economic Prospects: Darkening Skies. Washington, DC: World Bank.

The Global Innovation Index 201940

Theme Section 41
The 2019 edition of the Global Innovation Index (GII) focuses on the theme Creating Healthy Lives—The Future of Medical Innovation. In the years to come, medical innovations such as artificial intelligence (AI), genomics, and mobile health applications will transform the delivery of healthcare in both developed and emerging nations.
The key questions addressed in this edition of the GII include:
• What is the potential impact of medical innovation on society and economic growth, and what obstacles must be overcome to reach that potential?
• How is the global landscape for research and development (R&D) and medical innovation changing?
• What health challenges do future innovations need to address and what types of breakthroughs are on the horizon?
• What are the main opportunities and obstacles to future medical innovation and what role might new policies play?
Five key messages emerge:
1. High quality and affordable healthcare for all is important for sustainable economic growth and the overall quality of life of citizens. While significant progress has been achieved across many dimensions over the last decades, significant gaps in access to quality healthcare for large parts of the global population remain.
2. Medical innovations are critical for closing the gaps in global healthcare provision. These innovations are happening across multiple dimensions, including core sciences, drug development, care delivery, and organizational and business models. In particular, medical technology related innovations are blossoming, with medical technology patents more numerous and growing at a faster path than pharmaceuti-cal patents for the last decade. However, some challenges need to be overcome—notably, a decline in pharmaceutical R&D productivity and a prolonged process for deploying health innovations due to complex health ecosystems.
3. The convergence of digital and biological technologies is disrupting healthcare and increasing the importance of data integration and management across the healthcare ecosystem. New digital health strategies need to focus on creating data infrastructure and processes for efficient and safe data collection, management, and sharing.
4. Emerging markets have a unique opportunity to leverage medical innovations and invest in new healthcare delivery models to close the healthcare gap with more developed markets. Caution should be taken to ensure that new health innovations, and their related costs, do not exacerbate the health gap between the rich and poor.
5. To maximize the potential for future health innovation, it is important to encourage collaboration across key actors, increase funding from public and private sources, establish and maintain a skilled health workforce, and carefully evaluate the costs and benefits of medical innovations.
THEME SECTION
CREATING HEALTHY LIVES—THE FUTURE OF MEDICAL INNOVATIONSoumitra Dutta and Rafael Escalona Reynoso, SC Johnson College of Business, Cornell UniversitySacha Wunsch-Vincent, Lorena Rivera León, and Cashelle Hardman, World Intellectual Property Organization (WIPO)
The section has benefited from comments by Hans Georg Bartels, Kyle Bergquist, Ridha Bouabid, Amy Dietterich, Carsten Fink, Mosahid Khan, Charles Randolph, and Ola Zahran, all at WIPO, Bruno Lanvin, INSEAD, and Bertalan Mesko, Author, The Medical Futurist. It draws on all outside chapter contributions that follow.

The Global Innovation Index 201942
The impact of medical innovation— a high-stakes policy matterOver the last century, improvements in healthcare have led to a doubling of life expectancy in both high-income and developing economies.1 This increase in life expectancy has helped expand the global workforce, drive economic growth, and improve the quality of life for many.2
Innovations—on both technological and non-technological fronts—have contributed to better health and economic development. Improved hygiene, enhanced public health planning, the persistent pursuit of R&D in the medical field, and the increasing role of information technologies have been key. In particular, the decades after World War II are often considered the “golden age’’ of medical innovation. Many of the tools of modern medicine were developed between 1940 and 1980, including antibiotics, the polio vaccine, heart procedures, chemotherapy, radiation, and medical devices such as joint replacements.3
The benefits of improved health via innovation are becoming accessible to a growing number of people within and across developed and developing countries. As societies get richer, wealth buys better health and a higher quality of life, with more people in low- and middle-income economies having access to functioning health systems.4
Indeed, over the last decade, global spending on health has been growing faster than gross domestic product (GDP)—at roughly double the rate.5 Health spending has been growing even more rapidly in low- and middle-income countries—close to 6% on average—than in high-income countries, which average 4%. In 2018, global healthcare expenditures amounted to US$7.6 trillion, accounting for around 10% of global GDP (Figure T-1.1).6 By 2020, estimated global health expenditures will reach close to US$9 trillion.7
While significant progress in global healthcare has been made over the last couple of decades, there are major challenges that remain. A large proportion of the world’s population lacks access to quality healthcare. Increasing health costs are also an issue, in particular, out-of-pocket payments by private households without complete medical insurance.
Medical innovation is expected to contribute to increased cost-effectiveness in the healthcare sector in the years to come. It is also key to the realization of the health-related United Nations Sustainable Development Goals (Box T-1.1).8
The United Nations (UN) Sustainable Development Goals (SDGs) are a collection of 17 global goals that seek to make significant progress on global matters, including health, by 2030. Specifically, SDG 3 sets global health targets in several areas. Importantly, it specifies the goal of universal health coverage—including access to essential healthcare services—and sets targets to support R&D for vaccines for communicable diseases, for example.9
To reach the 2030 goals, the UN General Assembly adopted health-related political declarations.10 The SDGs and the ensuing declarations recognize the critical role of innovation and R&D. As a result, SDG Indicators were set up to monitor innovation and R&D progress—for example, SDG Indicators
9.5.1-2 measure gross domestic R&D expenditure on health (health GERD) as a percentage of gross domestic product, and the number of health researchers is measured in full-time equivalents (FTEs) per million inhabitants.11
In September 2019, the United Nations High-level Political Forum (HLPF) on Sustainable Development will convene to review the progress made on the first four-year cycle of the 2030 Agenda. The GII 2019—with up-to-date metrics on the underlying innovation systems—aims to be a useful guide, helping policymakers and other stakeholders engage in crafting coherent policies and implementation strategies to harness innovation for the achievement of SDG 3.
BOX T-1 .1
Sustainable development goals—innovation, health, and the United Nations
Now the logical question for economists and policymakers is how health innovations will continue to drive well-being and economic growth in the future.
At a glance, upcoming health innovations and their possible contributions are impressive. Policy and news reports abundantly cover much-anticipated innovations in health and medicine and the resulting improvements that patients will see.
If history is any guide, one has to avoid unwarranted optimism as to how fast health innovation arises and how efficiently it is deployed. Productivity in healthcare R&D has slowed in some respects.12 Also, traditionally, innovation in health has diffused more slowly relative to other sectors.13 This is due to the complex health innovation ecosystem and the seriousness of the outcomes that healthcare addresses: the life and well-being of people.14
While there is significant potential for new medical innovations, several obstacles must be overcome. Though the demand for innovation is high, there are concerns that the golden years of medical innovation may be behind us, as measured by decreases in major medical advances by year,15 drug approvals,16 and research productivity.17

Theme Section 43
FIGURE T-1.1
Evolution of healthcare expenditures over time, in US$, and as a share of GDP
2000 2004 2008 2012 2016
1.1
1.2
1.3
1.4
0.9
1.0
0.8
1.7
1.8
1.9
2.0
1.5
1.6
Source: Authors based on Xu et al., 2018; WHO data.
▲ Growth of health expenditures as a % per capita⊲ Year
— Low income — Lower-middle income
— Upper-middle income — High income
▲ Government spending on health as a % of GDP ⊲ Year
— Low income — Lower-middle income
— Upper-middle income — High income
2000 2004 2008 2012 2016
1.5
2.0
2.5
3.0
0.5
1.0
0.0
4.5
5.0
5.5
6.0
3.5
4.0
The Global Innovation Index 201944
Slow feedback and knowledge flow between the actors can slow collaboration—often due to a lack of communication channels or lack of shared standards on how to exchange data and information across silos. These inefficiencies can lead to wasted time. They can also negatively affect patient outcomes (Chapter 8).29
It is noteworthy that the slow diffusion of medical innovations is more than a developed versus developing country issue. Many innovations fail to achieve widespread and sustainable use, even in economies with advanced health systems. This is true although many medical innovations are about applying existing technologies from non-medical fields in new ways in the health sector.30
Medical innovations are only slowly gravitating to developing countries; large segments of the population in the developing world remain underserved in terms of access to medical technologies and basic healthcare.31 A broader diffusion of existing technologies and practices would pay large dividends (Chapter 2). The development of drugs, vaccines, medical devices, and overall healthcare operations designed for low-resource settings is key (Chapter 11–PATH).32 Currently, market forces still result in pharmaceutical R&D targeting diseases that are typical of affluent societies, to the detriment of developing economies.33
Furthermore, while the focus is often on access to medicines, inadequate attention is given to contributions that would ensure the functioning of health systems in developing countries. Investments in innovations aimed at the delivery of healthcare are needed (Chapter 12–Ministry of Health, Egypt and Chapter 13–Narayana Health, India).34
Finally, too much effort is still spent on fixing health problems rather than preventing them in the first place (Chapter 9–iamYiam).35 Technological and non-technological medical innovations go a long way to remedy this situation and improve prevention.
Medical innovations are changing the landscape of health In the years to come, new technologies are likely to enrich the provision of healthcare at a rapid pace; they will help face some of the new medical challenges outlined in the section above while producing efficiencies and disrupting current ways of delivering healthcare.
This is not only about new technology. Innovation in health system organization—for example, how doctors are consulted, how monitoring is done, how diagnoses are established and shared, and how prevention takes place—is also on the way.36
These evolutions might help fix innovation obstacles in the health system, such as overcoming knowledge silos—created when specific medical actors keep data and information about patients to themselves—or allowing for a better assessment of the true impact of particular medical technologies or pharmaceutical inventions.
Pharmaceutical research is limited by rapidly increasing costs and a decline in major drug approvals over the past decade.18 Cost increases are caused by multiple factors, including extensive research requirements, lengthier approval processes, longer development times, higher marketing expenditures, and a concentration of R&D investments in areas where the risk of failure is high.19 To develop a drug for Alzheimer’s, the process involves a commitment of nearly 10 years from research to use on patients—plus over 4 years of preclinical discovery and testing (Chapter 6–Eli Lilly and Company).20 Diminishing returns on drug innovation may also be reducing incentives to invest in breakthroughs.
While later sections in this chapter point to a possible, recent turnaround in pharma R&D productivity, progress is generally slow with respect to some tenacious health challenges (Chapter 2–Bhaven Sampat). Many acute and chronic conditions have few treatment options beyond marginally mitigating disease progression and/or reducing discomfort resulting from symptoms. For some illnesses, such as cancer, depression, or Alzheimer’s (Chapter 6), innovation has not yet produced breakthrough cures; failure rates and clinical trial setbacks are high.
Scientific advances in life sciences or biotech have often not been matched by a corresponding increase in medical innovation.21 Efforts by pharmaceutical firms to overcome the pipeline challenge by buying biotechnology firms have not always produced the desired effect.22 Gene development technologies have not created the breakthroughs many might have expected.23 Moreover, new health-related research fields such as neuroscience are still in their infancy.
From the innovation diffusion perspective, the speed of adoption of existing medical innovations has been slow too, primarily due to complex interactions between actors in the health ecosystem.24 Moving medical innovations “from bench to bedside” is a long process, sometimes extending over several decades. Multiple parties may be involved, such as private and public research actors, including medical technology, pharmaceutical firms, and universities; providers of healthcare, such as physicians and hospitals; patients; and payers, such as medical insurance companies.25 Finally, the whole process is constrained by regulatory contexts and incentives, set by government or independent regulators to ensure safety and access.26
The fragmentation of healthcare across different actors—such as payers, insurers, providers, and manufacturers—leads to challenges (Chapter 8–GE Healthcare). The underlying innovation incentives for technology or new process adoption are regularly misaligned. Technologies to decrease the role of particular medical activities—such as minimally invasive surgery—might find lukewarm reception from a particular medical profession, slowing its deployment.27 In addition, patients and insurers frequently have differing views as to the acceptable cost of new treatments.28

Theme Section 45
patents, with biotech at half that volume. Medical technology-related PCT filings are also nearly double the volume of pharmaceutical patents today, reflecting the increased importance of innovation in medical technology relative to pharmaceutical (Figure T-1.3). Finally, as evidenced in the 2019 Special Section on Identifying and Ranking the World’s Largest Science and Technology Clusters, medical technology is now the most frequent field of patenting in these top clusters, overtaking pharmaceutical patents for the first time.45
Reflecting the increased spread of innovative capacity, Mexico and India are increasingly specialized in pharmaceutical patents relative to other patents—with India home to some of the top 10 pharmaceutical firms worldwide, such as Sun Pharmaceutical, Lupin, and Dr. Reddy’s.46 In absolute numbers of patents, China is also now the most important pharmaceutical patent origin (Table T-1.1).
As regards patent filings under the Patent Cooperation Treaty (PCT) at WIPO, medical technologies accounted for close to 7% of all applications in 2017 and were the fourth largest technology filing area in 2018, with IT-related fields topping this ranking.47
However, the above figures likely underestimate actual medical innovation activity. Health-related R&D and patenting are taking place in fields and firms as diverse as electrical and mechanical engineering, instruments—in particular, optics and measurement, chemistry, and the IT sector. Patents in the field of artificial intelligence are also forecast to be significant to future health systems.48
Furthermore, a number of the process and organizational innovations that are bound to have a positive influence in the health sector are not captured by R&D and patenting figures in the traditional health sector, as reported in the above data.
Is a revival of medical research productivity on the horizon?
While pharmaceutical research productivity might have been slower in past decades, more recently, new health-related patenting and drugs on the market are signaling a possible reversal of the productivity crisis outlined earlier in this chapter.49
Since 2015, the number of drugs in Phase I and II clinical trials has grown substantially.50 The launch of new drugs, such as novel active substances, has increased in the last decade and is expected to continue growing. The drug approval rates at the U.S. Food and Drug Administration (FDA) and the European Medicines Agency (EMA) increased in 2017 and 2018; they are considerably higher today than in prior years.51 The pending lineup of immunotherapies and drugs with the potential to become blockbusters—for diabetes, hepatitis C, and cancer—is trending upward.52
Does this mean the end of the medical research productivity decline? This is hard to answer with certainty. The number of drugs in Phase III clinical trials has yet to reach the high levels seen during the golden times of pharmaceutical innovation; a large percentage of drugs still fail to make the transition from
Beyond increasing innovation at the corporate- and country-level, the geographical landscape of global medical innovation is changing too.
Historically, the markets for health innovation—as well as the innovation pipelines themselves—have been concentrated in high-income economies, mostly in Europe and North America.37 Today, the most R&D-intensive health industry firms are still in Europe and the United States of America (U.S.): Switzerland, the United Kingdom (U.K.), and the U.S. are the top holders of pharmaceutical patents; the Netherlands and the U.S. lead in medical technology patents; and Switzerland and the U.K. lead in biotech patents.
However, the geography of medical innovation is changing to progressively include emerging economies. The demand for improved health services is growing in these regions, driven by a rising middle class and robust economic growth. This is not only true for large emerging economies such as China and India but also Mexico, Viet Nam, Indonesia, South Africa, Nigeria, and many others.38 The innovation capacity in emerging markets is also growing, with increasing R&D, patents, and investment in these countries (Figures T-1.2 and T-1.3, and Table T-1.1). Accordingly, pharmaceutical companies based in emerging economies have shown strong growth in recent years.39
A resurgence of health R&D
After the financial crisis in 2009 and a significant slowdown across sectors, worldwide pharmaceutical R&D plateaued at around US$135 billion for more than five years, including in 2013. Investment in health began a resurgence after 2013, reaching US$177 billion worldwide in 2019.40
Overall, the healthcare sector is one of the most important investors in innovation, second to the information technology (IT) sector. Pharmaceutical, biotech, and medical device firms are among the top global corporate investors in R&D, spending over US$100 billion annually; this represents close to 20% of global annual R&D expenditures by the top 2,500 R&D firms across all sectors.41
Health R&D is also a significant component of total private and public R&D expenditures, ranging from 10 to 12% of average annual R&D expenditures in high- and middle-income economies to about 14% in low-income economies.42 In countries such as the U.K. and the U.S., governments place an even greater focus on R&D, allocating 20 to 25% of all government R&D expenditures on health.43
Medical technology patents growing faster than pharmaceutical patents
Patents in pharmaceuticals, biotechnology, and medical technology have been growing strongly year-over-year for the last decade (Figure T-1.2). Medical technology patents grew the fastest at close to 6% per year. This puts medical technologies among the top five fastest-growing technology fields since 2016, with the other four being IT-related fields.44 Consequently, medical technology patents are now as numerous—about 100,000 patents worldwide—as pharmaceutical
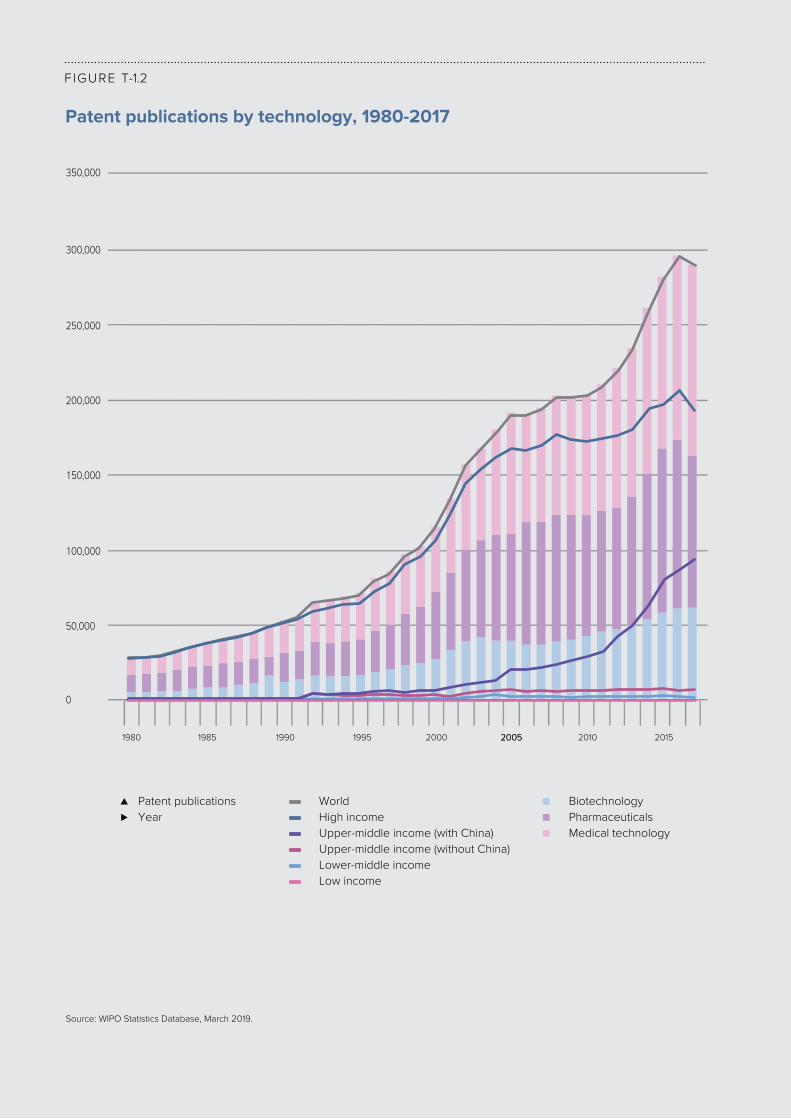
The Global Innovation Index 201946
FIGURE T-1.2
Patent publications by technology, 1980-2017
1980 1985 1990 1995 2000 2005 2010 2015
100,000
150,000
50,000
0
250,000
300,000
200,000
350,000
Source: WIPO Statistics Database, March 2019.
▲ Patent publications ⊲ Year
— World — High income — Upper-middle income (with China) — Upper-middle income (without China) — Lower-middle income — Low income
■ Biotechnology ■ Pharmaceuticals■ Medical technology
2005

Theme Section 47
FIGURE T-1.3
Patent Cooperation Treaty (PCT) filings by technology, 2000-2018
2000 2002 2004 2006 2008 2010 2012 2014 2016 2018
10,000
15,000
5,000
0
25,000
30,000
20,000
35,000
Source: WIPO Statistics Database, March 2019.
▲ Patent publications ⊲ Year
MEDICAL TECHNOLOGY
PHARMACEUTICALS
BIOTECHNOLOGY
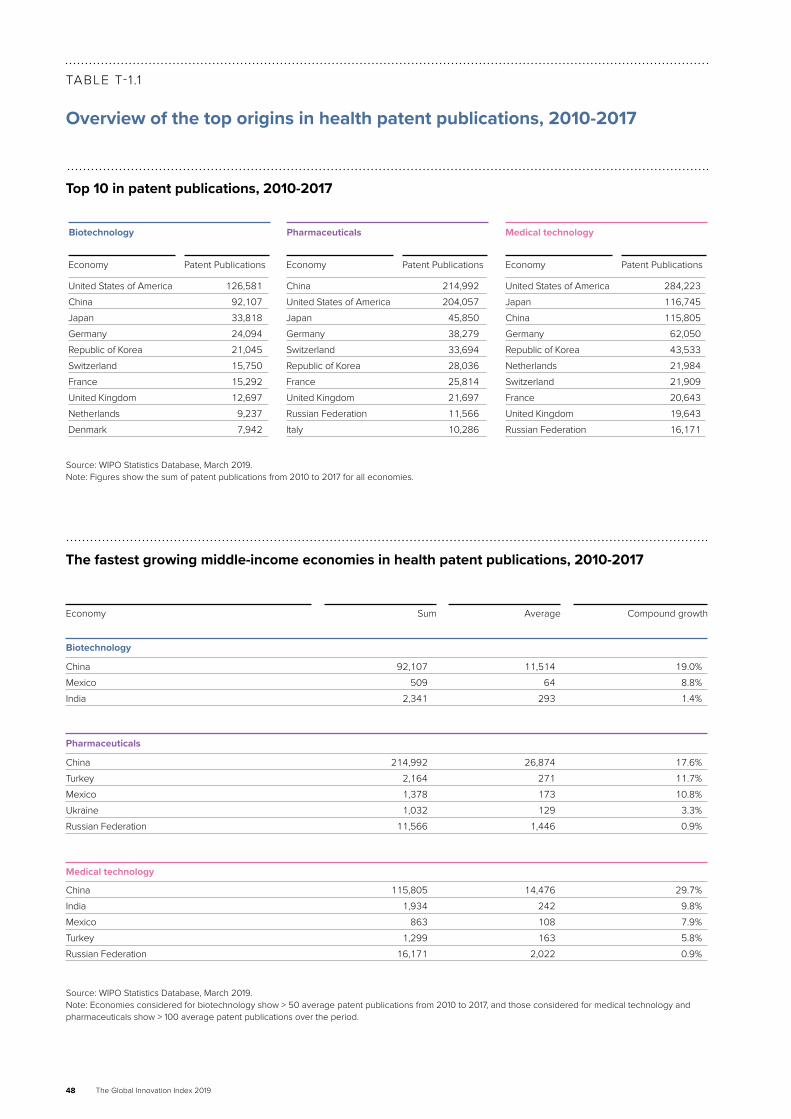
The Global Innovation Index 201948
TABLE T-1 .1
Overview of the top origins in health patent publications, 2010-2017
Source: WIPO Statistics Database, March 2019.Note: Figures show the sum of patent publications from 2010 to 2017 for all economies.
United States of America 284,223
Japan 116,745
China 115,805
Germany 62,050
Republic of Korea 43,533
Netherlands 21,984
Switzerland 21,909
France 20,643
United Kingdom 19,643
Russian Federation 16,171
Medical technology
Patent PublicationsEconomy
Biotechnology
United States of America 126,581
China 92,107
Japan 33,818
Germany 24,094
Republic of Korea 21,045
Switzerland 15,750
France 15,292
United Kingdom 12,697
Netherlands 9,237
Denmark 7,942
Patent PublicationsEconomy
Pharmaceuticals
China 214,992
United States of America 204,057
Japan 45,850
Germany 38,279
Switzerland 33,694
Republic of Korea 28,036
France 25,814
United Kingdom 21,697
Russian Federation 11,566
Italy 10,286
Patent PublicationsEconomy
China 92,107 11,514 19.0%
Mexico 509 64 8.8%
India 2,341 293 1.4%
China 214,992 26,874 17.6%
Turkey 2,164 271 11.7%
Mexico 1,378 173 10.8%
Ukraine 1,032 129 3.3%
Russian Federation 11,566 1,446 0.9%
China 115,805 14,476 29.7%
India 1,934 242 9.8%
Mexico 863 108 7.9%
Turkey 1,299 163 5.8%
Russian Federation 16,171 2,022 0.9%
Sum Average Compound growthEconomy
Source: WIPO Statistics Database, March 2019.Note: Economies considered for biotechnology show > 50 average patent publications from 2010 to 2017, and those considered for medical technology and pharmaceuticals show > 100 average patent publications over the period.
Medical technology
Biotechnology
Pharmaceuticals
Top 10 in patent publications, 2010-2017
The fastest growing middle-income economies in health patent publications, 2010-2017

Theme Section 49
Organizational and process innovations are also improving healthcare delivery through novel approaches to research and clinical trials and new ways of delivering healthcare. These medical innovations could have a significant impact by helping overcome fragmentation of the healthcare ecosystem across different sectors—payers, insurers, providers, and manufacturers—and improving healthcare efficiency (Figure T-1.4).
IT and big data are often at the source of these innovations. New technologies, such as virtual modeling and AI techniques, enable new ways of conducting medical research (Chapter 5), facilitating breakthroughs, and increasing invention efficiency.63 Many IT-enabled innovations have the potential to affect the delivery of healthcare and mitigate rising health costs (Chapter 14). Supported by the appropriate technology, health can be monitored in real time, conditions tracked remotely, data analyzed and shared, new modes of diagnosis applied, and treatments personalized. Individuals can also have access to their health data for the first time in history.64
These technologies have also begun impacting mobile health possibilities, some of which are critical for prevention and health monitoring. The technologies are starting to support a shift from a “react and revive” focus on ill-health to a “predict and prevent” model of wellness (Chapter 3, Chapter 7, Chapter 9, and Chapter 17–Thailand).65 Examples include telemedicine applications, remote monitoring, portable diagnostics, and the delivery of medicines via drones. The surveillance of public health threats and the availability of data to drive policy and planning are key to optimizing health services in low-resource contexts (Chapter 12, Chapter 13, and Chapter 15).
The novel and better use of health data plays an important role in this context. Through big data analytics, machine learning, and AI, patient harm—and unintended consequences—may be predicted before they occur, and interventions can be provided to caregivers. Integrated data can help overcome silos and support medical professionals and care providers with insights that enable more predictive and efficient care (Chapter 5 and Chapter 8).66
The data-driven shifts in health policies and strategies could be a core driver in reordering the relationships among—and processes between—health services providers, medical equipment manufacturers, patients, governments, public research, social security, and financial/insurance companies. In this setup, the patient is at the center of better feedback flows.
As the same time, as more innovation is geared to enriching the data intensity of medical equipment and processes, it Is to be expected that the relative power of those who have the ability to collect, combine, and analyze large data sets will increase relative to that of traditional players in the health and medical arena. This may have important consequences, such as increased inequalities between the haves and the have nots of relevant technologies or a rising reliance on algorithms to make medical decisions, which may generate distrust vis-à-vis the medical profession.
Phase II to Phase III. New pharmaceutical cures are harder to come by (Chapter 2).53 While research expenditures are increasing, the return on drug-related R&D investments continues to be low.54
However, innovation is burgeoning in other increasingly health-related sectors, such as medical technologies or IT and software applications.55 Over the last five years, regulatory agencies such as the FDA have announced record rates of novel medical device approvals for mechanical heart valves, digital health technologies, and 3D printing devices.56
Process and organizational innovations in healthcare delivery are also taking place due to increased automation and efficiency. These innovations are not necessarily captured by traditional R&D and patenting figures.
Finally, some important but less high-tech—and less measurable— medical innovation is taking place in low- and middle-income countries. Countries in Africa, Central and Eastern Asia, and Latin America have witnessed the novel use of existing technologies—“frugal” or “adapted” medical innovations—with considerable impact in low-resource contexts. For example, clean “delivery kits” contain essential items that allow doctors in low-resource contexts to deliver babies more safely, while many other examples arise in countries such as India.57
Upcoming breakthroughs in medical and health innovationNovel ways to improve healthcare, to diagnose health problems, and to cure diseases are imminent (Chapter 4–National Institutes of Health, U.S. and Chapter 7–Dassault Systèmes).58 Health-related technologies and organizational innovations have the potential to disrupt existing business models, to lower healthcare costs, and to improve overall healthcare efficiency (Chapter 3–ZS Associates and Chapter 5–Tencent, China).59 Many of these medical innovations are relevant to developing countries, whether they are technological, such as 3D printing; new tools to diagnose infections, such as malaria, in Brazil (Chapter 14–CNI and SEBRAE);60 organizational, such as the improved screening for non-communicable diseases in Egypt (Chapter 12); or remote telemedicine applications in Rwanda (Chapter 15–Ministry of Health, Rwanda).61 While medical breakthroughs and their diffusion are tough to predict, the sections below describe several possible scientific and technological breakthroughs, developments in process, and organizational innovations.62
Identifying promising fields
The fields of genetics and stem cell research, nanotechnology, biologics, and brain research are promising domains for scientific breakthroughs. Breakthroughs may also come from prevention techniques and cures through new vaccines and immunotherapy, new pain management techniques, and cures for mental diseases. A large number of innovations are pending in the areas of medical devices, medical imaging and diagnostics, precision and personalized medicine, and regenerative medicine.

The Global Innovation Index 201950
FIGURE T-1.4
Promising fields for medical innovation and technologies
Sources: GII 2019 chapters, in particular Collins, 2010; Collins, 2019. Also, Kraft, 2019; Nature, 2018; Nature, 2019; Frost & Sullivan, 2018; Frost & Sullivan, 2019; European Commission, 2007; Medical Futurist, 2017; Mesko, 2018.
Genetics and stem cell research— Single-cell analysis — Gene and stem cell therapies— Genetic engineering and editing including CRISPR technology
Nanotechnology— Swallowable small devices
Biologics— Development and manufacture of complex biologics
New generation of vaccines and immunotherapy— HIV and universal flu vaccine— Cancer vaccine — Immunotherapy— New vaccine delivery methods
Pain management— Effective, non-addictive medicines for pain management
Mental health treatments— Pre-symptomatic diagnosis and treatment of Alzheimer’s disease and other cognitive declines
NEW MEDICAL TECHNOLOGIES
Medical devices— 3D printing — Cardiac devices— Implants and bionics
Medical imaging and diagnostics— Optical high-definition imaging and virtual anatomic models— Biosensors and markers— 4D human charting and virtual reality— Screening for diseases
Precision and personalized medicine— Computer-assisted surgery— Surgical robots— Personalized medicine
Regenerative medicine— Tissue engineering— Effective bioartificial pancreas
ORGANIZATIONAL AND PROCESS INNOVATIONS
Novel approaches in healthcare research — Software-based modeling to speed up research — Artificial intelligence techniques to speed up research and clinical trials
New ways of delivering healthcare— Telemedicine applications— Drone delivery of medications— Remote monitoring and portable diagnostics— Improved data sharing
NEW SCIENTIFIC BREAKTHROUGHS,TREATMENTS, AND CURES
Brain research, neurology, and neurosurgery— Characterization of the brain’s major circuits— New brain imagery for mental disorders— Migraine treatment

Theme Section 51
Still, new ideas and incentives are required to address certain health problems, particularly those affecting the least developed countries. R&D for such health innovations should be encouraged, along with special incentives and funding programs to encourage investment in health and medical research (Chapter 2).76
Finding solutions to these challenges requires multi-stakeholder consultation and coordination. The WIPO Re:Search public-private consortium, for example, shares valuable intellectual property and expertise with the health research community to promote the development of new drugs, vaccines, and diagnostics for neglected tropical diseases, malaria, and tuberculosis.77
Building functional medical innovation systems: from “bench to bedside”
Once significant health R&D is financed and carried out, effective medical innovation—and its diffusion—depend on linkages between public and private actors to translate basic research into medical applications. This is often a “giant leap” (Chapter 10).78
Businesses and policy actors need to focus on the translation of research into commercially viable applications, which may require initiating public-private collaborations, building a culture of entrepreneurship in public research bodies, stimulating academic spin-offs, and creating business incubators and centers of excellence.79
The actors involved in shaping medical innovation need to be reconsidered. Academic healthcare organizations, such as university hospitals, have traditionally been boundary-spanning organizations between care and science.80 The critical role of hospitals and doctors in future demand-led health innovation is undeniable.81 In health innovation systems, patients could also have a more central role in leading the direction of innovation.82 The same is true for insurers. Building on the information they have for individual patients and the impact of particular treatments, insurers could contribute more toward raising awareness, informing patients, and preventing diseases—moving from a payer to a more active health system player.83
In sum, hospitals, insurers, patients, and regulators will need to cooperate more to influence the rate and direction of innovation by identifying prioritized needs and redefining modes of financing that incentivize the creation and diffusion of health solutions.84
For this to materialize, the various health system actors will have to create and use better channels and to transmit relevant information and feedback.85 Improving knowledge flows across the different health actors will help. Practically speaking, this will require understanding differing needs and improving shared data infrastructures to overcome significant gaps in intersectoral communication.86
More funding instruments need to be made available to fund the stage between prototype and final product. Public-private partnerships can help in this precompetitive stage. Awards to
Opportunities and policy imperatives enabling healthy futures Business and policy imperatives are key to creating a strong foundation for medical innovation systems—ranging from stable and predictable funding to technology transfer, skills, and regulation.
Ensuring sufficient medical innovation funding
The social returns of medical innovation expenditures far exceed the private returns of R&D.67 For this reason, government R&D spending is still the primary source of scientific health research worldwide. Health-related R&D in public research institutes is of paramount importance. In fact, many state-of-the-art technologies behind healthcare innovations are initially developed as basic research projects carried out or financed by the public sector (Chapter 10–CERN, European Organization for Nuclear Research).68
It is thus vital to prioritize public funding—in particular, basic R&D. This holds true in middle- and low-income economies where health R&D expenditures are still relatively low, but also in high-income economies that have faced declining public R&D budgets—notably in health-related public research institutions—in recent years.69 Discontinuities in public funding for health R&D can lead to brain drain and training gaps for qualified staff, not to mention the obsolescence of equipment (Chapter 14).
Government investment can help set up large funds to advance particular fields of research and to create health research centers or clusters, such as the Thai Center of Excellence for Life Sciences (Chapter 17), the Brazilian SENAI Innovation Institutes (Chapter 14), or the Iranian dedicated science and technology parks (Chapter 16–Iran).70 More can be done to promote international research collaborations, which play a vital role as basic research ideas are translated into useful medical applications and solutions in the marketplace.71
There is also a need for innovative funding approaches— especially in the earliest and riskiest phases of drug discovery research (Chapter 6).72 Often companies have difficulty funding early stage or strongly disruptive technology. The ability of academic spin-offs to become sustainable ventures is uneven; they remain highly dependent upon venture capitalists, who tend to foster short-term financial growth and whose understanding of healthcare challenges and needs remains incomplete.73
Funding for product R&D, outcomes research, and market analyses of uses for health technologies in low-resource settings remain insufficient (Chapter 11).74 This is not a new consideration and positive developments are on the way.
Entities such as the Bill & Melinda Gates Foundation and Gavi—an organization bringing together public and private actors to deliver vaccines to children in low-income countries— contribute significantly to the financing and deployment of medical innovation.75

The Global Innovation Index 201952
Supporting new data infrastructure and regulatory processes
Healthcare stakeholders will require increased health data sharing to increase their efficacy. At the same, time, patients will want greater access and control over their health data, along with assurances that their information is safe.
The security and privacy of health information have been confirmed as top priorities, and regulations on personal health data are being progressively harmonized (Chapter 7). Digital health strategies that create strong data infrastructure—as well as new processes for efficient and safe data collection, management, and sharing—will be required. Agreements will also be required to define how to design and operationalize electronic health records and how to create standards and interoperable technologies.91
How to harness the promise of big data medical research while respecting the security of data and honoring patient privacy? System security and data security principles need to be established for healthcare institutions (Chapter 5). Otherwise, a lack of data governance could decrease transparency and raise concerns about security and trust (Chapter 4, Chapter 7, and Chapter 12).
In addition to data infrastructure, new regulatory processes are needed to overcome the increasing duration and complexity of clinical trials. Breakthroughs in therapy have almost always been coupled with breakthroughs in regulatory standards (Chapter 6). Yet, current regulations and health regulation agencies may not be equipped for health innovation, while current processes may be too cumbersome (Chapter 14).92 Developing countries, in particular, may not have the capacity to deal with multiple national regulatory regimes (Chapter 11).
Improving cost-benefit assessments of medical innovation
To prioritize and foster the diffusion of research and medical technologies, cost-benefit assessments must be improved.93
Going forward, health technology assessments will be increasingly important as a tool to foster industry accountability, cost-efficient solutions, and outcome-oriented innovations in healthcare.94
The idea of better assessing health innovation is not new. Sweden and Switzerland, for example, have been at the forefront of health technology assessments for many years.95 In the U.K., the National Institute for Health and Care Excellence provides evidence-based guidance on metrics, including on new medical technologies.96 More can be done to spread these approaches to more countries. Better collection, analysis, and sharing of outcomes and cost data—and possibly mandat-ing a better tracking of technology-specific health outcomes—will help in this regard.97
particular researchers or research teams to encourage high-risk, high-reward research are promising (Chapter 4), as is launching prize competitions aimed at finding innovative solutions to major health challenges.87 Other new possibilities include crowdfunding and funding through patient advocacy groups.
Policymakers can also strongly influence the translation and diffusion of research to medical applications through demand-side policies that specify innovation targets and focus areas. Moreover, governments can exert influence on the funding of innovation by influencing prices and reimbursements for health costs and by helping to align the costs and benefits of new technologies and related incentives.88
Moving from cure to prevention
Generally, as mirrored in this year’s GII chapters, attention should also gravitate from curing diseases and health conditions to preventing them in the first place. Of course, prevention goes beyond medical research and innovation. Environmental, agricultural, and infrastructure policies with an impact on clean air, clean water, or functioning sewage systems, for example, also have a well-documented impact on overall health and well-being, as well as on the incidence of disease. All too often, however, health-related policies, including those governing R&D, are treated separately—condemning medical research to a perpetual game of catch-up with diseases and conditions that are triggered or aggravated by environmental pollutants.89 The result is an inefficient use of resources.
Advancing skills and science education
The most important resource for the future of medical research will be having a workforce with the right skill sets (Chapter 4 and Chapter 7). Serious medical staff shortages exist in both developed and emerging markets. In addition, medical staff and researchers will need new sets of skills. The responsible implementation of health innovations requires local healthcare providers who are appropriately trained to use the latest technologies (Chapter 11 and Chapter 13).
To act as a bridge between research and the application of innovation in a real-life context, medical professionals with experience in research, training in the use of new hardware and software, and training in advanced research technologies—such as 3D modeling—are needed (Chapter 7 and the Australian Commonwealth Scientific and Industrial Research Organisation, CSIRO, 2017). Workforce planning is required to ensure that professionals and staff are equipped with the appropriate types of skills to put new health technologies into practice.
To ensure better transfer of knowledge, researchers and medical professionals should also move more freely between research and business contexts. Research institutes should be incentivized to employ a higher proportion of experienced industry professionals, while researchers should be encouraged to spend time in industry.90 These exchanges will also help with the translation of research to applied medical solutions.
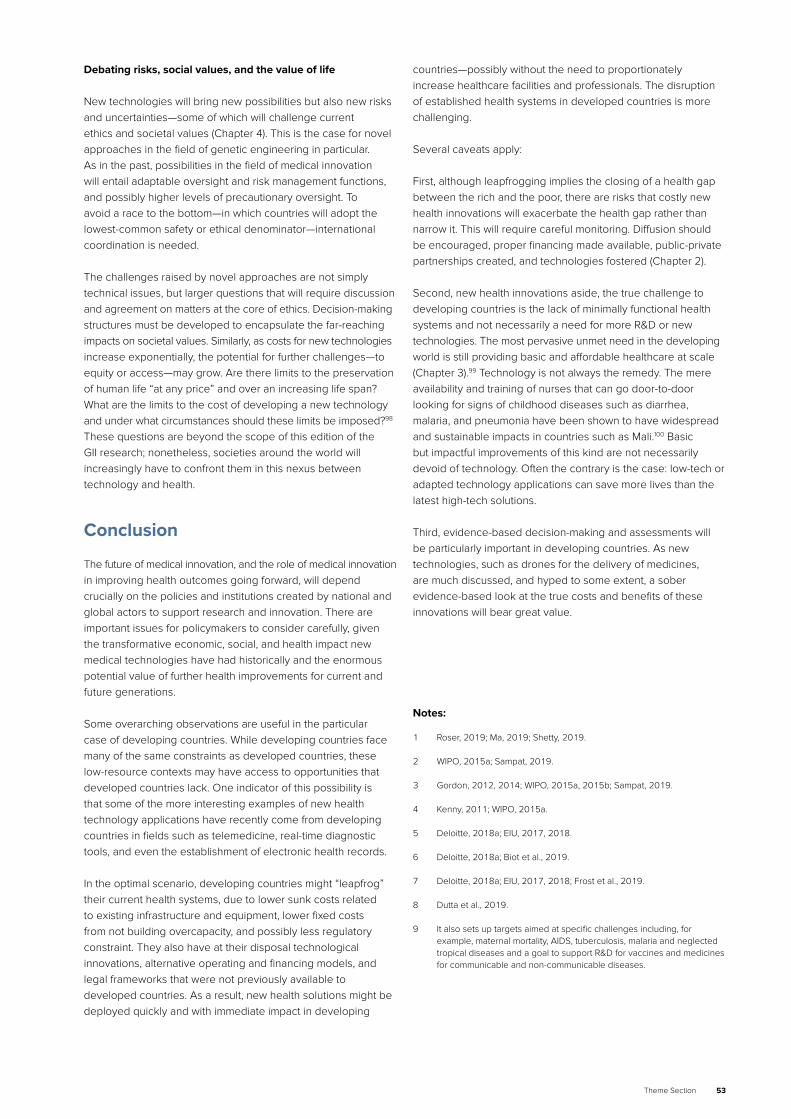
Theme Section 53
countries—possibly without the need to proportionately increase healthcare facilities and professionals. The disruption of established health systems in developed countries is more challenging.
Several caveats apply:
First, although leapfrogging implies the closing of a health gap between the rich and the poor, there are risks that costly new health innovations will exacerbate the health gap rather than narrow it. This will require careful monitoring. Diffusion should be encouraged, proper financing made available, public-private partnerships created, and technologies fostered (Chapter 2).
Second, new health innovations aside, the true challenge to developing countries is the lack of minimally functional health systems and not necessarily a need for more R&D or new technologies. The most pervasive unmet need in the developing world is still providing basic and affordable healthcare at scale (Chapter 3).99 Technology is not always the remedy. The mere availability and training of nurses that can go door-to-door looking for signs of childhood diseases such as diarrhea, malaria, and pneumonia have been shown to have widespread and sustainable impacts in countries such as Mali.100 Basic but impactful improvements of this kind are not necessarily devoid of technology. Often the contrary is the case: low-tech or adapted technology applications can save more lives than the latest high-tech solutions.
Third, evidence-based decision-making and assessments will be particularly important in developing countries. As new technologies, such as drones for the delivery of medicines, are much discussed, and hyped to some extent, a sober evidence-based look at the true costs and benefits of these innovations will bear great value.
Debating risks, social values, and the value of life
New technologies will bring new possibilities but also new risks and uncertainties—some of which will challenge current ethics and societal values (Chapter 4). This is the case for novel approaches in the field of genetic engineering in particular. As in the past, possibilities in the field of medical innovation will entail adaptable oversight and risk management functions, and possibly higher levels of precautionary oversight. To avoid a race to the bottom—in which countries will adopt the lowest-common safety or ethical denominator—international coordination is needed.
The challenges raised by novel approaches are not simply technical issues, but larger questions that will require discussion and agreement on matters at the core of ethics. Decision-making structures must be developed to encapsulate the far-reaching impacts on societal values. Similarly, as costs for new technologies increase exponentially, the potential for further challenges—to equity or access—may grow. Are there limits to the preservation of human life “at any price” and over an increasing life span? What are the limits to the cost of developing a new technology and under what circumstances should these limits be imposed?98 These questions are beyond the scope of this edition of the GII research; nonetheless, societies around the world will increasingly have to confront them in this nexus between technology and health.
Conclusion
The future of medical innovation, and the role of medical innovation in improving health outcomes going forward, will depend crucially on the policies and institutions created by national and global actors to support research and innovation. There are important issues for policymakers to consider carefully, given the transformative economic, social, and health impact new medical technologies have had historically and the enormous potential value of further health improvements for current and future generations.
Some overarching observations are useful in the particular case of developing countries. While developing countries face many of the same constraints as developed countries, these low-resource contexts may have access to opportunities that developed countries lack. One indicator of this possibility is that some of the more interesting examples of new health technology applications have recently come from developing countries in fields such as telemedicine, real-time diagnostic tools, and even the establishment of electronic health records.
In the optimal scenario, developing countries might “leapfrog” their current health systems, due to lower sunk costs related to existing infrastructure and equipment, lower fixed costs from not building overcapacity, and possibly less regulatory constraint. They also have at their disposal technological innovations, alternative operating and financing models, and legal frameworks that were not previously available to developed countries. As a result, new health solutions might be deployed quickly and with immediate impact in developing
Notes:
1 Roser, 2019; Ma, 2019; Shetty, 2019.
2 WIPO, 2015a; Sampat, 2019.
3 Gordon, 2012, 2014; WIPO, 2015a, 2015b; Sampat, 2019.
4 Kenny, 2011; WIPO, 2015a.
5 Deloitte, 2018a; EIU, 2017, 2018.
6 Deloitte, 2018a; Biot et al., 2019.
7 Deloitte, 2018a; EIU, 2017, 2018; Frost et al., 2019.
8 Dutta et al., 2019.
9 It also sets up targets aimed at specific challenges including, for example, maternal mortality, AIDS, tuberculosis, malaria and neglected tropical diseases and a goal to support R&D for vaccines and medicines for communicable and non-communicable diseases.

The Global Innovation Index 201954
10 First in 2016, the Political Declaration on Antimicrobial Resistance and the Political Declaration on HIV and AIDS; and in 2018, the Political Declaration on the Fight against Tuberculosis and the Political Declaration on Non-Communicable Diseases.
11 To illustrate the cross-border dimension, and the need for specific research aimed at developing countries, SDG Indicator 3.b.2 monitors, the Official development assistance (ODA) for medical research and basic health sectors as a % of gross national income (GNI) and as a % of all ODA, by donor country.
12 Sheiner et al., 2016.
13 Nelson, 2003.
14 Bartfai et al., 2013; Andrade et al., 2019.
15 Casadevall, 2018.
16 Scannell et al., 2012.
17 Bloom et al., 2017—While most of the economic literature confirms this prospect of declining R&D pharmaceutical productivity, some contributions question the extent finding that the above trends are exaggerated as R&D costs are seriously overstated. Measuring the R&D productivity of a sector, let alone the overall productivity, in a field such as health is daunting. Invariably metrics are imperfect.; Cockburn, 2006—e.g., by failing to account for inflation in R&D input costs; Schmid et al., 2005.
18 Vijg, 2011—In one study, the total out-of-pocket R&D costs per new approved drug are estimated to be around US$1.9 billion.; Pammolli et al., 2011; DiMasi et al.,2016.
19 Cross, 2018.—The development of a new health product is a risky activity; estimates indicate that the percentage of drugs that reach the market after starting clinical trials, which is already an advanced phase of R&D in the sector, varies between 6% and 13.8% depending on the estimate.
20 Ricks et al., 2019.
21 Hopkins et al., 2007; Singh, 2018.
22 Comanor, 2013.—Note that recent mergers have indeed contributed to the observed decline in pharmaceutical innovation.
23 R&D Magazine, 2018.
24 Abrishami et al., 2014; Penter, 2018.
25 Drolet et al., 2011.
26 Metcalfe et al., 2005.
27 Herzlinger, 2006.
28 Herzlinger, 2006.
29 Murphy, 2019.
30 Żaneta, 2019.
31 WHO, WIPO, and WTO, 2012, 2018.—Lack of access to medical technologies is rarely due to a single determinant. Important factors include: needs-based research, development, and innovation; intellectual property and trade policies; manufacturing processes and systems; regulatory environment; price transparency, pricing policies, and health system infrastructure; integrity and efficiency in procurement and supply chain management; and appropriate selection, prescribing and use.
32 Kaslow, 2019.
33 Murray et al., 2012; Woodson, 2016; von Philipsborn et al., 2015.—One study finds that diseases prominent in low-income economies cause about 14 % of the global disease burden. Yet they only receive about 1.3 % of health-related R&D expenditure.
34 Zaid et al., 2019; Shetty, 2019.
35 Puica et al. 2019.
36 Dewhurst, 2017.
37 Tannoury et al., 2017.
38 Frost et al., 2018.
39 EIU, 2017, 2018.
40 Evaluate Pharmaceutical, 2018; WifOR, 2018.
41 Hernández et al., 2018; R&D Magazine, 2018.—Top investors such as Roche (Switzerland), Johnson and Johnson (U.S.) and Merck US (U.S.) invested on average around US$10 billion in R&D last year.
42 In some countries, the figures can be significantly higher—typically about 30% of total R&D—e.g. in selected African countries such as Kenya. Some high-income economies also stand out with a remarkably high share of health R&D; e.g. Singapore and Qatar (both 19%), but also the Netherlands (17%). Data drawn from Global Observatory on Health R&D of the WHO, with special tabulations made available to authors. The gross domestic expenditure on R&D (GERD) and GERD in the health and medical sciences (health GERD) are collected from the United Nations Educational, Scientific and Cultural Organization (UNESCO), the Organisation for Economic Co-operation and Development (OECD), and Eurostat, the statistical office of the European Union. They are reported using the most recent available data since 2010 by country (Note: not all countries have reported data on this indicator). See also https://www.who.int/research-observatory/monitoring/inputs/gerd/en/
43 Among high-income countries ranges vary greatly with, for example, France, Germany, Republic of Korea, and Italy between 5-10%, and other such as New Zealand, Spain, Denmark, Canada and Norway between 10-15%. Source: Authors based on OECD R&D Statistics.
44 WIPO, 2018.— see Patent applications and grants worldwide
45 Bergquist et al., 2019.
46 WIPO, 2018, WIPO Statistics Database, 2017; Retrived from https://www.wipo.int/ipstats/en/; Gokhale, 2017.
47 WIPO, 2018; WIPO, 2019b.
48 Cornell University, INSEAD, and WIPO, 2019; Ma, 2019; Bergquist et al., 2019; WIPO, 2019a; WIPO, 2019b.
49 Bloom et al., 2017.
50 Pharmaceutical Intelligence, 2019 ; Smietana, 2016.
51 Baedeker et al., 2018; Nature, 2019a; R&D Magazine, 2019; IQVIA Institute, 2019.—In 2018, the European Medicines Agency (EMA) had approved 84 (vs 94 in 2017) new drugs with 42 (vs 35 in 2017) of these being new active substances. At the same time, the US Food and Drug Administration (FDA) had approved 59 novel drugs and biologics in 2018 (vs 46 in 2017).
52 EIU, 2017; EIU, 2018; Casadevall, 2018.
53 Bloom et al., 2017; Vijg, 2011; Casadevall, 2018; Gordon, 2018.
54 R&D Magazine, 2018; Deloitte, 2018b.
55 Coffano, 2016.—gives an analysis of the dynamic field of medical device innovation.
56 FDA Statement from FDA Commissioner Scott Gottlieb, M.D., and Jeff Shuren, M.D., Director of the Center for Devices and Radiological Health, on a record year for device innovation, January 28, 2019.
57 On the delivery kits, see PATH, 2002; Beun et al., 2003; On frugal medical innovation in India, see Verma, 2017.
58 Collins, 2019; Biot, 2019.
59 Khedkar et al., 2019; Ma, 2019.
60 Andrade et al., 2019; Jewell, 2018.

Theme Section 55
61 Zaid et al., 2019; Uwaliraye, 2019.
62 See on this caveat: GII 2019 chapters, in particular Sampat, 2019; Collins, 2019 and also earlier work on breakthrough innovation; WIPO, 2015a; WIPO 2015b.
63 Ma, 2019; Mahnken, 2018.
64 CSIRO, 2017; Basel et al.,2013.
65 Khedkar et al., 2019; Biot et al., 2019; Puica et al., 2019,; Boonfueng et al., 2019.
66 Ma, 2019; Murphy, 2019.
67 For pharmaceuticals in particular, see Lichtenberg, 2003 and Grabowski et al., 2002.
68 Anelli et al., 2019.
69 R&D Magazine, 2018; Research!America, 2018.
70 Boonfueng et al., 2019; Andrade et al., 2019; Fartash et al., 2019.
71 Anelli et al., 2019.
72 Ricks et al., 2019.
73 Lehoux et al., 2016; Foray et al.,2012.
74 Kaslow, 2019.
75 For more information see: https://www.gatesfoundation.org/What-We-Do; and https://www.gavi.org/
76 Sampat, 2019.
77 WIPO actively involves a wide range of stakeholders—from civil society, to academia, business, and more—in order to ensure that all members of society benefit from intellectual property. For its multi-stakeholder platforms, see https://www.wipo.int/cooperation/en/multi_stakehold-er_platforms/
78 Anelli et al, 2019.
79 Gelijns et al., 1994; Thune, 2016.
80 Lander, 2016; Miller, 2016.
81 Gulbrandsen et al., 2016; Smits et al., 2008.
82 Llopis et al., 2016; The Medical Futurist, 2017, including the idea for a role of patients on the board of pharmaceutical companies.
83 See the Daniel Schmutz, CEO, Helsana, Interview at https://pharm-aboardroom.com/interviews/interview-daniel-schmutz-ceo-helsana-swit-zerland/
84 Thune et al., 2016.
85 Barberá-Tomás et al., 2012.
86 Li et al., 2018.
87 Gandjour, 2011; Murray et al., 2012.
88 BCG and World Economic Forum, 2017.
89 There are many studies that tie air pollution in to increased rates of cardiovascular disease and death, for example. See https://www.eurekalert.org/pub_releases/2019-03/esoc-apc030819.php for a study on the European Union.
90 CSRIO, 2017.
91 BCG and World Economic Forum, 2018.—In January 2017, the health ministers of OECD recommended that countries develop and implement health-data governance frameworks that secure privacy while enabling health data uses that are in public interest.
92 The Medical Futurist, 2017.
93 Thune, 2016.
94 Proksch et al., 2019.
95 See also: http://www.inahta.org/members/sbu/ and https://www.bag.admin.ch/bag/de/home/begriffe-a-z/health-technology-assessment.html
96 More information at https://www.nice.org.uk/about
97 BCG and World Economic Forum, 2017.
98 Mossialos, 2018.
99 Khedkar et al., 2019.
100 Mali’s “astounding” community health programme should be emulated, By David Pilling, Financial Times, March 1, 2019.
References:
Abrishami, P., Boer, A., & Horstman, K. (2014). Understanding the adoption dynamics of medical innovations: Affordances of the da Vinci robot in the Netherlands. Social Science & Medicine, 117, 125-133.
Andrade, R. B., & Melles, C. (2019). A Brazilian Outlook on Health and Medical Innovation [Chapter 14]. In S. Dutta, B. Lanvin, & S. Wunsch-Vincent (Eds.) Global Innovation Index 2019: Creating Healthy Lives—The Future of Medical Innovation. Ithaca, Fontainebleau, and Geneva: Cornell, INSEAD, and WIPO.
Anelli, G., Crilli, M., & Rassat, A. (2019). How Particle Physics Research at CERN Contributes to Medical Innovation [Chapter 10]. In S. Dutta, B. Lanvin, & S. Wunsch-Vincent. (Eds.), Global Innovation Index 2019: Creating Healthy Lives—The Future of Medical Innovation. Ithaca, Fontainebleau, and Geneva: Cornell University, INSEAD, and WIPO.
Baedeker, M., Ringel, M., & Schulze, U. (2019). FDA approvals hit all-time high — but average value slips again. Nature Reviews Drug Discovery, 18, 90.
Basel, K., Knott, D., & Van Kuiken, S. (2013, April) The big-data revolution in US health care: Accelerating value and innovation, McKinsey & Company.
Barberá-Tomás, D., & Consoli, D. (2012). Whatever works: Uncertainty and technological hybrids in medical innovation. Technological Forecasting and Social Change, 79(5), 932-948.
Bartfai, T., & Lees, G. V. (2013). Chapter 7: Why is pharmaceutical a special industry? In T. Bartfai & G. V. Lees (Eds.), The Future of Drug Discovery (pp. 193-216). San Diego: Academic Press.
Bergquist, K., & Fink, C. (2019). Identifying and Ranking the World’s Largest Science and Technology Clusters [Special Section]. In S. Dutta, B. Lanvin, and S. Wunsch-Vincent. (Eds.), Global Innovation Index 2019: Creating Healthy Lives—The Future of Medical Innovation. Ithaca, Fontainebleau, and Geneva: Cornell University, INSEAD, and WIPO.
Beun, M. H., & Wood, S. K. (2003, December). Acceptability and Use of Clean Home Delivery Kits in Nepal: A Qualitative Study, Journal of Health, Population and Nutrition 21, (4), 367-373
Biot, C., Johnson, P., Massart, S., & Pécuchet, N. (2019). Improving Patient Healthcare through Virtual Platforms [Chapter 7]. In S. Dutta, B. Lanvin, & S. Wunsch-Vincent (Eds.), Global Innovation Index 2019: Creating Healthy Lives—The Future of Medical Innovation. Ithaca, Fontainebleau, and Geneva: Cornell, INSEAD, and WIPO.
Bloom, N., Jones, CI., Van Reenen, J., & Webb, M. (2017, September). Are Ideas Getting Harder to Find? (NBER Working Paper No. w23782). Retrieved from https://ssrn.com/abstract=3035132
Boonfueng, K., Limapornvanich, C., & Suksaard, T. (2019). Social and Economic Aspects of Health and Medical Innovation in Thailand [Chapter 17]. In S. Dutta, B. Lanvin, and S. Wunsch-Vincent. (Eds.), Global Innovation Index 2019: Creating Healthy Lives—The Future of Medical Innovation. Ithaca, Fontainebleau, and Geneva: Cornell University, INSEAD, and WIPO.

The Global Innovation Index 201956
BCG (Boston Consulting Group) and World Economic Forum. (2017, April). Value in Healthcare Laying the Foundation for Health System Transformation.
——— . (2018, December). Accelerating the Pace of Health System Transformation.
Casadevall, A. (2018). Is the Pace of Biomedical Innovation Slowing? Perspectives in Biology and Medicine, 61(4), 584-593.
Cockburn, I. M. (2006). Is the Pharmaceutical Industry in a Productivity Crisis? Innovation Policy and the Economy, 7(2006), 1–32.
Coffano, M. (2016, December 19) Innovation dynamics in the medical device sector: network of collaborations, knowledge spillovers and regulation. Thesis number 7257, École Polytechnique Fédérale De Lausanne.
Collins, F. S. (2010, January). Opportunities for research and NIH. Science,
327 (5961), 36-37.
Collins, F. (2019). Ten Opportunities for Biomedical Innovation over the Next Ten Years [Chapter 4]. In S. Dutta, B. Lanvin, & S. Wunsch-Vincent. (Eds.), Global Innovation Index 2019: Creating Healthy Lives—The Future of Medical Innovation. Ithaca, Fontainebleau, and Geneva: Cornell University, INSEAD, and WIPO.
Comanor, W. S., & Scherer, F. M. (2013). Mergers and innovation in the pharmaceutical industry. Journal of Health Economics, 32(1), 106-113.
Cornell University, INSEAD, & WIPO. (2019). Global Innovation Index 2019: Creating Healthy Lives—The Future of Medical Innovation. Ithaca, Fontainebleau, and Geneva.
Cross, R. (2018, February 12). Drug development success rates are higher than previously reported. Chemical and Engineering News, 96(7).
CSIRO. (2017, April). The Medical Technologies and Pharmaceuticals (MTP) Roadmap – unlocking future growth opportunities for Australia Com-monwealth Scientific and Industrial Research Organisation. Canberra: Australia.
Deloitte (2018a). 2018 Global health care outlook: The evolution of smart health care. Retrieved from https://www2.deloitte.com/content/dam/Deloitte/global/Documents/Life-Sciences-Health-Care/gx-lshc-hc-out-look-2018.pdf
——— . (2018b). Embracing the future of work to unlock R&D productivity: Measuring the return from pharmaceutical innovation 2018. Retrieved from https://www2.deloitte.com/uk/en/pages/life-sciences-and-health-care/articles/measuring-return-from-pharmaceutical-innovation.html
Dewhurst, M. (2017, March). The next horizon of innovation for pharmaceutical. McKinsey Interview with David Epstein. Retrieved from https://www.mckinsey.com/industries/pharmaceuticals-and-medical-products/our-in-sights/the-next-horizon-of-innovation-for-pharmaceutical
DiMasi, J. A., Grabowski, H. G., & Hansen, R. W. (2016). Innovation in the pharmaceutical industry: New estimates of R&D costs. Journal of Health Economics, 47, 20-33.
Drolet, B. C., & Lorenzi, N. M. (2011). Translational research: understanding the continuum from bench to bedside. Translational Research, 157(1), 1-5.
Dutta, S., Escalona Reynoso, R., Wunsch-Vincent, S., Rivera Léon, L., & Hardman, C. (2019). Creating Healthy Lives—The Future of Medical Innovation [Theme Section]. In S. Dutta, B. Lanvin, & S. Wunsch-Vincent (Eds.), Global Innovation Index 2019: Creating Healthy Lives—The Future of Medical Innovation. Ithaca, Fontainebleau, and Geneva: Cornell University, INSEAD, and WIPO.
EIU (The Economist Intelligence Unit). (2017, June). World Industry Out-look: Healthcare and Pharmaceuticals. The Economic Intelligence Unit. Retrieved from http://www.eiu.com/FileHandler.ashx?issue_id=925683076&mode=pdf
——— . (2018, September) World Industry Outlook: Healthcare and Pharmaceu-ticals. The Economic Intelligence Unit. Retrieved from http://industry.eiu.com/handlers/filehandler.ashx?issue_id=637193047&mode=pdf
European Commission (2007) White Paper–Together for Health: A Strategic Approach for the EU 2008-2013, Brussels, Commission of the European Communities, 23.10.2007 COM(2007) 630 final.
Evaluate Pharmaceutical. (2018). World Preview 2018, Outlook to 2024 (p. 22). London: Evaluate Ltd. Retrieved from http://info.evaluategroup.com/rs/607-YGS-364/images/WP2018.pdf
Fartash, K., & Elyasi, M. (2019). Iran’s Experience in Developing High-tech Medical Innovations and the Path Ahead [Chapter 16]. In S. Dutta, B. Lanvin, & S. Wunsch-Vincent. (Eds.), Global Innovation Index 2019: Creating Healthy Lives—The Future of Medical Innovation. Ithaca, Fontainebleau, and Geneva: Cornell University, INSEAD, and WIPO.
Foray, D., Mowery, D. C. & Nelson, R. R. (2012). Public R&D and social challenges: What lessons from mission R&D programs? Research Policy, 41, 1697–702.
Frost & Sullivan. (2018, January 12). Frost & Sullivan’s 10 Healthcare Predic-tions for 2018. Retrieved from https://ww2.frost.com/frost-perspectives/frost-sullivans-10-healthcare-predictions-2018/
——— . (2019) 2019 Healthcare Predictions – Growth Opportunities, Technology, and Trends. Global Healthcare Industry Outlook, 2019.
Grabowski, H., Vernon, J., & DiMasi, J. A. (2002) Returns on Research and Development for 1990s New Drug Introductions. Pharmacoeconomics, 20, 11-29.
Gandjour, A., & Chernyak, N. (2011). A new prize system for drug innovation. Health Policy, 102(2), 170-177.
Gelijns, A., & Rosenberg, N. (1994). The dynamics of technological change in medicine. Health Affairs, 28–46.
Gokhale, P., & Kannan, S. (2017). Patenting trends in Indian pharmaceutical industry. Annals of Library and Information Studies, 64(4), 260-267.
Gordon, R. J. (2012). Is U.S. Economic Growth Over? Faltering Innovation Confronts the Six Headwinds (National Bureau of Economic Research Working Paper, No. 18315). DOI: 10.3386/w18315. Retrieved from https://www.nber.org/papers/w18315
——— . (2014). The Demise of U.S. Economic Growth: Restatement, Rebuttal, and Reflections (National Bureau of Economic Research Working Paper, No. 19895). DOI: 10.3386/w19895. Retrieved from https://www.nber.org/papers/w19895
——— . (2018). Why Has Economic Growth Slowed When Innovation Appears to be Accelerating? (National Bureau of Economic Research Working Paper, No. 24554). DOI: 10.3386/w24554. Retrieved from: https://www.nber.org/papers/w24554
Gulbrandsen, M., Hopkins, M., Thune, T., & Valentin, F. (2016). Hospitals and innovation: Introduction to the special section. Research Policy, 45(8), 1493-1498.
Herzlinger, R. E. (2006, May). Why Innovation in Health Care Is So Hard. Harvard Business Review, 84(5).
Hernández, H., Grassano, N., Tübke, A., Potters, L., Gkotsis, P. et al. (2018). The 2018 EU Industrial R&D Investment Scoreboard; EUR 29450 EN; Publications Office of the European Union, Luxembourg.
Hopkins, M. M., Martin, P. A., Nightingale, P., Kraft, A., & Mahdi, S. (2007). The myth of the biotech revolution: An assessment of technological, clinical and organisational change. Research Policy, 36(4), 566-589.
IQVIA Institute (2019). The Global Use of Medicine in 2019 and Outlook 2023. Retrieved from https://intelligencepharma.files.wordpress.com/2019/01/the-global-use-of-medicine-in-2019-and-outlook-to-2023.pdf
Jewell, C. (2018, June). Diagnostics for the Real World: point-of-care diagnosis made easy. WIPO Magazine.

Theme Section 57
Kaslow, D. C. (2019). Overcoming Barriers to Medical Innovation for Low Resource Settings [Chapter 11]. In S. Dutta, B. Lanvin, & S. Wunsch-Vincent (Eds.), Global Innovation Index 2019: Creating Healthy Lives—The Future of Medical Innovation. Ithaca, Fontainebleau, and Geneva: Cornell University, INSEAD, and WIPO.
Kenny, C. (2011). Getting Better: Why Global Development Is Succeeding— And How We Can Improve the World Even More. New York, NY: Basic Books.
Khedkar, P., & Sahay, D. (2019). Trends in Healthcare and Medical Innovation [Chapter 3]. In S. Dutta, B. Lanvin, & S. Wunsch-Vincent. (Eds.), Global Innovation Index 2019: Creating Healthy Lives—The Future of Medical Innovation. Ithaca, Fontainebleau, and Geneva: Cornell University, INSEAD, and WIPO.
Kraft, D. (2019, January). 12 Innovations that will revolutionize the future of medicine. National Geographic magazine. Retrieved from https://www.nationalgeographic.com/magazine/2019/01/12-innovations-technolo-gy-revolutionize-future-medicine/
Lander, B. (2016). Boundary-spanning in academic healthcare organisations. Research Policy, 45(8), 1524-1533.
Lehoux, P., Daudelin, G., Williams-Jones, B., Denis, J. L., & Longo, C. (2014). How do business model and health technology design influence each other? Insights from a longitudinal case study of three academic spin-offs. Research Policy, 43(6), 1025-1038.
Lehoux, P., Miller, F. A., Daudelin, G., & Urbach, D. R. (2016) How venture capitalists decide which new medical technologies come to exist. Science and Public Policy, 43(3), 375–385.
Li, S. S., Fitzgerald, L., Morys-Carter, M. M., Davie, N. L., & Barker, R. (2018). Knowledge translation in tri-sectoral collaborations: An exploration of perceptions of academia, industry and healthcare collaborations in innovation adoption. Health Policy 122(2): 175-183.
Lichtenberg, F. R. (2003). Pharmaceutical Innovation, Mortality Reduction, and Economic Growth. In K.M. Murphy & R.H. Topel (Eds.), Measuring the Gains from Medical Research, an Economic Approach (p. 102). University of Chicago Press,.
Llopis, O., & D’Este, P. (2016). Beneficiary contact and innovation: The relation between contact with patients and medical innovation under different institutional logics. Research Policy, 45(8), 1512-1523.
Ma, H. (2019). Application of Artificial Intelligence and Big Data in China’s Healthcare Services [Chapter 5]. In S. Dutta, B. Lanvin, & S. Wunsch-Vincent (Eds.), Global Innovation Index 2019: Creating Healthy Lives—The Future of Medical Innovation. Ithaca, Fontainebleau, and Geneva: Cornell University, INSEAD, and WIPO.
Mahnken, T. A., & Moehrle, M. G. (2018). Multi-cross-industry innovation patents in the USA–A combination of PATSTAT and Orbis search. World Patent Information, 55, 52-60.
Mesko, B. (2018). The Medical Futurist: Technologies Shaping the Future of Pharmaceutical.
Metcalfe, J. S., James, A., & Mina, A. (2005). Emergent innovation systems and the delivery of clinical services: The case of intra-ocular lenses. Research Policy, 34(9), 1283-1304.
Miller, F. A., & French, M. (2016). Organizing the entrepreneurial hospital: Hybridizing the logics of healthcare and innovation. Research Policy, 45(8), 1534-1544.
Mossialos, E. (2018, January 17). Transforming health systems: Why innova-tion in health care is so hard? LSE China Lecture Series, Beijing, London School of Economics and Political Science.
Murphy, K. (2019). How Data will Improve Healthcare without Adding Staff or Beds [Chapter 8]. In S. Dutta, B. Lanvin, & S. Wunsch-Vincent (Eds.), Global Innovation Index 2019: Creating Healthy Lives—The Future of Medical Innovation. Ithaca, Fontainebleau, and Geneva: Cornell University, INSEAD, and WIPO.
Murray, C. J. L., Vos, T., Lozano, R., Naghavi, M., Flaxman, A. D. et al. (2012). Disability-adjusted life years (DALYs) for 291 diseases and injuries in 21 regions, 1990–2010: a systematic analysis for the Global Burden of Disease Study 2010. The Lancet, 380(9859), 2197-2223.
Murray, F., Stern, S., Campbell, G., & MacCormack, A. (2012). Grand Innovation Prizes: A theoretical, normative, and empirical evaluation. Research Policy, 41(10), 1779-1792.
Nature. (2018, March 8). Nature Outlook: The future of medicine. Retrieved from https://www.nature.com/collections/zfnjwhjjct
——— . (2019a, January 15). 2018 FDA approvals hit all-time high — but average value slips again. Nature Reviews Drug Discovery, 18, 90.
——— . (2019b, January 23.) Technology Feature Technologies to watch in 2019. Retrieved from https://www.nature.com/articles/d41586-018-02472-6.
Nelson, R. R. (2003). On the uneven evolution of human know-how. Research Policy, 32(6), 909-922.
Pammolli, F., Magazzini, L., & Riccaboni, M. (2011). The productivity crisis in pharmaceutical R& D. Nature Reviews Drug Discovery, 10, 428.
PATH. (2002, March). Use of the Clean Home Delivery Kit in Nepal: A Qualitative Study. Seattle: Program for Appropriate Technology in Health (PATH).
Penter, V, & Pfaffner, K. (2018). Why is innovation in health so hard? KPMG. Retreived from https://home.kpmg/bh/en/home/insights/2018/05/the-i-word-paradox.html
Pharmaceutical Intelligence (2019). Pharmaceutical R&D Annual Review 2019. Retrieved from https://pharmaintelligence.informa.com/~/media/infor-ma-shop-window/pharmaceutical/2019/files/whitepapers/pharmaceuti-cal-rd-review-2019-whitepaper.pdf
Proksch, D., Busch-Casler, J., Haberstroh, M. M., & Pinkwart, A. (2019). National health innovation systems: Clustering the OECD countries by innovative output in healthcare using a multi indicator approach. Research Policy, 48(1), 169-179.
Puica, L., & Bauersachs, J. (2019). Case of iamYiam—Innovating in Preventive Health Delivery [Chapter 9]. In S. Dutta, B. Lanvin, & S. Wunsch-Vincent. (Eds.), Global Innovation Index 2019: Creating Healthy Lives—The Future of Medical Innovation. Ithaca, Fontainebleau, and Geneva: Cornell University, INSEAD, and WIPO.
R&D Magazine. (2018). 2018 Global R&D Funding Forecast, Winter 2018. Retrieved from https://www.rdmag.com/
——— . (2019, March 19). The Marriage of Big Pharma and Biotech. Retrieved from https://www.rdmag.com/article/2019/03/marriage-big-pharma-and-biotech
Research!America. (2018) U.S. Investments in Medical and Health Research and Development 2013–2017, Fall 2018. Retrieved from https://www.researchamerica.org/sites/default/files/Policy_Advocacy/2013-2017In-vestmentReportFall2018.pdf
Ricks, D. A., & Matthews, B. R. (2019). Reaching New Frontiers for Alzheimer’s through Research and Innovation [Chapter 6]. In S. Dutta, B. Lanvin, & S. Wunsch-Vincent (Eds.), Global Innovation Index 2019: Creating Healthy Lives—The Future of Medical Innovation. Ithaca, Fontainebleau, and Geneva: Cornell University, INSEAD, and WIPO.
Roser, M. (2019). Our World in Data: Life Expectancy. Retrieved from: https://ourworldindata.org/life-expectancy
Sampat, B. (2019). The Economics of Health Innovation: Looking Back and Looking Forward [Chapter 2]. In S. Dutta, B. Lanvin, & S. Wunsch-Vincent (Eds.), Global Innovation Index 2019: Creating Healthy Lives—The Future of Medical Innovation. Ithaca, Fontainebleau, and Geneva: Cornell University, INSEAD, and WIPO.
Scannell, J. W., Blanckley, A., Boldon, H., & Warrington, B. (2012). Diagnosing the Decline in Pharmaceutical R&D Efficiency. Nature Reviews Drug Discovery, 11(3), 191.

The Global Innovation Index 201958
Schmid, E. F., & Smith, D. A. (2005). Keynote review: Is declining innovation in the pharmaceutical industry a myth? Drug Discovery Today, 10(15), 1031-1039.
Sheiner, L., & Malinovskaya, A. (2016, June). Productivity in the Health Care sector. Hutchins Center on Fiscal and Monetary Policy at Brookings. Retrieved from https://www.brookings.edu/wp-content/up-loads/2016/08/hp-issue-brief_final.pdf
Shetty, D. (2019). Innovations in Healthcare Affordability and Delivery— An Indian Perspective [Chapter 12]. In S. Dutta, B. Lanvin, & S. Wunsch-Vincent. (Eds.), Global Innovation Index 2019: Creating Healthy Lives—The Future of Medical Innovation. Ithaca, Fontainebleau, and Geneva: Cornell University, INSEAD, and WIPO.
Singh, G. (2018). Re-Innovation in Pharmaceutical Industry: Supergenerics and Biobetters [Chapter 23]. In D. Vohora & G. Singh (Eds.), Pharmaceutical Medicine and Translational Clinical Research (pp. 369-380). Boston: Academic Press.
Smietana, K., Siatkowski, M., & Møller, M. (2016). Trends in clinical success rates. Nature Review 2016. Retrieved from https://doi.org/10.1038/nrd.2016.85
Smits, R. E. H. M., & Boon, W. P. C. (2008). The role of users in innovation in the pharmaceutical industry. Drug Discovery Today, 13(7), 353-359.
Tannoury, M., & Attieh, Z. (2017). The Influence of Emerging Markets on the Pharmaceutical Industry. Current therapeutic research, clinical and experimental, 86, 19–22. doi:10.1016/j.curtheres.2017.04.005
The Medical Futurist. (2017, June 20). The Top 10 Trends Shaping the Future of Pharmaceutical. Retrieved from https://medicalfuturist.com/top-10-trends-shaping-future-pharmaceutical
Thune, T., & Mina, A. (2016). Hospitals as innovators in the health-care system: A literature review and research agenda. Research Policy, 45(8), 1545-1557.
Uwaliraye, P., Ndimubanzi, P., Muhire, A., & Lyle, V. (2019). Integration of Health and Medical Innovations in Rwanda to Promote Health Equity [Chapter 15]. In S. Dutta, B. Lanvin, & S. Wunsch-Vincent. (Eds.), Global Innovation Index 2019: Creating Healthy Lives—The Future of Medical Innovation. Ithaca, Fontainebleau, and Geneva: Cornell University, INSEAD, and WIPO.
Verma, S. (2017). Frugal innovation in medical devices: Key to growth in emerging economies. Journal of Medical Marketing, 16(2), 66–73.
Vijg, J. (2011). The American Technological Challenge: Stagnation and Decline in the 21st Century. New York: Algora Publishing.
von Philipsborn, P., Steinbeis, F., Bender, M. E., Tinnemann, P. (2015). Poverty-related and neglected diseases: an economic and epidemiological data analysis of poverty relatedness and neglect in research and development, Glob. Health Action, 382(2015), 7.
WHO (World Health Organization), WIPO (World Intellectual Property Organization), and WTO (World Trade Organization). (2012). Promoting Access to Medical Technologies and Innovation, Geneva. Retrieved from https://www.wipo.int/edocs/pubdocs/en/global_challenges/628/wipo_pub_628.pdf
——— . (2018, February 26) WHO, WIPO, WTO Joint Technical Symposium on Sustainable Development Goals: Innovative technologies to promote healthy lives and well-being, Summary of the Key Issues, Geneva. Retrieved from https://www.wipo.int/edocs/pubdocs/en/wipo_pub_gc_17.pdf
WifOR. (2018, July). Understanding public and private funding for pharmaceutical R&D: Does society really pay twice?. Commissioned by the International Federation of Pharmaceutical Manufacturers and Associations, Berlin: Wirtschaftsforschung. Retrieved from https://www.ifpma.org/wp-content/uploads/2018/06/Wifor-2018-RD-Activities-Footprint.pdf
WIPO (World Intellectual Property Organization). (2015a). A Look Inside the Economic Growth Engine [Chapter 1]. World Intellectual Property Report 2015: Breakthrough Innovation and Economic Growth (pp. 21-46). Geneva: World Intellectual Property Organization.
——— . (2015b). Historical breakthrough innovations [Chapter 2]. World Intellectual Property Report 2015: Breakthrough Innovation and Economic Growth (pp. 49-93). Geneva: World Intellectual Property Organization.
——— . (2018). World Intellectual Property Indicators 2018. Geneva: World Intellectual Property Organization.
——— . (2019a). WIPO Technology Trends 2019: Artificial Intelligence. Geneva: World Intellectual Property Organization. Retrieved from https://www.wipo.int/edocs/pubdocs/en/wipo_pub_1055.pdf
——— . (2019b, March 19). WIPO 20148 IP Services: Innovators File Record Number of International Patent Applications, With Asia Now Leading [Press release]. Retrieved from https://www.wipo.int/pressroom/en/arti-cles/2019/article_0004.html
Woodson, T. S. (2016). Public private partnerships and emerging technologies: A look at nanomedicine for diseases of poverty. Research Policy, 45(7), 1410-1418.
Xu, K., Soucat, A., Kutzin, J., Brindley, C., Vande Maele, N. et al. (2018). Public Spending on Health: A Closer Look at Global Trends (WHO/HIS/HGF/HFWorkingPaper/18.3). Geneva: World Health Organization.
Zaid, H., Salaheldein, A., Hassany, M., & Othman, M. M. (2019). Life is too short with HCV and NCDs—100 Million Healthy Lives Initiative [Chapter 12]. In S. Dutta, B. Lanvin, & S. Wunsch-Vincent (Eds.), Global Innovation Index 2019: Creating Healthy Lives—The Future of Medical Innovation. Ithaca, Fontainebleau, and Geneva: Cornell University, INSEAD, and WIPO.
Żaneta, P. (2019). Innovation in the Polish health sector: a quality assessment (WIPO Economic Research Working Paper No. 47). Geneva: WIPO.

Theme Section 59

The Global Innovation Index 201960

Special Section: Cluster Rankings 61
unchanged, with Tokyo–Yokohama at the top of the list, followed by Shenzhen–Hong Kong (2) and Seoul (3). Beijing (4) and San Jose–San Francisco, CA (5) swapped rank compared to last year.
In both 2018 and 2019, the same 27 countries comprise the top 100 clusters. The United States of America (U.S.) continues to host the largest number of clusters (26), followed by China (18)—which is two more than China hosted in 2018. Germany (10), France (5), the United Kingdom (U.K.) (4), Canada (4), and Japan (3) follow next, all unchanged from the previous year.1
Compared to last year, almost all of the Chinese clusters moved up the ranks. Guangzhou, the 21st ranked cluster in 2019, moved up 11 places as compared to its 2018 ranking (21, +11). Likewise, Hangzhou (30, +11), Qingdao (80, +22), Suzhou (81, +19), Chongqing (88, +15) and Jinan (89, +10) also registered double-digit rank increases. This reflects faster overall growth in international patent applications and scientific publications by Chinese entities compared to most other countries (Figure S-1.1).
Two factors may explain rank changes from one year to the next. First, rank changes may be due to changes in the volume of patent applications and scientific publications during the two time frames. The declines in the rankings of Heidelberg–Mannheim, 53 in 2019 as compared to 46 in 2018 (53, -7), and Stuttgart (26, -5) mostly reflect declining S&T output while the climb in rankings by Phoenix (76, +10) and Portland (44, +4) reflect increases in S&T output. Second, rank changes may be due to a growing or shrinking cluster geography. For example, the rank increases of Brussels (40, +11) and Istanbul (69, +15) mostly reflect growing cluster areas.2 It is important to note that such geographical shifts may be sensitive to the threshold
As in the previous two years, this Special Section presents the latest ranking of the world’s largest science and technology (S&T) clusters. This spatial view of innovation performance is rooted in the recognition that innovation activities tend to be geographically concentrated. In other words, innovation performance often varies substantially within countries, and the cluster perspective highlights where such performance is strong—at least as far as the S&T dimension of innovation is concerned.
The methodological approach underlying this year’s ranking is the same as last year. We identify clusters based on the locations of inventors listed in international patent applications and authors appearing in scientific journal articles. Our data sources continue to be patent filings under WIPO’s Patent Cooperation Treaty (PCT) and scientific publications contained in the Web of Science’s SCI Expanded, published by Clarivate. Our data for this year’s ranking spans 2013-2017, compared to the 2012-2016 time frame used last year.
For a more detailed description of the cluster ranking methodology, we refer the interested reader to last year’s Special Section (Bergquist et al., 2018).
The top 100 S&T clusters
Table S-1.1 summarizes our geocoding results, and Table S-1.2 presents our top 100 cluster rankings. There are relatively few changes from last year, partly reflecting the overlap in time frames but arguably also the persistence of local innovation performance. The composition of the top 10 clusters remains
SPECIAL SECTION: CLUSTER RANKINGS
IDENTIFYING AND RANKING THE WORLD’S LARGEST SCIENCE AND TECHNOLOGY CLUSTERSKyle Bergquist and Carsten Fink, World Intellectual Property Organization (WIPO)
The views expressed here are those of the authors and do not necessarily reflect those of WIPO or its member states.
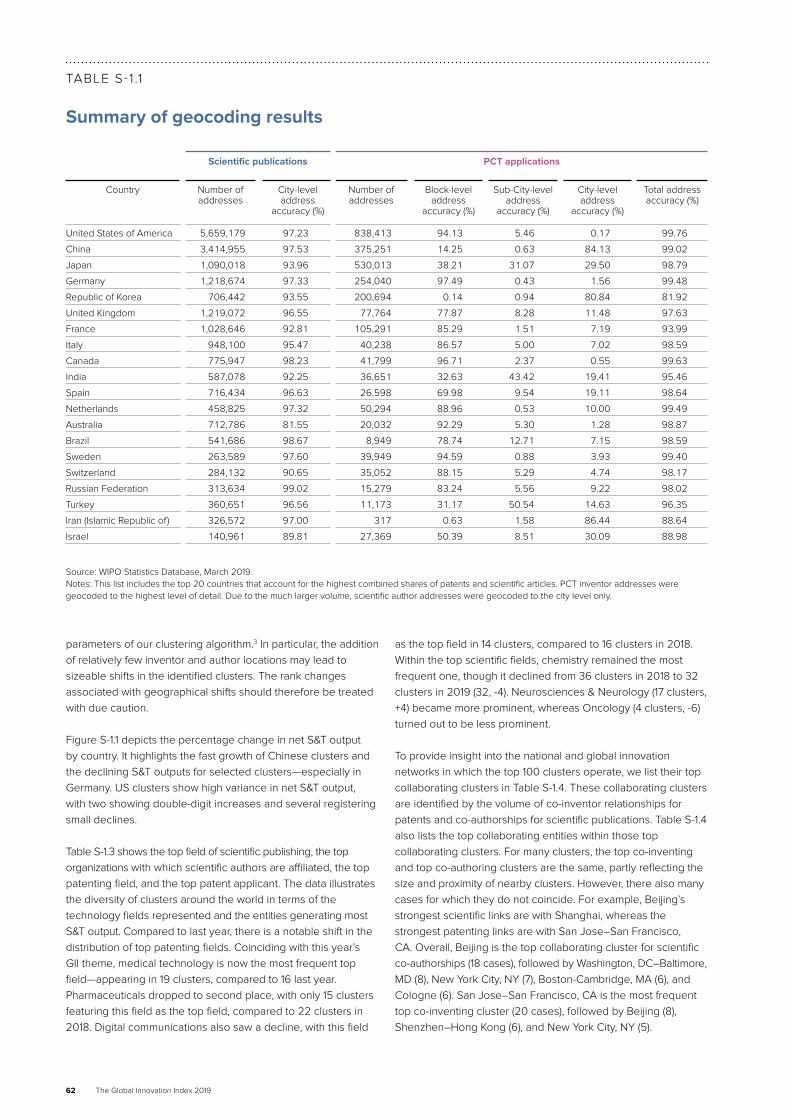
The Global Innovation Index 201962
as the top field in 14 clusters, compared to 16 clusters in 2018.Within the top scientific fields, chemistry remained the most frequent one, though it declined from 36 clusters in 2018 to 32 clusters in 2019 (32, -4). Neurosciences & Neurology (17 clusters, +4) became more prominent, whereas Oncology (4 clusters, -6) turned out to be less prominent.
To provide insight into the national and global innovation networks in which the top 100 clusters operate, we list their top collaborating clusters in Table S-1.4. These collaborating clusters are identified by the volume of co-inventor relationships for patents and co-authorships for scientific publications. Table S-1.4 also lists the top collaborating entities within those top collaborating clusters. For many clusters, the top co-inventing and top co-authoring clusters are the same, partly reflecting the size and proximity of nearby clusters. However, there also many cases for which they do not coincide. For example, Beijing’s strongest scientific links are with Shanghai, whereas the strongest patenting links are with San Jose–San Francisco, CA. Overall, Beijing is the top collaborating cluster for scientific co-authorships (18 cases), followed by Washington, DC–Baltimore, MD (8), New York City, NY (7), Boston-Cambridge, MA (6), and Cologne (6). San Jose–San Francisco, CA is the most frequent top co-inventing cluster (20 cases), followed by Beijing (8), Shenzhen–Hong Kong (6), and New York City, NY (5).
parameters of our clustering algorithm.3 In particular, the addition of relatively few inventor and author locations may lead to sizeable shifts in the identified clusters. The rank changes associated with geographical shifts should therefore be treated with due caution.
Figure S-1.1 depicts the percentage change in net S&T output by country. It highlights the fast growth of Chinese clusters and the declining S&T outputs for selected clusters—especially in Germany. US clusters show high variance in net S&T output, with two showing double-digit increases and several registering small declines.
Table S-1.3 shows the top field of scientific publishing, the top organizations with which scientific authors are affiliated, the top patenting field, and the top patent applicant. The data illustrates the diversity of clusters around the world in terms of the technology fields represented and the entities generating most S&T output. Compared to last year, there is a notable shift in the distribution of top patenting fields. Coinciding with this year’s GII theme, medical technology is now the most frequent top field—appearing in 19 clusters, compared to 16 last year. Pharmaceuticals dropped to second place, with only 15 clusters featuring this field as the top field, compared to 22 clusters in 2018. Digital communications also saw a decline, with this field
TABLE S-1 .1
Summary of geocoding results
United States of America 5,659,179 97.23 838,413 94.13 5.46 0.17 99.76
China 3,414,955 97.53 375,251 14.25 0.63 84.13 99.02
Japan 1,090,018 93.96 530,013 38.21 31.07 29.50 98.79
Germany 1,218,674 97.33 254,040 97.49 0.43 1.56 99.48
Republic of Korea 706,442 93.55 200,694 0.14 0.94 80.84 81.92
United Kingdom 1,219,072 96.55 77,764 77.87 8.28 11.48 97.63
France 1,028,646 92.81 105,291 85.29 1.51 7.19 93.99
Italy 948,100 95.47 40,238 86.57 5.00 7.02 98.59
Canada 775,947 98.23 41,799 96.71 2.37 0.55 99.63
India 587,078 92.25 36,651 32.63 43.42 19.41 95.46
Spain 716,434 96.63 26,598 69.98 9.54 19.11 98.64
Netherlands 458,825 97.32 50,294 88.96 0.53 10.00 99.49
Australia 712,786 81.55 20,032 92.29 5.30 1.28 98.87
Brazil 541,686 98.67 8,949 78.74 12.71 7.15 98.59
Sweden 263,589 97.60 39,949 94.59 0.88 3.93 99.40
Switzerland 284,132 90.65 35,052 88.15 5.29 4.74 98.17
Russian Federation 313,634 99.02 15,279 83.24 5.56 9.22 98.02
Turkey 360,651 96.56 11,173 31.17 50.54 14.63 96.35
Iran (Islamic Republic of) 326,572 97.00 317 0.63 1.58 86.44 88.64
Israel 140,961 89.81 27,369 50.39 8.51 30.09 88.98
Scientific publications PCT applications
Number of addresses
Country City-level address
accuracy (%)
Number of addresses
Block-level address
accuracy (%)
Sub-City-level address
accuracy (%)
City-level address
accuracy (%)
Total address accuracy (%)
Source: WIPO Statistics Database, March 2019.Notes: This list includes the top 20 countries that account for the highest combined shares of patents and scientific articles. PCT inventor addresses weregeocoded to the highest level of detail. Due to the much larger volume, scientific author addresses were geocoded to the city level only.

Special Section: Cluster Rankings 63
0
15
-5
5
10
25
FIGURE S-1.1
Net science and technology (S&T) output
20
Qingdao
Guangzhou
Portland, OR
Phoenix, AZ
Stuttgart
IndiaChina U.K. Switzerland Canada Australia U.S. Japan France GermanyRepublic of Korea
Clusters Median
Source: WIPO Statistics Database, March 2019.Notes: Net S&T output refers to the difference of total patents and publications for each cluster, for all points that were located inside the same cluster as the previous year. For simplicity, Switzerland was assigned all three clusters it was associated with. Only economies with 3 or more clusters are presented here.
▲ Net S&T output (contribution to growth (%))

The Global Innovation Index 201964
TABLE S-1 .2
Top 100 cluster rankings
1 Tokyo-Yokohama JP 108,973 144,559 10.90 1.72 12.62 1 -
2 Shenzhen-Hong Kong CN/HK 55,433 45,393 5.54 0.54 6.08 2 -
3 Seoul KR 39,545 136,654 3.95 1.63 5.58 3 -
4 Beijing CN 23,014 222,668 2.30 2.65 4.95 5 1
5 San Jose-San Francisco, CA US 38,399 88,243 3.84 1.05 4.89 4 -1
6 Osaka-Kobe-Kyoto JP 28,027 67,127 2.80 0.80 3.60 6 -
7 Boston-Cambridge, MA US 14,364 120,404 1.44 1.43 2.87 7 -
8 New York City, NY US 12,329 133,195 1.23 1.59 2.82 8 -
9 Paris FR 13,426 94,982 1.34 1.13 2.47 9 -
10 San Diego, CA US 19,280 34,403 1.93 0.41 2.34 10 -
11 Shanghai CN 8,736 114,395 0.87 1.36 2.24 12 1
12 Nagoya JP 19,370 23,705 1.94 0.28 2.22 11 -1
13 Washington, DC-Baltimore, MD US 4,498 117,623 0.45 1.40 1.85 13 -
14 Los Angeles, CA US 9,398 68,337 0.94 0.81 1.75 14 -
15 London GB 4,070 107,131 0.41 1.28 1.68 15 -
16 Houston, TX US 10,681 49,969 1.07 0.59 1.66 16 -
17 Seattle, WA US 10,773 33,796 1.08 0.40 1.48 18 1
18 Amsterdam-Rotterdam NL 4,491 78,994 0.45 0.94 1.39 17 -1
19 Chicago, IL US 6,455 55,718 0.65 0.66 1.31 19 -
20 Cologne DE 7,374 43,621 0.74 0.52 1.26 20 -
21 Guangzhou CN 4,029 59,762 0.40 0.71 1.11 32 11
22 Daejeon KR 7,699 25,689 0.77 0.31 1.08 23 1
23 Tel Aviv-Jerusalem IL 6,950 30,971 0.70 0.37 1.06 22 -1
24 Munich DE 6,833 30,764 0.68 0.37 1.05 24 -
25 Nanjing CN 1,440 75,749 0.14 0.90 1.05 27 2
26 Stuttgart DE 8,261 18,347 0.83 0.22 1.04 21 -5
27 Minneapolis, MN US 6,438 24,878 0.64 0.30 0.94 25 -2
28 Singapore SG 3,899 44,988 0.39 0.54 0.93 28 -
29 Philadelphia, PA US 3,176 50,014 0.32 0.60 0.91 26 -3
30 Hangzhou CN 3,773 44,950 0.38 0.54 0.91 41 11
31 Eindhoven BE/NL 8,175 6,198 0.82 0.07 0.89 29 -2
32 Stockholm SE 5,587 27,121 0.56 0.32 0.88 31 -1
33 Moscow RU 2,147 55,451 0.21 0.66 0.87 30 -3
34 Raleigh, NC US 3,006 46,797 0.30 0.56 0.86 34 -
35 Melbourne AU 1,955 54,842 0.20 0.65 0.85 33 -2
36 Frankfurt Am Main DE 5,226 25,235 0.52 0.30 0.82 35 -1
37 Sydney AU 2,454 47,979 0.25 0.57 0.82 36 -1
38 Wuhan CN 1,333 56,349 0.13 0.67 0.80 43 5
39 Toronto, ON CA 2,298 47,218 0.23 0.56 0.79 37 -2
40 Brussels BE 3,149 39,340 0.31 0.47 0.78 51 11
41 Berlin DE 3,393 35,542 0.34 0.42 0.76 39 -2
42 Madrid ES 1,605 49,980 0.16 0.59 0.76 38 -4
43 Taipei TW 1,428 51,144 0.14 0.61 0.75 40 -3
44 Barcelona ES 2,283 43,549 0.23 0.52 0.75 42 -2
45 Portland, OR US 5,813 12,041 0.58 0.14 0.72 49 4
46 Tehran IR 99 59,717 0.01 0.71 0.72 44 -2
47 Xi’an CN 745 51,701 0.07 0.62 0.69 52 5
48 Milan IT 2,177 37,953 0.22 0.45 0.67 45 -3
49 Denver, CO US 2,818 31,458 0.28 0.37 0.66 47 -2
50 Zürich CH/DE 3,007 29,651 0.30 0.35 0.65 48 -2
Rank Cluster name Economy PCT applications
Scientific publications
Share of total PCT filings, %
Share of total pubs,
%
Total Rank 2012-16
Rank change
CONTINUED

Special Section: Cluster Rankings 65
TABLE S-1 .2
Top 100 cluster rankings, continued
51 Montréal, QC CA 2,046 36,761 0.20 0.44 0.64 50 -1
52 Chengdu CN 1,364 42,467 0.14 0.51 0.64 56 4
53 Heidelberg-Mannheim DE 3,903 20,938 0.39 0.25 0.64 46 -7
54 Istanbul TR 2,437 31,452 0.24 0.37 0.62 69 15
55 Copenhagen DK 2,854 27,185 0.29 0.32 0.61 53 -2
56 Atlanta, GA US 1,591 36,308 0.16 0.43 0.59 54 -2
57 Rome IT 821 40,435 0.08 0.48 0.56 55 -2
58 Cambridge GB 2,431 26,164 0.24 0.31 0.55 59 1
59 São Paulo BR 756 38,494 0.08 0.46 0.53 57 -2
60 Tianjin CN 807 37,572 0.08 0.45 0.53 67 7
61 Cincinnati, OH US 3,616 13,736 0.36 0.16 0.53 62 1
62 Nuremberg-Erlangen DE 3,699 12,357 0.37 0.15 0.52 58 -4
63 Pittsburgh, PA US 1,555 30,051 0.16 0.36 0.51 60 -3
64 Dallas, TX US 3,135 16,772 0.31 0.20 0.51 61 -3
65 Bengaluru IN 3,119 16,800 0.31 0.20 0.51 65 -
66 Ann Arbor, MI US 1,413 30,555 0.14 0.36 0.51 63 -3
67 Changsha CN 984 33,067 0.10 0.39 0.49 68 1
68 Helsinki FI 2,837 17,100 0.28 0.20 0.49 64 -4
69 Vienna AT 1,523 26,719 0.15 0.32 0.47 66 -3
70 Delhi IN 782 32,275 0.08 0.38 0.46 72 2
71 Oxford GB 1,419 26,692 0.14 0.32 0.46 70 -1
72 Vancouver, BC CA 1,478 24,217 0.15 0.29 0.44 73 1
73 Cleveland, OH US 1,460 23,982 0.15 0.29 0.43 71 -2
74 Lyon FR 2,270 16,950 0.23 0.20 0.43 74 -
75 Busan KR 2,136 17,640 0.21 0.21 0.42 75 -
76 Phoenix, AZ US 2,318 13,166 0.23 0.16 0.39 86 10
77 Ankara TR 435 28,652 0.04 0.34 0.38 76 -1
78 Ottawa, ON CA 1,829 16,573 0.18 0.20 0.38 80 2
79 Austin, TX US 2,151 13,516 0.22 0.16 0.38 77 -2
80 Qingdao CN 1,480 19,128 0.15 0.23 0.38 102 22
81 Suzhou CN 2,119 13,692 0.21 0.16 0.37 100 19
82 Bridgeport-New Haven, CT US 1,275 20,583 0.13 0.24 0.37 81 -1
83 Brisbane AU 1,098 21,591 0.11 0.26 0.37 83 -
84 Hamburg DE 1,874 15,020 0.19 0.18 0.37 79 -5
85 Grenoble FR 2,045 13,286 0.20 0.16 0.36 78 -7
86 Lausanne CH/FR 1,859 14,605 0.19 0.17 0.36 85 -1
87 Harbin CN 168 28,773 0.02 0.34 0.36 93 6
88 Chongqing CN 333 26,799 0.03 0.32 0.35 103 15
89 Jinan CN 477 25,528 0.05 0.30 0.35 99 10
90 Hefei CN 350 26,560 0.04 0.32 0.35 97 7
91 Basel CH/DE/FR 2,064 11,889 0.21 0.14 0.35 82 -9
92 Manchester GB 965 21,028 0.10 0.25 0.35 84 -8
93 Changchun CN 191 27,372 0.02 0.33 0.34 95 2
94 St. Louis, MO US 916 20,729 0.09 0.25 0.34 89 -5
95 Lund SE 1,925 12,124 0.19 0.14 0.34 90 -5
96 Columbus, OH US 991 19,902 0.10 0.24 0.34 88 -8
97 Mumbai IN 1,199 17,784 0.12 0.21 0.33 92 -5
98 Indianapolis, IN US 1,755 12,616 0.18 0.15 0.33 91 -7
99 Dublin IE 766 20,750 0.08 0.25 0.32 94 -5
100 Warsaw PL 429 23,419 0.04 0.28 0.32 98 -2
Source: WIPO Statistics Database, March 2019.Notes: Patent filing and scientific publication shares refer to the 2013–17 time frame and are based on fractional counts, as explained in the text. Codes referto the ISO-2 codes. See page 17 for a full list, with the following addition: TW = Taiwan, Province of China.
Rank Cluster name Economy PCT applications
Scientific publications
Share of total PCT filings, %
Share of total pubs,
%
Total Rank 2012-16
Rank change

The Global Innovation Index 201966
The entities driving collaboration between two clusters remained constant for scientific publications but differed for patenting. The Chinese Academy of Sciences (18, Beijing) emerged as the most frequent top collaborating entity for all 18 times that Beijing is listed as collaborating cluster for scientific co-authorships. The same is true for Johns Hopkins University (8, Washington, DC–Baltimore, MD), Columbia University (7, New York City, NY), and Harvard University (6, Boston- Cambridge, MA). In contrast, a wider array of firms drive co-patenting relationships. For example, 14 different firms are listed as the top collaborating entities for the 20 times that San Jose–San Francisco, CA is listed as a top collaborating cluster. Beijing has 8 different entities as the primary driver for its patent collaborations. Shenzhen-Hong Kong, conversely, has only 2 entities for the 6 times it is listed as a top collaborating cluster for co-patenting—Huawei (5) and Shenzhen Guohua OptoElectronics (1).
Concluding remarks
The 2019 S&T cluster ranking offers a window into the world’s innovation hotspots. The microdata, on the basis of which we identify and measure S&T clusters, further provide insight into the nature and direction of innovative activity taking place within different clusters.
As in previous years, it is important to point out several caveats and limitations of our approach. First, the precise shape of the identified clusters depends critically on the threshold parameters of our clustering algorithm. Although the relative ranking does not change substantially within a plausible range of threshold parameters, especially for the top 25 clusters, the geographic coverage of each cluster does fluctuate depending on the parameters chosen.
Second, our approach places equal weight on patenting and scientific output. Different weights would imply different rank orders, though changes would only be significant for the lower half of the top 100 list. Finally, while S&T activity is central to innovation performance, it naturally focuses on the upstream segments of the innovation value chain. Our data do not capture how S&T activity translates to productivity gains as well as new products and services in the marketplace.
Notes:
1 Gothenburg (Sweden) and Tainan–Kaohsiung (Taiwan) dropped out of the top 100; Qingdao (China) and Chongqing (China) entered the top 100.
2 Both Guangzhou (#21, + 11) and Phoenix, AZ (#76, +10) also experienced non-trivial increases in cluster area, however their growth was still primarily driven by new S&T output.
3 See Bergquist et al. (2018) for a description of our clustering algorithm and the threshold parameters chosen.
References:
Bergquist, K., Fink, C., & Raffo, J. (2018). Special section: Identifying and ranking the world’s largest science and technology clusters. In S. Dutta, B. Lanvin, & S. Wunsch-Vincent (Eds.), Global Innovation Index 2018: Energizing the World with Innovation. Ithaca, Fontainebleau, and Geneva: Cornell, INSEAD, and WIPO. 193–209.
Ester, M., Kriegel, H., Sander, J., & Xu, X. (1996). A density-based algorithm for discovering clusters in large spatial databases with noise. Proceedings of 2nd International Conference on Knowledge Discovery and Data Mining. 226–231.
Falagas, M.E., Pitsouni, E. I., Malietzis, G. A., & Pappas, G. (2007). Comparison of PubMed, Scopus, Web of Science, and Google Scholar: Strengths and Weaknesses. The FASEB Journal, 22(2), 338–42. Retrieved from https://doi.org/10.1096/fj.07-9492LSF.
Garfield, E. (1970). Citation indexing for studying science. Nature, 227(5259), 669–671.
Garfield, E. (1972). Citation analysis as a tool in journal evaluation. Science, 178(4060), 471–79.
Harzing, A. W., Alakangas, S. (2016). Google Scholar, Scopus and the Web of Science: A longitudinal and cross-disciplinary comparison. Scientometrics, 106(2), 787–804. Retrieved from https://doi.org/10.1007/s11192-015-1798-9.

Special Section: Cluster Rankings 67
FIGURE S-1 .2
Top 100 clusters worldwide
Clusters Noise 0 2500 5000km
Source: WIPO Statistics Database, March 2019.Note: Noise refers to all inventor / author locations not classified in a cluster.

The Global Innovation Index 201968
TABLE S-1 .3
Top 100 cluster rankings by publishing and patent performance
1 Tokyo-Yokohama JP Physics 9.22 University of Tokyo 13.85 Electrical machinery, apparatus, energy 9.86 Mitsubishi Electric 7.83
2 Shenzhen-Hong Kong CN/HK Engineering 10.81 University of Hong Kong 17.23 Digital communication 38.39 Huawei 25.76
3 Seoul KR Engineering 7.53 Seoul National University 16.10 Digital communication 16.63 LG Electronics 18.71
4 Beijing CN Chemistry 10.30 Chinese Academy of Sciences 22.69 Digital communication 23.60 BOE Technology Group 24.43
5 San Jose-San Francisco, CA US Chemistry 6.14 University of California 38.59 Computer technology 23.18 Google 8.04
6 Osaka-Kobe-Kyoto JP Chemistry 10.41 Kyoto University 22.53 Electrical machinery, apparatus, energy 13.27 Murata Manufacturing 10.61
7 Boston-Cambridge, MA US Oncology 5.63 Harvard University 53.87 Pharmaceuticals 17.03 M.I.T 6.81
8 New York City, NY US Neurosciences & Neurology 5.72 Columbia University 13.26 Pharmaceuticals 14.52 Honeywell 5.49
9 Paris FR Physics 7.48 CNRS 22.81 Transport 11.49 L’Oréal 7.60
10 San Diego, CA US Science & Technology-Other Topics 6.21 University of California 51.51 Digital communication 30.37 Qualcomm 58.45
11 Shanghai CN Chemistry 13.07 Shanghai Jiao Tong University 23.06 Digital communication 10.48 Alcatel Lucent 3.36
12 Nagoya JP Chemistry 9.24 Nagoya University 37.49 Electrical machinery, apparatus, energy 17.99 Toyota 23.97
13 Washington, DC-Baltimore, MD US Neurosciences & Neurology 5.11 Johns Hopkins University 24.62 Pharmaceuticals 17.74 Johns Hopkins University 13.52
14 Los Angeles, CA US Neurosciences & Neurology 5.35 University of California 44.49 Medical technology 18.52 University of California 6.00
15 London GB General & Internal Medicine 6.90 University of London 49.28 Digital communication 11.71 British Telecom 8.06
16 Houston, TX US Oncology 11.86 Baylor College of Medicine 20.49 Civil engineering 34.74 Halliburton 18.55
17 Seattle, WA US General & Internal Medicine 4.79 University of Washington 65.07 Computer technology 41.74 Microsoft 35.47
18 Amsterdam-Rotterdam NL Cardiovascular System & Cardiology 6.09 University of Utrecht 13.01 Civil engineering 6.61 Shell 8.86
19 Chicago, IL US Neurosciences & Neurology 5.26 Northwestern University 28.12 Digital communication 8.22 Illinois Tool Works 14.76
20 Cologne DE Chemistry 6.77 University of Bonn 15.84 Basic materials chemistry 10.37 Henkel 9.55
21 Guangzhou CN Chemistry 10.32 Sun Yat Sen University 27.92 Electrical machinery, apparatus, energy 8.95 South China University of Tech. 5.26
22 Daejeon KR Engineering 13.45 KAIST 25.41 Electrical machinery, apparatus, energy 20.90 LG Chem 40.16
23 Tel Aviv-Jerusalem IL Neurosciences & Neurology 6.21 Tel Aviv University 34.05 Computer technology 17.76 Intel 5.30
24 Munich DE Physics 7.95 University of Munich 50.80 Transport 12.33 BMW 15.74
25 Nanjing CN Chemistry 12.35 Nanjing University 17.55 Electrical machinery, apparatus, energy 10.35 Southeast University 9.36
26 Stuttgart DE Chemistry 7.23 Eberhard Karls University of Tubingen 44.09 Electrical machinery, apparatus, energy 13.02 Robert Bosch 46.89
27 Minneapolis, MN US Chemistry 5.64 University of Minnesota 70.89 Medical technology 30.22 3M Innovative Properties 35.40
28 Singapore SG Engineering 10.56 National University of Singapore 37.35 Computer technology 7.64 A*Star 17.76
29 Philadelphia, PA US Neurosciences & Neurology 5.84 University of Pennsylvania 50.32 Pharmaceuticals 20.85 University of Pennsylvania 10.85
30 Hangzhou CN Chemistry 12.43 Zhejiang University 57.90 Computer technology 31.29 Alibaba Group 48.68
31 Eindhoven BE/NL Engineering 14.72 Eindhoven University of Tech. 61.43 Medical technology 26.00 Philips Electronics 77.26
32 Stockholm SE Science & Technology-Other Topics 5.70 Karolinska Institutet 49.23 Digital communication 39.76 LM Ericsson 45.89
33 Moscow RU Physics 17.44 Russian Academy of Sciences 37.50 Computer technology 11.24 Yandex Europe 3.91
34 Raleigh, NC US Science & Technology-Other Topics 4.56 University of North Carolina 50.62 Pharmaceuticals 12.78 Duke University 8.44
35 Melbourne AU General & Internal Medicine 5.42 University of Melbourne 24.56 Pharmaceuticals 8.99 Monash University 5.56
36 Frankfurt Am Main DE Physics 9.05 Goethe University Frankfurt 23.62 Medical technology 12.31 Merck Patent 9.04
37 Sydney AU General & Internal Medicine 5.43 University of Sydney 40.15 Medical technology 12.09 Cochlear 4.83
38 Wuhan CN Chemistry 10.43 Huazhong University of Science & Tech. 29.81 Optics 15.27 Wuhan China Star Optoelectronics Tech. 16.88
39 Toronto, ON CA Neurosciences & Neurology 7.07 University of Toronto 81.09 Medical technology 12.76 Synaptive Medical 5.10
40 Brussels BE Physics 4.93 KU Leuven 34.62 Basic materials chemistry 7.79 Procter & Gamble Company 5.23
41 Berlin DE Chemistry 7.28 Free University Of Berlin 36.71 Electrical machinery, apparatus, energy 11.12 Siemens 12.67
42 Madrid ES Chemistry 5.77 CSIC 15.35 Digital communication 12.45 CSIC 9.16
43 Taipei TW Engineering 8.22 National Taiwan University 26.77 Computer technology 12.08 Hewlett-Packard 12.13
44 Barcelona ES Chemistry 5.29 University of Barcelona 29.52 Pharmaceuticals 9.93 Hewlett-Packard 19.87
45 Portland, OR US Neurosciences & Neurology 6.54 Oregon University System 65.73 Computer technology 24.08 Intel 53.80
46 Tehran IR Engineering 15.92 Tehran University of Medical Sciences 10.85 Medical technology 12.43 Gharooni, Milad 3.04
47 Xi’an CN Engineering 13.97 Xi’an Jiaotong University 29.28 Digital communication 16.74 Xi’an Jiaotong University 11.90
48 Milan IT Neurosciences & Neurology 7.96 University of Milan 24.40 Electrical machinery, apparatus, energy 6.97 Pirelli Tyre 7.64
49 Denver, CO US Meteorology & Atmospheric Sciences 5.00 University of Colorado 56.07 Medical technology 13.77 University of Colorado 6.94
50 Zürich CH/DE Chemistry 7.87 University of Zurich 36.18 Medical technology 8.39 Sika Technology 5.14
Rank Cluster name Economy(ies) Top scientific organizationShare, %Top science field
Scientific publishing performance

Special Section: Cluster Rankings 69
TABLE S-1 .3
Top 100 cluster rankings by publishing and patent performance
1 Tokyo-Yokohama JP Physics 9.22 University of Tokyo 13.85 Electrical machinery, apparatus, energy 9.86 Mitsubishi Electric 7.83
2 Shenzhen-Hong Kong CN/HK Engineering 10.81 University of Hong Kong 17.23 Digital communication 38.39 Huawei 25.76
3 Seoul KR Engineering 7.53 Seoul National University 16.10 Digital communication 16.63 LG Electronics 18.71
4 Beijing CN Chemistry 10.30 Chinese Academy of Sciences 22.69 Digital communication 23.60 BOE Technology Group 24.43
5 San Jose-San Francisco, CA US Chemistry 6.14 University of California 38.59 Computer technology 23.18 Google 8.04
6 Osaka-Kobe-Kyoto JP Chemistry 10.41 Kyoto University 22.53 Electrical machinery, apparatus, energy 13.27 Murata Manufacturing 10.61
7 Boston-Cambridge, MA US Oncology 5.63 Harvard University 53.87 Pharmaceuticals 17.03 M.I.T 6.81
8 New York City, NY US Neurosciences & Neurology 5.72 Columbia University 13.26 Pharmaceuticals 14.52 Honeywell 5.49
9 Paris FR Physics 7.48 CNRS 22.81 Transport 11.49 L’Oréal 7.60
10 San Diego, CA US Science & Technology-Other Topics 6.21 University of California 51.51 Digital communication 30.37 Qualcomm 58.45
11 Shanghai CN Chemistry 13.07 Shanghai Jiao Tong University 23.06 Digital communication 10.48 Alcatel Lucent 3.36
12 Nagoya JP Chemistry 9.24 Nagoya University 37.49 Electrical machinery, apparatus, energy 17.99 Toyota 23.97
13 Washington, DC-Baltimore, MD US Neurosciences & Neurology 5.11 Johns Hopkins University 24.62 Pharmaceuticals 17.74 Johns Hopkins University 13.52
14 Los Angeles, CA US Neurosciences & Neurology 5.35 University of California 44.49 Medical technology 18.52 University of California 6.00
15 London GB General & Internal Medicine 6.90 University of London 49.28 Digital communication 11.71 British Telecom 8.06
16 Houston, TX US Oncology 11.86 Baylor College of Medicine 20.49 Civil engineering 34.74 Halliburton 18.55
17 Seattle, WA US General & Internal Medicine 4.79 University of Washington 65.07 Computer technology 41.74 Microsoft 35.47
18 Amsterdam-Rotterdam NL Cardiovascular System & Cardiology 6.09 University of Utrecht 13.01 Civil engineering 6.61 Shell 8.86
19 Chicago, IL US Neurosciences & Neurology 5.26 Northwestern University 28.12 Digital communication 8.22 Illinois Tool Works 14.76
20 Cologne DE Chemistry 6.77 University of Bonn 15.84 Basic materials chemistry 10.37 Henkel 9.55
21 Guangzhou CN Chemistry 10.32 Sun Yat Sen University 27.92 Electrical machinery, apparatus, energy 8.95 South China University of Tech. 5.26
22 Daejeon KR Engineering 13.45 KAIST 25.41 Electrical machinery, apparatus, energy 20.90 LG Chem 40.16
23 Tel Aviv-Jerusalem IL Neurosciences & Neurology 6.21 Tel Aviv University 34.05 Computer technology 17.76 Intel 5.30
24 Munich DE Physics 7.95 University of Munich 50.80 Transport 12.33 BMW 15.74
25 Nanjing CN Chemistry 12.35 Nanjing University 17.55 Electrical machinery, apparatus, energy 10.35 Southeast University 9.36
26 Stuttgart DE Chemistry 7.23 Eberhard Karls University of Tubingen 44.09 Electrical machinery, apparatus, energy 13.02 Robert Bosch 46.89
27 Minneapolis, MN US Chemistry 5.64 University of Minnesota 70.89 Medical technology 30.22 3M Innovative Properties 35.40
28 Singapore SG Engineering 10.56 National University of Singapore 37.35 Computer technology 7.64 A*Star 17.76
29 Philadelphia, PA US Neurosciences & Neurology 5.84 University of Pennsylvania 50.32 Pharmaceuticals 20.85 University of Pennsylvania 10.85
30 Hangzhou CN Chemistry 12.43 Zhejiang University 57.90 Computer technology 31.29 Alibaba Group 48.68
31 Eindhoven BE/NL Engineering 14.72 Eindhoven University of Tech. 61.43 Medical technology 26.00 Philips Electronics 77.26
32 Stockholm SE Science & Technology-Other Topics 5.70 Karolinska Institutet 49.23 Digital communication 39.76 LM Ericsson 45.89
33 Moscow RU Physics 17.44 Russian Academy of Sciences 37.50 Computer technology 11.24 Yandex Europe 3.91
34 Raleigh, NC US Science & Technology-Other Topics 4.56 University of North Carolina 50.62 Pharmaceuticals 12.78 Duke University 8.44
35 Melbourne AU General & Internal Medicine 5.42 University of Melbourne 24.56 Pharmaceuticals 8.99 Monash University 5.56
36 Frankfurt Am Main DE Physics 9.05 Goethe University Frankfurt 23.62 Medical technology 12.31 Merck Patent 9.04
37 Sydney AU General & Internal Medicine 5.43 University of Sydney 40.15 Medical technology 12.09 Cochlear 4.83
38 Wuhan CN Chemistry 10.43 Huazhong University of Science & Tech. 29.81 Optics 15.27 Wuhan China Star Optoelectronics Tech. 16.88
39 Toronto, ON CA Neurosciences & Neurology 7.07 University of Toronto 81.09 Medical technology 12.76 Synaptive Medical 5.10
40 Brussels BE Physics 4.93 KU Leuven 34.62 Basic materials chemistry 7.79 Procter & Gamble Company 5.23
41 Berlin DE Chemistry 7.28 Free University Of Berlin 36.71 Electrical machinery, apparatus, energy 11.12 Siemens 12.67
42 Madrid ES Chemistry 5.77 CSIC 15.35 Digital communication 12.45 CSIC 9.16
43 Taipei TW Engineering 8.22 National Taiwan University 26.77 Computer technology 12.08 Hewlett-Packard 12.13
44 Barcelona ES Chemistry 5.29 University of Barcelona 29.52 Pharmaceuticals 9.93 Hewlett-Packard 19.87
45 Portland, OR US Neurosciences & Neurology 6.54 Oregon University System 65.73 Computer technology 24.08 Intel 53.80
46 Tehran IR Engineering 15.92 Tehran University of Medical Sciences 10.85 Medical technology 12.43 Gharooni, Milad 3.04
47 Xi’an CN Engineering 13.97 Xi’an Jiaotong University 29.28 Digital communication 16.74 Xi’an Jiaotong University 11.90
48 Milan IT Neurosciences & Neurology 7.96 University of Milan 24.40 Electrical machinery, apparatus, energy 6.97 Pirelli Tyre 7.64
49 Denver, CO US Meteorology & Atmospheric Sciences 5.00 University of Colorado 56.07 Medical technology 13.77 University of Colorado 6.94
50 Zürich CH/DE Chemistry 7.87 University of Zurich 36.18 Medical technology 8.39 Sika Technology 5.14
Top scientific organization Share, %Top applicantShare, %Share, % Top patenting field
Scientific publishing performance Patent performance

The Global Innovation Index 201970
TABLE S-1 .3
Top 100 cluster rankings by publishing and patent performance, continued
51 Montréal, QC CA Engineering 7.20 McGill University 42.47 Digital communication 17.11 LM Ericsson 9.10
52 Chengdu CN Engineering 11.14 Sichuan University 42.54 Pharmaceuticals 11.70 Sichuan Haisco Pharmaceutical 4.32
53 Mannheim DE Oncology 9.31 Ruprecht Karl University Heidelberg 58.56 Basic materials chemistry 13.27 BASF 42.53
54 Istanbul TR Engineering 6.99 Istanbul University 18.58 Other consumer goods 18.74 Arcelik 46.21
55 Copenhagen DK Neurosciences & Neurology 5.41 University of Copenhagen 72.62 Biotechnology 15.25 Novozymes 11.02
56 Atlanta, GA US Public, Environmental & Occupational Health 6.76 Emory University 37.21 Medical technology 13.66 Georgia Tech 7.93
57 Rome IT Neurosciences & Neurology 6.62 Sapienza University Rome 31.67 Medical technology 10.87 Bridgestone 7.12
58 Cambridge GB Science & Technology-Other Topics 7.50 University of Cambridge 73.38 Computer technology 15.46 ARM 9.09
59 São Paulo BR Neurosciences & Neurology 4.24 Universidade de Sao Paulo 46.86 Medical technology 8.32 Mahle Metal Leve 3.23
60 Tianjin CN Chemistry 18.13 Tianjin University 29.17 Pharmaceuticals 9.14 Tianjin University 11.93
61 Cincinnati, OH US Pediatrics 6.49 University of Cincinnati 46.17 Medical technology 32.37 Procter & Gamble Company 43.19
62 Nürnberg DE Chemistry 7.95 University of Erlangen Nuremberg 67.33 Electrical machinery, apparatus, energy 16.91 Siemens 37.99
63 Pittsburgh, PA US Neurosciences & Neurology 5.76 PCSHE 67.50 Medical technology 12.86 University of Pittsburgh 13.39
64 Dallas, TX US Cardiovascular System & Cardiology 6.50 Univ. of Texas Southwestern Med. Center 39.25 Civil engineering 17.24 Halliburton 16.39
65 Bengaluru IN Chemistry 12.54 IISC-Bengaluru 30.39 Computer technology 22.79 Hewlett-Packard 11.26
66 Ann Arbor, MI US Chemistry 4.68 University of Michigan 89.15 Pharmaceuticals 10.20 University of Michigan 27.71
67 Changsha CN Engineering 10.81 Central South University 42.83 Civil engineering 15.63 Zoomlion 32.84
68 Helsinki FI Science & Technology-Other Topics 4.81 University of Helsinki 56.72 Digital communication 31.13 Nokia 10.89
69 Vienna AT Physics 4.89 Medical University of Vienna 28.13 Pharmaceuticals 9.29 Siemens 4.11
70 Delhi IN Chemistry 7.83 All India Institute of Medical Sciences 14.08 Pharmaceuticals 13.98 Ranbaxy Laboratories 6.49
71 Oxford GB Physics 7.19 University of Oxford 78.10 Biotechnology 12.84 Oxford University 17.77
72 Vancouver, BC CA Neurosciences & Neurology 4.86 University of British Columbia 70.21 Medical technology 9.60 University of British Columbia 7.07
73 Cleveland, OH US Cardiovascular System & Cardiology 7.84 Cleveland Clinic 47.33 Medical technology 15.62 Cleveland Clinic 10.83
74 Lyon FR Chemistry 6.98 CNRS 31.25 Basic materials chemistry 10.63 IFP Energies Nouvelles 10.95
75 Busan KR Engineering 9.69 Pusan National University 35.02 Electrical machinery, apparatus, energy 7.61 Pusan National University 5.09
76 Phoenix, AZ US Neurosciences & Neurology 6.76 Arizona State University 50.97 Semiconductors 15.41 Intel 23.66
77 Ankara TR Cardiovascular System & Cardiology 5.64 Hacettepe University 17.32 Medical technology 13.63 Aselsan 21.65
78 Ottawa, ON CA Engineering 6.12 University of Ottawa 57.42 Digital communication 44.40 Huawei 35.66
79 Austin, TX US Chemistry 10.52 University Of Texas Austin 66.99 Computer technology 22.27 University Of Texas 12.58
80 Qingdao CN Chemistry 13.52 Ocean University of China 21.54 Other consumer goods 33.11 Qingdao Haier Washing Machine 14.66
81 Suzhou CN Chemistry 17.40 Suzhou University 68.69 Electrical machinery, apparatus, energy 9.53 Positec Power Tools 4.68
82 Bridgeport-New Haven, CT US Neurosciences & Neurology 6.27 Yale University 85.32 Pharmaceuticals 15.50 Yale University 11.13
83 Brisbane AU Engineering 5.32 University of Queensland 49.46 Civil engineering 12.68 University of Queensland 8.84
84 Hamburg DE Physics 7.89 University of Hamburg 57.59 Organic fine chemistry 16.14 Henkel 9.17
85 Grenoble FR Physics 17.55 CNRS 42.01 Electrical machinery, apparatus, energy 13.97 CEA 40.01
86 Lausanne CH/FR Chemistry 7.95 EPFL 46.74 Food chemistry 8.87 NESTEC 26.77
87 Harbin CN Engineering 12.15 Harbin Institute of Technology 42.85 Measurement 12.51 Harbin Institute of Technology 38.65
88 Chongqing CN Chemistry 10.09 Chongqing University 26.46 Medical technology 13.23 Chongqing Runze Pharmaceutical 10.51
89 Jinan CN Chemistry 14.24 Shandong University 58.50 Computer technology 10.79 Shandong University 10.04
90 Hefei CN Physics 14.69 University of Science & Tech. of China 41.28 Other consumer goods 12.12 Anhui Jianghuai Automobile 10.56
91 Basel CH/DE/FR Pharmacology & Pharmacy 7.54 University of Basel 60.83 Pharmaceuticals 19.04 F. Hoffmann-La Roche 13.38
92 Manchester GB Chemistry 6.77 University of Manchester 65.91 Electrical machinery, apparatus, energy 15.71 Micromass 13.76
93 Changchun CN Chemistry 23.62 Jilin University 57.67 Measurement 14.00 Changchun Institute Of Applied Chemistry 15.69
94 St. Louis, MO US Neurosciences & Neurology 6.39 Washington University (WUSTL) 69.55 Biotechnology 16.63 Monsanto Technology 16.54
95 Lund SE Science & Technology-Other Topics 5.59 Lund University 86.72 Digital communication 22.79 LM Ericsson 21.81
96 Columbus, OH US Oncology 5.29 Ohio State University 89.88 Pharmaceuticals 13.23 Abbott Laboratories 13.01
97 Mumbai IN Chemistry 16.28 Bhabha Atomic Research Center 22.72 Organic fine chemistry 18.23 Piramal Enterprises 5.26
98 Indianapolis, IN US Pharmacology & Pharmacy 5.05 Indiana University 68.17 Basic materials chemistry 11.81 Dow AgroSciences 22.46
99 Dublin IE General & Internal Medicine 17.79 Trinity College 30.49 Computer technology 11.08 Alcatel Lucent 8.07
100 Warsaw PL Chemistry 9.32 Polish Academy of Sciences 19.76 Medical technology 8.18 General Electric 4.00
Rank Cluster name Economy(ies) Top scientific organizationShare, %Top science field
Scientific publishing performance
Source: WIPO Statistics Database, March 2019.Notes: Patent filing and scientific publication shares refer to the 2013–17 period and are based on fractional counts, as explained in the text. We use the location of inventors to associate patent applicants to clusters; note that addresses of applicants may well be outside the cluster(s) to which they are associated. The identification of technology fields relies on the WIPO technology concordance table linking International Patent Classification (IPC) symbols with 35 fields of technology (available at http://www.wipo.int/ipstats/en/).

Special Section: Cluster Rankings 71
TABLE S-1 .3
Top 100 cluster rankings by publishing and patent performance, continued
51 Montréal, QC CA Engineering 7.20 McGill University 42.47 Digital communication 17.11 LM Ericsson 9.10
52 Chengdu CN Engineering 11.14 Sichuan University 42.54 Pharmaceuticals 11.70 Sichuan Haisco Pharmaceutical 4.32
53 Mannheim DE Oncology 9.31 Ruprecht Karl University Heidelberg 58.56 Basic materials chemistry 13.27 BASF 42.53
54 Istanbul TR Engineering 6.99 Istanbul University 18.58 Other consumer goods 18.74 Arcelik 46.21
55 Copenhagen DK Neurosciences & Neurology 5.41 University of Copenhagen 72.62 Biotechnology 15.25 Novozymes 11.02
56 Atlanta, GA US Public, Environmental & Occupational Health 6.76 Emory University 37.21 Medical technology 13.66 Georgia Tech 7.93
57 Rome IT Neurosciences & Neurology 6.62 Sapienza University Rome 31.67 Medical technology 10.87 Bridgestone 7.12
58 Cambridge GB Science & Technology-Other Topics 7.50 University of Cambridge 73.38 Computer technology 15.46 ARM 9.09
59 São Paulo BR Neurosciences & Neurology 4.24 Universidade de Sao Paulo 46.86 Medical technology 8.32 Mahle Metal Leve 3.23
60 Tianjin CN Chemistry 18.13 Tianjin University 29.17 Pharmaceuticals 9.14 Tianjin University 11.93
61 Cincinnati, OH US Pediatrics 6.49 University of Cincinnati 46.17 Medical technology 32.37 Procter & Gamble Company 43.19
62 Nürnberg DE Chemistry 7.95 University of Erlangen Nuremberg 67.33 Electrical machinery, apparatus, energy 16.91 Siemens 37.99
63 Pittsburgh, PA US Neurosciences & Neurology 5.76 PCSHE 67.50 Medical technology 12.86 University of Pittsburgh 13.39
64 Dallas, TX US Cardiovascular System & Cardiology 6.50 Univ. of Texas Southwestern Med. Center 39.25 Civil engineering 17.24 Halliburton 16.39
65 Bengaluru IN Chemistry 12.54 IISC-Bengaluru 30.39 Computer technology 22.79 Hewlett-Packard 11.26
66 Ann Arbor, MI US Chemistry 4.68 University of Michigan 89.15 Pharmaceuticals 10.20 University of Michigan 27.71
67 Changsha CN Engineering 10.81 Central South University 42.83 Civil engineering 15.63 Zoomlion 32.84
68 Helsinki FI Science & Technology-Other Topics 4.81 University of Helsinki 56.72 Digital communication 31.13 Nokia 10.89
69 Vienna AT Physics 4.89 Medical University of Vienna 28.13 Pharmaceuticals 9.29 Siemens 4.11
70 Delhi IN Chemistry 7.83 All India Institute of Medical Sciences 14.08 Pharmaceuticals 13.98 Ranbaxy Laboratories 6.49
71 Oxford GB Physics 7.19 University of Oxford 78.10 Biotechnology 12.84 Oxford University 17.77
72 Vancouver, BC CA Neurosciences & Neurology 4.86 University of British Columbia 70.21 Medical technology 9.60 University of British Columbia 7.07
73 Cleveland, OH US Cardiovascular System & Cardiology 7.84 Cleveland Clinic 47.33 Medical technology 15.62 Cleveland Clinic 10.83
74 Lyon FR Chemistry 6.98 CNRS 31.25 Basic materials chemistry 10.63 IFP Energies Nouvelles 10.95
75 Busan KR Engineering 9.69 Pusan National University 35.02 Electrical machinery, apparatus, energy 7.61 Pusan National University 5.09
76 Phoenix, AZ US Neurosciences & Neurology 6.76 Arizona State University 50.97 Semiconductors 15.41 Intel 23.66
77 Ankara TR Cardiovascular System & Cardiology 5.64 Hacettepe University 17.32 Medical technology 13.63 Aselsan 21.65
78 Ottawa, ON CA Engineering 6.12 University of Ottawa 57.42 Digital communication 44.40 Huawei 35.66
79 Austin, TX US Chemistry 10.52 University Of Texas Austin 66.99 Computer technology 22.27 University Of Texas 12.58
80 Qingdao CN Chemistry 13.52 Ocean University of China 21.54 Other consumer goods 33.11 Qingdao Haier Washing Machine 14.66
81 Suzhou CN Chemistry 17.40 Suzhou University 68.69 Electrical machinery, apparatus, energy 9.53 Positec Power Tools 4.68
82 Bridgeport-New Haven, CT US Neurosciences & Neurology 6.27 Yale University 85.32 Pharmaceuticals 15.50 Yale University 11.13
83 Brisbane AU Engineering 5.32 University of Queensland 49.46 Civil engineering 12.68 University of Queensland 8.84
84 Hamburg DE Physics 7.89 University of Hamburg 57.59 Organic fine chemistry 16.14 Henkel 9.17
85 Grenoble FR Physics 17.55 CNRS 42.01 Electrical machinery, apparatus, energy 13.97 CEA 40.01
86 Lausanne CH/FR Chemistry 7.95 EPFL 46.74 Food chemistry 8.87 NESTEC 26.77
87 Harbin CN Engineering 12.15 Harbin Institute of Technology 42.85 Measurement 12.51 Harbin Institute of Technology 38.65
88 Chongqing CN Chemistry 10.09 Chongqing University 26.46 Medical technology 13.23 Chongqing Runze Pharmaceutical 10.51
89 Jinan CN Chemistry 14.24 Shandong University 58.50 Computer technology 10.79 Shandong University 10.04
90 Hefei CN Physics 14.69 University of Science & Tech. of China 41.28 Other consumer goods 12.12 Anhui Jianghuai Automobile 10.56
91 Basel CH/DE/FR Pharmacology & Pharmacy 7.54 University of Basel 60.83 Pharmaceuticals 19.04 F. Hoffmann-La Roche 13.38
92 Manchester GB Chemistry 6.77 University of Manchester 65.91 Electrical machinery, apparatus, energy 15.71 Micromass 13.76
93 Changchun CN Chemistry 23.62 Jilin University 57.67 Measurement 14.00 Changchun Institute Of Applied Chemistry 15.69
94 St. Louis, MO US Neurosciences & Neurology 6.39 Washington University (WUSTL) 69.55 Biotechnology 16.63 Monsanto Technology 16.54
95 Lund SE Science & Technology-Other Topics 5.59 Lund University 86.72 Digital communication 22.79 LM Ericsson 21.81
96 Columbus, OH US Oncology 5.29 Ohio State University 89.88 Pharmaceuticals 13.23 Abbott Laboratories 13.01
97 Mumbai IN Chemistry 16.28 Bhabha Atomic Research Center 22.72 Organic fine chemistry 18.23 Piramal Enterprises 5.26
98 Indianapolis, IN US Pharmacology & Pharmacy 5.05 Indiana University 68.17 Basic materials chemistry 11.81 Dow AgroSciences 22.46
99 Dublin IE General & Internal Medicine 17.79 Trinity College 30.49 Computer technology 11.08 Alcatel Lucent 8.07
100 Warsaw PL Chemistry 9.32 Polish Academy of Sciences 19.76 Medical technology 8.18 General Electric 4.00
Top scientific organization Share, %Top applicantShare, %Share, % Top patenting field
Scientific publishing performance Patent performance
The top scientific field is based on SCIE’s Extended Ascatype subject field. An article can be assigned to more than one subject field. Fractional counting was used when more than one subject was assigned to an article. Codes refer to the ISO-2 codes. See page 17 for a full list, with the following addition: TW = Taiwan, Province of China. CNRS = Centre National de la Recherche Scientifique, CSIC = Consejo Superior de Investigaciones Cientificas, PCSHE = Pennsylvania Commonwealth System of Higher Education, IISC = Indian Institute of Science, EPFL = Ecole Polytechnique Federale de Lausanne, CEA = Commissariat a L’Energie Atomique et aux Energies Alternatives.

The Global Innovation Index 201972
TABLE S-1 .4
Top collaborating entities by cluster
1 Tokyo-Yokohama JP Osaka-Kobe-Kyoto 8.15 Kyoto University 24.89 Osaka-Kobe-Kyoto 1.30 Hitachi 4.15
2 Shenzhen-Hong Kong CN/HK Beijing 9.66 Chinese Academy of Sciences 20.15 Beijing 0.21 Huawei 70.34
3 Seoul KR Daejeon 4.32 KAIST 16.93 Daejeon 2.82 LG Chem 9.80
4 Beijing CN Shanghai 3.15 Chinese Academy of Sciences 32.13 San Jose-San Francisco, CA 1.19 Intel 58.38
5 San Jose-San Francisco, CA US Boston-Cambridge, MA 5.28 Harvard University 55.82 Portland, OR 1.71 Intel 83.05
6 Osaka-Kobe-Kyoto JP Tokyo-Yokohama 20.16 University of Tokyo 13.44 Tokyo-Yokohama 5.16 Hitachi 3.20
7 Boston-Cambridge, MA US New York City, NY 4.95 Columbia University 15.52 San Jose-San Francisco, CA 2.65 Robert Bosch 4.78
8 New York City, NY US Boston-Cambridge, MA 4.88 Harvard University 56.89 Boston-Cambridge, MA 3.18 Merck Sharp & Dohme Corp. 7.76
9 Paris FR Lyon 2.53 CNRS 25.27 Lyon 1.39 IFP Energies Nouvelles 26.68
10 San Diego, CA US San Jose-San Francisco, CA 5.36 University of California 35.93 San Jose-San Francisco, CA 2.04 Qualcomm 10.11
11 Shanghai CN Beijing 6.00 Chinese Academy of Sciences 38.80 New York City, NY 1.72 Merck Sharp & Dohme Corp. 63.36
12 Nagoya JP Tokyo-Yokohama 24.42 University of Tokyo 12.98 Tokyo-Yokohama 3.35 Toyota 6.70
13 Washington, DC-Baltimore, MD US Boston-Cambridge, MA 4.62 Harvard University 56.85 San Jose-San Francisco, CA 3.13 Robert Bosch 6.33
14 Los Angeles, CA US San Jose-San Francisco, CA 4.77 University of California 37.56 San Jose-San Francisco, CA 4.22 University of California 4.07
15 London GB Oxford 2.62 University of Oxford 76.75 Cambridge 1.73 British American Tobacco 7.08
16 Houston, TX US San Jose-San Francisco, CA 6.49 Stanford University 51.03 New York City, NY 0.89 Exxonmobil 16.76
17 Seattle, WA US Boston-Cambridge, MA 5.30 Harvard University 61.10 San Jose-San Francisco, CA 2.28 Elwha LLC 10.62
18 Amsterdam-Rotterdam NL Nijmegen 4.70 Radboud University Nijmegen 54.38 Houston, TX 1.70 Shell 53.50
19 Chicago, IL US New York City, NY 4.35 Columbia University 16.34 San Jose-San Francisco, CA 1.69 Motorola Mobility 10.53
20 Cologne DE Berlin 3.97 Free University of Berlin 39.63 Aachen 2.61 Grüenthal 15.95
21 Guangzhou CN Beijing 7.06 Chinese Academy of Sciences 38.12 Shenzhen-Hong Kong 0.83 Shenzhen Guohua Optoelectronics 18.10
22 Daejeon KR Seoul 29.76 Seoul National University 16.14 Seoul 12.69 Lg Hausys 6.30
23 Tel Aviv-Jerusalem IL Haifa 4.11 Technion Israel Institute of Tech. 46.91 Haifa 5.72 Intel 18.77
24 Munich DE Cologne 5.12 University of Bonn 15.48 Nürnberg 1.95 Siemens 56.89
25 Nanjing CN Beijing 6.55 Chinese Academy of Sciences 36.02 Beijing 1.78 LM Ericsson 15.08
26 Stuttgart DE Cologne 4.42 University of Bonn 14.55 Mannheim 1.25 BASF 26.75
27 Minneapolis, MN US Washington, DC-Baltimore, MD 4.14 Johns Hopkins University 28.14 San Jose-San Francisco, CA 1.18 Pure Storage 8.08
28 Singapore SG Beijing 2.39 Chinese Academy of Sciences 23.94 San Jose-San Francisco, CA 1.72 Hewlett-Packard 17.96
29 Philadelphia, PA US New York City, NY 6.27 Columbia University 14.00 New York City, NY 14.37 Merck Sharp & Dohme Corp. 19.73
30 Hangzhou CN Beijing 5.58 Chinese Academy of Sciences 20.88 Shanghai 0.73 Shenzhen Luoshuhe Tech. Development 17.31
31 Eindhoven BE/NL Amsterdam-Rotterdam 24.27 Delft University of Technology 14.23 Amsterdam-Rotterdam 0.67 ASML 8.99
32 Stockholm SE Uppsala 6.31 Uppsala University 80.32 Uppsala 2.88 LM Ericsson 61.77
33 Moscow RU Saint Petersburg 2.02 Russian Academy of Sciences 29.89 Saint Petersburg 2.45 Rawllin International 11.87
34 Raleigh, NC US Washington, DC-Baltimore, MD 4.85 Johns Hopkins University 26.58 San Jose-San Francisco, CA 3.19 Carbon3D 12.51
35 Melbourne AU Sydney 6.37 University of Sydney 38.37 Sydney 1.92 Onesteel Wire 5.33
36 Frankfurt Am Main DE Cologne 5.74 University of Bonn 15.29 Mannheim 10.18 BASF 44.98
37 Sydney AU Melbourne 7.47 University of Melbourne 23.95 San Jose-San Francisco, CA 1.73 Dolby Laboratories 48.55
38 Wuhan CN Beijing 7.48 Chinese Academy of Sciences 38.69 Shenzhen-Hong Kong 2.08 Huawei 79.45
39 Toronto, ON CA Mississauga, ON 2.97 McMaster University 85.53 Mississauga, ON 4.05 Flextronics AP 7.51
40 Brussels BE Gent 5.43 Ghent University 85.67 Gent 2.70 Universiteit Gent 8.91
41 Berlin DE Cologne 4.95 University of Cologne 13.95 Cologne 5.50 Bayer 36.76
42 Madrid ES Barcelona 8.82 University of Barcelona 29.91 Barcelona 2.19 Laboratorios del Dr. Esteve S.A. 14.83
43 Taipei TW Taichung 7.15 China Medical University Taiwan 32.62 Hsinchu 7.86 MediaTek 55.61
44 Barcelona ES Madrid 8.24 CSIC 8.11 Madrid 1.25 CSIC 11.30
45 Portland, OR US San Jose-San Francisco, CA 6.12 University of California 37.69 San Jose-San Francisco, CA 9.93 Intel 76.00
46 Tehran IR Kuala Lumpur 0.34 Universiti Malaya 79.81 Houston, TX 2.10 Rice University 100.00
47 Xi’an CN Beijing 6.89 Chinese Academy of Sciences 25.90 Shenzhen-Hong Kong 3.60 Huawei 91.60
48 Milan IT Rome 6.10 Sapienza University Rome 22.38 Turin 1.13 Pirelli Tyre 30.35
49 Denver, CO US Washington, DC-Baltimore, MD 5.05 Johns Hopkins University 20.28 San Jose-San Francisco, CA 3.99 Intel 7.59
50 Zürich CH/DE Bern 3.38 University of Bern 78.28 Basel 2.30 F. Hoffmann-La Roche 13.27
Rank Cluster name Economy(ies) Top collaborating organizationShare, %Top scientific collaborating cluster
Scientific publishing collaboration

Special Section: Cluster Rankings 73
TABLE S-1 .4
Top collaborating entities by cluster
1 Tokyo-Yokohama JP Osaka-Kobe-Kyoto 8.15 Kyoto University 24.89 Osaka-Kobe-Kyoto 1.30 Hitachi 4.15
2 Shenzhen-Hong Kong CN/HK Beijing 9.66 Chinese Academy of Sciences 20.15 Beijing 0.21 Huawei 70.34
3 Seoul KR Daejeon 4.32 KAIST 16.93 Daejeon 2.82 LG Chem 9.80
4 Beijing CN Shanghai 3.15 Chinese Academy of Sciences 32.13 San Jose-San Francisco, CA 1.19 Intel 58.38
5 San Jose-San Francisco, CA US Boston-Cambridge, MA 5.28 Harvard University 55.82 Portland, OR 1.71 Intel 83.05
6 Osaka-Kobe-Kyoto JP Tokyo-Yokohama 20.16 University of Tokyo 13.44 Tokyo-Yokohama 5.16 Hitachi 3.20
7 Boston-Cambridge, MA US New York City, NY 4.95 Columbia University 15.52 San Jose-San Francisco, CA 2.65 Robert Bosch 4.78
8 New York City, NY US Boston-Cambridge, MA 4.88 Harvard University 56.89 Boston-Cambridge, MA 3.18 Merck Sharp & Dohme Corp. 7.76
9 Paris FR Lyon 2.53 CNRS 25.27 Lyon 1.39 IFP Energies Nouvelles 26.68
10 San Diego, CA US San Jose-San Francisco, CA 5.36 University of California 35.93 San Jose-San Francisco, CA 2.04 Qualcomm 10.11
11 Shanghai CN Beijing 6.00 Chinese Academy of Sciences 38.80 New York City, NY 1.72 Merck Sharp & Dohme Corp. 63.36
12 Nagoya JP Tokyo-Yokohama 24.42 University of Tokyo 12.98 Tokyo-Yokohama 3.35 Toyota 6.70
13 Washington, DC-Baltimore, MD US Boston-Cambridge, MA 4.62 Harvard University 56.85 San Jose-San Francisco, CA 3.13 Robert Bosch 6.33
14 Los Angeles, CA US San Jose-San Francisco, CA 4.77 University of California 37.56 San Jose-San Francisco, CA 4.22 University of California 4.07
15 London GB Oxford 2.62 University of Oxford 76.75 Cambridge 1.73 British American Tobacco 7.08
16 Houston, TX US San Jose-San Francisco, CA 6.49 Stanford University 51.03 New York City, NY 0.89 Exxonmobil 16.76
17 Seattle, WA US Boston-Cambridge, MA 5.30 Harvard University 61.10 San Jose-San Francisco, CA 2.28 Elwha LLC 10.62
18 Amsterdam-Rotterdam NL Nijmegen 4.70 Radboud University Nijmegen 54.38 Houston, TX 1.70 Shell 53.50
19 Chicago, IL US New York City, NY 4.35 Columbia University 16.34 San Jose-San Francisco, CA 1.69 Motorola Mobility 10.53
20 Cologne DE Berlin 3.97 Free University of Berlin 39.63 Aachen 2.61 Grüenthal 15.95
21 Guangzhou CN Beijing 7.06 Chinese Academy of Sciences 38.12 Shenzhen-Hong Kong 0.83 Shenzhen Guohua Optoelectronics 18.10
22 Daejeon KR Seoul 29.76 Seoul National University 16.14 Seoul 12.69 Lg Hausys 6.30
23 Tel Aviv-Jerusalem IL Haifa 4.11 Technion Israel Institute of Tech. 46.91 Haifa 5.72 Intel 18.77
24 Munich DE Cologne 5.12 University of Bonn 15.48 Nürnberg 1.95 Siemens 56.89
25 Nanjing CN Beijing 6.55 Chinese Academy of Sciences 36.02 Beijing 1.78 LM Ericsson 15.08
26 Stuttgart DE Cologne 4.42 University of Bonn 14.55 Mannheim 1.25 BASF 26.75
27 Minneapolis, MN US Washington, DC-Baltimore, MD 4.14 Johns Hopkins University 28.14 San Jose-San Francisco, CA 1.18 Pure Storage 8.08
28 Singapore SG Beijing 2.39 Chinese Academy of Sciences 23.94 San Jose-San Francisco, CA 1.72 Hewlett-Packard 17.96
29 Philadelphia, PA US New York City, NY 6.27 Columbia University 14.00 New York City, NY 14.37 Merck Sharp & Dohme Corp. 19.73
30 Hangzhou CN Beijing 5.58 Chinese Academy of Sciences 20.88 Shanghai 0.73 Shenzhen Luoshuhe Tech. Development 17.31
31 Eindhoven BE/NL Amsterdam-Rotterdam 24.27 Delft University of Technology 14.23 Amsterdam-Rotterdam 0.67 ASML 8.99
32 Stockholm SE Uppsala 6.31 Uppsala University 80.32 Uppsala 2.88 LM Ericsson 61.77
33 Moscow RU Saint Petersburg 2.02 Russian Academy of Sciences 29.89 Saint Petersburg 2.45 Rawllin International 11.87
34 Raleigh, NC US Washington, DC-Baltimore, MD 4.85 Johns Hopkins University 26.58 San Jose-San Francisco, CA 3.19 Carbon3D 12.51
35 Melbourne AU Sydney 6.37 University of Sydney 38.37 Sydney 1.92 Onesteel Wire 5.33
36 Frankfurt Am Main DE Cologne 5.74 University of Bonn 15.29 Mannheim 10.18 BASF 44.98
37 Sydney AU Melbourne 7.47 University of Melbourne 23.95 San Jose-San Francisco, CA 1.73 Dolby Laboratories 48.55
38 Wuhan CN Beijing 7.48 Chinese Academy of Sciences 38.69 Shenzhen-Hong Kong 2.08 Huawei 79.45
39 Toronto, ON CA Mississauga, ON 2.97 McMaster University 85.53 Mississauga, ON 4.05 Flextronics AP 7.51
40 Brussels BE Gent 5.43 Ghent University 85.67 Gent 2.70 Universiteit Gent 8.91
41 Berlin DE Cologne 4.95 University of Cologne 13.95 Cologne 5.50 Bayer 36.76
42 Madrid ES Barcelona 8.82 University of Barcelona 29.91 Barcelona 2.19 Laboratorios del Dr. Esteve S.A. 14.83
43 Taipei TW Taichung 7.15 China Medical University Taiwan 32.62 Hsinchu 7.86 MediaTek 55.61
44 Barcelona ES Madrid 8.24 CSIC 8.11 Madrid 1.25 CSIC 11.30
45 Portland, OR US San Jose-San Francisco, CA 6.12 University of California 37.69 San Jose-San Francisco, CA 9.93 Intel 76.00
46 Tehran IR Kuala Lumpur 0.34 Universiti Malaya 79.81 Houston, TX 2.10 Rice University 100.00
47 Xi’an CN Beijing 6.89 Chinese Academy of Sciences 25.90 Shenzhen-Hong Kong 3.60 Huawei 91.60
48 Milan IT Rome 6.10 Sapienza University Rome 22.38 Turin 1.13 Pirelli Tyre 30.35
49 Denver, CO US Washington, DC-Baltimore, MD 5.05 Johns Hopkins University 20.28 San Jose-San Francisco, CA 3.99 Intel 7.59
50 Zürich CH/DE Bern 3.38 University of Bern 78.28 Basel 2.30 F. Hoffmann-La Roche 13.27
Top collaborating organization Share, %Top collaborating applicantShare, %Share, % Top patent collaborating cluster
Scientific publishing collaboration Patent collaboration
CONTINUED

The Global Innovation Index 201974
TABLE S-1 .4
Top collaborating entities by cluster, continued
51 Montréal, QC CA Toronto, ON 3.94 University of Toronto 80.05 New York City, NY 2.80 Interdigital Patent Holdings 41.02
52 Chengdu CN Beijing 7.46 Chinese Academy of Sciences 32.60 Shenzhen-Hong Kong 1.24 Huawei 73.47
53 Mannheim DE Cologne 5.91 University of Cologne 16.50 Frankfurt Am Main 10.81 BASF 25.02
54 Istanbul TR Ankara 5.06 Hacettepe University 16.01 Ankara 0.41 Arcelik 21.92
55 Copenhagen DK Århus 4.79 Aarhus University 89.74 Lund 1.37 Danmarks Tekniske Universitet 12.22
56 Atlanta, GA US Washington, DC-Baltimore, MD 4.99 Johns Hopkins University 21.76 San Jose-San Francisco, CA 2.85 Stanford University 6.43
57 Rome IT Milan 5.60 University of Milan 20.88 Cologne 2.45 Bayer 96.21
58 Cambridge GB London 10.73 University of London 55.30 London 2.83 British American Tobacco 9.31
59 São Paulo BR Rio De Janeiro 2.99 Universidade Federal do Rio de Janeiro 30.80 Rio De Janeiro 1.31 Petrobras 20.65
60 Tianjin CN Beijing 9.34 Chinese Academy of Sciences 25.00 Beijing 1.28 China Electric Power Research Institute 16.67
61 Cincinnati, OH US Washington, DC-Baltimore, MD 4.07 Johns Hopkins University 22.88 Frankfurt Am Main 2.57 Procter & Gamble Company 82.39
62 Nürnberg DE Munich 9.44 University of Munich 50.66 Munich 3.54 Siemens 58.26
63 Pittsburgh, PA US Washington, DC-Baltimore, MD 4.30 Johns Hopkins University 30.78 Boston-Cambridge, MA 2.51 Berkshire Grey 17.44
64 Dallas, TX US New York City, NY 4.61 Columbia University 15.18 San Jose-San Francisco, CA 3.73 Hewlett-Packard 17.20
65 Bengaluru IN Delhi 2.40 CSIR 10.25 San Jose-San Francisco, CA 5.33 Applied Materials 28.00
66 Ann Arbor, MI US Boston-Cambridge, MA 4.41 Harvard University 63.27 Detroit, MI 4.72 BASF 11.23
67 Changsha CN Beijing 5.61 Chinese Academy of Sciences 25.37 Basel 0.42 Novartis 100.00
68 Helsinki FI Stockholm 3.32 Karolinska Institutet 57.86 Beijing 2.75 Broadcom 32.12
69 Vienna AT Graz 2.37 Medical University of Graz 46.22 Graz 2.00 AVL List 21.15
70 Delhi IN Pune 1.31 CSIR 40.65 Bengaluru 3.84 Mcafee 13.62
71 Oxford GB London 12.14 University of London 54.67 London 2.73 Sony 12.24
72 Vancouver, BC CA Toronto, ON 5.55 University of Toronto 80.16 San Jose-San Francisco, CA 3.37 Genentech 6.45
73 Cleveland, OH US New York City, NY 3.93 Columbia University 12.65 San Jose-San Francisco, CA 1.08 Cisco Technology 23.30
74 Lyon FR Paris 19.11 APHP 26.28 Paris 8.28 IFP Energies Nouvelles 22.25
75 Busan KR Seoul 26.06 Seoul National University 15.30 Seoul 21.29 Samsung Electronics 8.84
76 Phoenix, AZ US Washington, DC-Baltimore, MD 3.79 Johns Hopkins University 24.62 Portland, OR 6.03 Intel 94.14
77 Ankara TR Istanbul 5.04 Istanbul University 11.74 Istanbul 3.16 Santa Farma Ilac 30.02
78 Ottawa, ON CA Toronto, ON 8.78 University of Toronto 76.62 Dallas, TX 2.74 Blackberry 51.43
79 Austin, TX US Houston, TX 3.81 UTMD Anderson Cancer Center 15.98 San Jose-San Francisco, CA 7.32 Applied Materials 9.51
80 Qingdao CN Beijing 12.97 Chinese Academy of Sciences 45.07 Shanghai 0.52 Dow Global Technologies 74.23
81 Suzhou CN Beijing 8.30 Chinese Academy of Sciences 42.80 Beijing 1.74 Jiangsu Huadong Inst. of Li-Ion Battery 74.93
82 Bridgeport-New Haven, CT US New York City, NY 7.29 Columbia University 14.93 New York City, NY 5.71 Bristol-Myers Squibb 25.73
83 Brisbane AU Melbourne 8.32 University of Melbourne 24.30 Melbourne 1.70 University of Queensland 10.59
84 Hamburg DE Cologne 6.12 University of Bonn 15.45 Cologne 2.40 Henkel 35.93
85 Grenoble FR Paris 15.85 CNRS 30.03 Paris 5.99 CEA 39.14
86 Lausanne CH/FR Zürich 5.93 University of Zurich 32.16 Genève 5.00 NESTEC 18.14
87 Harbin CN Beijing 6.73 Chinese Academy of Sciences 17.84 Beijing 3.61 MediaTek 50.84
88 Chongqing CN Beijing 5.73 Chinese Academy of Sciences 24.88 Shenzhen-Hong Kong 1.30 Huawei 83.08
89 Jinan CN Beijing 7.03 Chinese Academy of Sciences 22.11 Beijing 1.13 Nokia 23.13
90 Hefei CN Beijing 8.33 Chinese Academy of Sciences 36.97 Shenzhen-Hong Kong 3.27 Huawei 76.16
91 Basel CH/DE/FR Zürich 7.78 University of Zurich 44.58 Zürich 3.71 Abb Technology Ag 8.13
92 Manchester GB London 8.03 University of London 51.13 Cambridge 2.46 AstraZeneca 28.01
93 Changchun CN Beijing 11.07 Chinese Academy of Sciences 58.97 Beijing 3.75 Peking University 22.07
94 St. Louis, MO US Boston-Cambridge, MA 4.13 Harvard University 67.33 Seattle, WA 2.62 Elwha LLC 75.48
95 Lund SE Stockholm 7.38 Karolinska Institutet 64.40 Stockholm 9.26 LM Ericsson 81.90
96 Columbus, OH US Washington, DC-Baltimore, MD 3.58 Johns Hopkins University 27.09 Cincinnati, OH 2.48 Procter & Gamble Company 36.43
97 Mumbai IN Pune 2.11 University of Pune 23.22 Bengaluru 3.95 Unilever 25.91
98 Indianapolis, IN US New York City, NY 4.21 Columbia University 12.66 Boston-Cambridge, MA 1.17 Constellation Pharmaceuticals 13.32
99 Dublin IE London 2.49 University of London 50.08 San Jose-San Francisco, CA 1.62 Hewlett-Packard 25.04
100 Warsaw PL Kraków 3.37 Jagiellonian University 42.84 Kraków 1.91 ABB Technology 20.10
Rank Cluster name Economy(ies) Top collaborating organizationShare, %Top scientific collaborating cluster
Scientific publishing collaboration
Source: WIPO Statistics Database, March 2019.Notes: Patent filing and scientific publication shares refer to the 2013–17 period and are based on fractional counts, as explained in the text. Collaboration is based on the locations of authors/inventors listed on the same article/patent. Codes refer to the ISO-2 codes. See page 17 for a full list, with the following addition: TW = Taiwan, Province of China. CNRS = Centre National de la Recherche Scientifique, CSIC = Consejo Superior de Investigaciones Cientificas, CSIR = Council of

Special Section: Cluster Rankings 75
TABLE S-1 .4
Top collaborating entities by cluster, continued
51 Montréal, QC CA Toronto, ON 3.94 University of Toronto 80.05 New York City, NY 2.80 Interdigital Patent Holdings 41.02
52 Chengdu CN Beijing 7.46 Chinese Academy of Sciences 32.60 Shenzhen-Hong Kong 1.24 Huawei 73.47
53 Mannheim DE Cologne 5.91 University of Cologne 16.50 Frankfurt Am Main 10.81 BASF 25.02
54 Istanbul TR Ankara 5.06 Hacettepe University 16.01 Ankara 0.41 Arcelik 21.92
55 Copenhagen DK Århus 4.79 Aarhus University 89.74 Lund 1.37 Danmarks Tekniske Universitet 12.22
56 Atlanta, GA US Washington, DC-Baltimore, MD 4.99 Johns Hopkins University 21.76 San Jose-San Francisco, CA 2.85 Stanford University 6.43
57 Rome IT Milan 5.60 University of Milan 20.88 Cologne 2.45 Bayer 96.21
58 Cambridge GB London 10.73 University of London 55.30 London 2.83 British American Tobacco 9.31
59 São Paulo BR Rio De Janeiro 2.99 Universidade Federal do Rio de Janeiro 30.80 Rio De Janeiro 1.31 Petrobras 20.65
60 Tianjin CN Beijing 9.34 Chinese Academy of Sciences 25.00 Beijing 1.28 China Electric Power Research Institute 16.67
61 Cincinnati, OH US Washington, DC-Baltimore, MD 4.07 Johns Hopkins University 22.88 Frankfurt Am Main 2.57 Procter & Gamble Company 82.39
62 Nürnberg DE Munich 9.44 University of Munich 50.66 Munich 3.54 Siemens 58.26
63 Pittsburgh, PA US Washington, DC-Baltimore, MD 4.30 Johns Hopkins University 30.78 Boston-Cambridge, MA 2.51 Berkshire Grey 17.44
64 Dallas, TX US New York City, NY 4.61 Columbia University 15.18 San Jose-San Francisco, CA 3.73 Hewlett-Packard 17.20
65 Bengaluru IN Delhi 2.40 CSIR 10.25 San Jose-San Francisco, CA 5.33 Applied Materials 28.00
66 Ann Arbor, MI US Boston-Cambridge, MA 4.41 Harvard University 63.27 Detroit, MI 4.72 BASF 11.23
67 Changsha CN Beijing 5.61 Chinese Academy of Sciences 25.37 Basel 0.42 Novartis 100.00
68 Helsinki FI Stockholm 3.32 Karolinska Institutet 57.86 Beijing 2.75 Broadcom 32.12
69 Vienna AT Graz 2.37 Medical University of Graz 46.22 Graz 2.00 AVL List 21.15
70 Delhi IN Pune 1.31 CSIR 40.65 Bengaluru 3.84 Mcafee 13.62
71 Oxford GB London 12.14 University of London 54.67 London 2.73 Sony 12.24
72 Vancouver, BC CA Toronto, ON 5.55 University of Toronto 80.16 San Jose-San Francisco, CA 3.37 Genentech 6.45
73 Cleveland, OH US New York City, NY 3.93 Columbia University 12.65 San Jose-San Francisco, CA 1.08 Cisco Technology 23.30
74 Lyon FR Paris 19.11 APHP 26.28 Paris 8.28 IFP Energies Nouvelles 22.25
75 Busan KR Seoul 26.06 Seoul National University 15.30 Seoul 21.29 Samsung Electronics 8.84
76 Phoenix, AZ US Washington, DC-Baltimore, MD 3.79 Johns Hopkins University 24.62 Portland, OR 6.03 Intel 94.14
77 Ankara TR Istanbul 5.04 Istanbul University 11.74 Istanbul 3.16 Santa Farma Ilac 30.02
78 Ottawa, ON CA Toronto, ON 8.78 University of Toronto 76.62 Dallas, TX 2.74 Blackberry 51.43
79 Austin, TX US Houston, TX 3.81 UTMD Anderson Cancer Center 15.98 San Jose-San Francisco, CA 7.32 Applied Materials 9.51
80 Qingdao CN Beijing 12.97 Chinese Academy of Sciences 45.07 Shanghai 0.52 Dow Global Technologies 74.23
81 Suzhou CN Beijing 8.30 Chinese Academy of Sciences 42.80 Beijing 1.74 Jiangsu Huadong Inst. of Li-Ion Battery 74.93
82 Bridgeport-New Haven, CT US New York City, NY 7.29 Columbia University 14.93 New York City, NY 5.71 Bristol-Myers Squibb 25.73
83 Brisbane AU Melbourne 8.32 University of Melbourne 24.30 Melbourne 1.70 University of Queensland 10.59
84 Hamburg DE Cologne 6.12 University of Bonn 15.45 Cologne 2.40 Henkel 35.93
85 Grenoble FR Paris 15.85 CNRS 30.03 Paris 5.99 CEA 39.14
86 Lausanne CH/FR Zürich 5.93 University of Zurich 32.16 Genève 5.00 NESTEC 18.14
87 Harbin CN Beijing 6.73 Chinese Academy of Sciences 17.84 Beijing 3.61 MediaTek 50.84
88 Chongqing CN Beijing 5.73 Chinese Academy of Sciences 24.88 Shenzhen-Hong Kong 1.30 Huawei 83.08
89 Jinan CN Beijing 7.03 Chinese Academy of Sciences 22.11 Beijing 1.13 Nokia 23.13
90 Hefei CN Beijing 8.33 Chinese Academy of Sciences 36.97 Shenzhen-Hong Kong 3.27 Huawei 76.16
91 Basel CH/DE/FR Zürich 7.78 University of Zurich 44.58 Zürich 3.71 Abb Technology Ag 8.13
92 Manchester GB London 8.03 University of London 51.13 Cambridge 2.46 AstraZeneca 28.01
93 Changchun CN Beijing 11.07 Chinese Academy of Sciences 58.97 Beijing 3.75 Peking University 22.07
94 St. Louis, MO US Boston-Cambridge, MA 4.13 Harvard University 67.33 Seattle, WA 2.62 Elwha LLC 75.48
95 Lund SE Stockholm 7.38 Karolinska Institutet 64.40 Stockholm 9.26 LM Ericsson 81.90
96 Columbus, OH US Washington, DC-Baltimore, MD 3.58 Johns Hopkins University 27.09 Cincinnati, OH 2.48 Procter & Gamble Company 36.43
97 Mumbai IN Pune 2.11 University of Pune 23.22 Bengaluru 3.95 Unilever 25.91
98 Indianapolis, IN US New York City, NY 4.21 Columbia University 12.66 Boston-Cambridge, MA 1.17 Constellation Pharmaceuticals 13.32
99 Dublin IE London 2.49 University of London 50.08 San Jose-San Francisco, CA 1.62 Hewlett-Packard 25.04
100 Warsaw PL Kraków 3.37 Jagiellonian University 42.84 Kraków 1.91 ABB Technology 20.10
Top collaborating organization Share, %Top collaborating applicantShare, %Share, % Top patent collaborating cluster
Scientific publishing collaboration Patent collaboration
Scientific & Industrial Research – India, APHP = Assistance Publique Hopitaux Paris (APHP), KAIST = Korea Advanced Institute of Science & Technology, CEA = Commissariat a L’Energie Atomique et aux Energies Alternatives.
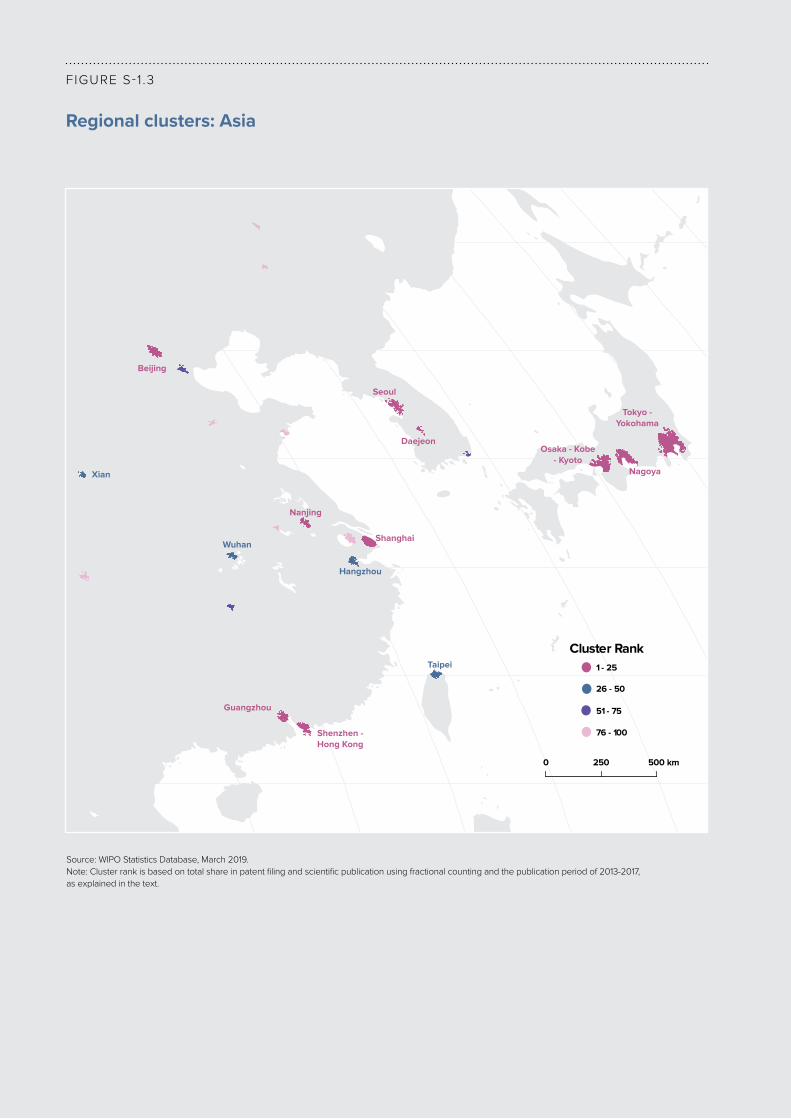
The Global Innovation Index 201976
F IGURE S-1 .3
Regional clusters: Asia
Source: WIPO Statistics Database, March 2019.Note: Cluster rank is based on total share in patent filing and scientific publication using fractional counting and the publication period of 2013-2017, as explained in the text.
Osaka-Kobe
-Kyoto
Shenzhen-
HongKong
Tokyo-
Yokohama
Guangzhou
Hangzhou
Shanghai
Daejeon
Nanjing
Nagoya
Wuhan
Beijing
Taipei
Seoul
Xian
0 250 500km
1-25
ClusterRank
26-50
51-75
76-100

Special Section: Cluster Rankings 77
FIGURE S-1 .4
Regional clusters: Europe
Source: WIPO Statistics Database, March 2019.Note: Cluster rank is based on total share in patent filing and scientific publication using fractional counting and the publication period of 2013-2017, as explained in the text.
FrankfurtAm
Main
Amsterdam-
Rotterdam
Eindhoven
Stockholm
Barcelona
Stuttgart
Brussels Cologne
Moscow
London
Munich
Madrid
Zürich
Berlin
Milan
Paris
0 250 500km
1-25
ClusterRank
26-50
51-75
76-100

The Global Innovation Index 201978
F IGURE S-1 .5
Regional clusters: Northern America
Source: WIPO Statistics Database, March 2019.Note: Cluster rank is based on total share in patent filing and scientific publication using fractional counting and the publication period of 2013-2017, as explained in the text.
San JoseSan Francisco,
CAWashington, DCBaltimore, MD
BostonCambr di ge, MA
New York City,NY
Philadelphia,PA
Los Angeles,CA
Minneapolis,MN
San Diego, CA
Portland, OR
Houston, TX
Toronto, ON
Raleigh, NC
Seattle, WA
Denver, CO Chicago, IL
0 250 500 km
1 - 25
Cluster Rank
26 - 50
51 - 75
76 - 100


![Soumitra Pal [05305015]](https://img.pdfslide.us/doc/110x75/56814740550346895db47e1a/soumitra-pal-05305015.jpg)