Embed Size (px)
Citation preview

The Global Geodetic Observing System:Meeting the Requirements of a Global Society
on a Changing Planet in 2020
The Reference Document (V0.18)
Hans-Peter PlagMichael Pearlman
Editors

REVISION HISTORY
Rev. Description Date
1 Version 0.01: Outline of Contents April 25, 20062 Version 0.02: Revision after discussion during EC Tele-
conMay 3, 2006
3 Version 0.03: Proposed authors added to the chapters May 25, 20064 Version 0.04: Minor changes according to discussion at
GGOS ETC16June 1, 2006
5 Version 0.05: Minor changes according to discussion onJune 7, in Paris
June 11, 2006
6 Version 0.06: Updates on authors June 16, 20067 Version 0.07: Updates on authors June 21, 20068 Version 0.08: Comments from Gerhard Beutler included.
Updates on authorsJuly 3, 2006
9 Version 0.09: Updates on authors August 1, 200610 Version 0.10: Updates on authors August 12, 200611 Version 0.11: Updates on authors; considerable revision
of structure at the Meeting, August 21-22, 2006, in Wash-ington, DC
August 24, 2006
12 Version 0.12: Updates on authors September 1, 200613 Version 0.13: Updates on authors, draft versions of most
chapters includedSeptember 28, 2006
14 Version 0.14: Further edits of all chapters October 5, 200615 Version 0.15: Major revision according to discussions at
two Writing Team meetings; a new Chapter 2 added; fur-ther input added
February 2, 2007
16 Version 0.16: Chapters 2 and 7 completed, other partsrevised
February 17, 2007
17 Version 0.17: Completely revised version May 24, 200718 Version 0.18: Revised based on IAG Hearing results March 20, 2008

The Global Geodetic Observing System GGOS 2020 1
Contents
About this document 8Background . . . . . . . . . . . . . . . . . . . . . . . . . . . . . . . . . . . . . . . . .. . . . . . . . . . . . . . . . 8Scope . . . . . . . . . . . . . . . . . . . . . . . . . . . . . . . . . . . . . . . . . . . . . .. . . . . . . . . . . . . . 8The anticipated audience . . . . . . . . . . . . . . . . . . . . . . . . . . . . .. . . . . . . . . . . . . . . . . . . . . 9Documents consulted . . . . . . . . . . . . . . . . . . . . . . . . . . . . . . . . .. . . . . . . . . . . . . . . . . . . 9
Executive Summary 10
1 Introduction 171.1 The challenge: living on a changing, dynamic planet . . . .. . . . . . . . . . . . . . . . . . . . . . . . . . . . 171.2 The potential: geodesy’s contribution to a global society . . . . . . . . . . . . . . . . . . . . . . . . . . . . . . 171.3 The observing system: the current development of the Global Geodetic Observing System . . . . . . . . . . . . 201.4 The strategy: where to go from now . . . . . . . . . . . . . . . . . . . .. . . . . . . . . . . . . . . . . . . . . 23
2 The goals, achievements, and tools of modern geodesy 242.1 Introduction . . . . . . . . . . . . . . . . . . . . . . . . . . . . . . . . . . . .. . . . . . . . . . . . . . . . . . 242.2 Geodetic reference systems and frames . . . . . . . . . . . . . . .. . . . . . . . . . . . . . . . . . . . . . . . . 252.3 The tools and products of modern geodesy . . . . . . . . . . . . . .. . . . . . . . . . . . . . . . . . . . . . . . 282.4 Observing Earth geometry and kinematic . . . . . . . . . . . . . .. . . . . . . . . . . . . . . . . . . . . . . . 30
2.4.1 Overview . . . . . . . . . . . . . . . . . . . . . . . . . . . . . . . . . . . . . .. . . . . . . . . . . . . 302.4.2 Space-geodetic tracking techniques . . . . . . . . . . . . . .. . . . . . . . . . . . . . . . . . . . . . . 302.4.3 Altimetry . . . . . . . . . . . . . . . . . . . . . . . . . . . . . . . . . . . . .. . . . . . . . . . . . . . 362.4.4 GNSS scatterometry and reflectometry . . . . . . . . . . . . . .. . . . . . . . . . . . . . . . . . . . . 372.4.5 Geodetic imaging techniques . . . . . . . . . . . . . . . . . . . . .. . . . . . . . . . . . . . . . . . . . 41
2.5 Observing Earth’s rotation . . . . . . . . . . . . . . . . . . . . . . . .. . . . . . . . . . . . . . . . . . . . . . 442.5.1 Space-geodetic techniques . . . . . . . . . . . . . . . . . . . . . .. . . . . . . . . . . . . . . . . . . . 442.5.2 Ring laser gyroscopes . . . . . . . . . . . . . . . . . . . . . . . . . . .. . . . . . . . . . . . . . . . . 45
2.6 Observing Earth’s gravity field . . . . . . . . . . . . . . . . . . . .. . . . . . . . . . . . . . . . . . . . . . . . 452.6.1 Superconducting gravimetry . . . . . . . . . . . . . . . . . . . . .. . . . . . . . . . . . . . . . . . . . 462.6.2 Absolute gravimetry . . . . . . . . . . . . . . . . . . . . . . . . . . . .. . . . . . . . . . . . . . . . . 472.6.3 Land movements and terrestrial gravimetry . . . . . . . . .. . . . . . . . . . . . . . . . . . . . . . . . 472.6.4 Airborne gravimetry . . . . . . . . . . . . . . . . . . . . . . . . . . . .. . . . . . . . . . . . . . . . . 482.6.5 Satellite missions . . . . . . . . . . . . . . . . . . . . . . . . . . . . .. . . . . . . . . . . . . . . . . . 48
2.7 Observing time . . . . . . . . . . . . . . . . . . . . . . . . . . . . . . . . . . .. . . . . . . . . . . . . . . . . 492.7.1 Relativity: proper and coordinate time; realized time scales . . . . . . . . . . . . . . . . . . . . . . . . . 492.7.2 Geodetic measurements and geodetic coordinates . . . .. . . . . . . . . . . . . . . . . . . . . . . . . . 502.7.3 Clocks and geodesy: future trends . . . . . . . . . . . . . . . . .. . . . . . . . . . . . . . . . . . . . . 50
2.8 Ensuring consistency of the observations of geometry, gravity field, and rotation . . . . . . . . . . . . . . . . . . 512.8.1 Consistency through collocation . . . . . . . . . . . . . . . . .. . . . . . . . . . . . . . . . . . . . . . 512.8.2 Consistency of data collection and processing: conventions . . . . . . . . . . . . . . . . . . . . . . . . . 52
2.9 Essential additional observations and applications . .. . . . . . . . . . . . . . . . . . . . . . . . . . . . . . . . 542.9.1 Atmospheric sounding . . . . . . . . . . . . . . . . . . . . . . . . . . .. . . . . . . . . . . . . . . . . 542.9.2 Ionospheric remote sensing: one person’s signal is another person’s noise . . . . . . . . . . . . . . . . . 552.9.3 Tide gauges . . . . . . . . . . . . . . . . . . . . . . . . . . . . . . . . . . . .. . . . . . . . . . . . . . 572.9.4 Geodetic time and frequency transfer . . . . . . . . . . . . . .. . . . . . . . . . . . . . . . . . . . . . 61
3 Understanding a dynamic planet: Earth science requirements for geodesy 633.1 Introduction . . . . . . . . . . . . . . . . . . . . . . . . . . . . . . . . . . . .. . . . . . . . . . . . . . . . . . 633.2 The scientific and technological challenges for GGOS . .. . . . . . . . . . . . . . . . . . . . . . . . . . . . . . 633.3 Solid Earth physics . . . . . . . . . . . . . . . . . . . . . . . . . . . . . . .. . . . . . . . . . . . . . . . . . . 65
3.3.1 Plate motion . . . . . . . . . . . . . . . . . . . . . . . . . . . . . . . . . . .. . . . . . . . . . . . . . 673.3.2 Earthquake and volcano physics . . . . . . . . . . . . . . . . . . .. . . . . . . . . . . . . . . . . . . . 683.3.3 Deep Earth dynamics . . . . . . . . . . . . . . . . . . . . . . . . . . . . .. . . . . . . . . . . . . . . . 693.3.4 Exogenic forces . . . . . . . . . . . . . . . . . . . . . . . . . . . . . . . .. . . . . . . . . . . . . . . . 70

The Global Geodetic Observing System GGOS 2020 2
3.4 The cryosphere . . . . . . . . . . . . . . . . . . . . . . . . . . . . . . . . . . .. . . . . . . . . . . . . . . . . 703.5 Ocean processes and their climatological implications. . . . . . . . . . . . . . . . . . . . . . . . . . . . . . . . 71
3.5.1 Providing the reference frame and the means for precise positioning . . . . . . . . . . . . . . . . . . . . 713.5.2 Altimetry and ocean circulation . . . . . . . . . . . . . . . . . .. . . . . . . . . . . . . . . . . . . . . 723.5.3 Satellite gravity, ocean circulation and climate . . .. . . . . . . . . . . . . . . . . . . . . . . . . . . . 723.5.4 Synergistic combination of measurements . . . . . . . . . .. . . . . . . . . . . . . . . . . . . . . . . . 733.5.5 Future needs . . . . . . . . . . . . . . . . . . . . . . . . . . . . . . . . . . .. . . . . . . . . . . . . . 73
3.6 Studies of weather and climate processes . . . . . . . . . . . . .. . . . . . . . . . . . . . . . . . . . . . . . . . 733.6.1 Geo-referencing of all meteorological observations. . . . . . . . . . . . . . . . . . . . . . . . . . . . . 733.6.2 Providing atmospheric weather models with space- andtime-varying gravity fields . . . . . . . . . . . . 743.6.3 Collecting observations of the upper-atmospheric mass and lower tropospheric water vapor fields . . . . 743.6.4 Tracking global change in the atmosphere . . . . . . . . . . .. . . . . . . . . . . . . . . . . . . . . . . 74
3.7 Sea level change . . . . . . . . . . . . . . . . . . . . . . . . . . . . . . . . . .. . . . . . . . . . . . . . . . . . 753.7.1 Geo-location of sea and land levels and their changes .. . . . . . . . . . . . . . . . . . . . . . . . . . . 753.7.2 Understanding sea level change . . . . . . . . . . . . . . . . . . .. . . . . . . . . . . . . . . . . . . . 76
3.8 The hydrological cycle . . . . . . . . . . . . . . . . . . . . . . . . . . . .. . . . . . . . . . . . . . . . . . . . 763.9 Mass transport and mass anomalies in the Earth system . . .. . . . . . . . . . . . . . . . . . . . . . . . . . . . 77
3.9.1 Mass redistributions and geodesy . . . . . . . . . . . . . . . . .. . . . . . . . . . . . . . . . . . . . . 773.10 Earth rotation: understanding Earth system dynamics .. . . . . . . . . . . . . . . . . . . . . . . . . . . . . . . 80
3.10.1 Earth rotation measurements . . . . . . . . . . . . . . . . . . . .. . . . . . . . . . . . . . . . . . . . . 803.10.2 UT1 and Length-of-Day Variations . . . . . . . . . . . . . . . .. . . . . . . . . . . . . . . . . . . . . 813.10.3 Polar Motion . . . . . . . . . . . . . . . . . . . . . . . . . . . . . . . . . .. . . . . . . . . . . . . . . 83
3.11 Earth rotation: understanding processes in the solid Earth . . . . . . . . . . . . . . . . . . . . . . . . . . . . . . 843.11.1 Earth’s interior from Earth rotation . . . . . . . . . . . . .. . . . . . . . . . . . . . . . . . . . . . . . . 843.11.2 Geophysical fluids from Earth rotation . . . . . . . . . . . .. . . . . . . . . . . . . . . . . . . . . . . . 853.11.3 General remarks . . . . . . . . . . . . . . . . . . . . . . . . . . . . . . .. . . . . . . . . . . . . . . . 85
4 Maintaining a modern society 874.1 Spatial data infrastructure . . . . . . . . . . . . . . . . . . . . . . .. . . . . . . . . . . . . . . . . . . . . . . . 874.2 Navigation . . . . . . . . . . . . . . . . . . . . . . . . . . . . . . . . . . . . . .. . . . . . . . . . . . . . . . . 88
4.2.1 Marine navigation . . . . . . . . . . . . . . . . . . . . . . . . . . . . . .. . . . . . . . . . . . . . . . 894.2.2 Air navigation . . . . . . . . . . . . . . . . . . . . . . . . . . . . . . . . .. . . . . . . . . . . . . . . 904.2.3 Land navigation . . . . . . . . . . . . . . . . . . . . . . . . . . . . . . . .. . . . . . . . . . . . . . . 90
4.3 Engineering, surveying and mapping . . . . . . . . . . . . . . . . .. . . . . . . . . . . . . . . . . . . . . . . . 904.3.1 Machine guidance . . . . . . . . . . . . . . . . . . . . . . . . . . . . . . .. . . . . . . . . . . . . . . 914.3.2 Land titling and development . . . . . . . . . . . . . . . . . . . . .. . . . . . . . . . . . . . . . . . . 914.3.3 Engineering geodesy and structural monitoring . . . . .. . . . . . . . . . . . . . . . . . . . . . . . . . 914.3.4 Geographic information systems . . . . . . . . . . . . . . . . . .. . . . . . . . . . . . . . . . . . . . . 914.3.5 Height systems . . . . . . . . . . . . . . . . . . . . . . . . . . . . . . . . .. . . . . . . . . . . . . . . 92
4.4 Timing applications . . . . . . . . . . . . . . . . . . . . . . . . . . . . . .. . . . . . . . . . . . . . . . . . . . 924.5 Early warning and emergency management . . . . . . . . . . . . . .. . . . . . . . . . . . . . . . . . . . . . . 924.6 Infomobility . . . . . . . . . . . . . . . . . . . . . . . . . . . . . . . . . . . .. . . . . . . . . . . . . . . . . . 934.7 Management of and access to natural resources . . . . . . . . .. . . . . . . . . . . . . . . . . . . . . . . . . . 94
4.7.1 Water management and hydrology . . . . . . . . . . . . . . . . . . .. . . . . . . . . . . . . . . . . . 944.7.2 Energy resources . . . . . . . . . . . . . . . . . . . . . . . . . . . . . . .. . . . . . . . . . . . . . . . 94
4.8 Monitoring the environment and improving predictability . . . . . . . . . . . . . . . . . . . . . . . . . . . . . . 954.8.1 GPS meteorology . . . . . . . . . . . . . . . . . . . . . . . . . . . . . . . .. . . . . . . . . . . . . . . 954.8.2 Space weather . . . . . . . . . . . . . . . . . . . . . . . . . . . . . . . . . .. . . . . . . . . . . . . . 95
5 Earth observation: Serving the needs of an increasingly global society 965.1 The current and future framework of global Earth observations . . . . . . . . . . . . . . . . . . . . . . . . . . . 965.2 Disasters: Reducing loss of life and property from natural and human-made disasters . . . . . . . . . . . . . . . 97
5.2.1 Landslides, rock falls and subsidence . . . . . . . . . . . . .. . . . . . . . . . . . . . . . . . . . . . . 985.2.2 Volcano eruptions . . . . . . . . . . . . . . . . . . . . . . . . . . . . . .. . . . . . . . . . . . . . . . . 995.2.3 Earthquakes . . . . . . . . . . . . . . . . . . . . . . . . . . . . . . . . . . .. . . . . . . . . . . . . . . 99
The Global Geodetic Observing System GGOS 2020 3
5.2.4 Tsunamis . . . . . . . . . . . . . . . . . . . . . . . . . . . . . . . . . . . . . .. . . . . . . . . . . . . 995.2.5 Storm surges . . . . . . . . . . . . . . . . . . . . . . . . . . . . . . . . . . .. . . . . . . . . . . . . . 1025.2.6 Flooding . . . . . . . . . . . . . . . . . . . . . . . . . . . . . . . . . . . . . .. . . . . . . . . . . . . 1035.2.7 The slowly developing disasters: sea level rise . . . . .. . . . . . . . . . . . . . . . . . . . . . . . . . 103
5.3 Health: Understanding environmental factors affecting human health and well being . . . . . . . . . . . . . . . . 1045.4 Energy Resources: Improving management of energy resources . . . . . . . . . . . . . . . . . . . . . . . . . . . 1055.5 Climate change: Understanding, assessing, predicting, mitigating, and adopting to climate variability and change 1065.6 Water: Improving water resource management through better understanding of the water cycle . . . . . . . . . . 107
5.6.1 The global hydrological cycle . . . . . . . . . . . . . . . . . . . .. . . . . . . . . . . . . . . . . . . . 1075.6.2 Water for life: the challenge of water management . . . .. . . . . . . . . . . . . . . . . . . . . . . . . 1085.6.3 Observations of the Global Water Cycle . . . . . . . . . . . . .. . . . . . . . . . . . . . . . . . . . . . 1095.6.4 Slow branch challenges . . . . . . . . . . . . . . . . . . . . . . . . . .. . . . . . . . . . . . . . . . . . 1105.6.5 Fast branch challenges . . . . . . . . . . . . . . . . . . . . . . . . . .. . . . . . . . . . . . . . . . . . 114
5.7 Weather: Improving weather information, forecasting,and warning . . . . . . . . . . . . . . . . . . . . . . . . . 1165.8 Ecosystems: Improving the management and protection ofterrestrial, coastal, and marine ecosystems . . . . . . 117
5.8.1 Measurements of CO2 spatial and temporal distribution to better understand theEarth’s carbon cycle . . 1175.8.2 Monitoring wetlands . . . . . . . . . . . . . . . . . . . . . . . . . . . .. . . . . . . . . . . . . . . . . 118
5.9 Agriculture: Supporting sustainable agriculture and combating desertification . . . . . . . . . . . . . . . . . . . 1185.9.1 Monitoring deforestation and logging . . . . . . . . . . . . .. . . . . . . . . . . . . . . . . . . . . . . 1185.9.2 Agricultural land cover and land use . . . . . . . . . . . . . . .. . . . . . . . . . . . . . . . . . . . . . 1195.9.3 Precision farming . . . . . . . . . . . . . . . . . . . . . . . . . . . . . .. . . . . . . . . . . . . . . . . 119
5.10 Biodiversity: Understanding, monitoring and conserving biodiversity . . . . . . . . . . . . . . . . . . . . . . . . 119
6 Geodesy: foundation for exploring the planets, the solar system and beyond 1206.1 Planetary geodesy . . . . . . . . . . . . . . . . . . . . . . . . . . . . . . . .. . . . . . . . . . . . . . . . . . . 120
6.1.1 Planetary rotation and interior properties . . . . . . . .. . . . . . . . . . . . . . . . . . . . . . . . . . 1206.1.2 Example: Mars . . . . . . . . . . . . . . . . . . . . . . . . . . . . . . . . . .. . . . . . . . . . . . . . 1206.1.3 Example: Earth’s Moon . . . . . . . . . . . . . . . . . . . . . . . . . . .. . . . . . . . . . . . . . . . 1216.1.4 Example: Europa . . . . . . . . . . . . . . . . . . . . . . . . . . . . . . . .. . . . . . . . . . . . . . . 1226.1.5 Planetary mapping . . . . . . . . . . . . . . . . . . . . . . . . . . . . . .. . . . . . . . . . . . . . . . 122
6.2 Radio science and interferometry . . . . . . . . . . . . . . . . . . .. . . . . . . . . . . . . . . . . . . . . . . . 1226.3 Inter-planetary navigation . . . . . . . . . . . . . . . . . . . . . . .. . . . . . . . . . . . . . . . . . . . . . . . 123
6.3.1 Current and future tracking datatypes . . . . . . . . . . . . .. . . . . . . . . . . . . . . . . . . . . . . 1236.3.2 Interplanetary trajectory determination . . . . . . . . .. . . . . . . . . . . . . . . . . . . . . . . . . . . 1246.3.3 Current and future requirements of GGOS for interplanetary navigation . . . . . . . . . . . . . . . . . . 125
7 Integrated scientific and societal user requirements andfunctional specifications for the GGOS 1267.1 Introduction . . . . . . . . . . . . . . . . . . . . . . . . . . . . . . . . . . . .. . . . . . . . . . . . . . . . . . 1267.2 Summary of user requirements . . . . . . . . . . . . . . . . . . . . . . .. . . . . . . . . . . . . . . . . . . . . 126
7.2.1 Societal applications . . . . . . . . . . . . . . . . . . . . . . . . . .. . . . . . . . . . . . . . . . . . . 1267.2.2 Earth observations . . . . . . . . . . . . . . . . . . . . . . . . . . . . .. . . . . . . . . . . . . . . . . 1267.2.3 Natural hazards . . . . . . . . . . . . . . . . . . . . . . . . . . . . . . . .. . . . . . . . . . . . . . . . 1267.2.4 Earth science . . . . . . . . . . . . . . . . . . . . . . . . . . . . . . . . . .. . . . . . . . . . . . . . . 1277.2.5 Lunar and planetary science . . . . . . . . . . . . . . . . . . . . . .. . . . . . . . . . . . . . . . . . . 127
7.3 Quantitative requirements . . . . . . . . . . . . . . . . . . . . . . . .. . . . . . . . . . . . . . . . . . . . . . . 1287.4 Tasks of GGOS . . . . . . . . . . . . . . . . . . . . . . . . . . . . . . . . . . . . .. . . . . . . . . . . . . . . 1297.5 Products available through GGOS . . . . . . . . . . . . . . . . . . . .. . . . . . . . . . . . . . . . . . . . . . 1317.6 Accuracy of GGOS products . . . . . . . . . . . . . . . . . . . . . . . . . .. . . . . . . . . . . . . . . . . . . 1327.7 Functional specification for GGOS . . . . . . . . . . . . . . . . . .. . . . . . . . . . . . . . . . . . . . . . . . 133
7.7.1 Determination, maintenance, and access to the globalterrestrial reference frame . . . . . . . . . . . . . . 1337.7.2 Earth rotation . . . . . . . . . . . . . . . . . . . . . . . . . . . . . . . . .. . . . . . . . . . . . . . . . 1337.7.3 Earth’s gravity field . . . . . . . . . . . . . . . . . . . . . . . . . . . .. . . . . . . . . . . . . . . . . . 1337.7.4 Earth system monitoring: Mass transport and mass redistribution . . . . . . . . . . . . . . . . . . . . . . 1347.7.5 Determination, maintenance, and access to the celestial reference frame . . . . . . . . . . . . . . . . . . 134
7.8 Operational specifications for GGOS . . . . . . . . . . . . . . . .. . . . . . . . . . . . . . . . . . . . . . . . . 134
The Global Geodetic Observing System GGOS 2020 4
8 The future geodetic reference frame 1358.1 Introduction . . . . . . . . . . . . . . . . . . . . . . . . . . . . . . . . . . . .. . . . . . . . . . . . . . . . . . 1358.2 Concept of reference system and reference frame . . . . . . .. . . . . . . . . . . . . . . . . . . . . . . . . . . 1358.3 Future reference frame formulations . . . . . . . . . . . . . . . .. . . . . . . . . . . . . . . . . . . . . . . . . 1378.4 Origin and orientation of the TRS . . . . . . . . . . . . . . . . . . . .. . . . . . . . . . . . . . . . . . . . . . 1378.5 Scientific challenge of the future reference frame: theneed for an Earth system model . . . . . . . . . . . . . . . 1388.6 Towards an Earth system model . . . . . . . . . . . . . . . . . . . . . . .. . . . . . . . . . . . . . . . . . . . 138
9 The future Global Geodetic Observing System (GGOS) 1429.1 The overall system design . . . . . . . . . . . . . . . . . . . . . . . . . .. . . . . . . . . . . . . . . . . . . . . 1429.2 The overall observing system design: the five levels . . .. . . . . . . . . . . . . . . . . . . . . . . . . . . . . . 1429.3 Level 1: Ground-based infrastructure . . . . . . . . . . . . . . .. . . . . . . . . . . . . . . . . . . . . . . . . . 143
9.3.1 Core network of co-located stations . . . . . . . . . . . . . . .. . . . . . . . . . . . . . . . . . . . . . 1449.3.2 VLBI station network . . . . . . . . . . . . . . . . . . . . . . . . . . . .. . . . . . . . . . . . . . . . 1459.3.3 SLR/LLR station network . . . . . . . . . . . . . . . . . . . . . . . . .. . . . . . . . . . . . . . . . . 1459.3.4 GNSS station network . . . . . . . . . . . . . . . . . . . . . . . . . . . .. . . . . . . . . . . . . . . . 1469.3.5 DORIS station network . . . . . . . . . . . . . . . . . . . . . . . . . . .. . . . . . . . . . . . . . . . . 1479.3.6 Networks of gravimeters . . . . . . . . . . . . . . . . . . . . . . . . .. . . . . . . . . . . . . . . . . . 1479.3.7 Network of tide gauge stations and ocean bottom geodesy . . . . . . . . . . . . . . . . . . . . . . . . . 1479.3.8 Co-location of instruments and auxiliary sensors . . .. . . . . . . . . . . . . . . . . . . . . . . . . . . 148
9.4 Level 2: satellite missions: Low Earth Orbiters and their applications . . . . . . . . . . . . . . . . . . . . . . . . 1489.4.1 Gravity satellite missions . . . . . . . . . . . . . . . . . . . . . .. . . . . . . . . . . . . . . . . . . . 1499.4.2 Ocean and ice altimetry satellite missions . . . . . . . . .. . . . . . . . . . . . . . . . . . . . . . . . . 1509.4.3 InSAR and optical satellite missions . . . . . . . . . . . . . .. . . . . . . . . . . . . . . . . . . . . . . 1509.4.4 Future satellite mission concepts . . . . . . . . . . . . . . . .. . . . . . . . . . . . . . . . . . . . . . . 1509.4.5 Co-location onboard satellites . . . . . . . . . . . . . . . . . .. . . . . . . . . . . . . . . . . . . . . . 1519.4.6 Airborne and shipborne sensors . . . . . . . . . . . . . . . . . . .. . . . . . . . . . . . . . . . . . . . 151
9.5 Level 3: GNSS and laser ranging satellites . . . . . . . . . . . .. . . . . . . . . . . . . . . . . . . . . . . . . . 1519.5.1 Global Navigation Satellite Systems . . . . . . . . . . . . . .. . . . . . . . . . . . . . . . . . . . . . . 1519.5.2 Laser ranging satellites . . . . . . . . . . . . . . . . . . . . . . . .. . . . . . . . . . . . . . . . . . . . 152
9.6 Level 4: planetary missions . . . . . . . . . . . . . . . . . . . . . . . .. . . . . . . . . . . . . . . . . . . . . . 1529.7 Level 5: extragalactic objects . . . . . . . . . . . . . . . . . . . . .. . . . . . . . . . . . . . . . . . . . . . . . 1529.8 GGOS data flow: from measurements to users . . . . . . . . . . . . .. . . . . . . . . . . . . . . . . . . . . . . 153
9.8.1 Data centers and data flow . . . . . . . . . . . . . . . . . . . . . . . . .. . . . . . . . . . . . . . . . . 1539.8.2 Synergies between observing techniques . . . . . . . . . . .. . . . . . . . . . . . . . . . . . . . . . . . 1549.8.3 Operating centers and communications . . . . . . . . . . . . .. . . . . . . . . . . . . . . . . . . . . . 1549.8.4 Future technologies and capabilities for data infrastructure . . . . . . . . . . . . . . . . . . . . . . . . . 154
9.9 GGOS User Interface: Database, Portal, and Clearinghouse . . . . . . . . . . . . . . . . . . . . . . . . . . . . . 1549.9.1 GGOS Portal Architecture . . . . . . . . . . . . . . . . . . . . . . . .. . . . . . . . . . . . . . . . . . 1559.9.2 GGOS Portal Goals and Objectives . . . . . . . . . . . . . . . . . .. . . . . . . . . . . . . . . . . . . 1569.9.3 A GGOS clearinghouse mechanism for geodesy . . . . . . . . .. . . . . . . . . . . . . . . . . . . . . . 156
9.10 Data analysis, combination, modeling, and products . .. . . . . . . . . . . . . . . . . . . . . . . . . . . . . . . 157
10 Towards GGOS in 2020 16010.1 The GGOS high-level components . . . . . . . . . . . . . . . . . . . .. . . . . . . . . . . . . . . . . . . . . . 16010.2 Building on the heritage . . . . . . . . . . . . . . . . . . . . . . . . . .. . . . . . . . . . . . . . . . . . . . . . 160
10.2.1 Level 1: the terrestrial geodetic infrastructure . .. . . . . . . . . . . . . . . . . . . . . . . . . . . . . . 16010.2.2 Level 2: the LEO satellite missions . . . . . . . . . . . . . . .. . . . . . . . . . . . . . . . . . . . . . 16210.2.3 Level 3: The GNSS and SLR satellites . . . . . . . . . . . . . . .. . . . . . . . . . . . . . . . . . . . . 16210.2.4 Level 4: lunar and planetary “geodesy” and missions .. . . . . . . . . . . . . . . . . . . . . . . . . . . 16210.2.5 Level 5: the extragalactic objects . . . . . . . . . . . . . . .. . . . . . . . . . . . . . . . . . . . . . . . 162
10.3 Organizational considerations . . . . . . . . . . . . . . . . . . .. . . . . . . . . . . . . . . . . . . . . . . . . . 16310.3.1 History . . . . . . . . . . . . . . . . . . . . . . . . . . . . . . . . . . . . . .. . . . . . . . . . . . . . 16310.3.2 The revolution invoked by space geodesy . . . . . . . . . . .. . . . . . . . . . . . . . . . . . . . . . . 16310.3.3 Current situation . . . . . . . . . . . . . . . . . . . . . . . . . . . . .. . . . . . . . . . . . . . . . . . 163

The Global Geodetic Observing System GGOS 2020 5
10.3.4 Internal organization of GGOS . . . . . . . . . . . . . . . . . . .. . . . . . . . . . . . . . . . . . . . . 16310.3.5 Integration of relevant regional activities . . . . . .. . . . . . . . . . . . . . . . . . . . . . . . . . . . . 16410.3.6 Integration of GGOS into global programs . . . . . . . . . .. . . . . . . . . . . . . . . . . . . . . . . 164
11 Recommendations 165
Acknowledgments 170
References 170
APPENDICES 184
A List of Authors, and Reviewers 184A.1 Authors . . . . . . . . . . . . . . . . . . . . . . . . . . . . . . . . . . . . . . . . .. . . . . . . . . . . . . . . 184A.2 Reviewers . . . . . . . . . . . . . . . . . . . . . . . . . . . . . . . . . . . . . . .. . . . . . . . . . . . . . . . 184
B Definitions 185
C Acronyms and abbreviations 186
List of Figures
1 Constituents of an integrated geodetic monitoring system. . . . . . . . . . . . . . . . . . . . . . . . . . . . . . . 182 Organizational links and relationships of GGOS. . . . . . . . .. . . . . . . . . . . . . . . . . . . . . . . . . . 213 The dynamic Earth. . . . . . . . . . . . . . . . . . . . . . . . . . . . . . . . . . .. . . . . . . . . . . . . . . . 224 Overview of current conventional reference systems and their realizations. . . . . . . . . . . . . . . . . . . . . . 265 Effect of secular translation between ITRF2000 and ITRF2005 on vertical rates . . . . . . . . . . . . . . . . . . 286 The three pillars of geodesy and their techniques. . . . . . . .. . . . . . . . . . . . . . . . . . . . . . . . . . . 287 32-meter VLBI antenna in Tsukuba, Japan . . . . . . . . . . . . . . . .. . . . . . . . . . . . . . . . . . . . . . 308 Principle of very long baseline interferometry. . . . . . . . .. . . . . . . . . . . . . . . . . . . . . . . . . . . . 309 Station network of the IVS. . . . . . . . . . . . . . . . . . . . . . . . . . . .. . . . . . . . . . . . . . . . . . . 3110 Principle of satellite laser ranging . . . . . . . . . . . . . . . . .. . . . . . . . . . . . . . . . . . . . . . . . . 3111 LAGEOS I satellite . . . . . . . . . . . . . . . . . . . . . . . . . . . . . . . . .. . . . . . . . . . . . . . . . . 3212 Laser reflector on the Moon . . . . . . . . . . . . . . . . . . . . . . . . . . .. . . . . . . . . . . . . . . . . . . 3213 Tracking network of the ILRS . . . . . . . . . . . . . . . . . . . . . . . . .. . . . . . . . . . . . . . . . . . . 3214 ICESat Satellite. . . . . . . . . . . . . . . . . . . . . . . . . . . . . . . . . .. . . . . . . . . . . . . . . . . . . 3215 GPS satellite. . . . . . . . . . . . . . . . . . . . . . . . . . . . . . . . . . . . .. . . . . . . . . . . . . . . . . 3216 GLONASS satellite . . . . . . . . . . . . . . . . . . . . . . . . . . . . . . . . .. . . . . . . . . . . . . . . . . 3317 First experimental Galileo satellite GIOVE-A . . . . . . . . .. . . . . . . . . . . . . . . . . . . . . . . . . . . 3318 Complete Galileo constellation of thirty satellites . . .. . . . . . . . . . . . . . . . . . . . . . . . . . . . . . . 3319 Tracking network of the IGS. . . . . . . . . . . . . . . . . . . . . . . . . .. . . . . . . . . . . . . . . . . . . . 3420 Tracking network of the IDS. . . . . . . . . . . . . . . . . . . . . . . . . .. . . . . . . . . . . . . . . . . . . . 3521 Illustration of two DORIS stations . . . . . . . . . . . . . . . . . . .. . . . . . . . . . . . . . . . . . . . . . . 3522 DORIS data availability at the IDS Data Centers . . . . . . . . .. . . . . . . . . . . . . . . . . . . . . . . . . . 3623 Weighted RMS of individual weekly DORIS time-series combinations . . . . . . . . . . . . . . . . . . . . . . . 3624 Principle of satellite altimetry. . . . . . . . . . . . . . . . . . . .. . . . . . . . . . . . . . . . . . . . . . . . . 3725 The Jason-1 satellite altimetry mission. . . . . . . . . . . . . .. . . . . . . . . . . . . . . . . . . . . . . . . . . 3726 Jason-1 and DORIS . . . . . . . . . . . . . . . . . . . . . . . . . . . . . . . . . .. . . . . . . . . . . . . . . . 3827 Use of reflected GNSS signals for altimetric measurements. . . . . . . . . . . . . . . . . . . . . . . . . . . . . 3928 Reflection point loci for one receiver at 400 km altitude . .. . . . . . . . . . . . . . . . . . . . . . . . . . . . . 3929 Principle of InSAR. . . . . . . . . . . . . . . . . . . . . . . . . . . . . . . . .. . . . . . . . . . . . . . . . . . 4230 Interferograms from ERS showing deformation . . . . . . . . . .. . . . . . . . . . . . . . . . . . . . . . . . . 4331 Ring laser gyroscope for Earth rotation monitoring. . . . .. . . . . . . . . . . . . . . . . . . . . . . . . . . . . 4532 Long period normal modes from the Mw = 9.1 Sumatra-Andamenearthquake. . . . . . . . . . . . . . . . . . . . 4633 Atmospheric mass transport during heavy rain. . . . . . . . . .. . . . . . . . . . . . . . . . . . . . . . . . . . 4634 Global network of SG stations contributing to GGP. . . . . . .. . . . . . . . . . . . . . . . . . . . . . . . . . . 46

The Global Geodetic Observing System GGOS 2020 6
35 Variations in absolute gravity at Ucluelet . . . . . . . . . . . .. . . . . . . . . . . . . . . . . . . . . . . . . . . 4736 Principle of airborne gravimetry. . . . . . . . . . . . . . . . . . . .. . . . . . . . . . . . . . . . . . . . . . . . 4837 The GRACE satellites. . . . . . . . . . . . . . . . . . . . . . . . . . . . . . .. . . . . . . . . . . . . . . . . . 4938 Improvement of the Earth’s gravity field models. . . . . . . . .. . . . . . . . . . . . . . . . . . . . . . . . . . 5039 GRACE-determined variations in water storage on land . . .. . . . . . . . . . . . . . . . . . . . . . . . . . . . 5140 Core geodetic stations . . . . . . . . . . . . . . . . . . . . . . . . . . . . .. . . . . . . . . . . . . . . . . . . . 5341 Atmospheric sensing with ground-based GPS receivers. . .. . . . . . . . . . . . . . . . . . . . . . . . . . . . . 5442 Geometry of GPS occultation. . . . . . . . . . . . . . . . . . . . . . . . .. . . . . . . . . . . . . . . . . . . . 5543 Global coverage of GPS radio occultations . . . . . . . . . . . . .. . . . . . . . . . . . . . . . . . . . . . . . . 5544 Atmospheric temperature retrievals from GPS radio occultations . . . . . . . . . . . . . . . . . . . . . . . . . . 5645 Global coverage of 1000 GPS tracking stations for December 26, 2004 . . . . . . . . . . . . . . . . . . . . . . . 5646 Schematic view of COSMIC ionospheric occultations and the expected 3000 daily profiles . . . . . . . . . . . . 5747 Principle of tide gauge measurements. . . . . . . . . . . . . . . . .. . . . . . . . . . . . . . . . . . . . . . . . 5848 The global network of tide gauge stations . . . . . . . . . . . . . .. . . . . . . . . . . . . . . . . . . . . . . . 5949 NOAA’s DART stations . . . . . . . . . . . . . . . . . . . . . . . . . . . . . . .. . . . . . . . . . . . . . . . . 6050 Measuring and modeling the Earth system. . . . . . . . . . . . . . .. . . . . . . . . . . . . . . . . . . . . . . . 6551 Model of tectonic plates. . . . . . . . . . . . . . . . . . . . . . . . . . . .. . . . . . . . . . . . . . . . . . . . 6752 The interrelation of gravity, gravity variations, mass transport and distribution. . . . . . . . . . . . . . . . . . . . 7853 Interconnections between processes and research themesrelated to mass transport and mass distribution. . . . . . 7954 Resolvability of Mass transport by satellite missions. .. . . . . . . . . . . . . . . . . . . . . . . . . . . . . . . 8055 Geophysical parameters obtained from nutation. . . . . . . .. . . . . . . . . . . . . . . . . . . . . . . . . . . . 8456 Determination of atmospheric global properties from nutation and from the parameters determined from nutation. 8557 Comparison of the dynamical flattening obtained from precession and nutation to the contributions determined
from the geophysical fluids. . . . . . . . . . . . . . . . . . . . . . . . . . . .. . . . . . . . . . . . . . . . . . . 8558 Geophysical fluid effects on polar motion and on length-of-day variations. . . . . . . . . . . . . . . . . . . . . . 8559 A Model of the Australian Spatial Data Infrastructure. . .. . . . . . . . . . . . . . . . . . . . . . . . . . . . . . 8960 Location of the largest earthquakes since 1900 . . . . . . . . .. . . . . . . . . . . . . . . . . . . . . . . . . . . 10061 Seismic moment determination based on GNSS . . . . . . . . . . . .. . . . . . . . . . . . . . . . . . . . . . . 10162 Effect of a regional sealevel rise of 4 m on coast line . . . . .. . . . . . . . . . . . . . . . . . . . . . . . . . . 10363 Processes and factors affecting long-period local sea level. . . . . . . . . . . . . . . . . . . . . . . . . . . . . . 10464 The large-scale features of the global water cycle . . . . . .. . . . . . . . . . . . . . . . . . . . . . . . . . . . 10865 Mass balance of the global water cycle . . . . . . . . . . . . . . . . .. . . . . . . . . . . . . . . . . . . . . . . 10966 Earth’s water resources: relation of supplies to demands. . . . . . . . . . . . . . . . . . . . . . . . . . . . . . . 11067 Resonance induced when different dimensions of the core are considered. . . . . . . . . . . . . . . . . . . . . . 12168 Components of the Earth system and their mechanical interactions. . . . . . . . . . . . . . . . . . . . . . . . . . 13969 The overall system design of the future GGOS . . . . . . . . . . . .. . . . . . . . . . . . . . . . . . . . . . . . 14370 The five levels of GGOS . . . . . . . . . . . . . . . . . . . . . . . . . . . . . . .. . . . . . . . . . . . . . . . 14471 Retroreflector arrays for GNSS satellites . . . . . . . . . . . . .. . . . . . . . . . . . . . . . . . . . . . . . . . 15172 ICRF-E . . . . . . . . . . . . . . . . . . . . . . . . . . . . . . . . . . . . . . . . . . .. . . . . . . . . . . . . 15273 Common data flow and archive structure of the geometric IAGServices . . . . . . . . . . . . . . . . . . . . . . 15374 GGOS portal architecture . . . . . . . . . . . . . . . . . . . . . . . . . . .. . . . . . . . . . . . . . . . . . . . 15575 GGOS Clearinghouse architecture . . . . . . . . . . . . . . . . . . . .. . . . . . . . . . . . . . . . . . . . . . 15576 Combination and integration of the geodetic observationtechniques. . . . . . . . . . . . . . . . . . . . . . . . . 15777 Interactions in the Earth System centered around the three pillars . . . . . . . . . . . . . . . . . . . . . . . . . . 15878 Proposed structure of the future GGOS. . . . . . . . . . . . . . . . .. . . . . . . . . . . . . . . . . . . . . . . 161
List of Tables
1 TheGlobal Geodetic Observing System(GGOS) . . . . . . . . . . . . . . . . . . . . . . . . . . . . . . . . . . 292 Satellite gravity and altimeter mission products . . . . . . .. . . . . . . . . . . . . . . . . . . . . . . . . . . . 383 Instrument Characteristics of TOGA Receiver . . . . . . . . . . .. . . . . . . . . . . . . . . . . . . . . . . . . 414 GPS Ocean Reflections Science Questions . . . . . . . . . . . . . . . .. . . . . . . . . . . . . . . . . . . . . . 415 Traceability Matrix from Science Questions to Observation Requirements for GPS Ocean Reflections Measure-
ments . . . . . . . . . . . . . . . . . . . . . . . . . . . . . . . . . . . . . . . . . . . . . .. . . . . . . . . . . 426 Co-Location Sites . . . . . . . . . . . . . . . . . . . . . . . . . . . . . . . . . .. . . . . . . . . . . . . . . . . 52
The Global Geodetic Observing System GGOS 2020 7
7 The nine Societal Benefit Areas of Earth observations. . . . .. . . . . . . . . . . . . . . . . . . . . . . . . . . 978 Requirements for geodetic observables for the nine benefitareas. . . . . . . . . . . . . . . . . . . . . . . . . . . 979 Key Variables Required for Monitoring the Earth System Water Cycle and Fluxes. . . . . . . . . . . . . . . . . . 11110 Current and future requirements for radiometric observables, geodetic coordinates and related calibration param-
eters. . . . . . . . . . . . . . . . . . . . . . . . . . . . . . . . . . . . . . . . . . . . . .. . . . . . . . . . . . . 12411 URs for access to position. . . . . . . . . . . . . . . . . . . . . . . . . . .. . . . . . . . . . . . . . . . . . . . 12812 Overview of latency and accuracy requirements of main user categories. . . . . . . . . . . . . . . . . . . . . . . 12813 User requirements for scientific applications. . . . . . . . .. . . . . . . . . . . . . . . . . . . . . . . . . . . . 13014 Measurement requirements in terms of geoid height and gravity anomaly accuracy. . . . . . . . . . . . . . . . . 13115 Requirements for meteorological applications of GPS. . .. . . . . . . . . . . . . . . . . . . . . . . . . . . . . 13216 Parameter Space for a rigorous combination and integration of the geodetic observation techniques. . . . . . . . 158

The Global Geodetic Observing System GGOS 2020 8
About this document
Background
“All of the recommendations for solid-Earth science are pred-icated on maintaining NASA’s special capabilities in updatingthe terrestrial reference frame.”This statement included bytheSolid Earth Science Working Group(SESWG) in NASA’sstrategic plan of theEarth Surface and Interior(ESI) focusarea (SESWG, 2002) underlines the importance of theInterna-tional Terrestrial Reference Frame(ITRF) for Earth science. Infact, improvements of the ITRF and the availability of geode-tic observations of changes in Earth’s shape, gravity field androtation over the last decades have been a major driver of sci-entific discovery, and further improvement can be expected tolead to more exciting discoveries, particularly in combinationwith emerging new observation technologies for monitoringthevariability of the Earth’s gravity field and surface deformations.In a broader sense, the geodetic reference frames and observa-tions have contributed to a transition pof many processes inso-ciety and they have the potential to continue to do so. This greatpotential for scientific progress in support of societal needs as-sociated with an improved geodetic observing system providesthe rationale for the GGOS 2020 Strategy Process.
This document contains the specifications for a globalgeodetic observing system in terms of concepts, conventions,infrastructure and services, that would be apt to meet future re-quirements of a global society facing increasingly challengesin a changing planet. With this in mind, the document providesthe basis for the further development of theGlobal Geode-tic Observing System(GGOS) over the next decade and more.Currently, GGOS is being built on the basis of the existing Ser-vices of theInternational Association of Geodesy(IAG). In or-der to utilize maximum benefit to users of the considerable in-frastructure and resources available to these Services, the con-cept for GGOS and the strategy for its development and imple-mentation require careful considerations of the future needs ofsociety for geodetic observations and services.
The context for this report is the increasing societal andscientific needs for Earth observations, and their dependenceon an appropriate geodetic foundation as well as geodetic ob-servations. There is a growing awareness that sustainable de-velopment, which is the agreed-upon leading principle and goalof the global community, cannot be achieved without sufficientknowledge about the state, trends and processes in the Earthsystem. This is manifested in the establishment of theGroupon Earth Observations(GEO) with currently about 70 membercountries. The main purpose of GEO is to facilitate the imple-mentation of theGlobal Earth Observation System of Systems(GEOSS), with the vision for this systemto realize a futurewherein decisions and actions for the benefit of humankind areinformed by coordinated, comprehensive and sustained Earthobservations and information(GEO, 2005a).
Geodesy provides the foundation for all Earth observa-tions as well as crucial observations of changes in the Earth’sgeometry, gravity field, and rotation, which are all relatedto
mass transport in the Earth system and the system dynamics.Therefore, geodesy is crucial for meeting many of the require-ments for observations of global change and observations sup-porting studies of the Earth system. Providing the basis forprecise positioning, geodesy is also crucially supportingmanyactivities and processes in a modern society.
Realizing the importance of the geodetic reference frameand the contribution of geodesy to Earth observations, GEO hasincluded a specific task AR-07-03 “Global geodetic referenceframes” in its Work Plan for 2007-2009. Understanding the re-quirements for GGOS is a central goal of this task. The presentreport is a deliverable of this task.
The development of Earth observations takes place in acontext where a considerable fraction of the funding for Earthobservation infrastructure and research is allocated in responseto major natural and anthropogenic disasters without a suf-ficiently developed core infrastructure stable in time. Manysatellite missions are research oriented, while operational mon-itoring of many key indicators of the Earth system is insuffi-ciently implemented (GEO, 2005b). Even in climate monitor-ing, a stable core is missing.
In geodesy, this situation is not much different. Currentlimitations in funding often paired with a lack of apprehensionof decision makers of the importance of the geodetic observingsystem for Earth observation and the functioning of the globalsociety has led to a situation in which the global geodetic com-munity is attempting to provide better products and servicesbased on incremental improvements of the system that the cur-rent conditions allow.
Scope
The advent of the space-geodetic techniques and the rapid im-provement and growth of communication techniques and ca-pacities has started a revolution in the field of applied andglobal geodesy. Moreover, geodetic imaging increasingly gainsimportance, and the integration of the new techniques andmethods into the traditional point-based approach of geodesyposes a major challenge.
Therefore, it is timely to assess thoroughly the user re-quirements for the geodetic observations and products, and,based on these requirements to design an optimal future system,which makes use of the maturing space-geodetic techniques aswell as the emerging new imaging techniques. In order to doso, the present document frees itself from the current limita-tions and takes a fresh and different approach to the problem,not only with respect to the infrastructure but even more so con-cerning the underlying concepts, including the conventional ap-proach to geodetic reference frames.
This document aims to lay out the directions to whatwould be, under ideal conditions, an optimal geodetic observ-ing system. The document does not attempt to assess thor-oughly the current systems, concepts, products and services,but rather takes a new look at the problem of building a geode-tic observing system. The starting point is a rigorous view at

The Global Geodetic Observing System GGOS 2020 9
the societal and scientific problems that require geodetic obser-vations for their solution, which leads to a set of general userrequirements. These requirements are then, in a second step,applied to derive functional system specifications. A thirdstepfocuses on the design of a system that would meet these speci-fications.
This report provides:
(i) an account of the scientific and societal problems as wellas practical applications that benefit directly or indirectlyfrom geodetic observations, services and products;
(ii) a comprehensive overview of the user requirements forgeodetic observations and products as derived from abroad range of societal benefit areas and scientific require-ments;
(iii) the functional specifications for a geodetic observing sys-tem meeting the user requirements;
(iv) a concept for future realizations of a (terrestrial) referencesystems apt to meet the user requirements;
(v) the design description of a system matching the functionalspecifications, in terms of conventions, techniques, infras-tructure, and data analysis;
(vi) Considerations and recommendations for the system im-plementation.
The anticipated audience
In its final form, this report will come in two parts, namelythe GGOS2020 Strategy Document, which concisely providesthe main vision and an overview over the key elements of thestrategy towards the GGOS in 2020, and the GGOS2020 Ref-erence Document, which comprehensively gives more detailsand background material on the requirements, specifications,design and implementation of the future GGOS.
The Strategy document is aimed towards decision mak-ers, such as politicians setting priorities, funding agencies de-ciding on support for infrastructure, research and development,and international and national agencies deciding on infrastruc-ture and monitoring programs.
The Reference Document is a comprehensive documentaimed to provide the background rationale for GGOS forthose who are involved in either implementing and maintain-ing GGOS or in using observation and products made availablethrough GGOS in a value-adding chain. It was written by ateam of Chapter Lead Authors, who are supported by ChapterWriting Teams. The authors do not come from geodetic fieldsalone but cover in their expertise all fields of Earth sciencesand Earth observation. The reference document serves two pur-poses: (1) to inform the users in Earth observation (in partic-ular, GEO), science and society about the potential of GGOS,and (2) to ensure that the community developing and operat-ing GGOS is aware of the users’ needs and of the requirementsto integrate GGOS into GEOSS for maximum mutual benefit.
Thus, the document intends to facilitate a two-way communi-cation supporting the linkage between GGOS and GEOSS.
Documents consulted
Geodesy has a long tradition of assessing the requirements fromvarious parts of the society and of projecting these into futuredevelopments of the geodetic techniques and observing sys-tems. This report is integrated in this tradition and based ona number of reports made available over the last four decades.These reports include, but are not limited to the “Williamstownreport” (Kaula, 1970), the “Erice Report” (Mueller & Zerbini,1989), the report on geodesy in 2000 prepared by the NationalResearch Council in 1990 (Commission on Physical Sciences,Mathematics, and Applications, 1990), the “Coolfont reports”(NASA, 1991a,b,c), the gravity report by the National ResearchCouncil (Commission on Geosciences & Resources, 1997), the“Living on a restless Planet” report of the Solid Earth ScienceWorking Group of NASA (Solomon & the Solid Earth ScienceWorking Group, 2002), the report of an InSAR Workshop (Ze-bker, 2005), and the recent ESA documentThe Changing Earth(Battrick, 2006).
In the frame of IGOS-P and GEO, several reports havestudied the need of Earth observations in various societallyrelevant fields. Examples are the documents of GEO andIGOS-P such as GEO (2005a,b), the IGOS-P Theme reports(e.g., IGOS-P Ocean Theme Team, 2001; Lawford & the WaterTheme Team, 2004; Marsh & the Geohazards Theme Team,2004; Townshend & the IGOL Writing Team, 2004; Key &the IGOS-Cryo Writing Team, 2004), as well as reports pro-duced by the various United Nations (UN) Agencies and pro-grams. The latter include in particular the recent UN Waterreport (United Nations, 2006).
In a number of recent reports, user requirements forgeodetic observations have been considered. Some of thesereports are focused on national developments (e.g., Williamset al., 2005), improvements of the current situations (e.g., Plag,2006a), or single technological aspects (such as Niell et al.,2006). Of direct importance for the present report are the docu-ments and publications focusing on GGOS, namely the papersin Rummel et al. (2000), and, last but not least, the GGOS Im-plementation Plan (Beutler et al., 2005).
A large number of recent studies concerning relevantEarth system processes and the geodetic observations requiredto study these processes have been produced. Examples are theUNAVCO report on solid Earth science (UNAVCO, 1998), theGerman report on mass movements (Ilk et al., 2005), the U.S.report on InSAR (InSAR Working Group, 2005),
In addition, a number of science reports from relatedfields have been consulted, such as the report on earthquakescience by the National Research Council (Board on Earth Sci-ences and Resources, 2003), the NASA study on a global earth-quake satellite system (Raymond et al., 2003), and the NationalResearch Council Decadal Survey (National Research Council,2007).
The Global Geodetic Observing System GGOS 2020 10
Executive Summary
H.-P. Plag, G. Beutler, B. Lilja Bye, R. Gross, T. A. Herring,P. Poli, C. Rizos, M. Rothacher, R. Rummel, D. Sahagian, J.Zumberge
Preamble: Geodesy is the science of determining the geom-etry, gravity field, and rotation of the Earth and their evolutionin time. Traditionally, geodesy has been serving other sciencesand many societal applications, including mapping. With theadvent of satellite geodesy and an accuracy improvement ofmore than three orders of magnitude over the last three decades,geodesy has developed into a science making unique contribu-tions to the study of the Earth system, its inherent dynamics,and its response to climate change, as well as a tool underpin-ning a wide variety of other remote sensing techniques. Facili-tated by the Global Navigation Satellite Systems such as GPS,a wide and growing variety of applications associated with po-sitioning and navigation is opening up, particularly in combina-tion with products derived from global geodetic observations.This document sets out the requirements for a global observ-ing system to provide the geodetic accuracy necessary to ad-dress important geophysical questions and societal needs,andto provide the robustness and continuity of service which willbe required of this system in order to meet future needs.
(Chapter 1) Living on a dynamic planet – the challenge: Agrowing population is living on a dynamic planet, endowedwith finite resources and limited capacity to accommodate theimpact of the increasingly powerful anthropogenic factor.Find-ing a way to sustainable development is crucial for realizinga stable and prosperous future for the anthroposphere, as hasbeen acknowledged by a number of World summits. Althoughthere are many influential factors, the understanding of theEarth system with its major processes and its trends is one ofthe prerequisites for a sustainable development. A deeper un-derstanding cannot be reached without sufficient observationsof a large set of quantities in the Earth system. As emphasizedby the Earth Observation Summits(EOS), there is an urgentneed for a comprehensive, coordinated and sustained programof Earth observation. Earth observations are not only necessaryfor the scientific understanding of the Earth, they are funda-mental for most societal activities ranging from disaster pre-vention and mitigation, over the provision of resources such asenergy, water and food, the understanding of climate change,the protection of the biosphere, the environment, and humanhealth, to the building and management of a prosperous andsustainable global society.
(Chapter 1) Geodesy is fundamental in meeting this globalchallenge: Geodesy provides the foundation on which allEarth observation systems are built. In this function, geodesyis essential for Earth observation just like the foundationand
frame of a house are necessary to keep it stable over time. Butmodern geodesy does more: it also provides comprehensive ob-servations of changes in the Earth’s shape, gravity field andro-tation. The principle geodetic quantities associated withthesepillars are intimately related to mass transport in the fluidenve-lope of the solid Earth and its interior, as well as the dynamicsof the Earth System. Therefore, the geodetic observing sys-tem contributes essentially to the Earth observation database. Itturns out, not surprisingly, that the geodetic observing systemis similarly essential for exploring the planets, the solarsystem,and beyond.
(Chapter 1) Geodesy is in a transition: The advent of space-geodetic techniques and the rapid improvement of communica-tion techniques and capacities have fundamentally changed, ifnot revolutionized, geodesy and its methods. While previouslypoint coordinates were given with respect to local or regionalreference frames, with space geodetic techniques positions cannow be observed with respect to a global reference frame withunprecedented accuracy. Based on these techniques, changes inEarth’s shape, rotation and gravity field are provided with in-creasing spatial and temporal resolution, increasing accuracy,and with decreasing latency. These observations capture the“fingerprints” of mass movements in the ocean, atmosphere, icesheets and terrestrial water storage; they provide the “scales” toweigh changes in the mass in the ocean; they allow the determi-nation of the kinematics and strain field of the Earth’s surfaceand the displacement field associated with earthquakes; theyprovide information on the water content in the atmosphere;and they constitute crucial constraints for all models of me-chanical processes in the Earth system.
With the development of the space-geodetic techniques,the scope of the geodetic observing system is rapidly extendingfrom a provider of the reference frame and the tools for thedetermination of accurate positions to a system monitoringthemass transport and the dynamics of the solid Earth and its fluidenvelope with an unprecedented spatial and temporal resolutionand accuracy. Thus, this observing system is in the transitionfrom a utility for other geoscientists to a provider of a consistentdata set of Earth observations relevant for nearly all societalbenefit areas of Earth observations.
Geodesy is a “service science”. In the past the “cus-tomers” of geodesy mainly came from the surveying and map-ping profession; today, however, geodesy serves the geophys-ical, oceanographic, atmospheric, and environmental sciencecommunities. Thus, it is their user requirements that influencethe development of the geodetic observing system.
(Chapter 2) International cooperation is essential forgeodesy: Over many years, the international scientific com-munity has managed in a major cooperative effort the establish-ment and maintenance of a global infrastructure that providesthe observational basis for the determination of highly accu-rate positions anywhere on Earth and in space. This achieve-ment has been facilitated by theInternational Association of

The Global Geodetic Observing System GGOS 2020 11
Geodesy(IAG) and is based on the voluntary commitment ofnational geodetic authorities, space agencies, research insti-tutes, universities, and individuals. Two reference systems arebasic in geodesy, namely the celestial reference system andtheterrestrial reference system. TheInternational Earth Rotationand Reference Systems Service(IERS) has the responsibilityfor defining these geometric reference systems and to realizethem through appropriate frames. TheInternational CelestialReference System(ICRS) is the fundamental basis for the def-inition of celestial positions and theInternational TerrestrialReference System(ITRS) is the fundamental basis for describ-ing terrestrial positions. These systems are conventionalcoor-dinate systems including all conventions for the orientation andorigin of the axes, the scale, physical constants, models, andprocesses to be used in their realization.
The ICRS is realized through theInternational Celes-tial Reference Frame(ICRF), which is a set of estimated co-ordinate positions of extragalactic reference radio sources dis-tributed over the sky. The ITRS, in turn, is realized throughtheInternational Terrestrial Reference Frame(ITRF), which is aset of globally distributed points on the solid Earth’s surface,for which estimates of coordinate positions and (currentlycon-stant) velocities are derived from space-geodetic observationsat these points.
Conceptually, the dynamical link between ITRS andICRS is provided by the Earth rotation. Consequently, theITRF and ICRF are connected through estimates of the Earthrotation parameters, which are also derived and made availablethrough the IERS under the name ofEarth Orientation Param-eters(EOP) using the contributions of the space-geodetic tech-niques.
Currently, the ICRF is determined byVery Long BaselineInterferometry(VLBI). For the determination of the ITRF, acombination of several independent space-geodetic techniques,including VLBI, Satellite Laser Ranging(SLR), Lunar LaserRanging(LLR), Global Navigation Satellite Systems(GNSS),andDoppler Orbitography and Radiopositioning Integrated bySatellites(DORIS) is employed. Similarly, the EOPs are the re-sult of data from a combination of these techniques. For eachofthese techniques, a technique-specific IAG Service maintainsa global network of tracking stations (based on voluntary ef-forts of many contributors), which provides the observationsrequired for reference determination. Each of these techniqueshas unique advantages as well as disadvantages, and only thecombination of the techniques guarantees an accurate and sta-ble reference frame. Therefore, the most important elementsfor the determination and maintenance of the ITRF are the so-called “core stations”, which have at least three of the indepen-dent space-geodetic techniques co-located (in addition toab-solute and relative gravity observations and tide gauges, wherepossible). However, globally, there are currently only about 15of these core stations, while about 40 stations are considerednecessary in order to meet the most demanding user require-ments.
The GNSS have developed into the most widely applied
technique for positioning (and navigation). The dramatic devel-opment of theGlobal Positioning System(GPS) over the lastten years towards an accurate and highly efficient technologyfor positioning has been facilitated globally by the work oftheInternational GNSS Service(IGS).
The Global Geodetic Observing System(GGOS) of theIAG is the unifying umbrella for the IAG Services, which inte-grates the observing systems for changes in the Earth’s shape,gravityfield, and rotation and ensures internal consistency. Itlinks the geodetic services into the global Earth observationsystems and provides a consistent service to the users. In partic-ular, GGOS aims to ensure that the geodetic products and toolsrespond to the increasingly more demanding user requirements.
Much of the international cooperation originates from re-gional and national organizations, which not only facilitate thedissemination of the global developments into the regions,butalso are influential in motivating national bodies to contributeto the international activities.
Today, the ITRF and the products and services that giveaccess to the ITRF anywhere and anytime are crucial for ap-plications in many economic and scientific fields. They havebecome so integrated in many applications that they are oftentaken for granted, almost as a natural part of the societal in-frastructure freely available to everybody. However, withoutthe international cooperation in geodesy, this global referenceframe could not be maintained at its current level of accuracyand accessibility. Considering the voluntary commitment baseof GGOS, the incomplete spatial coverage of the ground-basednetworks, and the complementarity of the techniques, nationaldecisions to discontinue geodetic infrastructure, such asthe op-eration of ground stations, or to withdraw support for specifictechniques, can have severe consequences for GGOS and itsproducts, in particular the ITRF.
(Chapter 3) The development of the geodetic observingsystem needs research: Maintaining a terrestrial referenceframe at the level that allows, for example, the determina-tion of global sea level changes at the sub-millimeter per yearlevel, pre- co- and postseismic displacement fields associatedwith large earthquakes at the sub-centimeter level, timelyearlywarnings for earthquakes, tsunamis, landslides, and volcaniceruptions, as well as the monitoring of mass transport in theEarth system at the few Gigatons level requires an comprehen-sive Earth system approach.
Currently, geodesy is facing an increasing demand fromscience, the Earth observation community, and society at largefor improved services, observations and products. Most ofthese requirements are in terms of improved accuracy, in par-ticular, instantaneous accuracy, better reliability (including ad-dressing the issue of liability), and improved access to theref-erence frame. The IAG and GGOS are aware of the enormouschallenges implied by demand to improve the accuracy froman average level of close to10−9 to an instantaneous level(with daily or higher temporal resolution) of10−10, which isrequired in order to meet emerging user requirements. In fact,

The Global Geodetic Observing System GGOS 2020 12
GGOS faces two types of scientific and technological chal-lenges, namely an “internal” and an “external” challenge. The“internal” challenge to geodesy is associated with developingGGOS and the geodetic technologies in order to meet the de-manding requirements in terms of reference frame accuracy andavailability, as well as in terms of spatial and temporal reso-lution and accuracy of the observations. In many cases, it isnot so much the measurement of a single technique that lim-its accuracy but rather the ability to attribute signals to spe-cific sources and to model these. Therefore, meeting this chal-lenge requires integration of techniques and models. This chal-lenge provides a central theme for research and developmentinside IAG for many years to come. The “external” challengeis related to geodesy’s contribution to Earth system monitor-ing and science. The signals induced by global change in theEarth’s shape, gravity field and rotation are small (on the orderof parts-per-billion of the quantities) and embedded in oftenlarger variations not caused by global change. Besides measur-ing the geodetic quantities with an accuracy considerably betterthan the signals, identifying and extracting the global changesignals also requires the modeling of all known processes inan Earth system model taking into account the interactions be-tween the various Earth system components. This challenge re-quires geodesy to interact with all Earth sciences and to accom-modate the terrestrial processes in data processing and model-ing.
(Chapter 4) The benefits of the global and national geode-tic infrastructure are enormous: A very accurate and sta-ble global geodetic reference frame, such as the ITRF, is indis-pensable for Earth observation, science and the functioning of amodern society. In such a frame, coordinates can be attachedtopoints and objects (e.g., an airplane, a measuring sensor, amarkin the ground) and their movements over time can be described(e.g. the position of a point on the Earth’s surface before, dur-ing, and after an earthquake). The benefits of the ITRF and theglobal geodetic infrastructure are wide-ranging. GGOS and, inparticular, the key product ITRF:
• contribute substantially, directly or indirectly, to manyeconomic activities and to the global wealth;
• allow for the exploitation of the space-geodetic technolo-gies for a wide range of practical and scientific applica-tions;
• provide a foundation on which today’s national and re-gional reference frames are built and link these frames toeach other;
• allow the interrelation of all geo-referenced data to be de-scribed in the same frame and thus facilitates full interop-erability of geo-related databases and services;
• support governmental and intergovernmental prioritiesand international activities, such as sustainable develop-ment, climate change, theIntegrated Global Observing
Strategy(IGOS), theGlobal Earth Observation Systemof Systems(GEOSS), theIntergovernmental Panel on Cli-mate Change(IPCC), and theUnited Nations(UN).
• provide a mechanism, in many countries, including devel-oping ones, for national participation in important globalprograms aimed at a better understanding of the Earth sys-tem, its climate, global geodynamics, geohazards, etc.,and the mitigation of the impact of natural and anthro-pogenic hazards on society.
• provides a mechanism for participation of the private sec-tor and research institutes in international projects and ac-tivities, particular in the field of technology development.
(Chapter 4) The societal prospects of space geodesy:Thetechnological development facilitated through the new space-geodetic techniques for navigation and positioning poses newand difficult challenges and continuously creates new require-ments in terms of accessibility, accuracy and long-term stabil-ity. The rapid development of satellite-based precise point po-sitioning techniques, which allows the determination of veryaccurate position anytime and anywhere on the planet, enablesa wide range of position-related applications. The new geode-tic technologies are leading to fundamental changes not onlyin all areas of navigation and transport, but also for applica-tion in process control (e.g. farming, construction, mining, re-source management), construction and monitoring of infras-tructure (e.g. off-shore platforms, reservoirs dams, bridges, andother large civil structures), surveying and mapping (includ-ing off-shore), and Earth observation. Geodetic techniques arecrucial in the assessment of geohazards and anthropogenic haz-ards, and they will play a pivotal role in early warning systemsof such hazards and disasters. The prospect of these changesis increased security, a better use of resources, and progress to-wards sustainable development.
A well-defined and accessible reference frame togetherwith high-speed communications and advanced data process-ing enables modern societies to operate in a very cost efficientmanner, and hence create a basis for higher standards of liv-ing. National studies have shown that a number of major areasin national economies depend to a large part (up to 40%) ontheir geodetic infrastructure and services. Taking into accountthe fact that most national reference frames are fully depen-dent on the global infrastructure and frames, any degradationof the global infrastructure may have serious consequencesfornational economies.
Thus, the availability of a global geodetic reference framesuch as ITRF and the tools to determine precise point coordi-nates anytime and anywhere on Earth have a profound effect onalmost all areas of society. Moreover, since the ITRF is avail-able anywhere on the planet, it improves access to an importanttechnological resource. Therefore, it is an important contribu-tion compatible with the principle of sustainable developmentdemanding equal access to resources for all.

The Global Geodetic Observing System GGOS 2020 13
(Chapter 5) Towards a geodetic Earth system service:Changes in Earth’s shape, gravityfield, and rotation are in-herently related to the dynamics of and mass transport in theEarth system. With the rapid progress of the geodetic observa-tion techniques, an integrated global geodetic observing systemconstitutes the basis for an Earth system service that providesinformation on the state of and trends in the Earth system withrespect to relocation of mass, deformations of the Earth’s sur-face, and changes in the Earth’s dynamics.
Mass transport on time scales up to decades takes placemainly in the fluid envelope of the solid Earth, and there, wa-ter transport is three orders of magnitudes larger than any othermass transport. Thus, information on the fluxes in the globalwater cycle, including the ice sheets and glaciers, ocean, andterrestrial hydrosphere can be provided with unprecedentedspatial and temporal resolution and accuracy, particularly forglobal and regional scale changes. This information is crucialfor understanding the impact of global change on the water cy-cle, in particular the ice sheets, sea level, and large terrestrialwater catchments,
Surface displacements are related to both mass reloca-tions on and above the solid Earth’s surface and geodynamicprocesses in the solid Earth. Surface displacements are caused,for example, by earthquakes, tectonic processes, magma flowin the crust, and anthropogenic ground water changes. Thus,information on surface displacement provides a basis for, forexample, scientific studies of geohazards, hazard assessment,early warning, and resource management.
For times scales of up to decades, changes in the dynam-ics of the Earth system, particularly its rotational dynamics, arebrought about to a large extent by changes in the climate sys-tem. The solid Earth, ocean, and atmosphere continuously ex-change angular momentum, and changes in the mean circula-tion of the atmosphere and ocean affect the rotation of the solidEarth. Mass redistribution on the Earth’s surface, for example,through melting of ice sheets, deform the solid Earth, and asa result, also change the rotation. Earth rotation is affected bythese processes in an integral way, and thus is an ideal parame-ter to assess the overall state of the system.
(Chapter 5) Geodetic observations and products are cru-cial for the utilization of the benefit of Earth observation:Geodesy provides the foundations for a global geodetic ref-erence frame such as the ITRF that can be used by all Earthobserving systems to monitor atmosphere, ocean, and otherresources, and that allows measurements in a globally con-sistent reference frame. Without a sufficiently accurate andstable ITRF, the benefit of Earth observations for most of thenine societal benefit areas identified by EOS would be signifi-cantly reduced. Monitoring quantities relevant for geohazards,the global water cycle, climate and weather, energy, and evenhealth, depends crucially on ready and reliable access to a ref-erence frame. Thus, a sufficient geodetic reference frame ismandatory for realizing GEO’s vision for GEOSS, i.e.a futurewherein decisions can be based on sufficient information for
the benefit of humankind.Geodesy supports Earth system observation, modeling,
understanding, and prediction in general. Some of the toolsandmethods of geodesy, in particular GNSS, already yield in someareas routine observations of the atmosphere, such as the wa-ter vapor fields in the lower troposphere, the mass fields in thestratosphere, and the electron content fields in the ionosphere.The raw measurements used in this approach are inherently cal-ibrated with respect to atomic clocks. There are no other obser-vations of the Earth’s global atmosphere that can claim sucha recurrent, atomic calibration inherited from the GNSS sig-nals. In that respect, geodesy could further help track climatechange. On the modeling and prediction issues, geodesy couldsupport Earth system circulation models for the fluid envelopof the Earth (atmosphere, ocean, ionosphere) with space- andtime-varying gravity fields.
Despite considerable progress over the last two decades,mainly due to technological improvements, the quality and ac-curacy of the reference frame has been hampered by fluctua-tions in support and contributions that are inherent in activitiessolely based on voluntary commitment. In particular, over thelast few years, infrastructure central for the long-term stabilityof the reference frame, such as SLR stations and VLBI anten-nas have been retired without replacements; a development po-tentially leading to a degradation of the ITRF accuracy. In thenear future, satellite missions central for monitoring icesheetsand sea level will cease to operate, and follow-on operationalmissions must be being planned for now.
Unanticipated impacts of global change can be verycostly in terms of life and property. But unnecessary mitiga-tion can be costly, too. A good example is provided by theanticipated sea level changes: Sea level rise has been widelyacknowledged as a slowly developing hazard with potentiallydisastrous consequences. Mitigation of a sea level rise impact isa long-term process which requires considerable planning andimplementation time of the order of decades. Considering thetypical life time of coastal infrastructure, planning decisionshave to be based on sea level scenarios covering at least onehundred years. Mitigation of sea level rise impact is extremelyexpensive and risky. Too little will cause severe impact, toomuch will put unnecessary demands on national and regionaleconomies. Therefore, decisions have to be based on solidlyfounded sea level scenarios in order to minimize the risk asso-ciated with misjudgment (in either direction), but the databaseand knowledge base for the sea level rise scenarios is scarce.Crucial information required to improve the understandingofsea level and ice sheet changes and to set up future sea levelscenarios comes from Earth observation systems. Satelliteal-timeters, satellite gravity missions, GNSS satellites, tide gaugesand otherin situ techniques are all necessary components ofthe “sea level observing system”. However, with all these com-ponents in place, the observations cannot provide the requiredinformation if not linked to a well-defined and stable globalref-erence frame. Without this frame, past and present ice sheetandsea level changes cannot sufficiently be quantified and under-

The Global Geodetic Observing System GGOS 2020 14
stood, and plausible future scenarios of regional and localsealevel cannot be provided to the society as a basis for informedplanning.
(Chapter 6) Geodesy is essential for exploring the plan-ets, solar system and beyond: Planetary geodesy, radioscience, interferometry (including imaging VLBI, astrometricVLBI, and Earth-space VLBI), and inter-planetary navigationall require accurate terrestrial and celestial reference frameswell linked together by Earth rotation observations for makingand interpreting their measurements. The performance of theGGOS is not a limiting factor in all of these applications. How-ever, in order to meet demanding future requirements, it willbe important to develop GGOS such that the terrestrial and ce-lestial reference frames and the Earth rotation parametersmeettheserequirements.
(Chapter 7) User requirements for geodetic observationsand products are demanding: The current scientific and so-cietal user requirements are demanding in terms of accuracy,resolution, latency and reliability, and the requirementsare ex-pected to increase in the future. The GGOS products must havesufficient accuracy, temporal and spatial resolution, and latencyto meet these requirements, which can be achieved by meetingthe most demanding requirements. The most demanding usersof the terrestrial reference frame in terms of accuracy and long-term stability are most likely the scientific studies of sea levelchange caused by climate change. In order to have a frame atleast an order of magnitude more accurate than the signal tobe monitored, the terrestrial reference frame should be accu-rate at a level of 1 mm and be stable at a level of 0.1 mm/yr.The most demanding applications of the geoid are likely to bedetermination of the mean sea surface topography for oceanicgeneral circulation models, and the GNSS determination of theheight of objects at the millimeter level. These applications re-quire the static geoid to be accurate at a level of 1 mm and tobe stable at a level of 0.1 mm/yr, consistent with the accuracyand stability of the terrestrial reference frame. The most de-manding application in terms of accuracy and latency of Earthorientation parameters and their consistency with the terrestrialand celestial reference frames is likely to be the tracking andnavigation of interplanetary spacecraft. This application is ca-pability driven and requires the most accurate EOPs that canbedetermined, realizing that those determined in near real-timeare somewhat less accurate than those determined with a delayof a couple of weeks. Quantitatively, an accuracy at a level of1 mm for the Earth Orientation Parameters should be achieved.For the time variable geoid, the monitoring of the water cycleat regional to global scales appears to be the most demandingapplications requiring the geoid variations to be monitored ac-curate to 1 mm, stable to 0.1 mm/yr, with a spatial resolutionof 50 km and a time resolution of 10 days.
(Chapter 8) Towards a modern geodetic reference frame:A modern geodetic reference frame supporting precise point
positioning consists of
• a highly accurate, global geodetic reference frame basedon a sufficient number of multi-technique tracking sta-tions;
• a service providing satellite orbits and clocks as well asEarth rotation parameters of high quality and long-termconsistency in this global reference frame;
• a highly accurate model of the gravity field (in particular,the geoid) and its changes;
• a well-determined tie between the geometric and gravi-metric reference frames;
• a velocity model that allows the determination of trans-formations between the time-dependent global referenceframe and fixed national reference frames.
On a national level, the classical geodetic referenceframes are still typically reliant on relative positioning. How-ever, it is anticipated that increasingly for many applications atransition to precise point positioning will take place in manycountries. A core element for this transition will be a referenceframe service providing access to the reference frame anywhereon Earth, including the ocean surface, with a high instantaneousaccuracy.
A deficiency of the current terrestrial reference frame isthat it is only defined for relatively few points (order 500) onthe Earth’s surface. For all other points, no ’reference motion’is available hampering the identification of anomalous motion.Therefore, it is anticipated to augment the current referencepolyhedron with a dynamic Earth reference model. This model,in principle, will provide infinite spatial and temporal resolu-tion for geometry and gravity and thus establishes a referenceframe available anywhere on Earth and above at any time. Thedynamic Earth reference model will combine geometry, gravityand rotation in one consistent model. However, implementingthis model poses significant scientific challenges, which pro-vide a central theme for geodesy over the next decade.
(Chapter 9) Infrastructure for geodetic Earth system mon-itoring: GGOS is based on a mix of terrestrial, airborne,and spaceborne techniques, each with unique characteristicsand contributions, and a layered infrastructure ranging for theground-based networks on the Earth’s surface to artificial satel-lites, infrastructure on the Moon, and quasars. Parts of thein-frastructure are still in a research state, while other parts arefully operational.
The global ground-based infrastructure comprises notonly the globalin situnetworks of several geometric and gravi-metric techniques, but also the numerous data centers, analysiscenters, and web-based services, that are required to determineand maintain the reference frames as well as to make them ac-cessible for a wide range of applications. Despite a large in-ternational effort, most networks are still characterizedby spa-

The Global Geodetic Observing System GGOS 2020 15
tially uneven distributions, and hence by large gaps in cover-age. For some techniques, such as SLR, spatial gaps are largeand place significant limitations on the achievable accuracy. Ofparticular importance are stations where several techniques arecollocated, thus allowing the integration of the techniques intoone coherent frame. Of the order of 40 evenly distributed corestations, i.e. stations with three or more geodetic techniquescollocated, are required, but currently there is a severe gap overthe southern hemisphere in this core network. Without closingthis gap, most of the demanding user requirements will not bemet.
The satellite component contributing to GGOS includeslow Earth orbiting satellites (e.g., dedicated gravity missionsand altimeters), dedicated laser-ranging satellites (e.g., LA-GEOS), and GNSS satellites. The former provide observationsrelated to mass transport and displacements of the solid Earth,ice, and ocean surfaces. Here, mission continuity is a key in-frastructure problem.
The dedicated laser-ranging satellites are crucial for theconnection of the reference frame origin to the center of massof the Earth system, a mandatory requirement for studies ofglobal processes. These satellites have very long lifetimes, buttheir number is very small.
The signals from the GNSS satellites provide the basis forthe “work horse” in GGOS. With currently about 400 trackingstations in more than 80 countries, this “work horse” allowsforan accurate monitoring of the global reference frame and forac-cess to the frame anytime and anywhere on Earth. Without thefreely available signals of GPS, the impressive development ofgeodesy over the last two decades would have been impossible.
Today, infrastructure on the Moon consists of retro-reflectors for LLR.
Quasars provide the stable reference points for the ICRF,against which the rotation of the Earth can be measured. VLBIutilizes radio signals emitted by these far-away objects, andcontributes unique observations that are especially importantfor the monitoring of Earth rotation, which provides the linkbetween ICRF and ITRF. Thus, VLBI is essential for a consis-tent ITRF. In fact VLBI is the only space geodetic techniquecapable of simultaneously monitoring ITRF, ICRS and Earthrotation. Furthermore, unlike the other space geodetic tech-niques, VLBI provides a unique ITRF scale, traceable directly(and only) to the speed of light, which is essential to variouslong-term monitoring within ITRF, including changes in globalhydrology and sea level rise.
Observations with terrestrial gravimeters, both absoluteand relative, provide the basis for studies of many geophysicalphenomena, including but not limited to free oscillations of theEarth, solid Earth and ocean tides, surface loading, changes inice sheets, and sea level changes. Absolute gravimetry, com-bined with geometric techniques, is a terrestrial technique sup-porting SLR in constraining the tie between the reference frameorigin to the center of mass of the Earth system.
In total, an estimated 500 person years per year are pro-vided on a voluntary commitment basis by national operational
and research institutes to maintain the ground-based networks,the data centers, analysis centers and user interfaces. Notin-cluded in this estimate are the resources required for the satel-lite missions and the GNSS satellites themselves.
(Chapter 9) For a full exploitation of the potential, an op-erational core component is needed: Currently, GGOS andthe IAG Services are based on the voluntary commitments ofmany national authorities, institutions, and individuals. More-over, GGOS, to a large extent, is still science-driven. As a con-sequence, the observing system keeps changing due to tech-nological developments and scientific priorities, as well as na-tional political decisions. Fluctuations in the regional cover-age of the terrestrial component and the mix of techniques aresevere, often dependent on national priorities or funding avail-ability. A high redundancy is needed to compensate for thesefluctuations. Technological progress leads to changes thatarenot always properly coordinated. Satellite missions are evenmore science-driven than the other components of GGOS, anddiscontinuations of important observation programs have hap-pened and unfortunately are likely to continue to happen in thefuture. Funding for the global geodetic infrastructure dependson the national decisions and priorities in many countries,andthis implies considerable volatility, sometimes threatening theproper maintenance of the reference frames and the IAG Ser-vices. All of these factors lead to temporal inhomogeneities inthe system, its observations, and, most importantly, the geode-tic reference frames. At the same time, as a consequence of thegrowing demands for georeferencing in a wide range of appli-cations, issues are raised concerning the reliability and conti-nuity of the geodetic products, as well as liability of the ser-vice and data providers. Therefore, in order to fully exploitthe potential of geodesy and to develop GGOS into an Earthsystem service, a fully operational core is needed for GGOS.Considering the scale of GGOS, such a core will require an ap-proach based on intergovernmental agreements, implying firmcommitments by the contributing nations. GGOS therefore hasstarted a dialog at the international level, in particular withinGEO, in order to develop an intergovernmental framework forreference-related activities.
(Chapter 10) Implementation of GGOS needs a multi-faceted organizational framework: GGOS is currently car-ried by the Commissions, Inter-Commission Committees, andthe Services of IAG. In order to maintain GGOS in the future,the technique-specific and the combination services must con-tinue their work using state-of-the-art observational andanal-ysis tools, with GGOS providing the overarching strategy andorganization. In particular, GGOS will have to ensure the coor-dination of the multi-technique network including the dataflow,it will have to maintain the standards and conventions neces-sary to ensure consistency across the components contributingto GGOS, and it will have to develop a plan for an uninter-rupted sequence of geodesy-related space missions. GGOS willneed to be embedded in the framework of global Earth Obser-
The Global Geodetic Observing System GGOS 2020 16
vation currently best represented by GEO, the surveying andnavigation communities (organized in particular in theInstituteof Navigation(ION) and theInternational Federation of Sur-veyors(FIG)), and the science community. GGOS will have toserve as an interface to all these stakeholders in GGOS as wellas society at large. A dialog of GGOS with its stakeholders in-cluding the funding agencies, the space agencies, and relevantUnited Nations agencies with the goal to ensure long-term sta-bility of GGOS and to secure long-term funding for GGOS willbe central for a successful implementation of GGOS.

The Global Geodetic Observing System GGOS 2020 17
1 Introduction
H.-P. Plag, G. Beutler, R. Gross, T. A. Herring, C. Rizos, M.Rothacher, R. Rummel, D. Sahagian, J. Zumberge
1.1 The challenge: living on a changing, dy-namic planet
Earth is a restless planet (Solomon & the Solid Earth ScienceWorking Group, 2002). With its atmosphere, oceans, ice cov-ers, land surfaces and its interior, it is subject to a large varietyof dynamic processes operating on a wide range of spatial andtemporal scales, and driven by large interior as well as exteriorforces. Many areas of the Earth’s surface are exposed to nat-ural hazards caused by dynamic processes in the solid Earth,the atmosphere and the ocean. Earthquakes, tsunamis, volcanoeruptions, tectonic deformations, land slides, deglaciation, sealevel rise, floods, desertification, storms, storm surges, globalwarming and many more are typical and well known phenom-ena that are expressions of the dynamics of our restless planet.In modern times these processes are influenced, as well, by an-thropogenic effects; to what extent is still largely unknown.
Earth is a finite planet. Resources such as clean water,arable land, flora and fauna, minerals, and energy are limited.Probably even more importantly, the capacity of the Earth sys-tem to maintain a delicate equilibrium under increasing anthro-pogenic pressure is limited.
A growing population has to cope with this restless, andfinite, planet. On the one hand, settlements are encroachinginto areas of high risks from natural hazards with major in-frastructure being built in locations with high potential of largeearthquakes, volcanic eruptions, storm surges, tsunamis,land-slides and flooding, thus increasing the vulnerability of soci-ety. Increasingly, valuable and crucial infrastructure islost innatural disasters, affecting the economy on national and globallevels, and displacing large populations, with severe social im-plications. On the other hand, the growing demands for ac-cess to food, water, materials, and space put stress on the fi-nite resources of the planet. The anthroposphere has growninto one of the most powerful factors in the Earth system thatistransforming the Earth’s surface layers rapidly (as documented,for example, by Turner II et al., 1990) and that is capable ofchanging major processes including those of the climate sys-tem. However, it has not reached the necessary understandingto actually wield this power. Earth system processes, whethernatural or modified by humans, affect our lives and the livesof future generations. Decisions made today will influence thewell-being of future generations. In order to minimize the an-thropogenic impact on Earth system processes and in order topreserve resources for future generations, a better understand-ing of Earth system processes and an efficient and conservativeorganization of anthropogenic processes is required.
Reaching a condition of “sustainable development” hasbeen recognized as a necessary (albeit not sufficient) prereq-
uisite for living on a restless planet with finite resources,and alimited capacity to accommodate the impact of the increasinglypowerful anthropogenic factor. A number of World summitshave acknowledged that finding a way to ensure sustainable de-velopment is mandatory for realizing a stable and prosperousfuture for the anthroposphere. Although there are many otherinfluential factors, understanding the Earth system, its majorprocesses and its trends, is one of the prerequisites for thesuc-cess of the quest for sustainable development. Major decisionsfacing human societies will depend on a much deeper under-standing of this complex system.
A deeper understanding of the Earth system cannot beachieved without sufficient observations of a large set of quan-tities characteristic of Earth system processes. As emphasizedby theEarth Observation Summits(EOS), there is an urgentneed for comprehensive Earth observations (see the documentsin the Appendices of GEO, 2005b). Earth observations are notonly necessary for a scientific understanding of the Earth, theyare fundamental for most societal areas ranging from disasterprevention and mitigation, the provision of resources suchasenergy, water and food, aiming an understanding of climatechange, the protection of the biosphere, the environment, andhuman health, to the building and management of a prosperousglobal society.
1.2 The potential: geodesy’s contribution to aglobal society
Geodesy is the discipline that deals with the measurement andrepresentation (geometry, physics, temporal variations)of theEarth and other celestial bodies (Sideris, 2007). The “threepillars” of geodesy are the Earth’s time-dependent geometricshape, gravitational field, and rotation (Figure 1). Today,alongwith these pillars a number of related quantities are observedwith terrestrial and space-geodetic techniques using a combi-nation of spaceborne and airborne sensors andin situnetworks(see Chapter 2). With its observational means, geodesy has thepotential to determine, unambiguously and with utmost preci-sion, the geometric shape of land, ice, and ocean surfaces asaglobal function of space and time. Since the dense web of mi-crowave radiation used for geodetic positioning passes throughthe atmosphere, its interaction with the atmosphere yieldsim-portant weather information. The geometric methods whencombined with global gravity information and the geoid, al-low us to infer mass anomalies, mass transport phenomena andmass exchange in the Earth’s system. Finally, the variations inEarth rotation reflect mass transport in the Earth system andtheexchange of angular momentum among its components.
Observations of Earth’s variable shape, gravity field, androtation provide the basis for the realization of the referencesystems that are required in order to assign (time-dependent)coordinates to points and objects, and to describe the motion ofthe Earth in space (Figure 1). For this purpose, two referencesystems are basic in geodesy, namely the celestial referencesystem and the terrestrial reference system, which are dynami-

The Global Geodetic Observing System GGOS 2020 18
cally linked to each other by the Earth’s rotation. The two mostaccurate reference systems currently available are theInterna-tional Celestial Reference System(ICRS) and theInternationalTerrestrial Reference System(ITRS) (see Section 2.2 for moredetails), which are defined by theInternational Earth Rotationand Reference Systems Service(IERS). These systems are con-ventional coordinate systems that include all conventionsforthe orientation and origin of the axes, the scale, and the physicalconstants, models, and processes to be used in their realization.Based on observations, these systems can be realized throughtheir corresponding “reference frames”. The frame correspond-ing to the ICRS is theInternational Celestial Reference Frame(ICRF), which is a set of estimated positions of extragalacticreference radio sources. The frame corresponding to the ITRSis theInternational Terrestrial Reference Frame(ITRF), whichis a set of estimated positions and velocities of globally dis-tributed reference marks on the solid Earth’s surface. Thesetwo frames are linked to each other by estimates of the Earthrotation parameters. ICRS, ITRF and the Earth rotation param-eters are provided by IERS.
Today, the internationally coordinated geodetic observa-tions provided by the global geodetic station networks pro-vide a continuous monitoring of the ITRF. This well-defined,long-term stable, highly accurate and easily accessible ref-erence frame is the basis for all precise positioning on andnear the Earth’s surface. It is the indispensable foundationfor all sustainable Earth observations,in situ, as well as air-borne and spaceborne. Furthermore the ITRF underpins allgeo-referenced data used by society for so many uses. At themost foundational level the ITRF rigorously supports the Spa-tial Data Infrastructure (SDI). The SDI is a model of all geo-referenced data that consists of many layers, all connectedtothe geodesy layer which is the realization of the ITRF at na-tional and extra-national (and increasingly the international)scale. The other layers of the SDI are like elements of a”house”, built on strong foundations, and include map and im-age data of the physical surface of the earth, its terrain, wa-terways, forests, vegetation and habitats; transport and built in-frastrusture such as roads, railways, and other structures; cadas-tral land boundaries; political boundaries; and many others. Allthese layers of digital geo-referenced data are crucial formanyactivities, ranging from mapping, construction, land develop-ment, natural resource management and conservation, naviga-tion - in fact all decision-making that has a geo-related compo-nent.
Historically, geodesy was limited to determining theshape of the Earth, its gravity field, and its rotation includingtheir changes over time. With modern instrumentation and an-alytical techniques, the scope of geodesy has extended to in-clude the sources of the observed changes, i.e., the dynamics ofand mass transport within the Earth system. With this broaderscope new pathways emerge in which geodesy can contributeto the scientific understanding of the Earth system as well asthedevelopment, functioning, and security of society in general.
To a large extent, geodesy is a “service science”. In the
Figure 1. Constituents of an integrated geodetic monitoringsystem. The “three pillars” of geodesy provide the conceptualand observational basis for the reference frames required forEarth observation. Moreover, these three pillars are intrinsi-cally linked to each other as they provide different observationof the same Earth system processes.
past, the main “customers” of geodesy came from the survey-ing and mapping profession, while today geodesy serves allEarth science, including the geophysical, oceanographic,at-mospheric, and environmental science communities. Conse-quently, today the development of the geodetic observing sys-tem is guided by the user requirement of a much broader “cus-tomer” base.
With the “three pillars”, geodesy precisely observes andconsistently monitors mass movement in the Earth system andits associated dynamics:
• Geokinematics: measuring the geometric shape of theEarth’s surface (solid Earth, ice and oceans) and its kine-matics, on global to local spatial scales, and at time scalesfrom rapid to secular;
• Earth rotation: monitoring the variations of the Earth’srotation as an indicator of all angular momentum ex-change inside, on or above the solid Earth, as well as ofthe torques acting on the solid Earth including those dueto the Sun and Moon;
• Gravity field: determining and monitoring the Earth’sgravity field and inferring the underlying mass redistribu-tions in the solid Earth, liquid core, atmosphere, oceans,hydrosphere, and cryosphere.
Ultimately, all geodetic observations are affected by the sameunique Earth system processes. Thus, geodesy provides a

The Global Geodetic Observing System GGOS 2020 19
unique framework for monitoring and ultimately understand-ing the Earth system as a whole. Modern space-geodetic tech-niques are well suited for observing phenomena on global toregional scales, and thus are an important complement to tradi-tional in situ observation systems.
The recent development of space geodetic techniques andmethods (see Chapter 2) also enables auxiliary applications thatutilize the atmospheric disturbance of geodetic measurements(ionosphere, troposphere, magnetic field) for non-geodetic ap-plications. Atmospheric disturbance used to be the naturalfac-tor limiting the accuracy of geodetic measurements. Now this“noise” is increasingly being recognized as “signal”, and thedistortions of geodetic microwave signals propagating throughthe atmosphere can be “inverted” and used for weather predic-tion (e.g., Jerrett & Nash, 2001; Elgered et al., 2005), climatestudies, and studies in atmospheric physics.
Many scientific applications depend on detailed knowl-edge of the Earth’s shape, its gravity field and rotation, andinthe past geodesy has with ever-increasing accuracy providedthe necessary observations. The fairly recent advent of space-geodetic techniques has brought about a rapid development inglobal geodesy, particularly during the last decade or so. Therelative precision of the measurements is approaching the veryimpressive level of 1part-per-billion (ppb) or even better. To-day, geodetic techniques permit the measurement of changesinthe geometry of the Earth’s surface with an accuracy of mil-limeters over distances of several 1000 km.
Over the last one and a half decades, the global geode-tic networks have provided an increasingly detailed picture ofthe kinematics of points on the Earth’s surface and the tem-poral variations in the Earth’s shape. Among other applica-tions, the observations have been used to determine improvedmodels of the secular horizontal velocity field (e.g., Kreemer &Holt, 2001; Kierulf et al., 2002; Kreemer et al., 2003), to deriveseasonal variations in the terrestrial hydrosphere (e.g.,Blewittet al., 2001), to study seasonal loading (e.g., Dong et al., 2002),to invert for mass motion (e.g., Wu et al., 2003), and to improvethe modeling of the seasonal term in polar motion (Gross et al.,2004). Geodetic techniques provide the means to observe sur-face deformations on volcanoes (e.g., Lu et al., 2000; Lanariet al., 2002; Bonforte & Puglisi, 2003), in unstable areas (e.g.,Ferretti et al., 2004), associated with earthquakes and fault mo-tion (e.g., Banerjee et al., 2005; Vigny et al., 2005; Kreemeret al., 2006b), or subsidence caused by anthropogenic activitiessuch as groundwater extraction (e.g., Strozzi et al., 2002). Cur-rent developments indicate that geodetic observing techniqueswill be able to determine the magnitude of great earthquakesinnear-real time and thus help mitigate the problem of low ini-tial magnitudes estimated by seismic techniques (Blewitt et al.,2006b).
Spaceborne sensor systems play an important role inGlobal Change studies. With satellites it is feasible to observeEarth system processes globally, uniformly and with relativelyrapid repetition rates. Nevertheless, the results are still incon-clusive, as evidenced by the ongoing debate about global warm-
ing (see, e.g., Hogan, 2005, and the references therein). A con-clusion of this debate is that “the data are inadequate”.
If the geodetic observations and products can be providedon a global scale with a precision at or below the 1 ppb level,consistently (a very complex issue), and with sufficient stabilityover decades, geodesy can make very important contributionsto the understanding of the state and dynamics of System Earth.A prerequisite for exploiting the full potential of geodesyforEarth observation, Earth system monitoring, and many prac-tical applications is a sophisticated integration of all geodetictechniques (spaceborne, airborne, marine and terrestrial), pro-cessing models and geophysical background models into onesystem. This integration will permit – as part of global changeresearch – the assessment of surface deformation processesandthe quantification of mass anomalies and mass transport insideindividual components, and mass exchange between the com-ponents of the Earth’s system. These quantities serve as inputto the study of the physics of the solid Earth, ice sheets andglaciers, hydrosphere and atmosphere. They are of particularvalue for the study of complex phenomena such as glacial iso-static adjustment, the evolution of tectonic stress patterns, sealevel rise and fall, the hydrological cycle, transport processesin the oceans, and the dynamics and physics of the atmosphere(troposphere and ionosphere).
A main driver for the development of the geodetic observ-ing system is, of course, the progress of science. In addition,technological advances with improved sensors, networks, andcommunications, the impact of nanotechnology, and the de-velopment of new and improved observing systems (for exam-ple, InSAR, LiDAR and all remote sensing missions, includingGRACE, GOCE,and future satellite missions) are key drivers.As pointed out above, the mounting pressure of environmen-tal changes and the associated societal needs demand improvedEarth observations which in turn put increasing demands on thegeodetic observing system. Issue such as hazards monitoringand understanding of global change, the exponential growthof,and need for, geo-spatial information, and the complexity andscale of the global problems that cannot be solved by a sin-gle science require a well developed geodetic observing systemas a key element. Geodetic expertise is therefore increasinglyneeded, and valued, by other sciences (Sideris, 2007).
With this development, geodesy faces several challenges(Sideris, 2007), namely: (1) inter-disciplinarity is required inorder to contribute to collaborative solution to problems,to al-low for an optimal assimilation of a wide spectrum of obser-vations in inter-disciplinary models, and to reach to interpre-tation and separability of the various signals; (2) a develop-ment towards a four-dimensional geodesy is required, in whichtemporal variations in the shape of the Earth and its gravityfield are fully accounted for, long-term observation campaignsand archiving are planned with the 4-D nature of the systemin mind, and an accuracy level for geometric and gravimet-ric quantities of much better than10−9 (approaching10−12)is achieved; (3) the recognition of what geodesy is and whobenefits from it in which way needs to be build up through ap-

The Global Geodetic Observing System GGOS 2020 20
propriate outreach, and geodesy, in particular IAG, faces thechallenge of how best to promote the geodetic contributionstoscience and society at large.
Geodesy is crucial not only for Earth observation and sci-ence, but today it is also indispensable for the maintenanceofmany activities in a modern society. Traditionally, geodesy hasserved society by providing reference frames for a wide rangeof practical applications from regional to global navigation onland, sea, and in air, construction of infrastructure, to the deter-mination of reliable boundaries of real estate properties.Refer-ence frames were, however, national or regional in scope, andthey were suited for the determination of coordinates relativeto a network of reference points. Thus, determination of pre-cise point coordinates required simultaneous measurements atseveral points. Today, theGlobal Navigation Satellite Systems(GNSS) provide access to precise point coordinates in a globalreference frame anytime and anywhere on the Earth’s surfacewith centimeter-level accuracy and without requiring additionalmeasurements on nearby reference points.
On the user side, this technological development hasstimulated new applications demanding even greater accuracyand better access to geodeticly determined positions. On localto regional scales, applications such as land surveying, moni-toring of infrastructure, prevention and mitigation of impactsof environmental hazards, and numerous technical applicationsrequire more or less instantaneous access to geodetic positionsin a reliable reference frame with centimeter-level accuracy orbetter. Already today, the economic benefit of the geodetic ref-erence frame is enormous (see, e.g., Williams et al., 2005),andas more and more societal applications depend on precise po-sitioning, this is very likely going to increase in the future: Inparticular, the emerging combination of broadband communi-cations, geo-databases and easily accessible accurate position-ing can be expected to facilitate many new applications and ser-vices (see Chapter 4), which will transform society and leadtoincreasing dependence on the geodetic foundation, i.e. theter-restrial geodetic reference frame including easy access tothisframe in the form of accurate positions.
1.3 The observing system: the current develop-ment of the Global Geodetic Observing Sys-tem
The international cooperation fostered by the IAG has led tothe establishment of the IAG Services, that provide increas-ingly valuable observations and products not only to scientistbut also for a wide range of non-scientific applications. Withthe recent developments in geodesy, Earth observations, andsocietal needs in mind, the IAG has taken the first steps towardsthe implementation of theGlobal Geodetic Observing System(GGOS). Initially, GGOS was created as an IAG Project dur-ing the IUGG meeting in 2003 in Sapporo, Japan. After thefirst two years devoted to the definition of the internal organi-zational structure of GGOS and its relationship with externalorganizations, the Executive Committee of the IAG at its meet-
ings in August 2005 in Cairns, Australia, decided to continuethe Project and the implementation phase. Finally, at the IUGGmeeting in 2007 in Perugia, Italia, IAG elevated GGOS to thestatus of a full component of IAG and progressed it into thepermanent observing system of IAG.
GGOS as an organization is being built on the existingIAG Services as a unifying umbrella. Figure 2 shows the cur-rent organizational structure of GGOS with its Committees,Panels and Working Groups, the links to the IAG Services andCommissions, regional organizations, and to the outside world,in particular, the large international programs like theGroup onEarth Observation(GEO) which is implementing theGlobalEarth Observation System of Systems(GEOSS), and the rel-evant United Nations programs (see Chapter 5 for more de-tails on these programs). GGOS provides the links betweenthe IAG Services and the main programs in Earth observationsand Earth science. It constitues a unique interface for many(although not all) users to the geodetic services. GGOS addsto a new quality and dimension in the context of Earth sys-tem research by combining the geodetic techniques into oneobserving system having utmost accuracy and operating in awell-defined and reproducible global terrestrial frame. The ob-serving system, in order to meet its objectives, has to combinethe highest measurement precision with spatial and temporalconsistency and stability that is maintained over decades.Theresearch needed to achieve these goals will influence the agendaof the IAG Commissions and the GGOS Working Groups.
According to the IAG By-Laws, GGOSworks with theIAG Services and Commissions to provide the geodetic infras-tructure necessary for the monitoring of the Earth system andglobal change research.This statement implies a vision anda mission for GGOS. The implicit vision for GGOS is to em-power Earth science to extend our knowledge and understand-ing of the Earth system processes, to monitor ongoing changes,and to increase our capability to predict the future behavior ofthe Earth system. Likewise, the embedded mission is to fa-cilitate networking among the IAG Services and Commissionsand other stakeholders in the Earth science and Earth Obser-vation communities, to provide scientific advice and coordina-tion that will enable the IAG Services to develop products withhigher accuracy and consistency meeting the requirements ofparticularly global change research, and to improve the acces-sibility of geodetic observations and products for a wide rangeof users. The IAG Services, upon which GGOS is built, ben-efit from GGOS as a framework for communication, coordi-nation, and scientific advice necessary to develop improvedornew products with increased accuracy, consistency, resolution,and stability. IAG benefits from GGOS as an agent to improvedvisibility of geodesy’s contribution to the Earth sciencesand tosociety in general. The users, including the national membersof IAG, benefit from GGOS as a single interface to the globalgeodetic observation system of systems maintained by the IAGServices not only for the access to products but also to voicetheir needs. Society benefits from GGOS as a utility supportingEarth science and global Earth observation systems as a basis
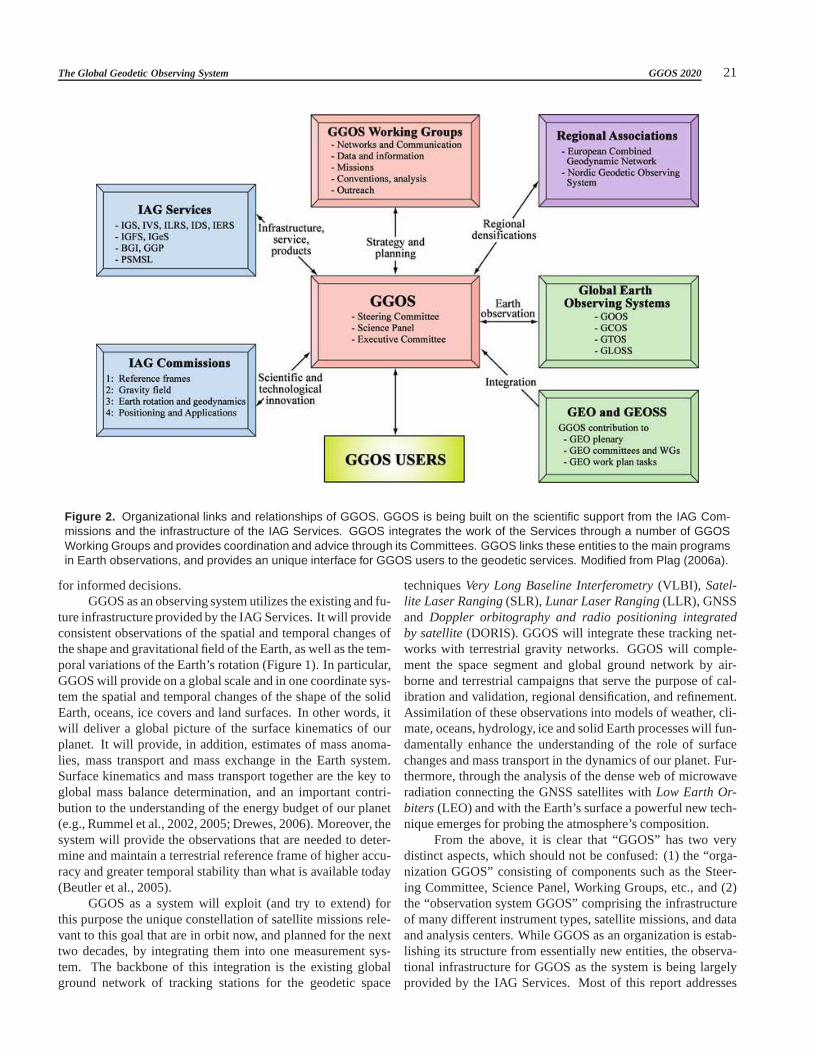
The Global Geodetic Observing System GGOS 2020 21
Figure 2. Organizational links and relationships of GGOS. GGOS is being built on the scientific support from the IAG Com-missions and the infrastructure of the IAG Services. GGOS integrates the work of the Services through a number of GGOSWorking Groups and provides coordination and advice through its Committees. GGOS links these entities to the main programsin Earth observations, and provides an unique interface for GGOS users to the geodetic services. Modified from Plag (2006a).
for informed decisions.GGOS as an observing system utilizes the existing and fu-
ture infrastructure provided by the IAG Services. It will provideconsistent observations of the spatial and temporal changes ofthe shape and gravitational field of the Earth, as well as the tem-poral variations of the Earth’s rotation (Figure 1). In particular,GGOS will provide on a global scale and in one coordinate sys-tem the spatial and temporal changes of the shape of the solidEarth, oceans, ice covers and land surfaces. In other words,itwill deliver a global picture of the surface kinematics of ourplanet. It will provide, in addition, estimates of mass anoma-lies, mass transport and mass exchange in the Earth system.Surface kinematics and mass transport together are the key toglobal mass balance determination, and an important contri-bution to the understanding of the energy budget of our planet(e.g., Rummel et al., 2002, 2005; Drewes, 2006). Moreover, thesystem will provide the observations that are needed to deter-mine and maintain a terrestrial reference frame of higher accu-racy and greater temporal stability than what is available today(Beutler et al., 2005).
GGOS as a system will exploit (and try to extend) forthis purpose the unique constellation of satellite missions rele-vant to this goal that are in orbit now, and planned for the nexttwo decades, by integrating them into one measurement sys-tem. The backbone of this integration is the existing globalground network of tracking stations for the geodetic space
techniquesVery Long Baseline Interferometry(VLBI), Satel-lite Laser Ranging(SLR),Lunar Laser Ranging(LLR), GNSSand Doppler orbitography and radio positioning integratedby satellite(DORIS). GGOS will integrate these tracking net-works with terrestrial gravity networks. GGOS will comple-ment the space segment and global ground network by air-borne and terrestrial campaigns that serve the purpose of cal-ibration and validation, regional densification, and refinement.Assimilation of these observations into models of weather,cli-mate, oceans, hydrology, ice and solid Earth processes willfun-damentally enhance the understanding of the role of surfacechanges and mass transport in the dynamics of our planet. Fur-thermore, through the analysis of the dense web of microwaveradiation connecting the GNSS satellites withLow Earth Or-biters(LEO) and with the Earth’s surface a powerful new tech-nique emerges for probing the atmosphere’s composition.
From the above, it is clear that “GGOS” has two verydistinct aspects, which should not be confused: (1) the “orga-nization GGOS” consisting of components such as the Steer-ing Committee, Science Panel, Working Groups, etc., and (2)the “observation system GGOS” comprising the infrastructureof many different instrument types, satellite missions, and dataand analysis centers. While GGOS as an organization is estab-lishing its structure from essentially new entities, the observa-tional infrastructure for GGOS as the system is being largelyprovided by the IAG Services. Most of this report addresses
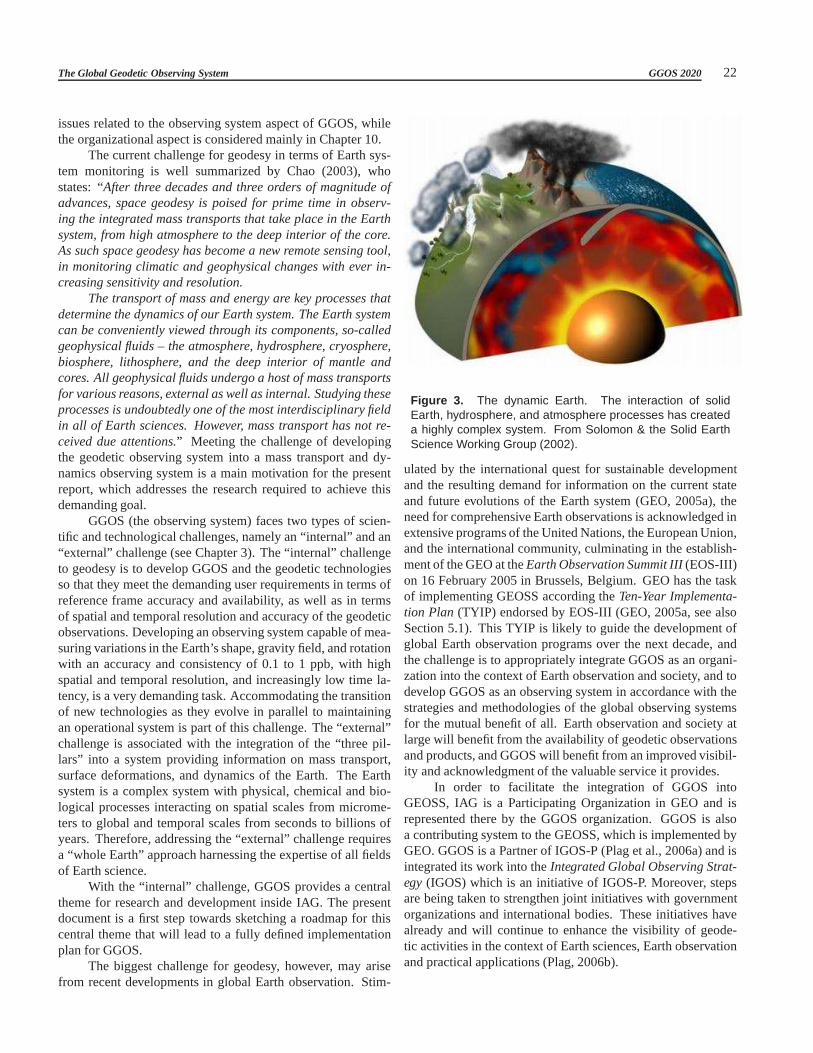
The Global Geodetic Observing System GGOS 2020 22
issues related to the observing system aspect of GGOS, whilethe organizational aspect is considered mainly in Chapter 10.
The current challenge for geodesy in terms of Earth sys-tem monitoring is well summarized by Chao (2003), whostates: “After three decades and three orders of magnitude ofadvances, space geodesy is poised for prime time in observ-ing the integrated mass transports that take place in the Earthsystem, from high atmosphere to the deep interior of the core.As such space geodesy has become a new remote sensing tool,in monitoring climatic and geophysical changes with ever in-creasing sensitivity and resolution.
The transport of mass and energy are key processes thatdetermine the dynamics of our Earth system. The Earth systemcan be conveniently viewed through its components, so-calledgeophysical fluids – the atmosphere, hydrosphere, cryosphere,biosphere, lithosphere, and the deep interior of mantle andcores. All geophysical fluids undergo a host of mass transportsfor various reasons, external as well as internal. Studyingtheseprocesses is undoubtedly one of the most interdisciplinaryfieldin all of Earth sciences. However, mass transport has not re-ceived due attentions.” Meeting the challenge of developingthe geodetic observing system into a mass transport and dy-namics observing system is a main motivation for the presentreport, which addresses the research required to achieve thisdemanding goal.
GGOS (the observing system) faces two types of scien-tific and technological challenges, namely an “internal” and an“external” challenge (see Chapter 3). The “internal” challengeto geodesy is to develop GGOS and the geodetic technologiesso that they meet the demanding user requirements in terms ofreference frame accuracy and availability, as well as in termsof spatial and temporal resolution and accuracy of the geodeticobservations. Developing an observing system capable of mea-suring variations in the Earth’s shape, gravity field, and rotationwith an accuracy and consistency of 0.1 to 1 ppb, with highspatial and temporal resolution, and increasingly low timela-tency, is a very demanding task. Accommodating the transitionof new technologies as they evolve in parallel to maintainingan operational system is part of this challenge. The “external”challenge is associated with the integration of the “three pil-lars” into a system providing information on mass transport,surface deformations, and dynamics of the Earth. The Earthsystem is a complex system with physical, chemical and bio-logical processes interacting on spatial scales from microme-ters to global and temporal scales from seconds to billions ofyears. Therefore, addressing the “external” challenge requiresa “whole Earth” approach harnessing the expertise of all fieldsof Earth science.
With the “internal” challenge, GGOS provides a centraltheme for research and development inside IAG. The presentdocument is a first step towards sketching a roadmap for thiscentral theme that will lead to a fully defined implementationplan for GGOS.
The biggest challenge for geodesy, however, may arisefrom recent developments in global Earth observation. Stim-
Figure 3. The dynamic Earth. The interaction of solidEarth, hydrosphere, and atmosphere processes has createda highly complex system. From Solomon & the Solid EarthScience Working Group (2002).
ulated by the international quest for sustainable developmentand the resulting demand for information on the current stateand future evolutions of the Earth system (GEO, 2005a), theneed for comprehensive Earth observations is acknowledgedinextensive programs of the United Nations, the European Union,and the international community, culminating in the establish-ment of the GEO at theEarth Observation Summit III(EOS-III)on 16 February 2005 in Brussels, Belgium. GEO has the taskof implementing GEOSS according theTen-Year Implementa-tion Plan (TYIP) endorsed by EOS-III (GEO, 2005a, see alsoSection 5.1). This TYIP is likely to guide the development ofglobal Earth observation programs over the next decade, andthe challenge is to appropriately integrate GGOS as an organi-zation into the context of Earth observation and society, and todevelop GGOS as an observing system in accordance with thestrategies and methodologies of the global observing systemsfor the mutual benefit of all. Earth observation and society atlarge will benefit from the availability of geodetic observationsand products, and GGOS will benefit from an improved visibil-ity and acknowledgment of the valuable service it provides.
In order to facilitate the integration of GGOS intoGEOSS, IAG is a Participating Organization in GEO and isrepresented there by the GGOS organization. GGOS is alsoa contributing system to the GEOSS, which is implemented byGEO. GGOS is a Partner of IGOS-P (Plag et al., 2006a) and isintegrated its work into theIntegrated Global Observing Strat-egy(IGOS) which is an initiative of IGOS-P. Moreover, stepsare being taken to strengthen joint initiatives with governmentorganizations and international bodies. These initiatives havealready and will continue to enhance the visibility of geode-tic activities in the context of Earth sciences, Earth observationand practical applications (Plag, 2006b).
The Global Geodetic Observing System GGOS 2020 23
1.4 The strategy: where to go from now
Identifying theUser Requirements(UR) for the observationsand products of geodesy in a wide range of scientific and soci-etal applications is an important prerequisite for defininga setof functional specifications of a geodetic observing systemthatwould be able to meet these URs (or at least a significant subsetof these). Compiling a comprehensive set of URs for geode-tic observations and products and deriving functional specifica-tions for a global geodetic observing system is one of the twomajor goals of this report. The other goal is to specify, basedon the functional requirements, the system design of a futureGGOS and to define the steps towards the implementation ofthis GGOS.
In Chapter 2 we first give an introduction to the “ways andmeans of geodesy” in general, and global geodesy in particular.Emphasis is on the introduction of modern geodetic techniquesand methods, but the achievements and current contributionsare briefly reported. This Chapter sets the stage for what iscurrently available and achievable.
Chapters 3 to 6 review the URs for geodetic observation,products, and services for scientific investigations, monitoringthe Earth system, maintaining a modern society, and exploringthe planets and the solar system, respectively. In Chapter 3,the open scientific questions concerning the solid Earth, atmo-sphere, hydrosphere, and cryosphere and their interactions arereviewed with emphasis on how geodetic observations couldcontribute to providing answers to these fundamental questions.Chapter 4 looks at the many activities in a modern society thatdepend on or benefit from geodetic observations and products,such as navigation, surveying, mapping, construction, processcontrol, and outdoor activities, and discusses the URs particu-larly in terms of access to coordinates in a well-defined and wellmaintained reference frame. Chapter 5 starts with the require-ments of the key societal benefit areas of Earth observation (seeTable 7 in Chapter 5 on page 97) as identified by theEarth Ob-servation Summit II(EOS-II) as listed in the Reference docu-ment for the Ten-Year Implementation Plan for GEOSS (GEO,2005b). These essentially qualitative URs are then furtherde-veloped into a set of quantitative URs. Geodesy is not onlyessential for many applications on Earth but it also providesthe basis for studying and exploring the planets and the solarsystem. These respective URs are addressed in Chapter 6.
In Chapter 7 the results of the previous chapters are usedto compile a comprehensive set of quantitative URs linking thedifferent requirements to applications and users. Based onthisset, functional specifications for an observing system are given.
Two global geodetic references systems, one rotating withthe solid Earth, and the other one fixed in space, are fundamen-tal concepts for geodetic theories, models and observations, andtheir realization through corresponding reference framesis akey task of global geodetic activities. Both the reference sys-tems and the frames are governed by conventions not only con-cerning the axes and origin of the reference system but also theobservations, constants, analysis methods, and models used intheir realization. Chapter 8 reviews the current approach and
develops it further so that the future reference frame will meetthe URs introduced in the previous chapters.
Chapter 9 addresses the design of GGOS that is requiredin order to develop it into a system that is able to meet thefunctional specifications set out in Chapter 7. In this chapter,use is made of the full set of available techniques includinga consideration of the ground-based, airborne and spacebornecomponents.
The current GGOS is based on the voluntary commitmentof many contributing countries, organizations, institutions andindividuals. This situation leads to large fluctuations in avail-able resources and therefore requires a high degree of redun-dancy in order to ensure a sufficient geodetic infrastructure.This infrastructure is central to the provision of a referenceframe meeting the requirements of both scientific and non-scientific applications as well as for the contribution to inter-national programs and activities directed towards global Earthobservation. Chapter 10 therefore describes steps necessary forthe implementation of the system defined in Chapter 9 takinginto account the available infrastructure as well as the currentorganizational and funding situation. With respect to the or-ganizational background, the Chapter considers alternative ap-proaches, including a more intergovernmental one.
Finally, Chapter 11 provides recommendations for the de-velopment of GGOS, the implementation of its proposed com-ponents, and its future organization. Recommendations aregiven for improving the framework conditions, the infrastruc-ture, the products, and the organizational background for globalgeodesy as a multi-national endeavor.
A number of definitions of terms used in geodesy withspecific meanings are collected in Appendix B. A list ofacronyms is provided in Appendix C.

The Global Geodetic Observing System GGOS 2020 24
2 The goals, achievements, and tools ofmodern geodesy
H.-P. Plag, Z. Altamimi, S. Bettadpur, G. Beutler, G. Beyerle,A. Cazenave, D. Crossley, A. Donnellan, R. Forsberg, R. Gross,J. Hinderer, A. Komjathy, A. J. Mannucci, C. Ma, C. Noll, A.Nothnagel, E. C. Pavlis, M. Pearlman, P. Poli, U. Schreiber,K.Senior, P. Woodworth, S. Zerbini, C. Zuffada
2.1 Introduction
Friedrich Robert Helmert (1843-1917) defined geodesy as thescience “of measurements and mappings of the Earth’s sur-face”. Over time, this definition of geodesy has been extended,mainly as a consequence of technological developments allow-ing geodesy to observe the Earth on global scales with high ac-curacy. Today, geodesy is the science of determining the geom-etry, gravity field, and rotation of the Earth and their evolutionin time. This understanding of modern geodesy has led to thedefinition of the three pillars of geodesy, namely (1) Geokine-matics, (2) Earth Rotation and (3) the Gravity Field (see Fig-ure 1 on page 18). These three pillars are intrinsically linked toeach other, and they jointly change as a consequence of dynam-ical processes in the Earth system as a whole. The changes inEarth’s shape (including the surface of the water and ice bod-ies), i.e. the geokinematics, are the result of dynamic processesin the solid Earth and its fluid envelop, affecting mass distri-bution and angular momentum, and thus changing the gravityfield and Earth rotation.
Traditionally, geodesy has been a service science, pro-viding an important utility to other sciences and many appli-cations. This aspect has remained unchanged, and a principaltool and output of geodesy is a reference frame allowing thedetermination of the position of points relative to each other.But geodesy has developed into a science that can no longersatisfy this service aspect without encompassing and monitor-ing the whole Earth system, its kinematic and dynamics. Asan additional benefit, geodesy is increasingly forced not onlyto “measure” the geokinematics, gravity field, and rotation, butalso to “model” these quantities on the basis of mass transportand dynamics.
The instruments (or measurement tools) are of crucial im-portance in geodesy. They in essence define the scope of theproblems, which may be addressed by geodesy. Before theadvent of the space age the geometrical aspects were studiedmainly by measuring angles and time (time-tagging of the ob-servations). In the best case, angles were measured with sub-arcsecond accuracy, and time with an accuracy of a few mi-croseconds. The angles define a unit vector from the observerto the observed object (a terrestrial target or a celestial objectsuch as stars, the Moon, etc.) at particular epochs. When ob-serving celestial objects, the classical observation technique iscalled astrometry. For time measurement one made the dis-
tinction between theastronomical clocks(defined, for example,by Earth rotation or, alternatively, by the motion of the Moonand/or planets) and the man-made mechanical clocks. Accu-racy and long-term stability of the astronomical clocks couldnever be reached by mechanical clocks. They were, however,of crucial importance for solving practical problems in naviga-tion (like the problem of determining the longitude at sea orthe longitude difference between sites on different continents)and, of course, for interpolating the astronomical time. Gravitywas studied by measuring the zenith (actually nadir) direction(i.e., the unit vector along which gravity acts) in a well-definedgeometric reference frame and/or by measuring the absolutevalue of the gravity vector. Both measurement types are heav-ily affected by the mass distribution in the environment of themeasuring instruments, which makes the interpretation of theircontribution to global gravity field determination problematic.
The advent of the space age (marked by the launch of thefirst artificial Earth satellite on October 4, 1957) togetherwiththe development of atomic clocks (first realized by crystal os-cillators in the 1950s, then by atomic clocks like, for example,the hydrogen masers) to precisely measure epochs and time in-tervals initiated an extremely rapid development of novel ob-servation techniques and, associated with that, scientificoppor-tunities, which revolutionized the entire field of geodesy.Itbecame in particular possible to
1. connect different continents by simultaneously observinghigh orbiting, bright satellites from sites located on differ-ent continents using astrometry;
2. measure distances through the measurement of the prop-agation time of short light pulses between an observatoryon the Earth’s surface and an artificial Earth satellite;
3. exploit the signals emitted by stable oscillators onboardnavigation satellites and recorded by receivers on theEarth surface or in the near-Earth space to determine thetime development of the distance between the satelliteemitting the signal and the receiver(s) recording it;
4. correlate the signals emitted by Quasars (radio galaxies“at rest” in the inertial space) and received by two radiotelescopes to establish the distance difference between thetelescopes, as seen from the Quasars at the measurementepochs;
5. use the trajectories of artificial Earth satellites to deter-mine the Earth’s gravity field;
6. use atomic time to study the rotation of the Earth and themotion and rotation of other objects in our planetary sys-tem.
The first of the above items initiated the concept of modern ter-restrial reference systems and frames, with the frames beingthe realization of the systems. Items 2-4 represent ”new” ob-servation techniques, which in essence ruled out astrometry and
The Global Geodetic Observing System GGOS 2020 25
replaced it by the measurement of distances or distance differ-ences. A somewhat simplistic order of magnitude calculationshows that this step resulted in a gain in accuracy of about 2-3orders of magnitude: A typical error of 0.1”-1.0” in the astro-metric position implies a tangential error at a typical distance of1000 km to a satellite of about 0.5-5 m, whereas the new obser-vation techniques typically measure distances with accuraciesof about 1-5 mm. This gain gives access to a whole suite of newproblems, which can now be addressed by modern geodesy.Items 1 to 3 are so-called satellite-geodetic techniques. Items 1to 4 are also referred to as space-geodetic techniques.
Item 5 allows us to study the Earth’s global gravity fieldin detail. By modeling the satellite orbits as solutions of theequations of motion, which contain the parameters describingthe Earth’s gravity field, and by using the satellite geodetic ob-servations in particular of the Laser satellites, and, morere-cently, of Low Earth Orbiters(LEOs) equipped with GNSSreceivers, it became possible to determine the Earth’s globalgravity field already before the end of the20th century in as-tonishing detail. A quantum jump in accuracy and resolutionis being achieved with the suite of dedicated space missionsChallenging Minisatellite Payload(CHAMP), Gravity Recov-ery and Climate Experiment(GRACE), andGravity field andsteady-state Ocean Circulation Explorer(GOCE), which havebeen or will be (GOCE) deployed in the first decade of the21st
century.Item 6 marks an important change of paradigm in geodesy
and fundamental astronomy: Instead of using the Earth rota-tion and lunar/planetary motion to define and realize time, inparticularUniversal Time(UT), it is now possible to study theEarth’s rotation and planetary motion as a function of atomictime (or Coordinated Universial Time, UTC), which is todayderived uniquely from atomic time). This aspect is of partic-ular importance for the problems associated with the secondpillar of modern geodesy, namely the study and monitoring ofEarth rotation.
In accordance with the development of measuring tech-niques, the concepts of the Earth changed, influenced by bothgeodetic observations and a better understanding of the Earthsystem and its main processes. For a long time, geodetic con-cepts were based on a static view of the solid Earth, and ter-restrial reference frames were based on fixed coordinates ofpoints on the Earth’s surface. Over the last five decades, thedevelopment in our understanding of the solid Earth and thetotal Earth system has made it clear that the solid Earth’s sur-face undergoes continuous deformations, changing the relativeposition of all points on a wide range of time scales. The in-vention and rapid improvement of the space-geodetic technolo-gies have provided a wealth of observations documenting thesurface deformations, irregularities in the Earth’s movement inspace and the extent of mass movements in the Earth’s sys-tem. At the same time, scientific and societal applications poseincreasing requirements on the accuracy and reliability ofposi-tioning as well as navigation. A detailed review of requirementsfor geodetic observations and products in Earth observations,
scientific studies, and societal applications (see Chapters 3 to7) demonstrates that in terms of precise point positioning,therequirements are on the order of centimeter for real-time orlow-latency application, 1 cm or better on daily time scales,a few mm/yr for intraseasonal time scales, and of the order of0.1 mm/yr on interannual to secular time scales. Thus, rela-tive to the size of the Earth, a general accuracy requirementforgeodetic observations and products of the order of10−9 or lesscan be stated.
Considering the characteristics of the spatio-temporalvariations in Earth’s shape, rotation and gravity field, thetaskto establish a reference frame with an accuracy at or below the1 ppb level is a demanding and scientifically challenging en-deavor. The Earth’s surface is constantly deformed by inter-nal and external processes including earthquakes, Earth tides,surface loading (present and past) caused by the atmosphere,hydrosphere, and cryosphere, sediment loading, and mantleconvection. All these processes have to be accounted for ata level well below the targeted accuracy of 1 ppb. This requiresgeodesy to interact with other geosciences and to take an Earthsystem approach, which considers the effects of external forc-ing, atmosphere, ocean, terrestrial hydrosphere, and cryosphereon the solid Earth. Consequently, the realization and mainte-nance of reliable reference frames on local, regional and globalscales as well as the provision of techniques for high-precisionpositioning has received growing attention within geodesyandin Earth science in general.
Considering the importance of the geodetic referenceframes, in Section 2.2, the concepts for reference systems andtheir realization through reference frames is introduced and thetwo main geodetic reference systems are described. This setsthe stage for a more detailed discussion of the three pillarsofgeodesy and their interrelations in Section 2.3 and the currentstate-of-art of the observing system in each of the three pil-lars in the Sections 2.4 to 2.5, respectively. Subsequently, Sec-tion 2.7 addresses a central issue for geodesy, that is access toaccurate time. Section 2.8 briefly describes measures takentoensure consistency between the geodetic observations and iden-tifies key open questions. Finally, Section 2.9 introduces aux-iliary applications of geodetic and related observations,whichincreasingly are developed adding a multi-application aspect togeodesy and opening new fields of research.
2.2 Geodetic reference systems and frames
As pointed out earlier in this document, a principal goal ofgeodesy is to provide the means to assign coordinates to pointsas a function of time. Position and movement are not absolutequantities and depend on the reference frame to which they arereferred. In particular, observations of any celestial body, be itnatural or artificial, or of a point in the Earth system, can beused to describe the motion of this body only if the observa-tions can be referred to a well defined coordinate system. Inan ideal world, such a system could be defined through threecoordinate axes, the origin, and a scale, with the axis either be-

The Global Geodetic Observing System GGOS 2020 26
ing fixed in space or having a known movement with respectto something else that is fixed. In the real world, the provisionof an accessible coordinate system requires far more definition,which comprises a reference system.
In the context of space geodesy, making use of naturaland artificial celestial objects, there is a need for both theCe-lestial Reference System(CRS) and aTerrestrial Reference Sys-tem(TRS). The CRS, which is fixed in space, is required to de-scribe the motions of galaxies, stars, the sun, planets includingthe Earth itself, the Moon and the satellites of other planets,and artificial satellites. Observations of points on the Earth’ssurface or related to the Earth’s surface are often easier tore-late to movements of these points if they are referred to a TRSwith axes fixed in some way to the solid Earth and moving withthe Earth in space.
It is of obvious practical advantage to agree upon one def-inition for each of the celestial and terrestrial referencesystems.This has led to the adoption of conventional celestial and ter-restrial reference systems (CCRS and CTRS, respectively).Aconventional reference system includes the specification of theorigin, the direction of the axes (orientation in space), and thescale of the system in an appropriate way. However, more isneeded in order to complete the system such as conventions onphysical constants.
Another issue is to gain access to such a reference system.Modern conventional celestial and terrestrial reference systemsin fact are realized through coordinates of a set of points andobjects determined from observations analyzed with appropri-ate mathematical and physical models. Such a realization ofareference system is denoted as reference frame. In practice, therealization of a reference system through such a frame requirescontinuous monitoring of the points or objects. Given the na-ture of the problem, any realization also requires the specifica-tion of additional boundary conditions that the reference frameshould fulfill. Moreover, models used to analyze the observa-tions and to correct for disturbances in the coordinates of thepoints and objects are an integral part of the realization, andtherefore have to be included in the convention specifying thereference system and its realization through a frame.
It is not always clear whether the boundary conditionsand models are considered as part of the conventional referencesystem, part of the reference frame realizing the system or thesubject of an additional convention. There is certainly a trade-off between the completeness of the conventions specifyingthereference system and the need to change the reference systemwhen models or constants improve.
Figure 4 gives an overview illustrating the conventionalreference systems and their realizations presently adopted bythe relevant international scientific unions. The two fundamen-tal systems accepted by the relevant international scientific bod-ies are theInternational Celestial Reference System(ICRS) andthe International Terrestrial Reference System(ITRF), whichare realized by IERS through theInternational Celestial Refer-ence Frame(ICRF) and theInternational Terrestrial ReferenceFrame(ITRF), respectively. The IERS is a Service under the
CCRS
?
ICRS
? ?
VLBI
?
ICRF
HIPPARCOS
?
HIPPARCOS
CTRS
?
ITRS
?
VLBI, SLR, GPS,DORIS, LLR, ...
?
ITRF- IERS EOP
Figure 4. Overview of current conventional reference sys-tems and their realizations. The current Conventional Celes-tial Reference Systems (CCRS) adopted by the IAU is the In-ternational Celestial Reference System (ICRS). In the radio-wavelength, this system is realized as ICRF through VLBImeasurements of extragalactical objects and as such main-tained by the IERS. At optical wavelengths, the observationsmade with the HIPPARCOS satellite allowed the material-ization of the ICRS through the HIPPARCOS stellar frame.The tie between the HIPPARCOS and the ICRS is deter-mined to a high degree of accuracy (Kovalevsky, 1997). Thecurrent Conventional Terrestrial Reference Systems (CTRS)accepted by IUGG is the International Terrestrial ReferenceSystem (ITRS), which is realized through the InternationalTerrestrial Reference Frames (ITRF) maintained by the IERS.The tie between the ICRF and ITRF is provided by the IERSEarth Orientation Parameters (EOP). These describe the ori-entation of the Celestial Ephemeris Pole (CEP) in the terres-trial and celestial systems through the polar coordinates xand y and the nutation offsets dψ and dǫ, respectively, andthe orientation of the Earth around this axis through UT1-TAIas function of time. From Plag (2006a).
joint auspice of IAG and IAU, and for the ICRF, both organiza-tions take responsibility.
These two frames are linked to each other through theEarth rotation. Today, IERS provides parameters related toEarth’s rotation under the name ofEarth Orientation Param-eters(EOP).
The ICRS is defined and maintained by the IERS. It wasadopted by the IAU and the IUGG as the primary celestial refer-ence system, replacing its optical predecessors based on funda-mental star catalogues (see Box 1). The observation and anal-ysis aspects related to the realization of the ICRS through theICRF are today coordinated by theInternational VLBI Servicefor Geodesy and Astrometry(IVS).
The ITRS is also defined and maintained by the IERS. Itis adopted by IAG and IUGG as the primary terrestrial refer-ence system, in particular, for Earth science applications. Un-like the ICRS, the realization of the ITRS through the ITRF isbased on a combination of results from several space geode-tic techniques, and local survey measurements between refer-ence points of geodetic instruments co-located at the same sites.The combination is coordinated by the IERS, while the ob-servational aspects for each individual technique involved arecoordinated by technique-specific Services. Co-location sites(where two or more instruments are operating in close vicinity),

The Global Geodetic Observing System GGOS 2020 27
Box 1: The ICRFThe ensemble of distant extragalactic objects constitutesa quasi-inertial reference frame in which the motion and orientation of the Earthcan be measured. In practice, this frame is accessed from theEarth through VLBI observations of compact radio sources, for the most partquasars. The red shifts of these quasars are large enough that their physical transverse movement cannot be detected by current radio oroptical techniques, and the objects can be treated conceptually as fixed points in the sky. The IAU recognized the utilityand accuracy ofthe extragalactic celestial reference frame by adopting the ICRF (International Celestial Reference Frame) effective 1 January 1998. ICRF-Extension.2 is a catalog of some 700 radio source positions (Fey et al., 2004). The positions and errors of the 212 ”defining” sources of theICRF define (realize) the axes and precision of the ICRS (International Celestial Reference System) on which all celestial positions are nowplaced. While the right ascension origin and pole of the ICRFare consistent with the previous FK5 stellar frame within the much larger errorsof FK5, the concept of the ICRS/ICRF is fundamentally different in several respects. The defining objects of the ICRF haveno real propermotions, and the axes of the ICRS are decoupled from the equator, the ecliptic and any particular epoch.The quasars and other compact radio sources that are included in the ICRF have point-like optical images. Their red shifts indicate greatdistances so their emissions must be powered by processes different from stars and galaxies, most probably mass inflow onto massive blackholes. At the resolution of geodetic/astrometric VLBI using S-band (2 GHz) and X-band (8 GHz), the objects are generallynot point-like buthave some structure that can also change with time. Such structure changes can be seen as changes in position up to 1 milliarcsecond. Thebrightest extragalactic radio sources in fact have too muchdetectable structure to be good astrometric objects. By balancing the competingcriteria of source strength, compactness and constancy of structure and position, a set of∼100 geodetic sources has been selected for routinegeodetic VLBI observations while the remainder of the ICRF improves the distribution and density over the sky. See Figure xx. It should benoted that the small number of VLBI stations in the Southern Hemisphere causes the ICRF to be weaker in all aspects in the southern sky. Thequasars in the ICRF emit relatively strongly at microwave frequencies while the great majority of quasars are much weaker or radio-quiet.The ICRF now constitutes the fundamental celestial frame for all astrometric and geodetic purposes. This includes bothplanetary ephemeridesand satellite orbits. The former have been related to the ICRF by specialized VLBI observations of transmitters on planets and spacecraftas well as from locations of VLBI stations. Satellite orbit determination requires accurate measurements of the actualrotation angle of theEarth UT1-UTC as a priori information since the rotation of the orbit nodes cannot be modeled over a long period. VLBI observations ofGNSS satellites should be feasible in the future as the observing bandwidth for geodetic VLBI is extended. Such observations would directlyconnect the satellite frames to the ICRF. The motion of the Earth’s axis in space, precession and nutation, is also observed using the ICRF.These measurements provide information about the structure of the Earth as it responds to the torques of the Sun, Moon andplanets.The ICRF is essential to geodesy as it is the frame for measuring EOP and the ultimate frame for satellite orbits. The ICRF is also the basisfor astrometry. In this regard the ICRF has different realizations at various wavelengths, the microwave VLBI realization being the mostaccurate at this time. The astrometric satellite GAIA is scheduled for launch in late 2011 and has the potential for generating an opticalextragalactic realization with an order of magnitude better precision and two orders of magnitude more objects. Other space missions mayrefine the positions and proper motions of the brightest stars with corresponding improvement of star tracking for satellite orientation. Formost geodetic purposes, however, these improvements will not be applicable since no correspondingly precise ground-based observing systemexists. An accurate microwave realization for geodetic VLBI will still be needed. A second realization of the VLBI ICRF making use of theimproved data and modeling since 1995 is anticipated in 2009.
are key elements in the ITRF combinations. While any indi-vidual space geodesy technique (VLBI, SLR, DORIS, GNSS)is able to provide necessary information for the ITRF, onlythe combination of the independent techniques allows for thecomplete determination of ITRF (origin, scale and orientation).In principle, the particular strengths of one observing methodcan compensate for weaknesses in others if the combination isproperly constructed, suitable weights are found, and accuratelocal ties in co-location sites are available.
The conventions for both the ITRS and ICRS and their re-alizations are detailed in the IERS Conventions (e.g., McCarthy& Petit, 2004). As accuracy requirements evolve and technicaland modeling capabilities increase, these conventions aremod-ified and developed under the auspice of IERS in a continuousprocess with support from the broad geodetic science commu-nity.
In the conventions, the motion of the reference points inITRF currently is described by a linear model, thus reducingtheinformation necessary to determine the motion of the reference
points relative to their coordinates at a reference epoch and aconstant velocity. This representation is no longer appropriateto accommodate possible future user requirements to have ac-cess to the actual instantaneous point position over the Earthsurface and new representation and models are being discussed(see Chapter 8).
The coordinates and constant velocities of the points thatdefine a particular reference frame depend on the points, tech-niques, models, and analysis tools used in the determinationof these quantities. Therefore, for any given reference system,there can be a multitude of reference frames realizing the sys-tem at various degrees of accuracy. For global terrestrial ref-erence frames, the ITRS is increasingly used as the underlyingsystem, thus gaining importance for practical applications. Forexample, the U.S. Government and the European Commissionagreed to align the reference frames of theGlobal PositioningSystem(GPS) and Galileo as close as possible to ITRS (Euro-pean Commission, 2004). In practice, this goal is achieved byaligning the GNSS reference frames to the ITRF, which is the
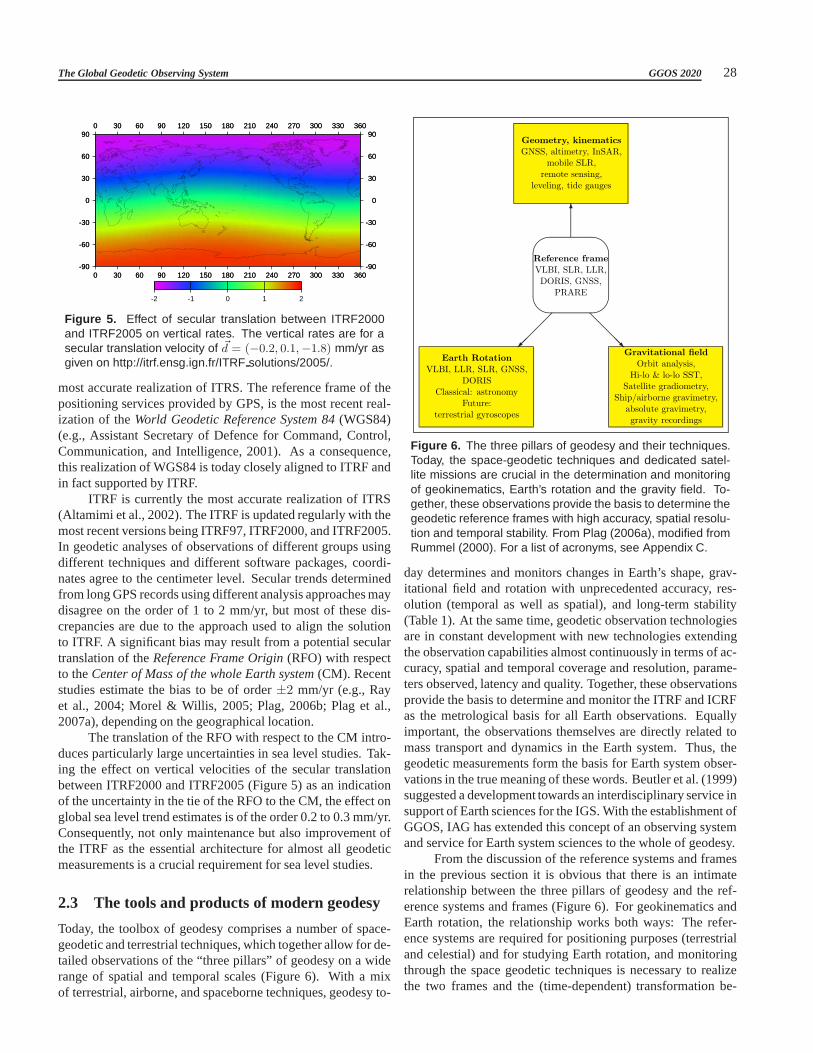
The Global Geodetic Observing System GGOS 2020 28
-90
-60
-30
0
30
60
90
-90
-60
-30
0
30
60
90
0 30 60 90 120 150 180 210 240 270 300 330 360
0 30 60 90 120 150 180 210 240 270 300 330 360
-90
-60
-30
0
30
60
90
-90
-60
-30
0
30
60
90
0 30 60 90 120 150 180 210 240 270 300 330 360
0 30 60 90 120 150 180 210 240 270 300 330 360
-2 -1 0 1 2
Figure 5. Effect of secular translation between ITRF2000and ITRF2005 on vertical rates. The vertical rates are for asecular translation velocity of ~d = (−0.2, 0.1,−1.8) mm/yr asgiven on http://itrf.ensg.ign.fr/ITRF solutions/2005/.
most accurate realization of ITRS. The reference frame of thepositioning services provided by GPS, is the most recent real-ization of theWorld Geodetic Reference System 84(WGS84)(e.g., Assistant Secretary of Defence for Command, Control,Communication, and Intelligence, 2001). As a consequence,this realization of WGS84 is today closely aligned to ITRF andin fact supported by ITRF.
ITRF is currently the most accurate realization of ITRS(Altamimi et al., 2002). The ITRF is updated regularly with themost recent versions being ITRF97, ITRF2000, and ITRF2005.In geodetic analyses of observations of different groups usingdifferent techniques and different software packages, coordi-nates agree to the centimeter level. Secular trends determinedfrom long GPS records using different analysis approaches maydisagree on the order of 1 to 2 mm/yr, but most of these dis-crepancies are due to the approach used to align the solutionto ITRF. A significant bias may result from a potential seculartranslation of theReference Frame Origin(RFO) with respectto theCenter of Mass of the whole Earth system(CM). Recentstudies estimate the bias to be of order±2 mm/yr (e.g., Rayet al., 2004; Morel & Willis, 2005; Plag, 2006b; Plag et al.,2007a), depending on the geographical location.
The translation of the RFO with respect to the CM intro-duces particularly large uncertainties in sea level studies. Tak-ing the effect on vertical velocities of the secular translationbetween ITRF2000 and ITRF2005 (Figure 5) as an indicationof the uncertainty in the tie of the RFO to the CM, the effect onglobal sea level trend estimates is of the order 0.2 to 0.3 mm/yr.Consequently, not only maintenance but also improvement ofthe ITRF as the essential architecture for almost all geodeticmeasurements is a crucial requirement for sea level studies.
2.3 The tools and products of modern geodesy
Today, the toolbox of geodesy comprises a number of space-geodetic and terrestrial techniques, which together allowfor de-tailed observations of the “three pillars” of geodesy on a widerange of spatial and temporal scales (Figure 6). With a mixof terrestrial, airborne, and spaceborne techniques, geodesy to-
Earth Rotation
VLBI, LLR, SLR, GNSS,DORIS
Classical: astronomyFuture:
terrestrial gyroscopes
Gravitational field
Orbit analysis,Hi-lo & lo-lo SST,
Satellite gradiometry,Ship/airborne gravimetry,
absolute gravimetry,gravity recordings
Reference frame
VLBI, SLR, LLR,DORIS, GNSS,
PRARE
'
&
$
%
Geometry, kinematics
GNSS, altimetry, InSAR,mobile SLR,
remote sensing,leveling, tide gauges
@@
@@@R
6
Figure 6. The three pillars of geodesy and their techniques.Today, the space-geodetic techniques and dedicated satel-lite missions are crucial in the determination and monitoringof geokinematics, Earth’s rotation and the gravity field. To-gether, these observations provide the basis to determine thegeodetic reference frames with high accuracy, spatial resolu-tion and temporal stability. From Plag (2006a), modified fromRummel (2000). For a list of acronyms, see Appendix C.
day determines and monitors changes in Earth’s shape, grav-itational field and rotation with unprecedented accuracy, res-olution (temporal as well as spatial), and long-term stability(Table 1). At the same time, geodetic observation technologiesare in constant development with new technologies extendingthe observation capabilities almost continuously in termsof ac-curacy, spatial and temporal coverage and resolution, parame-ters observed, latency and quality. Together, these observationsprovide the basis to determine and monitor the ITRF and ICRFas the metrological basis for all Earth observations. Equallyimportant, the observations themselves are directly related tomass transport and dynamics in the Earth system. Thus, thegeodetic measurements form the basis for Earth system obser-vations in the true meaning of these words. Beutler et al. (1999)suggested a development towards an interdisciplinary service insupport of Earth sciences for the IGS. With the establishment ofGGOS, IAG has extended this concept of an observing systemand service for Earth system sciences to the whole of geodesy.
From the discussion of the reference systems and framesin the previous section it is obvious that there is an intimaterelationship between the three pillars of geodesy and the ref-erence systems and frames (Figure 6). For geokinematics andEarth rotation, the relationship works both ways: The refer-ence systems are required for positioning purposes (terrestrialand celestial) and for studying Earth rotation, and monitoringthrough the space geodetic techniques is necessary to realizethe two frames and the (time-dependent) transformation be-

The Global Geodetic Observing System GGOS 2020 29
Table 1. The Global Geodetic Observing System (GGOS). For acronyms, see the list in Appendix C.
Component Objective Techniques Responsible
I. Geokinematics (size,shape, kinematics, de-formation)
Shape and temporal variations ofland/ice/ocean surface (plates, intra-plates, volcanos, earthquakes, glaciers,ocean variability, sea level)
altimetry, InSAR, GNSS-cluster, VLBI, SLR, DORIS,imaging techniques, leveling,tide gauges
International and nationalprojects, space missions, IGS,IAS, future InSAR service
II. Earth Rotation (nu-tation, precession, po-lar motion, variations inLOD)
Integrated effect of changes in angu-lar momentum (mass changes in atmo-sphere, cryosphere, oceans, solid Earth,core/mantle; momentum exchange be-tween Earth system components)
classical astronomy, VLBI,LLR, SLR, GNSS, DORIS,under development: terrestrialgyroscopes
International geodetic and as-tronomical community (IERS,IGS, IVS, ILRS, IDS)
III. Gravity field Geoid, Earth’s static gravitational po-tential, temporal variations induced bysolid Earth processes and mass trans-port in the global water cycle.
Terrestrial gravimetry (absoluteand relative), airborne gravime-try, satellite orbits, dedicatedsatellite missions (CHAMP,GRACE, GOCE)
International geophysical andgeodetic community (GGP,IGFS, IGeS, BGI)
IV. Terrestrial Frame Global cluster of fiducial point, deter-mined at mm to cm level
VLBI, GNSS, SLR, LLR,DORIS, time keeping/transferabsolute gravimetry, gravityrecording
International geodetic commu-nity (IERS with support of IVS,ILRS, IGS, and IDS)
tween them.The ICRF, the ITRF, and the EOPs are needed to derive
a gravity field, which is consistent with the ICRF, the ITRF,and the corresponding EOPs. Therefore, one might think atfirst that the gravity field is not necessary to define and realizethe geometric reference systems. However, in order to real-ize the ITRF, observations made by the satellite geodetic tech-niques (SLR, GNSS, DORIS) are needed. For these techniques,a gravitational reference system and frame (including a grav-ity field representation and the parameters associated withit,and the geoid, the mean equipotential surface “near sea level”,which may be derived from the gravity field representation) isrequired as well and cannot be separately determined from thegeometrical frames. The problems are obviously inseparablewhen dealing with the definition in the geometry and gravitydomains (origin, orientation, scale of the geometric networks,low degree and order terms of the Earth’s gravity field).
This consistency between geometric and gravitationalproducts is important today, it will be of greatest relevancein the future for the understanding of the mass transport andthe exchange of angular momentum between the Earth’s con-stituents, in particular between solid Earth, atmosphere,andoceans. The aspect of consistency is also of greatest importancefor all studies related to global change, sea level variation, andto the monitoring of ocean currents. Only if consistency on the10−9 level or better between all reference frames it achieved,will it be possible to perform meaningful research in the areasmentioned.
In the narrowest possible sense, geodesy has the tasks todefine the geometric and gravitational reference systems, andto establish the celestial, terrestrial, and gravitational referenceframes. Moreover geodesy has to provide the transformationbetween the terrestrial and celestial reference frames. These
key tasks would be relatively simple to accomplish on a rigidEarth without hydrosphere and atmosphere. However, in thereal Earth environment already the definition of the terrestrialand gravitational reference systems is a challenge. The corre-sponding reference frames can only be established by perma-nent monitoring based on a polyhedron of terrestrial geodeticobserving sites, and of space missions.
This ambitious and expensive geodetic monitoring is nec-essary and its result, properly time-tagged and mutually con-sistent, is a stringent requirement in a broad field of scientificand societal applications. There is strong science justificationfor these geodetic products as a prerequisite (see Chapter 3).Also, some tasks of societal relevance may only be addressedif this permanent geodetic monitoring is available (see Chap-ter 4), and monitoring of the Earth system, including for ex-ample sea level and ice sheet variations, would not be possiblewithout it (see Chapter 5).
The following three sections give an overview of the cur-rent status of the global geodetic observing system relevant tothe three pillars. Many (but not all) items or activities, whichwill be mentioned in these section below, are coordinated byentities working under the auspices of IAG. IAG has been in the“monitoring business” since the late19th century, when theIn-ternational Latitude Service(ILS) was created to monitor polarmotion. More recently the IAG created technique-specific Ser-vices to coordinate observation and analysis for the new spacegeodetic techniques. Also, on the level of IUGG and IAU theIERS was given the charter mentioned above and is coordinat-ing related activities. These Services, which will be mentionedbelow, are important building blocks of the GGOS.

The Global Geodetic Observing System GGOS 2020 30
2.4 Observing Earth geometry and kinematic
2.4.1 Overview
Changes in the Earth’s shape are measured with a mix ofground- and space-based techniques. These techniques can beseparated into two broad classes:
(1) space-geodetic tracking techniques that monitor the defor-mation of a polyhedron (points) defined by ground-basednetworks of tracking stations which either passively utilizesignals from satellites (GNSS) or stellar objects (VBLI) oractively send out signals to satellites (SLR and DORIS);and
(2) air- or spaceborne remote sensing techniques that send sig-nals from airplanes or satellites to the Earth’s surface andutilize the reflections to map the surface.
The space-geodetic tracking methods provide time series ofpoint movements with high temporal resolution and high accu-racy. Tracking stations are normally placed on the land surface.Remote-sensing techniques in general have much lower tem-poral resolution but provide information with potentiallyhighspatial resolution and much better coverage, including thesur-face of oceans, lakes, and ice sheets. Beside altimeters, theremote-sensing techniques also include the imaging techniques(such as InSAR and LIDAR), which provide high-resolutionimages of a surface and its temporal changes.
2.4.2 Space-geodetic tracking techniques
The geometric space-geodetic techniques in general consist of aground-based component of fixed stations from which the mo-tion of satellites or astronomical objects (moon, quasars)aretracked with electromagnetic waves (including visible light).These stations can be passive in the sense that they do not emitsignals but “only” receive signals from remote sources (GNSS,VLBI) or active (SLR, LLR, DORIS).
Common to all these methods is that the data analysis re-quires gooda priori station motion model describing in partic-ular any variation with periods shorter than the analysis interval(for example, 1 day). For the methods based on range measure-ments, effects on the satellite also need to be accommodated.Coordinate time series resulting from space-geodetic analysestherefore are generally residuals with respect to the station mo-tion model and other modeled effects.
VLBI: Very Long Baseline Interferometry is a space-geodetic technique based on radio astronomy and developedin the 1970s. A radio interferometer consists of a pair of direc-tional antennas (radio telescopes) receiving radio signals fromsources in a targeted radio frequency band. The signals fromthe two receivers are cross-correlated (multiplied and accumu-lated) to produce a cross-correlation “fringe pattern”.
VLBI uses networks of radio antennas typically 20-30meters in diameter (Figure 7) to observe radio signals from
Figure 7. 32-meter VLBI antenna in Tsukuba, Japan.
Figure 8. Principle of very long baseline interferometry.
extragalactic objects (quasars). Quasars are at such greatdis-tances from Earth that they provide fixed points in the sky.Their transverse physical motion cannot be detected with anyexisting observing system. A radio signal from a quasar pass-ing a VLBI station is received and recorded digitally with veryprecise time provided by a hydrogen maser. The same signalwill travel an additional distancecτ before arriving at the sec-ond VLBI station, wherec is the speed of light andτ is the timedifference of the signal arriving at the first and second station(Figure 8). The distancecτ depends on the length of the base-line between the stations and its orientation with respect to thedirection to the quasar (e.g., Lambeck, 1988; Robertson, 1991;Sovers et al., 1998). The time delay between the arrival times atthe two stations can be determined with a precision equivalentto a few millimeters using purpose-built hardware correlators.
The global network of 40 VLBI stations (see Figure 9)

The Global Geodetic Observing System GGOS 2020 31
-90
-60
-30
0
30
60
90
-90
-60
-30
0
30
60
90
-180 -150 -120 -90 -60 -30 0 30 60 90 120 150
-180 -150 -120 -90 -60 -30 0 30 60 90 120 150
-90
-60
-30
0
30
60
90
-90
-60
-30
0
30
60
90
-180 -150 -120 -90 -60 -30 0 30 60 90 120 150 180
-180 -150 -120 -90 -60 -30 0 30 60 90 120 150 180
Figure 9. Station network of the IVS.
Figure 10. Principle of satellite laser ranging.
is today coordinated by the IVS. A typical VLBI session cur-rently includes eight stations observing about 60 quasars sev-eral times in a time period of 24 hours. Overlapping networksand network sessions of up to 20 stations connect the 40 globalVLBI stations. The time delays from each baseline in the net-work are used to estimate the station positions with precisionof < 1 cm, and the (relative) station velocities can be measuredby observations over several years.
Currently, VLBI is the only non-satellite geodetic tech-nique contributing to the IERS. Its unique and fundamentalcontributions to geodesy and astronomy are (1) the ICRF, therealization of the ICRS, (2) UT1-UTC (apart from leap sec-onds the difference of universal time as realized by Earth ro-tation and the atomic time, respectively, see Section 2.7),(3)long-term stability of nutation, and (4) the scale of the ITRF(together with SLR). VLBI also contributes with station posi-tions and velocities to the establishment of the ITRF and is ableto provide several further geodynamical, astronomical, orme-teorological parameters.
SLR and LLR: Satellite Laser Ranging andLunar LaserRanging(LLR) use very short laser pulses and fast electron-ics to measure the instantaneous round trip time of flight of thepulses to satellites equipped with special retroreflectors(Fig-ure 10) and to retroreflectors on the Moon (Figure 12), respec-
tively. This provides range measurements of a few millimeterprecision which are accumulated to help define the terrestrialreference frame and to supportPrecision Orbit Determination(POD) for active spaceborne Earth sensing missions and stud-ies of lunar science and fundamental physics. The fundamen-tal targets for the reference frame are theLAser GEOdynam-ics Satellite(LAGEOS)-1 and -2 (Figure 11), whose sphericalshape and high mass-to-area ratios provide long-term orbitalstability for measuring the dynamics of the Earth.
The basic range measurement is sensitive to any geophys-ical process that changes the distance between the satellite andthe observing station, such as displacements of the satellite dueto perturbations of the Earth’s gravitational field, motions ofthe observing station due to tidal displacements or plate tecton-ics, or a change in the orientation of the Earth (which changesthe location of the observing station with respect to the satel-lite). These and other geophysical processes must be mod-eled when fitting the satellite’s orbit to the range measurementsas obtained at a number of globally distributed tracking sta-tions. Adjustments to thea priori models used for these effectscan then be obtained during the orbit determination procedure,thereby enabling, for example, the determination of station po-sitions and Earth orientation parameters (Smith et al., 1985,1990, 1994; Tapley et al., 1985, 1993).
The technique of LLR is similar to that of SLR except thatthe laser retro-reflector is located on the Moon instead of onanartificial satellite (Mulholland, 1980; Lambeck, 1988; Williamset al., 1993; Dickey et al., 1994; Shelus, 2001). LLR is tech-nically more challenging than SLR because of the need to de-tect the much weaker signal that is returned from the Moon.Larger, more powerful laser systems with more sophisticatedsignal detection systems need to be employed in LLR; conse-quently, there are far fewer stations that range to the Moon thanrange to artificial satellites (see Figure 13).
The international network of about 40 SLR and two LLRstations (Figure 13) currently tracks on a daily basis about30satellites ranging in altitude from 400 km to 22,000 km andfour retroreflectors on the Moon. As a Service of the IAG anda component of GGOS, laser ranging activities are coordinatedby theInternational Laser Ranging Service(ILRS), which de-velops standards and specifications necessary for product con-sistency, sets priorities and tracking strategies, oversees dataoperations, and provides quality control and a user interface.
These laser ranging activities support programs primar-ily in geodetic, geophysical, and lunar research activities. TheILRS currently provides the IERS with weekly solutions forstation coordinates and EOPs for the monitoring of the ITRF,contributing exclusively the definition and time-varying motionof its origin (with respect to the CM), and in combination withVLBI, its scale. Other contributions include the estimation ofstatic and time-varying components (harmonic coefficients) ofEarth’s gravity field; accurate satellite ephemerides for PODand validation of altimetry (for satellites such as ICESat,shownin Figure 14), relativistic and satellite dynamics tests; and Lu-nar ephemeris for relativity studies and lunar libration for lu-
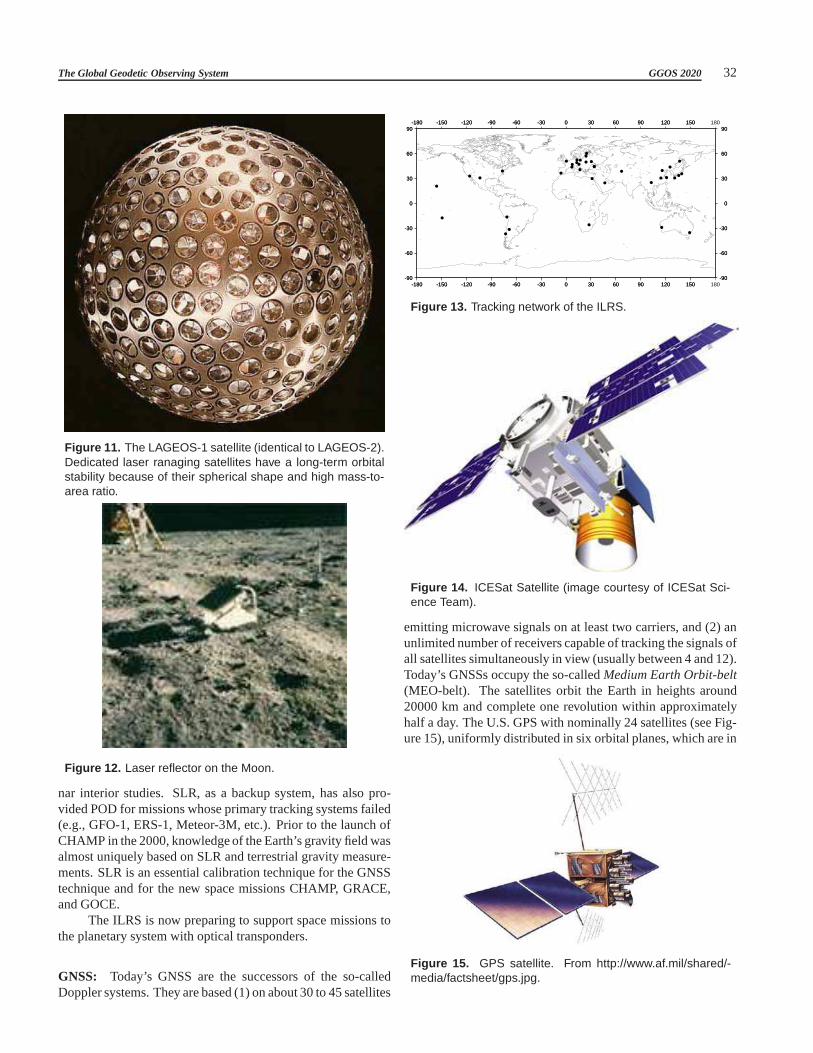
The Global Geodetic Observing System GGOS 2020 32
Figure 11. The LAGEOS-1 satellite (identical to LAGEOS-2).Dedicated laser ranaging satellites have a long-term orbitalstability because of their spherical shape and high mass-to-area ratio.
Figure 12. Laser reflector on the Moon.
nar interior studies. SLR, as a backup system, has also pro-vided POD for missions whose primary tracking systems failed(e.g., GFO-1, ERS-1, Meteor-3M, etc.). Prior to the launch ofCHAMP in the 2000, knowledge of the Earth’s gravity field wasalmost uniquely based on SLR and terrestrial gravity measure-ments. SLR is an essential calibration technique for the GNSStechnique and for the new space missions CHAMP, GRACE,and GOCE.
The ILRS is now preparing to support space missions tothe planetary system with optical transponders.
GNSS: Today’s GNSS are the successors of the so-calledDoppler systems. They are based (1) on about 30 to 45 satellites
-90
-60
-30
0
30
60
90
-90
-60
-30
0
30
60
90
-180 -150 -120 -90 -60 -30 0 30 60 90 120 150
-180 -150 -120 -90 -60 -30 0 30 60 90 120 150
-90
-60
-30
0
30
60
90
-90
-60
-30
0
30
60
90
-180 -150 -120 -90 -60 -30 0 30 60 90 120 150 180
-180 -150 -120 -90 -60 -30 0 30 60 90 120 150 180
Figure 13. Tracking network of the ILRS.
Figure 14. ICESat Satellite (image courtesy of ICESat Sci-ence Team).
emitting microwave signals on at least two carriers, and (2)anunlimited number of receivers capable of tracking the signals ofall satellites simultaneously in view (usually between 4 and 12).Today’s GNSSs occupy the so-calledMedium Earth Orbit-belt(MEO-belt). The satellites orbit the Earth in heights around20000 km and complete one revolution within approximatelyhalf a day. The U.S. GPS with nominally 24 satellites (see Fig-ure 15), uniformly distributed in six orbital planes, whichare in
Figure 15. GPS satellite. From http://www.af.mil/shared/-media/factsheet/gps.jpg.
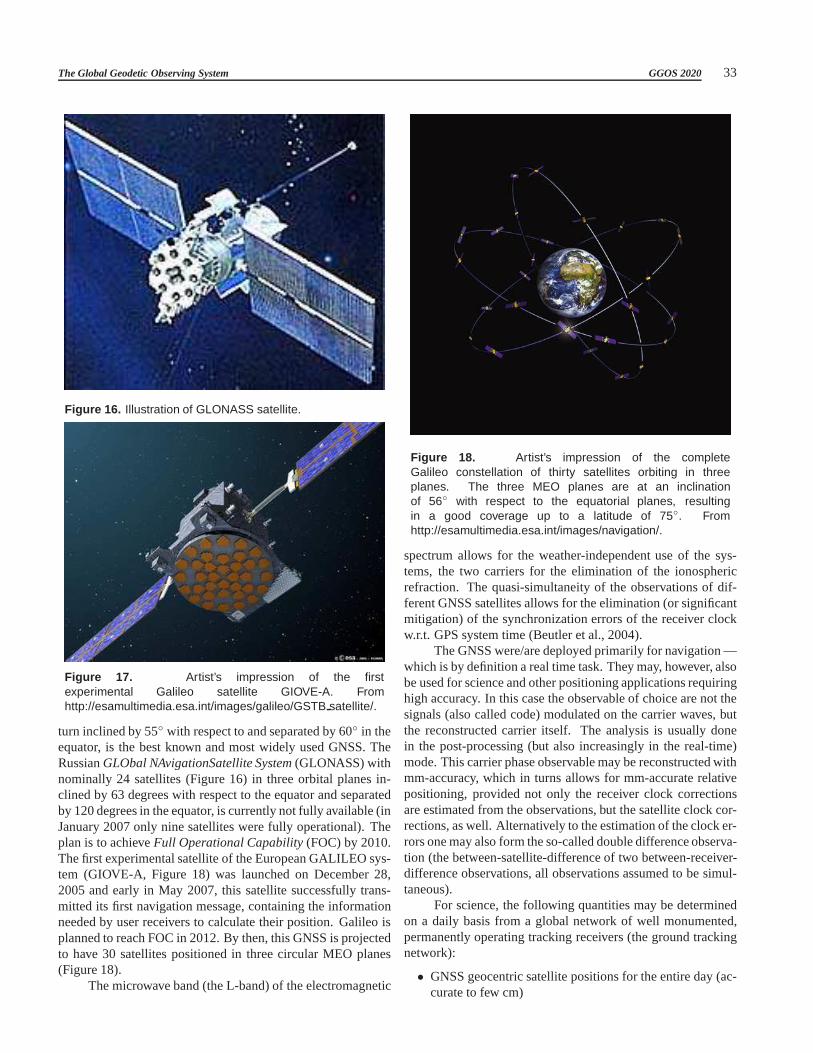
The Global Geodetic Observing System GGOS 2020 33
Figure 16. Illustration of GLONASS satellite.
Figure 17. Artist’s impression of the firstexperimental Galileo satellite GIOVE-A. Fromhttp://esamultimedia.esa.int/images/galileo/GSTB satellite/.
turn inclined by 55 with respect to and separated by 60 in theequator, is the best known and most widely used GNSS. TheRussianGLObal NAvigationSatellite System(GLONASS) withnominally 24 satellites (Figure 16) in three orbital planesin-clined by 63 degrees with respect to the equator and separatedby 120 degrees in the equator, is currently not fully available (inJanuary 2007 only nine satellites were fully operational).Theplan is to achieveFull Operational Capability(FOC) by 2010.The first experimental satellite of the European GALILEO sys-tem (GIOVE-A, Figure 18) was launched on December 28,2005 and early in May 2007, this satellite successfully trans-mitted its first navigation message, containing the informationneeded by user receivers to calculate their position. Galileo isplanned to reach FOC in 2012. By then, this GNSS is projectedto have 30 satellites positioned in three circular MEO planes(Figure 18).
The microwave band (the L-band) of the electromagnetic
Figure 18. Artist’s impression of the completeGalileo constellation of thirty satellites orbiting in threeplanes. The three MEO planes are at an inclinationof 56 with respect to the equatorial planes, resultingin a good coverage up to a latitude of 75. Fromhttp://esamultimedia.esa.int/images/navigation/.
spectrum allows for the weather-independent use of the sys-tems, the two carriers for the elimination of the ionosphericrefraction. The quasi-simultaneity of the observations ofdif-ferent GNSS satellites allows for the elimination (or significantmitigation) of the synchronization errors of the receiver clockw.r.t. GPS system time (Beutler et al., 2004).
The GNSS were/are deployed primarily for navigation —which is by definition a real time task. They may, however, alsobe used for science and other positioning applications requiringhigh accuracy. In this case the observable of choice are not thesignals (also called code) modulated on the carrier waves, butthe reconstructed carrier itself. The analysis is usually donein the post-processing (but also increasingly in the real-time)mode. This carrier phase observable may be reconstructed withmm-accuracy, which in turns allows for mm-accurate relativepositioning, provided not only the receiver clock correctionsare estimated from the observations, but the satellite clock cor-rections, as well. Alternatively to the estimation of the clock er-rors one may also form the so-called double difference observa-tion (the between-satellite-difference of two between-receiver-difference observations, all observations assumed to be simul-taneous).
For science, the following quantities may be determinedon a daily basis from a global network of well monumented,permanently operating tracking receivers (the ground trackingnetwork):
• GNSS geocentric satellite positions for the entire day (ac-curate to few cm)
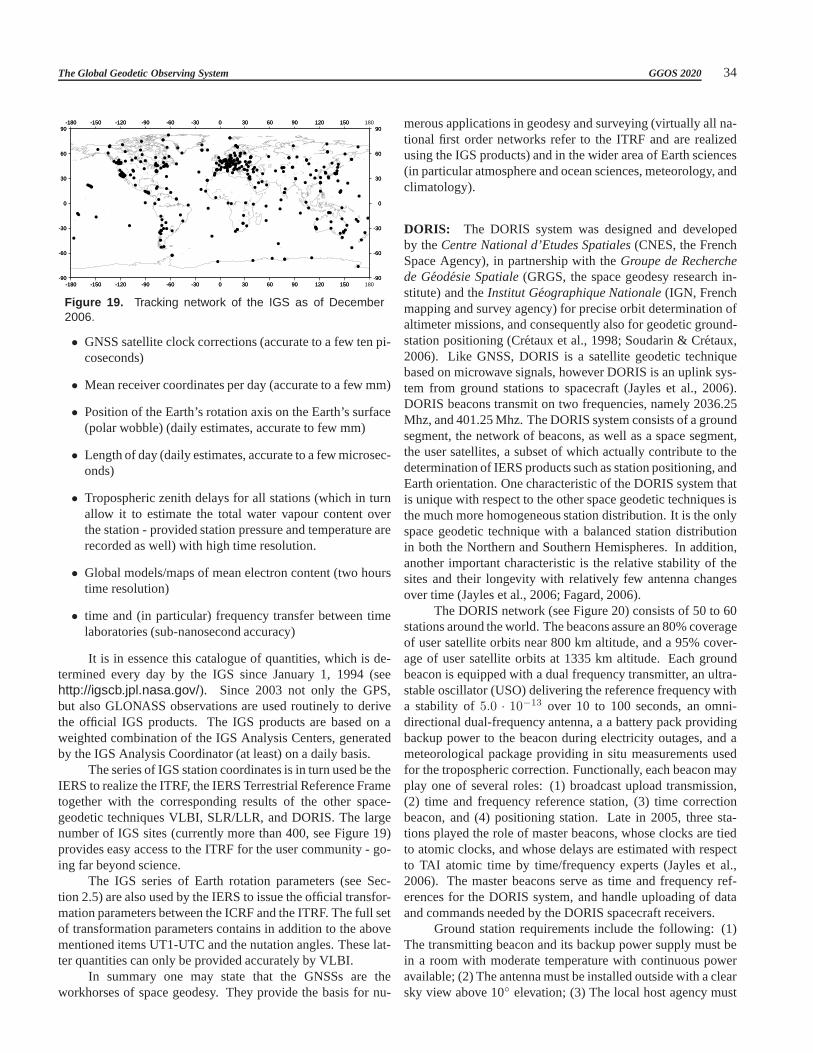
The Global Geodetic Observing System GGOS 2020 34
-90
-60
-30
0
30
60
90
-90
-60
-30
0
30
60
90
-180 -150 -120 -90 -60 -30 0 30 60 90 120 150
-180 -150 -120 -90 -60 -30 0 30 60 90 120 150
-90
-60
-30
0
30
60
90
-90
-60
-30
0
30
60
90
-180 -150 -120 -90 -60 -30 0 30 60 90 120 150 180
-180 -150 -120 -90 -60 -30 0 30 60 90 120 150 180
Figure 19. Tracking network of the IGS as of December2006.
• GNSS satellite clock corrections (accurate to a few ten pi-coseconds)
• Mean receiver coordinates per day (accurate to a few mm)
• Position of the Earth’s rotation axis on the Earth’s surface(polar wobble) (daily estimates, accurate to few mm)
• Length of day (daily estimates, accurate to a few microsec-onds)
• Tropospheric zenith delays for all stations (which in turnallow it to estimate the total water vapour content overthe station - provided station pressure and temperature arerecorded as well) with high time resolution.
• Global models/maps of mean electron content (two hourstime resolution)
• time and (in particular) frequency transfer between timelaboratories (sub-nanosecond accuracy)
It is in essence this catalogue of quantities, which is de-termined every day by the IGS since January 1, 1994 (seehttp://igscb.jpl.nasa.gov/). Since 2003 not only the GPS,but also GLONASS observations are used routinely to derivethe official IGS products. The IGS products are based on aweighted combination of the IGS Analysis Centers, generatedby the IGS Analysis Coordinator (at least) on a daily basis.
The series of IGS station coordinates is in turn used be theIERS to realize the ITRF, the IERS Terrestrial Reference Frametogether with the corresponding results of the other space-geodetic techniques VLBI, SLR/LLR, and DORIS. The largenumber of IGS sites (currently more than 400, see Figure 19)provides easy access to the ITRF for the user community - go-ing far beyond science.
The IGS series of Earth rotation parameters (see Sec-tion 2.5) are also used by the IERS to issue the official transfor-mation parameters between the ICRF and the ITRF. The full setof transformation parameters contains in addition to the abovementioned items UT1-UTC and the nutation angles. These lat-ter quantities can only be provided accurately by VLBI.
In summary one may state that the GNSSs are theworkhorses of space geodesy. They provide the basis for nu-
merous applications in geodesy and surveying (virtually all na-tional first order networks refer to the ITRF and are realizedusing the IGS products) and in the wider area of Earth sciences(in particular atmosphere and ocean sciences, meteorology, andclimatology).
DORIS: The DORIS system was designed and developedby theCentre National d’Etudes Spatiales(CNES, the FrenchSpace Agency), in partnership with theGroupe de Recherchede Geodesie Spatiale(GRGS, the space geodesy research in-stitute) and theInstitut Geographique Nationale(IGN, Frenchmapping and survey agency) for precise orbit determinationofaltimeter missions, and consequently also for geodetic ground-station positioning (Cretaux et al., 1998; Soudarin & Cretaux,2006). Like GNSS, DORIS is a satellite geodetic techniquebased on microwave signals, however DORIS is an uplink sys-tem from ground stations to spacecraft (Jayles et al., 2006).DORIS beacons transmit on two frequencies, namely 2036.25Mhz, and 401.25 Mhz. The DORIS system consists of a groundsegment, the network of beacons, as well as a space segment,the user satellites, a subset of which actually contribute to thedetermination of IERS products such as station positioning, andEarth orientation. One characteristic of the DORIS system thatis unique with respect to the other space geodetic techniques isthe much more homogeneous station distribution. It is the onlyspace geodetic technique with a balanced station distributionin both the Northern and Southern Hemispheres. In addition,another important characteristic is the relative stability of thesites and their longevity with relatively few antenna changesover time (Jayles et al., 2006; Fagard, 2006).
The DORIS network (see Figure 20) consists of 50 to 60stations around the world. The beacons assure an 80% coverageof user satellite orbits near 800 km altitude, and a 95% cover-age of user satellite orbits at 1335 km altitude. Each groundbeacon is equipped with a dual frequency transmitter, an ultra-stable oscillator (USO) delivering the reference frequency witha stability of 5.0 · 10−13 over 10 to 100 seconds, an omni-directional dual-frequency antenna, a a battery pack providingbackup power to the beacon during electricity outages, and ameteorological package providing in situ measurements usedfor the tropospheric correction. Functionally, each beacon mayplay one of several roles: (1) broadcast upload transmission,(2) time and frequency reference station, (3) time correctionbeacon, and (4) positioning station. Late in 2005, three sta-tions played the role of master beacons, whose clocks are tiedto atomic clocks, and whose delays are estimated with respectto TAI atomic time by time/frequency experts (Jayles et al.,2006). The master beacons serve as time and frequency ref-erences for the DORIS system, and handle uploading of dataand commands needed by the DORIS spacecraft receivers.
Ground station requirements include the following: (1)The transmitting beacon and its backup power supply must bein a room with moderate temperature with continuous poweravailable; (2) The antenna must be installed outside with a clearsky view above 10 elevation; (3) The local host agency must

The Global Geodetic Observing System GGOS 2020 35
-90
-60
-30
0
30
60
90
-90
-60
-30
0
30
60
90
-180 -150 -120 -90 -60 -30 0 30 60 90 120 150
-180 -150 -120 -90 -60 -30 0 30 60 90 120 150
-90
-60
-30
0
30
60
90
-90
-60
-30
0
30
60
90
-180 -150 -120 -90 -60 -30 0 30 60 90 120 150 180
-180 -150 -120 -90 -60 -30 0 30 60 90 120 150 180
Figure 20. Tracking network ofthe IDS.
be willing to carry out minor verifications and adjustments;(4) The frequencies transmitted by DORIS should not interferewith existing receivers in the same area (Fagard, 2006).
An important activity was initiated in 1999 to improve theDORIS system through improvements of the monumentation,installation of new antennae and support structures, and othermeasures to ensure the stability of the DORIS antenna refer-ence point to within 1 cm over ten years (Fagard, 2006). Forexample, one goal is that in so far as is possible, ground anten-nae are now mounted on a concrete pillar deeply anchored intothe ground, or on a rigid tower on a deep concrete foundation(see Figure 21). As of 2006, 35 of 56 stations are now consid-ered ’excellent’ compared to only 10% in 2000 (Tavernier & etal., 2006). The improvements in the network quality are dra-matically visible in the residuals (RMS of fit) of DORIS datafor the SPOT-2 and TOPEX/Poseidon satellites with the RMSdeclining from 0.55 mm/s in 1993 to 0.45 mm/s in 2005.
As of 2006, there were colocations between DORIS an-tennae and other active IERS techniques at 38 of the 56 per-manent DORIS stations. These colocations are distributedas follows: with GPS at 37 sites, with SLR at 9 sites, andwith VLBI at 7 sites. Among these stations, fifteen siteshave three colocations (8 for GPS+SLR+DORIS, and 7 forGPS+VLBI+DORIS). Only two sites worldwide have coloca-tions with four techniques (GPS+VLBI+SLR+DORIS): Harte-beesthoek and Greenbelt. During the effort of network renova-tion, some stations were specifically displaced to satisfy bothoperational constraints and to increase the number of coloca-tions between DORIS and other geodetic techniques. Theseinclude Jiufeng (replacing Purple Mountain), Male (replacingColombo), Miami (replacing Richmond), Santa Cruz (replac-ing Galapagos), and Monument Peak (replacing Goldstone)(Fagard, 2006). Since the 1990’s, with the growing interestinmonitoring changes in global mean sea level, DORIS stationshave been increasingly sited near tide gauges. As of 2006, 21DORIS tide-gauge colocations were available (Fagard, 2006).
The space segment of the DORIS system consists of re-
Figure 21. Illustration of two DORIS stations. The stationsare Rothera, Antarctica (top), and Thule, Greenland (bottom).
ceivers on user satellites in low Earth orbit. Four satellites havecarried first-generation DORIS receivers: TOPEX/Poseidon,SPOT-2, SPOT-3, and SPOT-4. A new second-generation dualchannel DORIS receiver was developed in the 1990’s. Thisreceiver has been carried on ENVISAT, and a miniaturized ver-sion on Jason-1 and SPOT-5 (Tavernier & et al., 2006). Fig-ure 22 summarizes the availability of the DORIS data at the
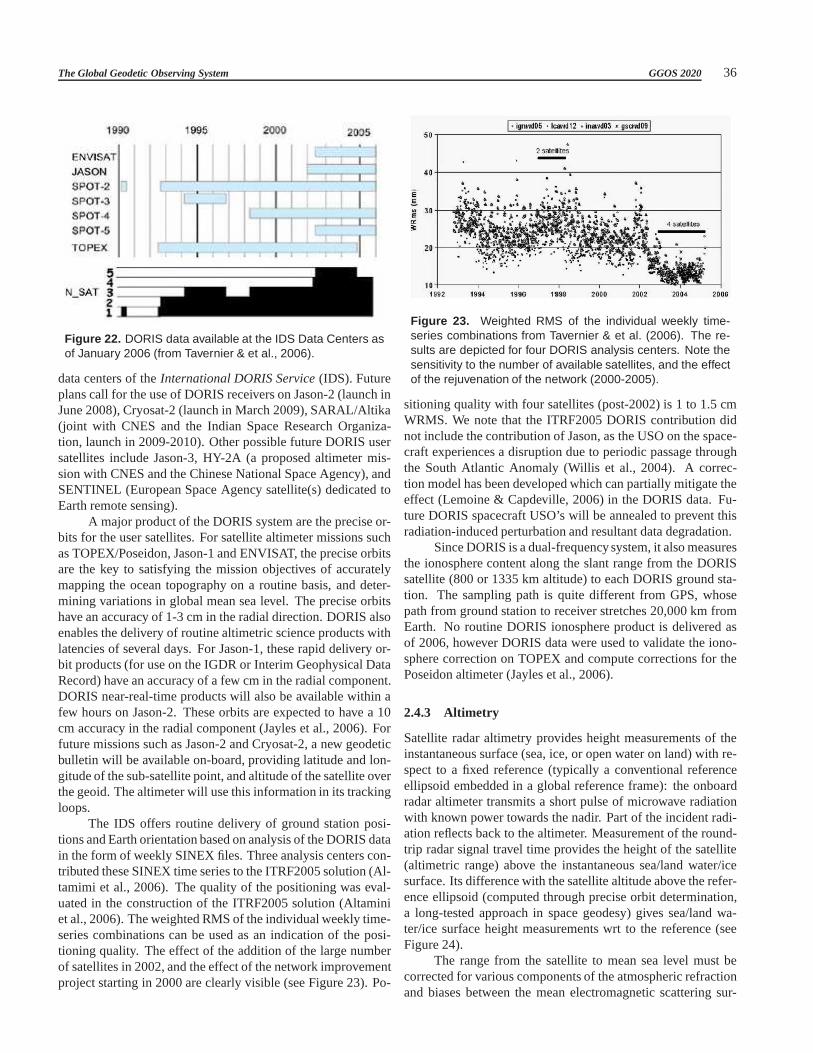
The Global Geodetic Observing System GGOS 2020 36
Figure 22. DORIS data available at the IDS Data Centers asof January 2006 (from Tavernier & et al., 2006).
data centers of theInternational DORIS Service(IDS). Futureplans call for the use of DORIS receivers on Jason-2 (launch inJune 2008), Cryosat-2 (launch in March 2009), SARAL/Altika(joint with CNES and the Indian Space Research Organiza-tion, launch in 2009-2010). Other possible future DORIS usersatellites include Jason-3, HY-2A (a proposed altimeter mis-sion with CNES and the Chinese National Space Agency), andSENTINEL (European Space Agency satellite(s) dedicated toEarth remote sensing).
A major product of the DORIS system are the precise or-bits for the user satellites. For satellite altimeter missions suchas TOPEX/Poseidon, Jason-1 and ENVISAT, the precise orbitsare the key to satisfying the mission objectives of accuratelymapping the ocean topography on a routine basis, and deter-mining variations in global mean sea level. The precise orbitshave an accuracy of 1-3 cm in the radial direction. DORIS alsoenables the delivery of routine altimetric science products withlatencies of several days. For Jason-1, these rapid delivery or-bit products (for use on the IGDR or Interim Geophysical DataRecord) have an accuracy of a few cm in the radial component.DORIS near-real-time products will also be available within afew hours on Jason-2. These orbits are expected to have a 10cm accuracy in the radial component (Jayles et al., 2006). Forfuture missions such as Jason-2 and Cryosat-2, a new geodeticbulletin will be available on-board, providing latitude and lon-gitude of the sub-satellite point, and altitude of the satellite overthe geoid. The altimeter will use this information in its trackingloops.
The IDS offers routine delivery of ground station posi-tions and Earth orientation based on analysis of the DORIS datain the form of weekly SINEX files. Three analysis centers con-tributed these SINEX time series to the ITRF2005 solution (Al-tamimi et al., 2006). The quality of the positioning was eval-uated in the construction of the ITRF2005 solution (Altaminiet al., 2006). The weighted RMS of the individual weekly time-series combinations can be used as an indication of the posi-tioning quality. The effect of the addition of the large numberof satellites in 2002, and the effect of the network improvementproject starting in 2000 are clearly visible (see Figure 23). Po-
Figure 23. Weighted RMS of the individual weekly time-series combinations from Tavernier & et al. (2006). The re-sults are depicted for four DORIS analysis centers. Note thesensitivity to the number of available satellites, and the effectof the rejuvenation of the network (2000-2005).
sitioning quality with four satellites (post-2002) is 1 to 1.5 cmWRMS. We note that the ITRF2005 DORIS contribution didnot include the contribution of Jason, as the USO on the space-craft experiences a disruption due to periodic passage throughthe South Atlantic Anomaly (Willis et al., 2004). A correc-tion model has been developed which can partially mitigate theeffect (Lemoine & Capdeville, 2006) in the DORIS data. Fu-ture DORIS spacecraft USO’s will be annealed to prevent thisradiation-induced perturbation and resultant data degradation.
Since DORIS is a dual-frequencysystem, it also measuresthe ionosphere content along the slant range from the DORISsatellite (800 or 1335 km altitude) to each DORIS ground sta-tion. The sampling path is quite different from GPS, whosepath from ground station to receiver stretches 20,000 km fromEarth. No routine DORIS ionosphere product is delivered asof 2006, however DORIS data were used to validate the iono-sphere correction on TOPEX and compute corrections for thePoseidon altimeter (Jayles et al., 2006).
2.4.3 Altimetry
Satellite radar altimetry provides height measurements oftheinstantaneous surface (sea, ice, or open water on land) withre-spect to a fixed reference (typically a conventional referenceellipsoid embedded in a global reference frame): the onboardradar altimeter transmits a short pulse of microwave radiationwith known power towards the nadir. Part of the incident radi-ation reflects back to the altimeter. Measurement of the round-trip radar signal travel time provides the height of the satellite(altimetric range) above the instantaneous sea/land water/icesurface. Its difference with the satellite altitude above the refer-ence ellipsoid (computed through precise orbit determination,a long-tested approach in space geodesy) gives sea/land wa-ter/ice surface height measurements wrt to the reference (seeFigure 24).
The range from the satellite to mean sea level must becorrected for various components of the atmospheric refractionand biases between the mean electromagnetic scattering sur-

The Global Geodetic Observing System GGOS 2020 37
Figure 24. Principle of satellite altimetry. Fromhttp://icesat.gsfc.nasa.gov.
Figure 25. The Jason-1 satellite altimetry mission. CourtesyNASA/JPL.
face and mean sea level at the air-sea interface. A number ofcorrections due to a number of geophysical effects must alsobetaken into account.
State of the art satellite radar altimetry has more than 2decades of heritage : GEOS-3 (1975), SEASAT (1978), Geosat(1985- 1989), ERS-1 (1991-1996), Topex/Poseidon (1992-2006), ERS-2 (since 1995), GFO (since 2000), Envisat (since2002) and Jason-1 (since 2001, see Figure 25). Over the years,technological improvements (especially for Topex/Poseidon,Envisat and Jason-1) have decreased considerably the instru-mental noise for a point-to-point measurement. Moreover,thanks to a concerted effort in precise modeling of the geophys-ical and environmental corrections as well as in precise orbitcomputation, the total rms measurement accuracy of altimetry-based sea surface height is currently about 1-2 cm for a singlemeasurement (e.g., for Jason-1).
Although developed for oceanographic purposes, early
altimetry missions have mainly served to map the marine geoidglobally with high precision and resolution, leading to con-siderable achievements in several areas of marine geophysics(e.g., marine tectonics, mechanical and thermal structureof theoceanic lithosphere, seafloor topography, etc.). With the launchof the Topex/Poseidon mission in the early 1990s, the precisionof sea surface height measurements improved by a factor 10 ormore, allowing for the first time precise determination of thetemporal variability of the ocean surface, with numerous appli-cations in oceanography. Major results have been obtained onsurface currents and the ocean dynamic topography, ocean sea-sons, El Nino, ocean heat content, sea level rise, ocean tides,waves, etc. Satellite radar altimetry (together with laseraltime-try, e.g., the IceSat mission) have also proved very useful formeasure the change in elevation of the ice sheets (hence theirmass balance in response to global warming) and more recentlythe water level of lakes, rivers and floodplains on land.
Sea level measured relative to the geoid (the fundamen-tal level surface which will be determined to good accuracyby space geodetic missions such as GOCE in the next fewyears, see Section 2.6.5), provides the “sea surface topography”which allows estimation of ocean transports, and contributesultimately to an understanding of climate change (Johannessenet al., 2003).
2.4.4 GNSS scatterometry and reflectometry
In the past few years the potential of GNSS signal reflectionsfor ocean altimetry and remote sensing of sea surface rough-ness has generated considerable interest. ThePassive Reflec-tometry and Interferometry System(PARIS) was the first con-cept proposed for ocean altimetry using GNSS L-band signals(Martin-Neira, 1993). Within the PARIS scheme direct andocean-reflected signals are detected by spaceborne receiversand altimetric height information is extracted from the delayin arrival times of the reflected in relation to the direct signals(Figure 27). In the following years altimetric heights withac-curacies below 5 cm were determined in a number of air-borneand ground-based experiments using special purpose GNSS re-ceiver instrumentation (GNSS reflectometry, e.g., Garrison &Katzberg, 2000; Treuhaft et al., 2001).
In addition, the shape of the code correlation as a func-tion of time delay and Doppler frequency and its dependencyon the reflecting surface’s slope characteristics can be used toinfer the sea surface roughness (GNSS scatterometry, Garrisonet al., 1998). Using parameterizations relating the observedroughness to the surface wind vector GNSS scatterometry al-lows for the remote detection of wind speed and wind directionas well (e.g., Katzberg et al., 2001; Germain et al., 2004).
First spaceborne observations of GNSS signal reflec-tions are reported by Pavelyev et al. (1996) and Lowe et al.(2002). Later, signatures of coherent GPS reflections at graz-ing incidence angles were found in radio occultation data ob-served by the GPS/MET, CHAMP and SAC-C satellites (Bey-erle & Hocke, 2001; Hajj et al., 2004). More recently, the

The Global Geodetic Observing System GGOS 2020 38
Table 2. Satellite gravity and altimeter mission products to determine mass transport and mass distribution in a multi-disciplinaryenvironment.
Mission Type MissionDuration
CHAMP Gravity, magnetic field, atmosphere 2000–2008GRACE Gravity (static and temporal), atmosphere 2002–2010GOCE Gravity (stationary, high-resolution) 2007–2009TOPEX/Poseidon Ocean altimetry 1992–2005Jason-1 Ocean altimetry 2001–2008Jason-2 Ocean altimetry 2008–2015ICESat Ice altimetry 2003–2008CRYOSAT2 Ice altimetry 2009–2013ERS-2 Altimetry, SAR/InSAR, climate, environment 1995–2007ENVISAT Altimetry, SAR/InSAR, climate, environment 2002-2008TerraSAR-X SAR, InSAR, atmosphere 2006–2011SWARM Magentic field 2009–2014
Figure 26. Jason-1 and DORIS.The map shows the visibilityof the JASON satellite to eachDORIS ground station.
GNSS scatterometry experiment aboard theUnited Kindom’sDesaster Monitoring Constellation(UK-DMC) satellite suc-cessfully demonstrated the feasibility of sea surface state re-mote sensing from low Earth orbit (Gleason et al., 2005). Inthe future, satellite constellations furnished with GNSS scat-terometry and reflectometry instruments could contribute to thelong-term observations of ocean topography as well as con-stitute essential elements of early warning systems for catas-trophic tsunami events.
Science with GPS reflected and scattered signalsThis sec-tion discusses an emerging technique for Earth remote sensingbased on detecting a GNSS signal after it is reflected off theEarth surface, to measure surface topography and roughnessathigh spatial resolution and rapid temporal coverage. The weakreflected signals require a high-gain multi-beam steerablean-
tenna. Because this technique is promising in terms of spatialand temporal resolution, we devote here some space to the dis-cussion of its potential in a few major areas.
Global Ocean Altimetry The Oceans, and their interactionswith the atmosphere and the lithosphere, play a significant rolein Earth’s climate. Understanding climate variability impliesquantifying all the significant processes that contribute to cli-mate and its changes. One such process, mesoscale ocean ed-dies, analogous to atmospheric storms, represents one of thedominant global climate errors (see HOTSWG 2001 for a re-view); they are essential to understanding ocean circulation onall scales and are an important contribution to the carbon cycle.
On the regional scale, eddies can induce local upwellingand enhance biological production. In the equatorial Pacific,eddies associated with the tropical instability waves can in-
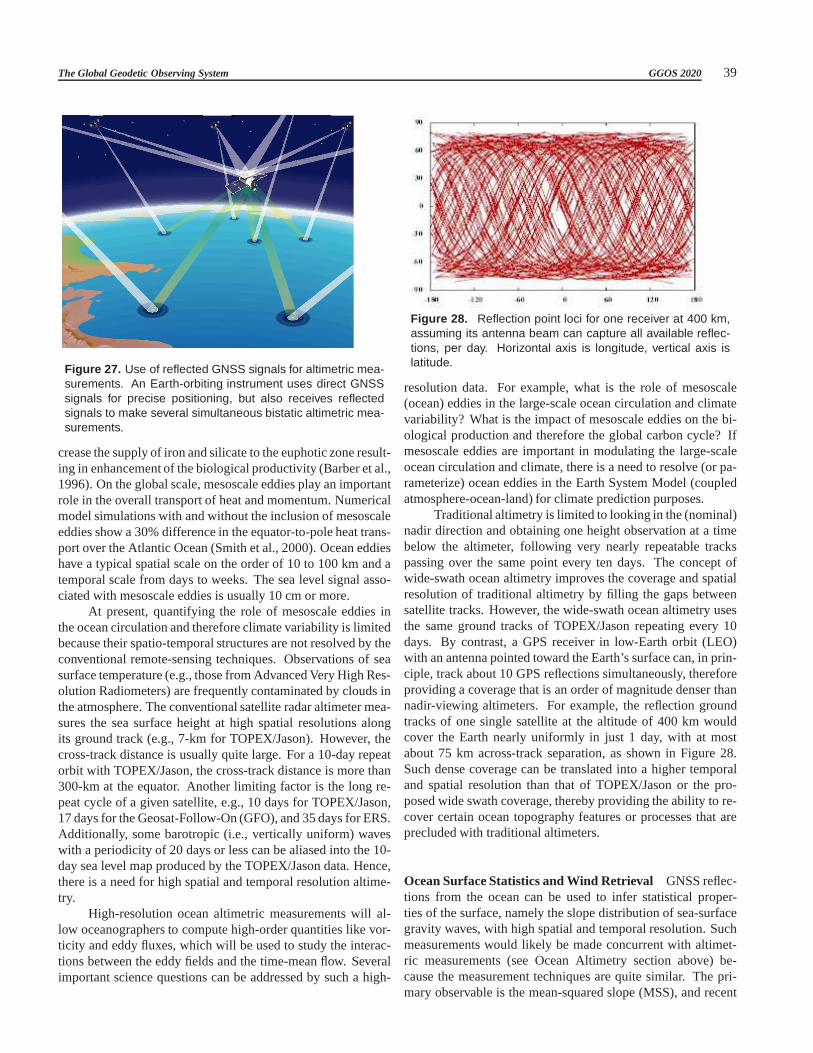
The Global Geodetic Observing System GGOS 2020 39
Figure 27. Use of reflected GNSS signals for altimetric mea-surements. An Earth-orbiting instrument uses direct GNSSsignals for precise positioning, but also receives reflectedsignals to make several simultaneous bistatic altimetric mea-surements.
crease the supply of iron and silicate to the euphotic zone result-ing in enhancement of the biological productivity (Barber et al.,1996). On the global scale, mesoscale eddies play an importantrole in the overall transport of heat and momentum. Numericalmodel simulations with and without the inclusion of mesoscaleeddies show a 30% difference in the equator-to-pole heat trans-port over the Atlantic Ocean (Smith et al., 2000). Ocean eddieshave a typical spatial scale on the order of 10 to 100 km and atemporal scale from days to weeks. The sea level signal asso-ciated with mesoscale eddies is usually 10 cm or more.
At present, quantifying the role of mesoscale eddies inthe ocean circulation and therefore climate variability islimitedbecause their spatio-temporal structures are not resolvedby theconventional remote-sensing techniques. Observations ofseasurface temperature (e.g., those from Advanced Very High Res-olution Radiometers) are frequently contaminated by clouds inthe atmosphere. The conventional satellite radar altimeter mea-sures the sea surface height at high spatial resolutions alongits ground track (e.g., 7-km for TOPEX/Jason). However, thecross-track distance is usually quite large. For a 10-day repeatorbit with TOPEX/Jason, the cross-track distance is more than300-km at the equator. Another limiting factor is the long re-peat cycle of a given satellite, e.g., 10 days for TOPEX/Jason,17 days for the Geosat-Follow-On (GFO), and 35 days for ERS.Additionally, some barotropic (i.e., vertically uniform)waveswith a periodicity of 20 days or less can be aliased into the 10-day sea level map produced by the TOPEX/Jason data. Hence,there is a need for high spatial and temporal resolution altime-try.
High-resolution ocean altimetric measurements will al-low oceanographers to compute high-order quantities like vor-ticity and eddy fluxes, which will be used to study the interac-tions between the eddy fields and the time-mean flow. Severalimportant science questions can be addressed by such a high-
Figure 28. Reflection point loci for one receiver at 400 km,assuming its antenna beam can capture all available reflec-tions, per day. Horizontal axis is longitude, vertical axis islatitude.
resolution data. For example, what is the role of mesoscale(ocean) eddies in the large-scale ocean circulation and climatevariability? What is the impact of mesoscale eddies on the bi-ological production and therefore the global carbon cycle?Ifmesoscale eddies are important in modulating the large-scaleocean circulation and climate, there is a need to resolve (orpa-rameterize) ocean eddies in the Earth System Model (coupledatmosphere-ocean-land) for climate prediction purposes.
Traditional altimetry is limited to looking in the (nominal)nadir direction and obtaining one height observation at a timebelow the altimeter, following very nearly repeatable trackspassing over the same point every ten days. The concept ofwide-swath ocean altimetry improves the coverage and spatialresolution of traditional altimetry by filling the gaps betweensatellite tracks. However, the wide-swath ocean altimetryusesthe same ground tracks of TOPEX/Jason repeating every 10days. By contrast, a GPS receiver in low-Earth orbit (LEO)with an antenna pointed toward the Earth’s surface can, in prin-ciple, track about 10 GPS reflections simultaneously, thereforeproviding a coverage that is an order of magnitude denser thannadir-viewing altimeters. For example, the reflection groundtracks of one single satellite at the altitude of 400 km wouldcover the Earth nearly uniformly in just 1 day, with at mostabout 75 km across-track separation, as shown in Figure 28.Such dense coverage can be translated into a higher temporaland spatial resolution than that of TOPEX/Jason or the pro-posed wide swath coverage, thereby providing the ability tore-cover certain ocean topography features or processes that areprecluded with traditional altimeters.
Ocean Surface Statistics and Wind Retrieval GNSS reflec-tions from the ocean can be used to infer statistical proper-ties of the surface, namely the slope distribution of sea-surfacegravity waves, with high spatial and temporal resolution. Suchmeasurements would likely be made concurrent with altimet-ric measurements (see Ocean Altimetry section above) be-cause the measurement techniques are quite similar. The pri-mary observable is the mean-squared slope (MSS), and recent

The Global Geodetic Observing System GGOS 2020 40
studies (Germain et al., 2004) have shown a 2D directional-MSS can be obtained. The MSS field provides useful input toocean-atmosphere coupling phenomena such as surface break-ing waves and gas exchange. For example, CO2 flux mea-surements may be derived from MSS. With additional assump-tions, wind speed or wind vector retrievals can also be ob-tained from MSS measurements (Garrison et al., 1998; Kom-jathy et al., 2000; Cardellach et al., 2003; Zuffada et al., 2003).Finally, MSS measurements may clarify the relationship be-tween surface-height dynamics and wind-driven surface veloc-ities (Chelton et al., 2004).
Analysis of the GPS reflection waveform also providesan estimate of the wind speed and direction. While scatterom-eters such as QuikScat or SeaWinds provide near global cover-age in one day, the observations are not necessarily collocatedin time and space with the GPS altimetry observations. In-stead, GPS reflections provide a unique set of collocated seasurface height and wind observations with near-global dailycoverage and with resolution suitable for studying mesoscalefeatures. Accurate sea surface height retrieval requires simul-taneous measurements of ocean vector winds. The accuracyof GPS wind measurements is about 2 m/sec for wind speedsranging from 3 to 15 m/sec, comparable to the traditional radarscatterometer. Thus, the GPS-measured ocean winds will com-plement the existing radar scatterometer wind observations and,in the context of sea surface height measurement, will providethe needed data set to retrieve the sea surface height with highaccuracy. It is anticipated that the GPS altimetry will improveour current capability in two important ways: 1) High-spatial-resolution ocean topography and 2) Improved temporal reso-lution through rapid coverage. Another possible applicationof very rapid coverage of the ocean is the monitoring of fastmoving barotropic waves that propagate across ocean basinstoo quickly to be seen by the Jason 10-day repeat cycle.
Ice Science Detection of GPS reflections at low or grazingangles has the advantage of being coherent and, when com-bined with the direct signal, provides interferometric fringesfrom which a very precise estimation of bi-static path delay(down to sub-centimeter) can be detected. In the presence ofstrong L1 and L2 signals to calibrate the ionosphere, this canbe translated into accurate height surface measurements atthespecular reflection point.
Recent analysis (Cardellach et al., 2004) used this inter-ferometric signal, detected with the CHAMP radio occultationexperiment, to demonstrate a surface height precision of 0.7 mafter 0.2 s of integration with a reflection angle of< 1 (i.e.,89 incident angle). The GRSPI instrument will allow the de-tection of the coherently reflected signal at a higher elevationangle reducing the error in inferred ice surface height to lessthan 10 cm.
Global observations of sea ice, ice sheets, ice caps,glaciers and their surrounding seas, are paramount in ordertodetermine their mass balance, contributions to sea level change,global circulation and climate change. In fact, model simula-
tions and recent observations suggest that the ice-coveredre-gions of the Earth are the most sensitive to climate change. Inthe polar region the combination of atmospheric, cryospheric,and oceanographic processes have a large influence on theglobal climate. Unfortunately, these climatic processes arepoorly understood, principally because of a dearth of obser-vations for diagnosing the processes and validating numericalmodels.
Changes in ice thickness are an indicator of climatechange in the polar region as a result of heat exchanges betweenocean and atmosphere, and are themselves a primary driver ofclimate change through the effect of these heat fluxes on atmo-spheric circulation patterns and the strong positive planetaryalbedo feedback provided by changes in sea ice, snow coverand melt water. Given the multi-beam bi-static reflections ofGPS, a GPS cryospheric sensing system can provide a sub-stantially denser and more rapid coverage than traditionalicealtimetry instruments and allow the determination of seasonaland annual variations in sea-ice and land-ice thickness.
Soil Moisture Soil moisture is an important part of the landhydrology cycle, where it represents the immediate store ofin-filtrating rainfall, before it either evapotranspires or contributesto groundwater recharge. When the soil gets too dry, planttranspiration drops because the water is becoming increasinglybound to the soil particles. Conditions where soil is too dryto maintain reliable plant growth is referred to as agriculturaldrought, and is a particular focus of land management. Soilmoisture may be measured in situ with different instruments,such as Time Domain Reflectometry (TDR), neutron probe,capacitance probe, etc. but no global remote sensing mea-surements are currently available. The potential for measur-ing soil moisture with GPS has been explored through someground-based and airborne experiments over smooth terrain,led by the University of Colorado in Boulder and NASA Lang-ley Research Center. Theoretical models show that moist soilsgenerate strong reflective layers at the GPS frequencies, dueto high gradients in dielectric constant. It was experimentallyobserved that variations in the reflected signal are uniquely re-lated to changes in the dielectric permittivity, and therefore, tosoil moisture because roughness of the area with low grass re-mains constant. More work is needed to assess requirements,including antenna gains, for potential GPS-based systems forglobal soil moisture measurements.
Traceability Matrix for Ocean Observations The2007 NRC Decadal Report (National Research Council,2007) stresses that future directions for Earth science atNASA/NOAA will focus on achievement of a national strategyfor the Earth Sciences that balances international economiccompetitiveness, protection of life and property, and steward-ship of the planet for this and future generations. Based onthe need for climate measurements identified in the report,JPL promoted a study (Sherwood et al., 2006) to explore thescience benefits of maintaining GPS receivers on all satellites
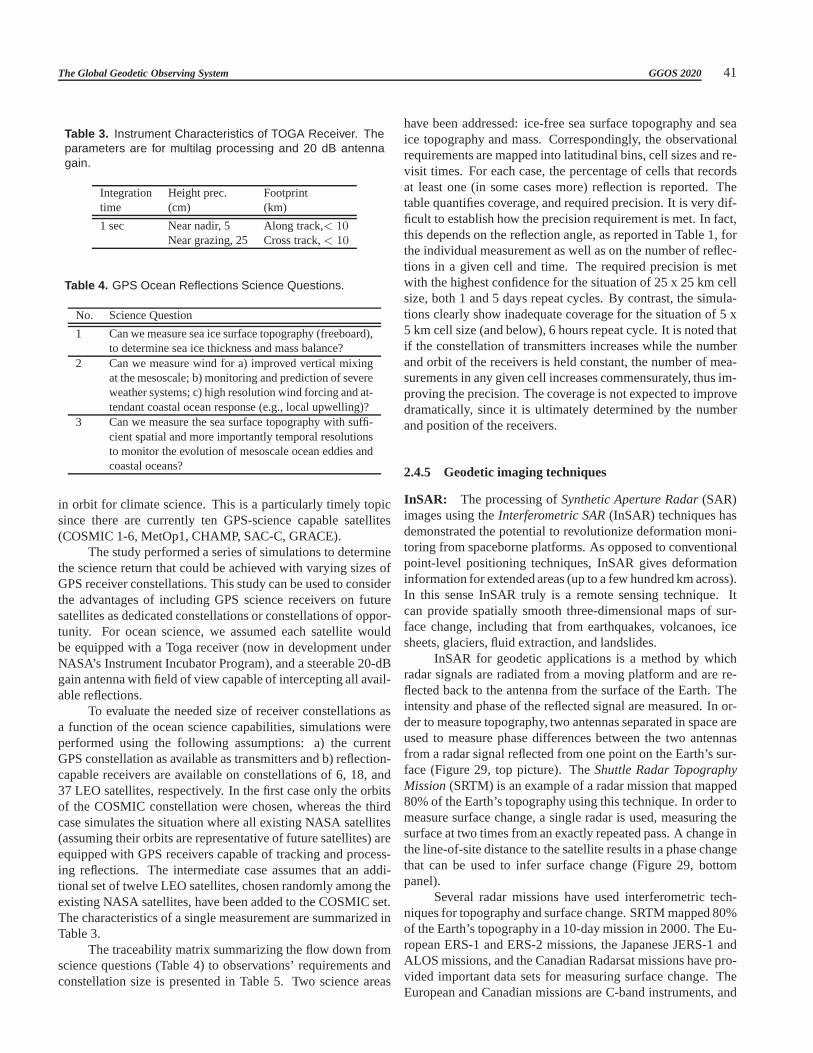
The Global Geodetic Observing System GGOS 2020 41
Table 3. Instrument Characteristics of TOGA Receiver. Theparameters are for multilag processing and 20 dB antennagain.
Integration Height prec. Footprinttime (cm) (km)
1 sec Near nadir, 5 Along track,< 10Near grazing, 25 Cross track,< 10
Table 4. GPS Ocean Reflections Science Questions.
No. Science Question
1 Can we measure sea ice surface topography (freeboard),to determine sea ice thickness and mass balance?
2 Can we measure wind for a) improved vertical mixingat the mesoscale; b) monitoring and prediction of severeweather systems; c) high resolution wind forcing and at-tendant coastal ocean response (e.g., local upwelling)?
3 Can we measure the sea surface topography with suffi-cient spatial and more importantly temporal resolutionsto monitor the evolution of mesoscale ocean eddies andcoastal oceans?
in orbit for climate science. This is a particularly timely topicsince there are currently ten GPS-science capable satellites(COSMIC 1-6, MetOp1, CHAMP, SAC-C, GRACE).
The study performed a series of simulations to determinethe science return that could be achieved with varying sizesofGPS receiver constellations. This study can be used to considerthe advantages of including GPS science receivers on futuresatellites as dedicated constellations or constellationsof oppor-tunity. For ocean science, we assumed each satellite wouldbe equipped with a Toga receiver (now in development underNASA’s Instrument Incubator Program), and a steerable 20-dBgain antenna with field of view capable of intercepting all avail-able reflections.
To evaluate the needed size of receiver constellations asa function of the ocean science capabilities, simulations wereperformed using the following assumptions: a) the currentGPS constellation as available as transmitters and b) reflection-capable receivers are available on constellations of 6, 18,and37 LEO satellites, respectively. In the first case only the orbitsof the COSMIC constellation were chosen, whereas the thirdcase simulates the situation where all existing NASA satellites(assuming their orbits are representative of future satellites) areequipped with GPS receivers capable of tracking and process-ing reflections. The intermediate case assumes that an addi-tional set of twelve LEO satellites, chosen randomly among theexisting NASA satellites, have been added to the COSMIC set.The characteristics of a single measurement are summarizedinTable 3.
The traceability matrix summarizing the flow down fromscience questions (Table 4) to observations’ requirementsandconstellation size is presented in Table 5. Two science areas
have been addressed: ice-free sea surface topography and seaice topography and mass. Correspondingly, the observationalrequirements are mapped into latitudinal bins, cell sizes and re-visit times. For each case, the percentage of cells that recordsat least one (in some cases more) reflection is reported. Thetable quantifies coverage, and required precision. It is very dif-ficult to establish how the precision requirement is met. In fact,this depends on the reflection angle, as reported in Table 1, forthe individual measurement as well as on the number of reflec-tions in a given cell and time. The required precision is metwith the highest confidence for the situation of 25 x 25 km cellsize, both 1 and 5 days repeat cycles. By contrast, the simula-tions clearly show inadequate coverage for the situation of5 x5 km cell size (and below), 6 hours repeat cycle. It is noted thatif the constellation of transmitters increases while the numberand orbit of the receivers is held constant, the number of mea-surements in any given cell increases commensurately, thusim-proving the precision. The coverage is not expected to improvedramatically, since it is ultimately determined by the numberand position of the receivers.
2.4.5 Geodetic imaging techniques
InSAR: The processing ofSynthetic Aperture Radar(SAR)images using theInterferometric SAR(InSAR) techniques hasdemonstrated the potential to revolutionize deformation moni-toring from spaceborne platforms. As opposed to conventionalpoint-level positioning techniques, InSAR gives deformationinformation for extended areas (up to a few hundred km across).In this sense InSAR truly is a remote sensing technique. Itcan provide spatially smooth three-dimensional maps of sur-face change, including that from earthquakes, volcanoes, icesheets, glaciers, fluid extraction, and landslides.
InSAR for geodetic applications is a method by whichradar signals are radiated from a moving platform and are re-flected back to the antenna from the surface of the Earth. Theintensity and phase of the reflected signal are measured. In or-der to measure topography, two antennas separated in space areused to measure phase differences between the two antennasfrom a radar signal reflected from one point on the Earth’s sur-face (Figure 29, top picture). TheShuttle Radar TopographyMission(SRTM) is an example of a radar mission that mapped80% of the Earth’s topography using this technique. In ordertomeasure surface change, a single radar is used, measuring thesurface at two times from an exactly repeated pass. A change inthe line-of-site distance to the satellite results in a phase changethat can be used to infer surface change (Figure 29, bottompanel).
Several radar missions have used interferometric tech-niques for topography and surface change. SRTM mapped 80%of the Earth’s topography in a 10-day mission in 2000. The Eu-ropean ERS-1 and ERS-2 missions, the Japanese JERS-1 andALOS missions, and the Canadian Radarsat missions have pro-vided important data sets for measuring surface change. TheEuropean and Canadian missions are C-band instruments, and

The Global Geodetic Observing System GGOS 2020 42
Table 5. Traceability Matrix from Science Questions to Observation Requirements for GPS Ocean Reflections Measurements.
Cellsize Science Latitude Time Precision Constellation size(km) Question Bin Scale (cm) 6 18 37
2 1 > 60 15 days 5 ≈ 10 < 78% < 90% < 95%1 30 days < 95% 100% 100%2 All lats 6 hours N/A - - -
5 2 All lats 6 hours N/A - < 20% < 25%3 1 day 2 ≈ 10 < 23% < 52% < 75%3 −60 < x < 60 1 day 2 ≈ 10 < 52% < 78% < 90%
10 3 −60 < x < 60 1 day 2 ≈ 10 < 63% < 94% 100%3 5 days < 99% 100% 100%
25 3 −60 < x < 60 1 day 2 ≈ 10 < 95% 100% 100%3 5 days 100% 100% 100%
Figure 29. Principle of InSAR. Two antenna separated inspace can be used to determine topography (top), while anexact repeat pass of a radar instrument can be used to deter-mine topographic or surface change (bottom).
the short wavelength signal decorrelates over vegetated regions.A recently released report of the U.S. National Research Coun-cil (National Research Council, 2007) recommends an L-bandInSAR mission with 8-day repeat to provide global coverageof Earth’s deforming regions. The report recommends a launchin the 2010-2013 time frame, essentially the earliest possiblejuncture.
Successes from radar interferometry include the SRTMtopographic map, discovery of actively inflating volcanoesthat were thought to be dormant (Figure 30), measurement ofinterseismic, coseismic, and postseismic deformation relatedto earthquakes that have truly influenced physical models ofEarth’s crust, observation of incipient landslides, and subsi-dence due to water and oil withdrawal. Long-term system-atic measurements will also provide insight into time depen-dent behavior of earthquake, volcanic, and other solid Earthand cryosphere systems.
The above documents the increasing importance of imagegeodesy. However, a major challenge is still the integration ofpoint and image geodesy (Plag et al., 2007b; DESDynI Writ-ing Committee, 2007). Solid Earth science and many applica-tions require observations of Earth’s surface displacements atthe sub-cm level. Solid Earth processes exhibit temporal scalesfrom seconds (e.g., co-seismic displacements) to secular withrespect to the lifetime of a mission (e.g., isostatic adjustments),and spatial scales from local (e.g., local subsidence, volcanoes)to global (e.g., great earthquakes, glacial isostatic adjustment).This wide range of temporal and spatial scales poses a majorchallenge for the extraction of unbiased surface displacementsfrom InSAR observations.
The determination of surface displacements from InSARrequires at a minimum a high-resolution DEM and informa-tion on tropospheric water vapor content. Additional data ofionospheric TEC, for example, from GPS/GNSS is likely toimprove the correction of ionospheric path-delay based on In-SAR observations alone. Ifa priori deformation models areavailable, tropospheric water vapor content can be estimateddirectly. However, the strategies for an optimal combinationof a priori information on DEM, water vapor, surface defor-mation, and ionospheric TEC are still the object of research.

The Global Geodetic Observing System GGOS 2020 43
Figure 30. Interferograms from ERS showing deformation. Each color cycle corresponds to 5 cm of deformation. Left image:InSAR has revealed that four Andean volcanoes (named on the small interferograms on the left of the image), thought to beinactive, are now known to be rapidly deforming. The top three volcanoes are inflating and Robledo is deflating (Pritchard &Simons, 2002). Right image: Hector Mine earthquake observed from ERS (courtesy G. Peltzer, UCLA).
Particular emphasis should be on consistent treatment of errorsin thea priori information.
The Decadal Survey (National Research Council, 2007)states that a stable global geodetic reference frame is indispens-able for all satellite missions, and this is also true for geodeticimaging missions. For most Earth science applications, thesur-face displacements need to be given relative to such a stable,global geodetic reference frame. For example, for local sealevel studies, coastal subsidence or uplift need to be givenina reference frame well tied to the CM. Glacial isostatic adjust-ment is important for the conversion of ice surface displace-ments into ice volume and mass changes. The deformationof the solid Earth surface due to ice loads has large spatialscales and need to be referred to the same reference frame asthat of the ice surface displacements. Large earthquakes havedisplacement fields exceeding by far the size of several adja-cent images. Likewise, postseismic deformation, which is akey quantity for earthquake process studies, can have spatialscales of the order of 1000 km. For all these phenomena itis crucial to relate the displacements from different interfero-grams to the same unique reference frame in order to capturethe large-scale displacement pattern. However, as discussed inChapter 8 (see also DESDynI Writing Committee, 2007), thepresent approach to the realization of the ITRS has limitationsthat reduce the achievable accuracy and necessitate conceptualimprovements.
In particular for early warning and disaster damage as-sessments, high temporal resolution and low latency are keyrequirements. Typical InSAR missions have repeat periodsof several days of longer. Hazardous volcanoes and unstableslopes can be monitored with such repeat period, but in criti-cal phases, early warning may need much shorter repeat peri-ods. In these cases, supporting measurements with airborneLI-DAR (see below) and InSAR can be used to achieve improvedtemporal resolution. Ground-based GPS/GNSS can also pro-vide a higher temporal resolution, especially if the repeattimeincreases. In cases of earthquakes, landslides, and volcaniceruptions, emergency response requires rapid informationonthe extent of damage. Surface displacements are indicativeofdamage. In order to reduce the latency, again airborne LiDARand InSAR can support the mapping. In all these cases, theappropriate algorithms for the combination of the spaceborne,airborne, andin situ observations need to be developed.
LIDAR: Another imaging technique to be mentioned hereis LIght Detection And Ranging(LIDAR). Based on the sameprinciple as RADAR the lidar instrument transmits light outtoa target (Kavaya, 1999). The transmitted light interacts withand is changed by the target. Some of this light is reflectedand/or scattered back to the instrument where it is analysed.The change in the properties of the light enables some propertyof the target to be determined. The time for the light to travel
The Global Geodetic Observing System GGOS 2020 44
out to the target and back to the lidar is used to determine therange to the target.
There are three basic generic types of lidar:
• Range finders: These are the simplest lidars. They areused to measure the distance from the lidar instrument toa solid or hard target.
• DIfferential Absorption Lidar(DIAL): These LIDARs areused to measure chemical concentrations (such as ozone,water vapor, pollutants) in the atmosphere. A DIAL lidaruses two different laser wavelengths which are selected sothat one of the wavelengths is absorbed by the molecule ofinterest whilst the other wavelength is not. The differencein intensity of the two return signals can be used to deducethe concentration of the molecule being investigated.
• Doppler lidars: These are used to measure the velocity ofa target. When the light transmitted from the lidar hits atarget moving towards or away from the lidar, the wave-length of the light reflected/scattered off the target will bechanged slightly. This is known as a Doppler shift - henceDoppler Lidar. If the target is moving away from the lidar,the return light will have a longer wavelength (sometimesreferred to as a red shift), if moving towards the lidar thereturn light will be at a shorter wavelength (blue shifted).The target can be either a hard target or an atmospherictarget - the atmosphere contains many microscopic dustand aerosol particles which are carried by the wind. Theseare the targets of interest to us as they are small and lightenough to move at the true wind velocity and thus enablea remote measurement of the wind velocity to be made.
2.5 Observing Earth’s rotation
Most Earth rotation observations today originate from the ge-ometric space-geodetic techniques described in the previousSection. In the following, focus is therefore only on the spe-cific aspects related to rotation.
2.5.1 Space-geodetic techniques
VLBI: As described in Section 2.4 VLBI observes radio sig-nals emitted by quasars. These fixed points constitute the ICRF(see Section 2.2), and variations in the orientation of the Earthare measured with respect to the ICRF. This technique is sen-sitive to processes that change the relative position of theradiotelescopes with respect to the source, such as a change in theorientation of the Earth in space or a change in the position ofthe telescopes due to, for example, tidal displacements or tec-tonic motions. If just two telescopes are observing the samesource, then only two components of the Earth’s orientationcan be determined. A rotation of the Earth about an axis paral-lel to the baseline connecting the two radio telescopes doesnotchange the relative position of the telescopes with respectto thesource, and hence this component of the Earth’s orientationisnot determinable from VLBI observations taken on that single
baseline. Multibaseline VLBI observations with satisfactorygeometry can determine all of the components of the Earth’sorientation including their time rates-of-change. In fact, themotion of the axis of rotation of the Earth in space (precessionand nutation) and the rotation angle around the axis of rotationare uniquely monitored by VLBI through its direct connectionto the ICRF.
GNSS: GNSS signals observed by a network of ground sta-tions can be used to determine the orientation of the networkofreceivers as a whole. In practice, in order to achieve higherac-curacy, more sophisticated analysis techniques are employedto determine the EOPs and other quantities such as orbitalparameters of the satellites, positions of the stations, and at-mospheric parameters such as the zenith path delay (Bock &Leppard, 1990; Blewitt, 1993; Beutler et al., 1996; Hofmann-Wellenhof et al., 1997; Leick, 2003). Only polar motion andits time rate-of-change can be independently determined fromGNSS measurements. UT1 cannot be separated from the or-bital elements of the satellites and hence cannot be determinedfrom GNSS data. The time rate-of-change of UT1, which isrelated to the length of the day, can be determined from GNSSmeasurements. But because of the corrupting influence of or-bit error, VLBI measurements are usually used to constrain theGNSS-derived LOD estimates.
SLR and LLR: Although a number of satellites carry retro-reflectors for tracking and navigation purposes (see Sec-tion 2.4.2), the LAGEOS I and II satellites were specificallydesigned and launched to study geodetic properties of the Earthincluding its rotation and are the satellites most commonlyused to determine EOPs. Including range measurements to theEtalon I and II satellites has been found to strengthen the so-lution for the EOPs, so these satellites are now often includedin the process. The EOPs are recovered from the basic rangemeasurements in the course of determining the satellite’s orbitand station coordinates. However, because variations in UT1cannot be separated from variations in the orbital node of thesatellite, which are caused by the effects of unmodeled forcesacting on the satellite, it is not possible to independentlydeter-mine UT1 from SLR measurements. Independent estimates ofthe time rate-of-change of UT1, or equivalently, of LOD, canbe determined from SLR measurements, as can polar motionand its time rate-of-change.
In the case of LLR, the EOPs are typically determinedfrom observations by analyzing the residuals at each station af-ter the lunar orbit and other parameters such as station and re-flector locations have been fit to the range measurements (Stolzet al., 1976; Langley et al., 1981; Dickey et al., 1985). Fromthis single station technique, two linear combinations of UT1and the polar motion parameters can be determined, namely,UT0 and the variation of latitude at that station. A rotationofthe Earth about an axis connecting the station with the originof the terrestrial reference frame does not change the distancebetween the station and the Moon, and hence this component of

The Global Geodetic Observing System GGOS 2020 45
the Earth’s orientation cannot be determined from single stationLLR observations.
DORIS: Processing DORIS observations (see Section 2.4.2)allows the orbit of the satellite to be determined along withother quantities such as station positions and EOPs. As withother satellite techniques, UT1 cannot be determined fromDORIS measurements, but its time rate-of-change can be deter-mined, as can polar motion and its rate-of-change (Willis etal.,2006).
2.5.2 Ring laser gyroscopes
Ring laser gyroscopes are a promising emerging technology fordetermining Earth rotation (Figure 31). Ring lasers are activeSagnac interferometers: two mono-mode laser beams propa-gate in opposite directions around a polygon (ring) circum-scribing an enclosed area. Since the ring laser gyroscope isrotating with the Earth, the effective path length of the beamthat is co-rotating with the Earth is slightly longer than thepath that is counter-rotating with it. Because the effective pathlengths of the two beams differ, their frequencies differ, so theyinterfere with each other to produce a beat pattern. The beatfrequency is strictly proportional to the rate of rotation experi-enced by the entire apparatus. Therefore, ring lasers are verysensitive to rotational, but entirely insensitive to translationalmotion. In fact, the beat frequency is proportional to that com-ponent of the instantaneous angular velocityω(t) of the Earththat is parallel to the normal of the plane of the ring. Ring lasergyroscopes measure the absolute rotation of the Earth in thesense that, in principle, just a single measurement is requiredto determine the Earth’s instantaneous rotation. All of theothertechniques discussed above are relative sensors because theyinfer the Earth’s rotation from the change in the orientation ofthe Earth that takes place between at least two measurementsthat are separated in time.
The sensitivity of the ring laser depends on the area en-closed. Ring lasers with an enclosed area between 1 and 833m2 have been built and they achieved sensor sensitivities reach-ing from5 ·10−10 to 5 ·10−12 rad/s/
√Hz. However, sensitivity
is only one of the important parameters. It is also critical toreduce the instrumentally induced drift.
The most stable ring lasers experience a non-negligibledrift of 2 · 10−6 degrees per hour, several orders of magnitudesmaller than the best known commercial laser gyros. There-fore, these sensors capture the effect of diurnal polar motionand tilt effects from solid Earth tides. Earth rotation variationsare resolved to approximately 1% at integration times of about1 day. Recent progress in reducing the aging of the laser gainmedium substantially reduced the drift by approximately 2 or-ders of magnitude.
Compared to other space-geodetic techniques such asVLBI and GPS, currently, ring lasers have a resolution aboutone order of magnitude worse. However, because ring lasersare local sensors, they are already revealing interesting crustal
Figure 31. Ring laser gyroscope for Earth rotationmonitoring. The picture shows the C-I (upper) ringlaser installed in Canterbury, New Sealand, and the Gring laser at Wettzell, Germany (lower picture). Fromhttp://www.phys.canterbury.ac.nz/research/laser/pictures.-shtml.
deformation effects from a region several hundred kilometersin diameter around the observatory. Furthermore they are oper-ated continuously. Their main advantage over other techniquesis the very high temporal resolution. Within the next decade, asubstantial improvement in sensor stability as well as a muchhigher sensor resolution is expected. Apart from Earth rota-tion research, ring lasers are the first sensors that have showntheir sensitivity for measuring rotations from seismic andtele-seismic events at high resolution. It is expected that this ap-plication will expand the global network of ring lasers consid-erably; a development benefitial for Earth rotation monitoringwith ring lasers.
2.6 Observing Earth’s gravity field
The gravity field of the Earth is observed within situ airborneand spaceborne sensors. Relative gravimetry surveys gravitymainly in order to improve the geoid locally at short wave-lengths but also for exploration purposes. Superconducting andabsolute gravimeters measure temporal variations of gravity lo-cally and stationary at sites at the Earth surface (Sections2.6.1
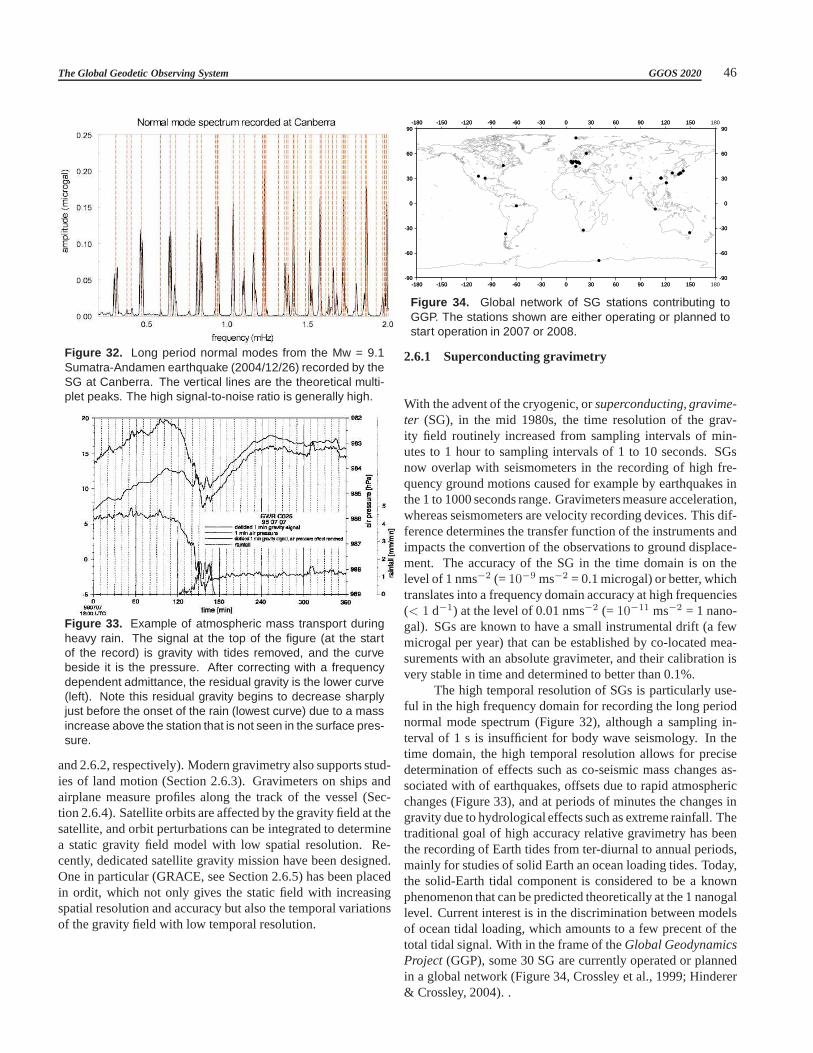
The Global Geodetic Observing System GGOS 2020 46
Figure 32. Long period normal modes from the Mw = 9.1Sumatra-Andamen earthquake (2004/12/26) recorded by theSG at Canberra. The vertical lines are the theoretical multi-plet peaks. The high signal-to-noise ratio is generally high.
Figure 33. Example of atmospheric mass transport duringheavy rain. The signal at the top of the figure (at the startof the record) is gravity with tides removed, and the curvebeside it is the pressure. After correcting with a frequencydependent admittance, the residual gravity is the lower curve(left). Note this residual gravity begins to decrease sharplyjust before the onset of the rain (lowest curve) due to a massincrease above the station that is not seen in the surface pres-sure.
and 2.6.2, respectively). Modern gravimetry also supportsstud-ies of land motion (Section 2.6.3). Gravimeters on ships andairplane measure profiles along the track of the vessel (Sec-tion 2.6.4). Satellite orbits are affected by the gravity field at thesatellite, and orbit perturbations can be integrated to determinea static gravity field model with low spatial resolution. Re-cently, dedicated satellite gravity mission have been designed.One in particular (GRACE, see Section 2.6.5) has been placedin ordit, which not only gives the static field with increasingspatial resolution and accuracy but also the temporal variationsof the gravity field with low temporal resolution.
-90
-60
-30
0
30
60
90
-90
-60
-30
0
30
60
90
-180 -150 -120 -90 -60 -30 0 30 60 90 120 150
-180 -150 -120 -90 -60 -30 0 30 60 90 120 150
-90
-60
-30
0
30
60
90
-90
-60
-30
0
30
60
90
-180 -150 -120 -90 -60 -30 0 30 60 90 120 150 180
-180 -150 -120 -90 -60 -30 0 30 60 90 120 150 180
Figure 34. Global network of SG stations contributing toGGP. The stations shown are either operating or planned tostart operation in 2007 or 2008.
2.6.1 Superconducting gravimetry
With the advent of the cryogenic, orsuperconducting, gravime-ter (SG), in the mid 1980s, the time resolution of the grav-ity field routinely increased from sampling intervals of min-utes to 1 hour to sampling intervals of 1 to 10 seconds. SGsnow overlap with seismometers in the recording of high fre-quency ground motions caused for example by earthquakes inthe 1 to 1000 seconds range. Gravimeters measure acceleration,whereas seismometers are velocity recording devices. Thisdif-ference determines the transfer function of the instruments andimpacts the convertion of the observations to ground displace-ment. The accuracy of the SG in the time domain is on thelevel of 1 nms−2 (= 10−9 ms−2 = 0.1 microgal) or better, whichtranslates into a frequency domain accuracy at high frequencies(< 1 d−1) at the level of 0.01 nms−2 (= 10−11 ms−2 = 1 nano-gal). SGs are known to have a small instrumental drift (a fewmicrogal per year) that can be established by co-located mea-surements with an absolute gravimeter, and their calibration isvery stable in time and determined to better than 0.1%.
The high temporal resolution of SGs is particularly use-ful in the high frequency domain for recording the long periodnormal mode spectrum (Figure 32), although a sampling in-terval of 1 s is insufficient for body wave seismology. In thetime domain, the high temporal resolution allows for precisedetermination of effects such as co-seismic mass changes as-sociated with of earthquakes, offsets due to rapid atmosphericchanges (Figure 33), and at periods of minutes the changes ingravity due to hydrological effects such as extreme rainfall. Thetraditional goal of high accuracy relative gravimetry has beenthe recording of Earth tides from ter-diurnal to annual periods,mainly for studies of solid Earth an ocean loading tides. Today,the solid-Earth tidal component is considered to be a knownphenomenon that can be predicted theoretically at the 1 nanogallevel. Current interest is in the discrimination between modelsof ocean tidal loading, which amounts to a few precent of thetotal tidal signal. With in the frame of theGlobal GeodynamicsProject (GGP), some 30 SG are currently operated or plannedin a global network (Figure 34, Crossley et al., 1999; Hinderer& Crossley, 2004). .

The Global Geodetic Observing System GGOS 2020 47
Figure 35. Variations in absolute gravity at Ucluelet (westerncoast of Vancouver Island) showing some concordance withthe episodic slip and seismic tremor activity above the Cas-cadia subduction zone (figure courtesy of T. Lambert.). Thedownward trend is due to postglacial rebound.
2.6.2 Absolute gravimetry
The low-frequency variations in gravity at a site are usuallydetermined by episodic observations with anabsolute gravime-ter (AG). Today, AG are almost invariably of the free-fall type(FG5) manufactured by microG (now LaCoste-Romberg). Thisinstrument is an absolute measurement device that registers thevalue of gravity over the period of time it takes the mass (asmall corner cube) to traverse approximately one meter in freefall. Typical measurement sessions take a few days. Singledrops carried out every 20 seconds or so have a high scatter,but an accuracy of 1-3 microgal is achieved from the mean ofa large number of drops that are done over typical campaigndurations of several hours to days. In order to extract the sec-ular signal from these observations, high-frequency variationscaused by solid-Earth and ocean loading tides, polar motionand atmospheric loading have to be modeled and corrected for.Hydrological loading is usually not included in these correc-tions.
In order to check the instrument stability and calibra-tion, intercomparisons between AGs are done every few years.These intercomparisons have established agreement at the levelof a few microgal between the best instruments.
AG measurements have been very successful in measur-ing long-term gravity changes such as the post-glacial reboundin regions such as Fennoscandia and North America. For ex-ample, Figure 35 shows the secular trend cause mainly by post-glacial rebound combined with an interesting long-term saw-tooth signal due to episodic slip on the Cascadia subductionzone. In this example the use of a continuous recording SGwould enable interpolation between the AG values and thusgive the time history of each slip event. At many sites it hasbecome common to perform intercomparisons between the SGand AG instruments, both from the point of view of calibratingthe SGs and to monitor the continuous gravity changes during,and in between, the AG observations.
Gravity changes at a point on the Earth’s surface are gen-erally associated with displacements of the Earth surface orsome other processes. The gravity anomaly measured by a
gravimeter is therefore the sum of the effect due to the verti-cal motion of the gravimeter through the unperturbed gravityfield and the contribution from mass changes in the vicinity ofthe gravimeter. In order to separate these two effects, gravime-ters need to be colocated with geometric instruments such asaGNSS receiver. Wahr et al. (1995) discussed combined gravityand geometric observations, which, in principle, can be usedto detect mass changes, for example, in ice sheets, while Plaget al. (2007a) showed that spatially distributed observations ofsecular trends in gravity and vertical displacements constrainthe tie between the RFO and the CM, thus supporting SLR inthis function.
2.6.3 Land movements and terrestrial gravimetry
Among the terrestrial observation techniques used for estimat-ing vertical land movements, gravimetry is a completely inde-pendent method with respect to space geodetic techniques. Thetask of gravimetry is the measurement of gravity, which is themagnitude of the acceleration due to the force of gravity, andof the gravity gradient at the surface of the Earth, or near toit.Time-dependant gravity variations are important in the studyand comprehension of phenomena leading to crustal deforma-tion. The study of crustal deformation plays a key role in thedetermination of mean sea-level changes. A crustal deforma-tion process implies a variation of the position (coordinates)and a variation of the gravity field. This last because the grav-ity field is directly affected by the variation of the position ofthe measuring point (mainly of the vertical component) and be-cause crustal deformation is associated with changes in theden-sity field in the Earth’s interior (due to viscoelastic deforma-tion, pre-seismic dilatancy, dislocation or transfer of internalmasses). Therefore, the combination of gravity and positionchanges allows the computation of changes of the potential andcan provide important information on the dynamics of the phe-nomena (Marson, 2000).
Over the last five decades, gravimetry has made impres-sive progress. The precision of both absolute and relative mea-surements has improved by almost three orders of magnitudeto presently10−9. The instrumental accuracy of the absolutegravimeter FG5 is about 10-20 nms−2 at good stations for a 24hours observation period (Niebauer et al., 1995). Continuousmeasurements are not feasible because of the wear and tear ofthe mechanical system. Van Camp et al. (2005) demonstratedthat gravity trends with uncertainties of 1 nms−2yr−1 can beachieved over a time span of 7 years with annual observations.A technology to measure the temporal variations of the gravityfield continuously at a given site by means of superconductinggravimeters (SG) exists. The SGs are relative instruments butvery stable in time. Absolute gravimeter observations taken atthe location of a SG allows the identification of outliers andthe correction for long-period, mostly environmental signals.In this way the accuracy mentioned above can be achieved ina much shorter time span (Zerbini et al., 2002; Richter et al.,2004). Continuous monitoring of height and gravity changes

The Global Geodetic Observing System GGOS 2020 48
Figure 36. Principle of airborne gravimetry.
allows the separation of the gravity potential signal due tomassredistribution from the geometric signal due to height changesand the sound interpretation of crustal deformation processes(Zerbini et al., 2006).
2.6.4 Airborne gravimetry
Airborne gravity is an effective way to cover the medium-rangewavelengths (10-1000 km) of the Earths’ gravity field, supple-menting the satellite gravity field missions, which at best givesgravity field information for wavelengths longer than some 400km (corresponding to 200 km resolution on the surface). Thehigh-resolution gravity field information is essential fordeter-mining the geoid with sufficient accuracy, especially relevantfor unifying height systems and geometric information aroundcore GGOS sites.
The development of airborne gravity has been made pos-sible by the use of the kinematic GPS technique as well as im-provement in airborne gravity acceleration sensor systems(Fig-ure 36). Current accuracies are routinely in the 1 to5 · 10−5
ms−2 r.m.s. domain, with relatively large differences betweendifferent sensor systems and implementations. Major commer-cial airborne activities are ongoing in connection with geophys-ical exploration for oil and gas; for mining airborne gradiome-try systems at accuracies of 1 E or better have been developedin recent years. Commercial gravity and gradiometry surveyprojects are generally restricted to relatively small areas, anddata are usually not available for more widespread geodeticuse. Long-range airborne gravity surveys for geodetic grav-
ity field applications (geoid and spherical harmonic referencemodels) have been operational since the early 1990s, and manyregions of the Earth has been covered, including major partsof the Arctic, and major countries such as Malaysia, Mongolia,Afghanistan and Ethiopia. Currently US, European, Russianand Chinese groups are active in carrying out such surveys.
Albeit many airborne surveys are currently classified orproprietary, experience has shown that many such surveys mayfully or in part be included in future high-resolution sphericalharmonic reference models. Such reference models, like thecurrent EGM06, complete to degree 2160, would be the majorstatic gravity field product of GGOS. To improve the qualityof such models, generally there is a need for continued surveysin many inaccessible areas of the globe, especially the Ama-zon, mountainous areas, large parts of Africa, coastal regions(high accuracy geoid across the coastal zones) and especiallyAntarctica, which is the largest continental void of gravity onthe globe. Coordinated global surveys should be accompaniedby effort to secure release of terrestrial gravity data, still un-available for large parts of the Earth.
2.6.5 Satellite missions
Artificial satellites have played a dominating role in determingthe gravity field of the Earth since the early sixties (e.g., Kaula,1966). The observations of non-Keplerian variations in or-bital motion using either terrestrial (radio or laser) trackingor space-based GPS have long been analyzed to extract thelong-wavelength components of the gravity fields. Earth grav-ity models such as the EGM96 (Lemoine et al., 1998) useddecades of tracking data to Earth orbiters to derive the meanlong-wavelength gravity models. Determinations of the time-variability were limited to the hemispheric scales, however.The significance of time-variable gravity to climate scienceswas well established from the study of three-decade long timeseries of the Earth’s oblateness (Js), determined from satellitelaser ranging to Lageos satellites, and showing clear signalsfrom PGR, atmospheric and hydrological mass redistribution,and ice-mass changes (e.g., Cheng & Tapley, 2004).
Data from a large number of space missions have con-tributed to the determination of the Earth’s gravity field inthepast. Some recent examples are given in Table 2. In addition,terrestrial and space-based tracking to nearly twenty satellites,some dedicated to geodesy and other missions of opportunity,has contributed to the determination of the Earth’s gravityfieldin the past.
A significant step forward in the determination of thegravity field from satellites with respect to resolution andpreci-sion has been provided by the satellite missions CHAMP (e.g.,Reigber et al., 1999), and GRACE (e.g., Tapley et al., 2004b,a),in orbit since 2000 and 2002, respectively. GRACE (Figure 37)has enabled the improvements in our knowledge of the staticgravity field to centimeter level accuracy in the geoid determi-nation to spherical harmonic degree 70, with further improve-ments forthcoming as longer data spans are analyzed. The up-
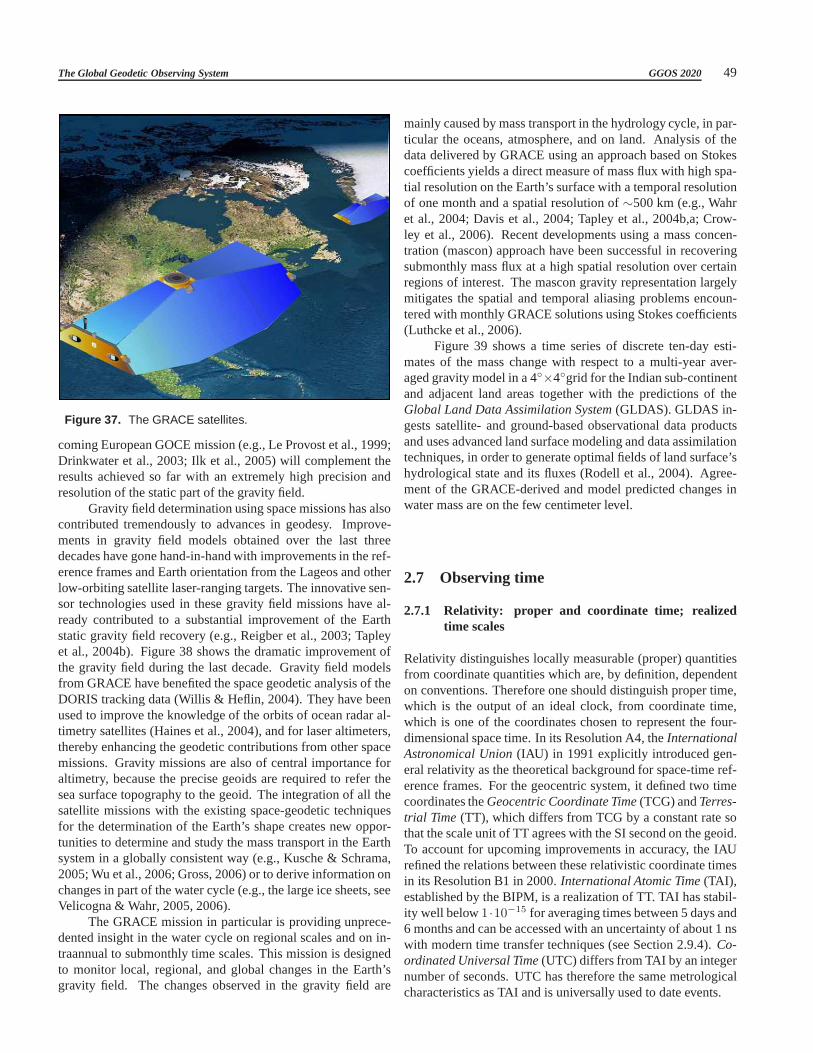
The Global Geodetic Observing System GGOS 2020 49
Figure 37. The GRACE satellites.
coming European GOCE mission (e.g., Le Provost et al., 1999;Drinkwater et al., 2003; Ilk et al., 2005) will complement theresults achieved so far with an extremely high precision andresolution of the static part of the gravity field.
Gravity field determination using space missions has alsocontributed tremendously to advances in geodesy. Improve-ments in gravity field models obtained over the last threedecades have gone hand-in-hand with improvements in the ref-erence frames and Earth orientation from the Lageos and otherlow-orbiting satellite laser-ranging targets. The innovative sen-sor technologies used in these gravity field missions have al-ready contributed to a substantial improvement of the Earthstatic gravity field recovery (e.g., Reigber et al., 2003; Tapleyet al., 2004b). Figure 38 shows the dramatic improvement ofthe gravity field during the last decade. Gravity field modelsfrom GRACE have benefited the space geodetic analysis of theDORIS tracking data (Willis & Heflin, 2004). They have beenused to improve the knowledge of the orbits of ocean radar al-timetry satellites (Haines et al., 2004), and for laser altimeters,thereby enhancing the geodetic contributions from other spacemissions. Gravity missions are also of central importance foraltimetry, because the precise geoids are required to referthesea surface topography to the geoid. The integration of all thesatellite missions with the existing space-geodetic techniquesfor the determination of the Earth’s shape creates new oppor-tunities to determine and study the mass transport in the Earthsystem in a globally consistent way (e.g., Kusche & Schrama,2005; Wu et al., 2006; Gross, 2006) or to derive information onchanges in part of the water cycle (e.g., the large ice sheets, seeVelicogna & Wahr, 2005, 2006).
The GRACE mission in particular is providing unprece-dented insight in the water cycle on regional scales and on in-traannual to submonthly time scales. This mission is designedto monitor local, regional, and global changes in the Earth’sgravity field. The changes observed in the gravity field are
mainly caused by mass transport in the hydrology cycle, in par-ticular the oceans, atmosphere, and on land. Analysis of thedata delivered by GRACE using an approach based on Stokescoefficients yields a direct measure of mass flux with high spa-tial resolution on the Earth’s surface with a temporal resolutionof one month and a spatial resolution of∼500 km (e.g., Wahret al., 2004; Davis et al., 2004; Tapley et al., 2004b,a; Crow-ley et al., 2006). Recent developments using a mass concen-tration (mascon) approach have been successful in recoveringsubmonthly mass flux at a high spatial resolution over certainregions of interest. The mascon gravity representation largelymitigates the spatial and temporal aliasing problems encoun-tered with monthly GRACE solutions using Stokes coefficients(Luthcke et al., 2006).
Figure 39 shows a time series of discrete ten-day esti-mates of the mass change with respect to a multi-year aver-aged gravity model in a 4×4grid for the Indian sub-continentand adjacent land areas together with the predictions of theGlobal Land Data Assimilation System(GLDAS). GLDAS in-gests satellite- and ground-based observational data productsand uses advanced land surface modeling and data assimilationtechniques, in order to generate optimal fields of land surface’shydrological state and its fluxes (Rodell et al., 2004). Agree-ment of the GRACE-derived and model predicted changes inwater mass are on the few centimeter level.
2.7 Observing time
2.7.1 Relativity: proper and coordinate time; realizedtime scales
Relativity distinguishes locally measurable (proper) quantitiesfrom coordinate quantities which are, by definition, dependenton conventions. Therefore one should distinguish proper time,which is the output of an ideal clock, from coordinate time,which is one of the coordinates chosen to represent the four-dimensional space time. In its Resolution A4, theInternationalAstronomical Union(IAU) in 1991 explicitly introduced gen-eral relativity as the theoretical background for space-time ref-erence frames. For the geocentric system, it defined two timecoordinates theGeocentric Coordinate Time(TCG) andTerres-trial Time (TT), which differs from TCG by a constant rate sothat the scale unit of TT agrees with the SI second on the geoid.To account for upcoming improvements in accuracy, the IAUrefined the relations between these relativistic coordinate timesin its Resolution B1 in 2000.International Atomic Time(TAI),established by the BIPM, is a realization of TT. TAI has stabil-ity well below1 ·10−15 for averaging times between 5 days and6 months and can be accessed with an uncertainty of about 1 nswith modern time transfer techniques (see Section 2.9.4).Co-ordinated Universal Time(UTC) differs from TAI by an integernumber of seconds. UTC has therefore the same metrologicalcharacteristics as TAI and is universally used to date events.
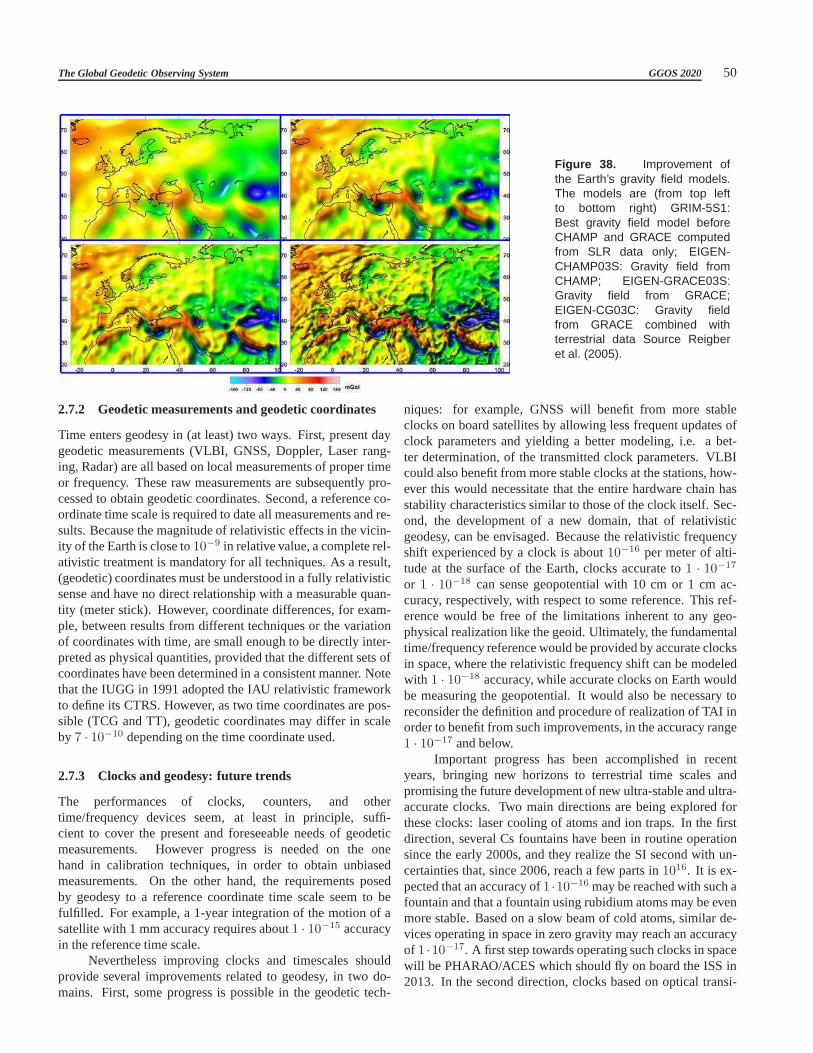
The Global Geodetic Observing System GGOS 2020 50
Figure 38. Improvement ofthe Earth’s gravity field models.The models are (from top leftto bottom right) GRIM-5S1:Best gravity field model beforeCHAMP and GRACE computedfrom SLR data only; EIGEN-CHAMP03S: Gravity field fromCHAMP; EIGEN-GRACE03S:Gravity field from GRACE;EIGEN-CG03C: Gravity fieldfrom GRACE combined withterrestrial data Source Reigberet al. (2005).
2.7.2 Geodetic measurements and geodetic coordinates
Time enters geodesy in (at least) two ways. First, present daygeodetic measurements (VLBI, GNSS, Doppler, Laser rang-ing, Radar) are all based on local measurements of proper timeor frequency. These raw measurements are subsequently pro-cessed to obtain geodetic coordinates. Second, a referenceco-ordinate time scale is required to date all measurements andre-sults. Because the magnitude of relativistic effects in thevicin-ity of the Earth is close to10−9 in relative value, a complete rel-ativistic treatment is mandatory for all techniques. As a result,(geodetic) coordinates must be understood in a fully relativisticsense and have no direct relationship with a measurable quan-tity (meter stick). However, coordinate differences, for exam-ple, between results from different techniques or the variationof coordinates with time, are small enough to be directly inter-preted as physical quantities, provided that the differentsets ofcoordinates have been determined in a consistent manner. Notethat the IUGG in 1991 adopted the IAU relativistic frameworkto define its CTRS. However, as two time coordinates are pos-sible (TCG and TT), geodetic coordinates may differ in scaleby 7 · 10−10 depending on the time coordinate used.
2.7.3 Clocks and geodesy: future trends
The performances of clocks, counters, and othertime/frequency devices seem, at least in principle, suffi-cient to cover the present and foreseeable needs of geodeticmeasurements. However progress is needed on the onehand in calibration techniques, in order to obtain unbiasedmeasurements. On the other hand, the requirements posedby geodesy to a reference coordinate time scale seem to befulfilled. For example, a 1-year integration of the motion ofasatellite with 1 mm accuracy requires about1 · 10−15 accuracyin the reference time scale.
Nevertheless improving clocks and timescales shouldprovide several improvements related to geodesy, in two do-mains. First, some progress is possible in the geodetic tech-
niques: for example, GNSS will benefit from more stableclocks on board satellites by allowing less frequent updates ofclock parameters and yielding a better modeling, i.e. a bet-ter determination, of the transmitted clock parameters. VLBIcould also benefit from more stable clocks at the stations, how-ever this would necessitate that the entire hardware chain hasstability characteristics similar to those of the clock itself. Sec-ond, the development of a new domain, that of relativisticgeodesy, can be envisaged. Because the relativistic frequencyshift experienced by a clock is about10−16 per meter of alti-tude at the surface of the Earth, clocks accurate to1 · 10−17
or 1 · 10−18 can sense geopotential with 10 cm or 1 cm ac-curacy, respectively, with respect to some reference. Thisref-erence would be free of the limitations inherent to any geo-physical realization like the geoid. Ultimately, the fundamentaltime/frequency reference would be provided by accurate clocksin space, where the relativistic frequency shift can be modeledwith 1 · 10−18 accuracy, while accurate clocks on Earth wouldbe measuring the geopotential. It would also be necessary toreconsider the definition and procedure of realization of TAI inorder to benefit from such improvements, in the accuracy range1 · 10−17 and below.
Important progress has been accomplished in recentyears, bringing new horizons to terrestrial time scales andpromising the future development of new ultra-stable and ultra-accurate clocks. Two main directions are being explored forthese clocks: laser cooling of atoms and ion traps. In the firstdirection, several Cs fountains have been in routine operationsince the early 2000s, and they realize the SI second with un-certainties that, since 2006, reach a few parts in1016. It is ex-pected that an accuracy of1 ·10−16 may be reached with such afountain and that a fountain using rubidium atoms may be evenmore stable. Based on a slow beam of cold atoms, similar de-vices operating in space in zero gravity may reach an accuracyof 1 ·10−17. A first step towards operating such clocks in spacewill be PHARAO/ACES which should fly on board the ISS in2013. In the second direction, clocks based on optical transi-
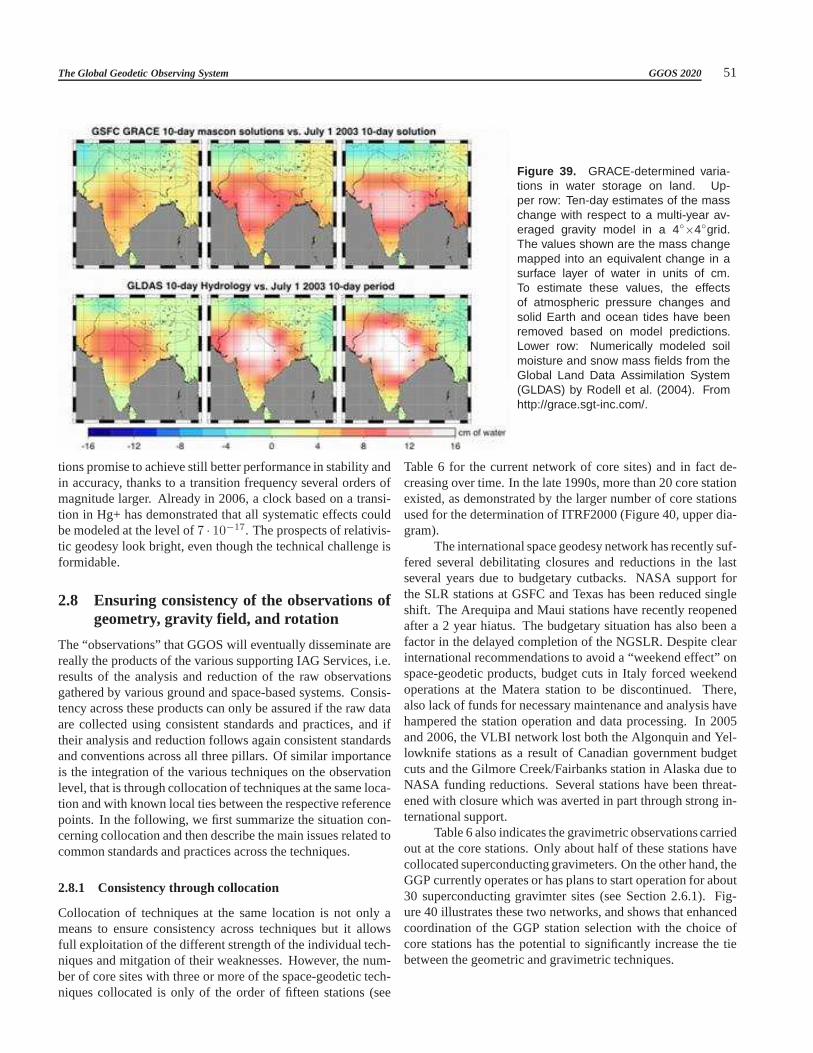
The Global Geodetic Observing System GGOS 2020 51
Figure 39. GRACE-determined varia-tions in water storage on land. Up-per row: Ten-day estimates of the masschange with respect to a multi-year av-eraged gravity model in a 4
×4grid.The values shown are the mass changemapped into an equivalent change in asurface layer of water in units of cm.To estimate these values, the effectsof atmospheric pressure changes andsolid Earth and ocean tides have beenremoved based on model predictions.Lower row: Numerically modeled soilmoisture and snow mass fields from theGlobal Land Data Assimilation System(GLDAS) by Rodell et al. (2004). Fromhttp://grace.sgt-inc.com/.
tions promise to achieve still better performance in stability andin accuracy, thanks to a transition frequency several orders ofmagnitude larger. Already in 2006, a clock based on a transi-tion in Hg+ has demonstrated that all systematic effects couldbe modeled at the level of7 · 10−17. The prospects of relativis-tic geodesy look bright, even though the technical challenge isformidable.
2.8 Ensuring consistency of the observations ofgeometry, gravity field, and rotation
The “observations” that GGOS will eventually disseminate arereally the products of the various supporting IAG Services,i.e.results of the analysis and reduction of the raw observationsgathered by various ground and space-based systems. Consis-tency across these products can only be assured if the raw dataare collected using consistent standards and practices, and iftheir analysis and reduction follows again consistent standardsand conventions across all three pillars. Of similar importanceis the integration of the various techniques on the observationlevel, that is through collocation of techniques at the sameloca-tion and with known local ties between the respective referencepoints. In the following, we first summarize the situation con-cerning collocation and then describe the main issues related tocommon standards and practices across the techniques.
2.8.1 Consistency through collocation
Collocation of techniques at the same location is not only ameans to ensure consistency across techniques but it allowsfull exploitation of the different strength of the individual tech-niques and mitgation of their weaknesses. However, the num-ber of core sites with three or more of the space-geodetic tech-niques collocated is only of the order of fifteen stations (see
Table 6 for the current network of core sites) and in fact de-creasing over time. In the late 1990s, more than 20 core stationexisted, as demonstrated by the larger number of core stationsused for the determination of ITRF2000 (Figure 40, upper dia-gram).
The international space geodesy network has recently suf-fered several debilitating closures and reductions in the lastseveral years due to budgetary cutbacks. NASA support forthe SLR stations at GSFC and Texas has been reduced singleshift. The Arequipa and Maui stations have recently reopenedafter a 2 year hiatus. The budgetary situation has also been afactor in the delayed completion of the NGSLR. Despite clearinternational recommendations to avoid a “weekend effect”onspace-geodetic products, budget cuts in Italy forced weekendoperations at the Matera station to be discontinued. There,also lack of funds for necessary maintenance and analysis havehampered the station operation and data processing. In 2005and 2006, the VLBI network lost both the Algonquin and Yel-lowknife stations as a result of Canadian government budgetcuts and the Gilmore Creek/Fairbanks station in Alaska due toNASA funding reductions. Several stations have been threat-ened with closure which was averted in part through strong in-ternational support.
Table 6 also indicates the gravimetric observations carriedout at the core stations. Only about half of these stations havecollocated superconducting gravimeters. On the other hand, theGGP currently operates or has plans to start operation for about30 superconducting gravimter sites (see Section 2.6.1). Fig-ure 40 illustrates these two networks, and shows that enhancedcoordination of the GGP station selection with the choice ofcore stations has the potential to significantly increase the tiebetween the geometric and gravimetric techniques.
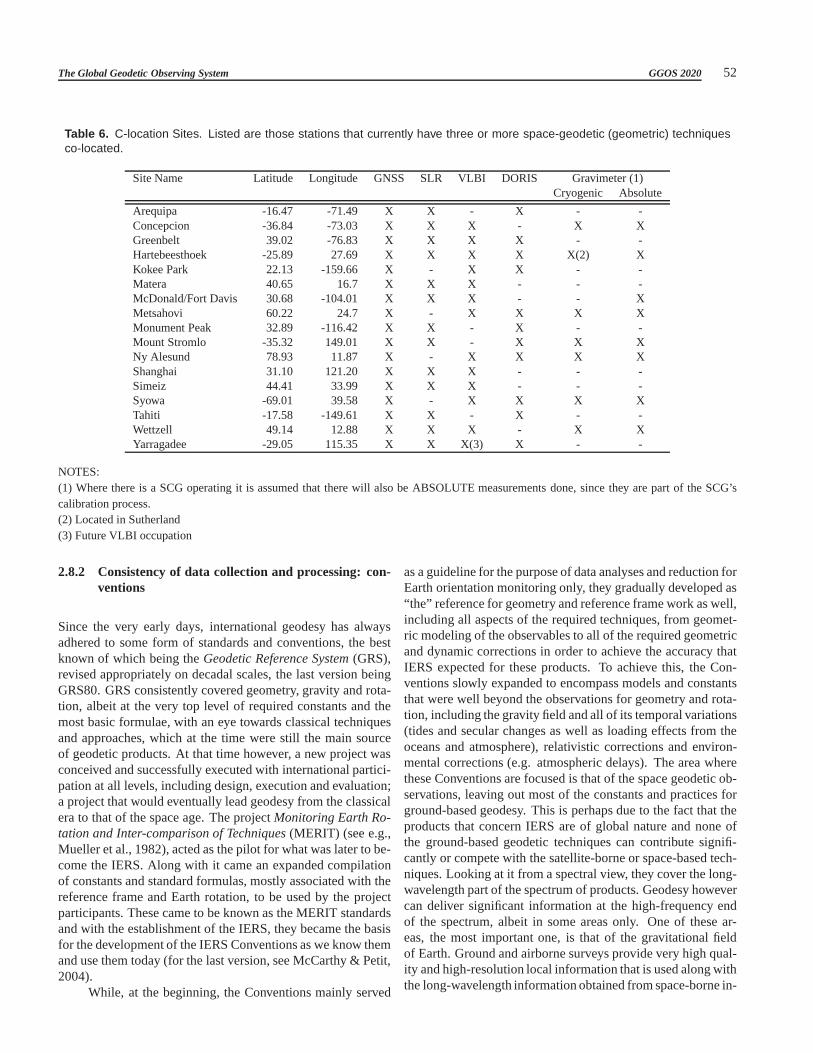
The Global Geodetic Observing System GGOS 2020 52
Table 6. C-location Sites. Listed are those stations that currently have three or more space-geodetic (geometric) techniquesco-located.
Site Name Latitude Longitude GNSS SLR VLBI DORIS Gravimeter(1)Cryogenic Absolute
Arequipa -16.47 -71.49 X X - X - -Concepcion -36.84 -73.03 X X X - X XGreenbelt 39.02 -76.83 X X X X - -Hartebeesthoek -25.89 27.69 X X X X X(2) XKokee Park 22.13 -159.66 X - X X - -Matera 40.65 16.7 X X X - - -McDonald/Fort Davis 30.68 -104.01 X X X - - XMetsahovi 60.22 24.7 X - X X X XMonument Peak 32.89 -116.42 X X - X - -Mount Stromlo -35.32 149.01 X X - X X XNy Alesund 78.93 11.87 X - X X X XShanghai 31.10 121.20 X X X - - -Simeiz 44.41 33.99 X X X - - -Syowa -69.01 39.58 X - X X X XTahiti -17.58 -149.61 X X - X - -Wettzell 49.14 12.88 X X X - X XYarragadee -29.05 115.35 X X X(3) X - -
NOTES:(1) Where there is a SCG operating it is assumed that there will also be ABSOLUTE measurements done, since they are part of the SCG’scalibration process.(2) Located in Sutherland(3) Future VLBI occupation
2.8.2 Consistency of data collection and processing: con-ventions
Since the very early days, international geodesy has alwaysadhered to some form of standards and conventions, the bestknown of which being theGeodetic Reference System(GRS),revised appropriately on decadal scales, the last version beingGRS80. GRS consistently covered geometry, gravity and rota-tion, albeit at the very top level of required constants and themost basic formulae, with an eye towards classical techniquesand approaches, which at the time were still the main sourceof geodetic products. At that time however, a new project wasconceived and successfully executed with international partici-pation at all levels, including design, execution and evaluation;a project that would eventually lead geodesy from the classicalera to that of the space age. The projectMonitoring Earth Ro-tation and Inter-comparison of Techniques(MERIT) (see e.g.,Mueller et al., 1982), acted as the pilot for what was later tobe-come the IERS. Along with it came an expanded compilationof constants and standard formulas, mostly associated withthereference frame and Earth rotation, to be used by the projectparticipants. These came to be known as the MERIT standardsand with the establishment of the IERS, they became the basisfor the development of the IERS Conventions as we know themand use them today (for the last version, see McCarthy & Petit,2004).
While, at the beginning, the Conventions mainly served
as a guideline for the purpose of data analyses and reductionforEarth orientation monitoring only, they gradually developed as“the” reference for geometry and reference frame work as well,including all aspects of the required techniques, from geomet-ric modeling of the observables to all of the required geometricand dynamic corrections in order to achieve the accuracy thatIERS expected for these products. To achieve this, the Con-ventions slowly expanded to encompass models and constantsthat were well beyond the observations for geometry and rota-tion, including the gravity field and all of its temporal variations(tides and secular changes as well as loading effects from theoceans and atmosphere), relativistic corrections and environ-mental corrections (e.g. atmospheric delays). The area wherethese Conventions are focused is that of the space geodetic ob-servations, leaving out most of the constants and practicesforground-based geodesy. This is perhaps due to the fact that theproducts that concern IERS are of global nature and none ofthe ground-based geodetic techniques can contribute signifi-cantly or compete with the satellite-borne or space-based tech-niques. Looking at it from a spectral view, they cover the long-wavelength part of the spectrum of products. Geodesy howevercan deliver significant information at the high-frequency endof the spectrum, albeit in some areas only. One of these ar-eas, the most important one, is that of the gravitational fieldof Earth. Ground and airborne surveys provide very high qual-ity and high-resolution local information that is used along withthe long-wavelength information obtained from space-borne in-

The Global Geodetic Observing System GGOS 2020 53
-90
-60
-30
0
30
60
90
-90
-60
-30
0
30
60
90
-180 -150 -120 -90 -60 -30 0 30 60 90 120 150
-180 -150 -120 -90 -60 -30 0 30 60 90 120 150
-90
-60
-30
0
30
60
90
-90
-60
-30
0
30
60
90
-180 -150 -120 -90 -60 -30 0 30 60 90 120 150 180
-180 -150 -120 -90 -60 -30 0 30 60 90 120 150 180
-90
-60
-30
0
30
60
90
-90
-60
-30
0
30
60
90
-180 -150 -120 -90 -60 -30 0 30 60 90 120 150 180
-180 -150 -120 -90 -60 -30 0 30 60 90 120 150 180
Figure 40. Network of coregeodetic stations and the tem-poral evolution. Upper diagram:Stations used in the determina-tion of ITRF2000, which included25 stations with three collocatedtechniques. Lower diagram: Cur-rent network of core stations withthree or more space-geodeticstations collocated. Circles arecore station, stars indicate theGGP stations (see Section 2.6.1).
struments (CHAMP, GRACE, GOCE), to develop extremelyhigh resolution global Earth gravity models that will neverbederived from space data alone (see, e.g., Reigber et al., 2005,and the upcoming EGM07(2160x2160)). This is the area thatthe Conventions need to cover in more detail, both, in the de-scription of the required constants and the standard formulasand practices in reducing such data. Once this is accomplished,the foundations of all three pillars will be ably supported by thesame, unique set of Conventions and Standards.
While the expansion and enrichment of the existing Con-ventions and Standards is a rather simple task, the actual en-forcement in practice is by far a more challenging task. Whilemost institutions seek to be part of the appropriate IAG Ser-vice in order for their products be granted the seal of approvalfrom that Service, it is usually very difficult to force the re-quired changes in the software and the procedures followed bythat institution to make it conform with the IERS rules. Asmost Services discovered, it took years for the various Analy-sis Centers within a technique to achieve this harmonization. It
will take quite an effort to ensure that this harmonization existsalso across techniques, since the geodetic products are forthemost part a combination of inputs from several if not all of theServices.
An even more difficult and taxing effort will be requiredin making sure that not only the same constants, theoreticalor empirical models, and reduction procedures are consistent,but also all of the background information used in forward-modeling geophysical processes are also consistently derivedand applied in the various analyses and reductions of geodeticobservations.
When all the above are accomplished, there is still go-ing to be an issue concerning the parameterization of the sameeffects across techniques. Recognizing that not all techniquesare equally sensitive (or sensitive at all) to all of the “geodeticproducts”, we will need to identify what parameters each tech-nique should deliver and at what frequency, in order to ensurethat this information can be easily and readily combined withinputs from other techniques. This issue has been given enough

The Global Geodetic Observing System GGOS 2020 54
attention for the set of parameters that cover the geometricandrotational group, with only minor attention given to some verylong-wavelength gravity information.
To some extent this approach has been reasonable sincethe very short wavelength gravitational information is well be-low the sensitivity of any space technique at this point, andfor many years to come. There are other areas though wherepart of such information can be applied in a different form, asa constraint to the results obtained from the global space tech-niques. For example, incorporating some absolute gravity mea-surements at a few points on Earth in the development of a pre-cise orbit from some type of tracking data is practically mean-ingless. On the other hand, imposing a constraint on the heightchange of a tracking station based on repeated absolute gravitymeasurements at that site is a very useful piece of informationindependent of the primary source of data determining the po-sition and motion of that site. A global network of combinedabsolute gravity and space-geodetic stations can constrain thetie between the RFO and CM (Plag et al., 2007a).
Such synergistic use of various inputs with a common,single output can only be done if the information from allsources adheres to one set of conventions.
2.9 Essential additional observations and appli-cations
2.9.1 Atmospheric sounding
Besides the variables of direct geodetic interest, the space-geodetic infrastructure enables soundings of the atmosphereand ionosphere by electromagnetic waves of the GNSS. Prop-erly equipped GNSS receivers on the ground can for exampleobserve the integrated precipitable water vapor content intheatmosphere and the total ionospheric electron content in theionosphere, respectively.
A number of studies conducted in the 1990s have shownthat the amount of precipitable water contained in the neutralatmosphere can, in fact, be retrieved using ground-based GPSreceivers (Figure 41). Assimilation of this information fromground-based GNSS networks into numerical weather forecast-ing models may improve particularly the prediction of extremeevents (e.g., Elgered et al., 2005). Practically, zenith total delayobservations collected by European ground-based GPS stationsare assimilated operationally in numerical weather predictionsince 2006 (Poli et al., 2007).
In addition, it has been demonstrated that a GPS receiveraboard a microsatellite in a low earth orbit, supported by aground-based network of receivers, can be used to collect ob-servations of atmospheric refraction as a function of altitudeduring the event of satellite occultation by the Earth’s atmo-sphere and ionosphere (Figure 42). Thus, the availability ofremote sensing observations from GPS radio occultation sen-sors provides a unique opportunity to improve the quality ofionospheric and meteorological analyses, particularly over thetraditionally under-sampled regions, as well as promise highervertical and temporal resolutions, if a sufficient number ofsen-
Figure 41. Atmospheric sensing with ground-based GPS re-ceivers.
sors is launched and supported by an adequate ground-basedtracking network.
More generally, GNSS radio occultations are particularlypromising for meteorological applications and are alreadyto-day providing routinely information to operational weather ser-vices. Figure 43 shows the spatial coverage achieved by theradio occultation experiments CHAMP, GRACE, and the six-satellite FORMOSAT-3/COSMIC (F3C). Each point on themap corresponds to a radio occultation event probing the neu-tral atmosphere from the near-surface up to the upper strato-sphere (about 40 km altitude) at 200 meter vertical resolu-tion. The data for the points shown were received by nationalweather prediction centers between March 1-7, 2007. Fig-ure 44a shows the zonal mean temperature retrieved from theF3C GPS refraction measurements. Note that in the lower tro-posphere (below about 7 km altitude in the tropics, about 2 kmaltitude in the mid-latitudes), the retrieval of temperature infor-mation from GPS radio occultations requires the use ofa prioriinformation as constraints and hence this information cannotbe considered as completely independent measurements. Thezonal temperature structure observed by the sole F3C retrievalsis consistent with known climatology (for example, tropopausearound 15 km altitude in the tropics, double structure around60 degrees North latitude). As expected, the Tropics present asmaller variability than the mid-latitudes (Figure 44b). Are-gion of strong variability can be observed in the stratosphericNorthern polar vortex as the Arctic region emerges from thewinter polar night. Because of the multitude of receivers, theseresults can be generated with only one week of GPS radio oc-cultation data with high vertical resolution. In the future, moreGNSS receivers in space could decrease the time needed to getsuch a global picture of the atmosphere. The temperatures re-trieved from the GPS radio occultation technique as shown hereare invaluable in the sense that they provide atmospheric physi-cists with a fairly new and now near-complete coverage of theEarth’s atmospheric mass field in the upper troposphere andstratosphere, complementing passive measurements from ex-isting infra-red and micro-wave sounders.

The Global Geodetic Observing System GGOS 2020 55
Figure 42. Geometry of GPS occulta-tion.
Figure 43. Global coverage of GPS ra-dio occultations. Shown are geographiclocations of the soundings collectedby CHAMP, GRACE, and FORMOSAT-3/COSMIC (F3C), 1–7 March 2007, andas received in near-real time by na-tional numerical weather prediction cen-ters. The number of GPS radio occulta-tions collected by each GPS receiver isshown in parentheses.
Another emerging technique for atmospheric soundingis LIDAR, which, in principle, can be used to measure atmo-spheric CO2 (see Section 2.4.5). One currently developed ap-proach is a ground based zenith viewing LIDAR to measureCO2profiles as function of time (roughly hourly) with an al-titude range of a few km, that is essentially to the top of theboundary layer (Burris et al., 2006). The other alternativeis adown-looking CO2 sounder to measure CO2 content in the col-umn below an aircraft or, eventually, from space (Abshire etal.,2007). The implication of these new developments are furtherdiscussed in Section 5.8.1.
2.9.2 Ionospheric remote sensing: one person’s signal isanother person’s noise
The signals from the GNSS satellites must travel through theearth’s ionosphere on their way to receivers on or near theearth’s surface. To achieve the highest possible positioning ac-curacies for geodetic and surveying applications, one mustcor-rect for the propagation delays imposed on the signals by theionosphere. Whereas these effects may be considered a nui-sance by most GNSS users, they will provide the researcherswith an opportunity to use GNSS satellites as a tool to betterunderstand the plasma surrounding the earth. The dispersivenature of the ionosphere makes it possible to measure itsTotalElectron Content(TEC) using dual-frequency e.g., GPS obser-vations collected by ground and space-borne receivers.
There are a number of techniques available to mitigatethe ionospheric effect including global empirical and physics-based ionospheric models. For geodetic applications, the mosteffective technique has been to use dual-frequency GPS obser-vations to estimate TEC. Between 1997 and 2007, the numberof GPS ground receivers has increased approximately by an or-der of magnitude. Currently, there are more than 1500 globally-distributed dual-frequency, ground-based GPS receivers avail-able using publicly accessible networks including, for example,the IGS andContinuously Operating GPS Stations(CORS). Totake advantage of the vast amount of GPS data worldwide, re-searchers use a number of techniques to estimate parameterse.g., satellite and receiver inter-frequency biases, directly af-fecting the GPS TEC measurements of the ionosphere. Mosttechniques estimate vertical ionospheric structure and, simul-taneously, hardware-related biases treated as nuisance param-eters (e.g., Mannucci et al., 1998, 1999; Schaer et al., 1998).Other approaches take advantage of all available GPS receiversand calibrate the biases using processing algorithms basedonGlobal Ionospheric Mapping(GIM) techniques developed atvarious research centers (for illustration using about 1000 GPSstations, see Figure 45). These techniques are designed to es-timate receiver biases for all stations in the global network andsolve for the instrumental biases by modeling the ionosphericdelay and removing it from the observation equation (Komjathyet al., 2005).
We seem to be in the midst of a revolution in ionospheric
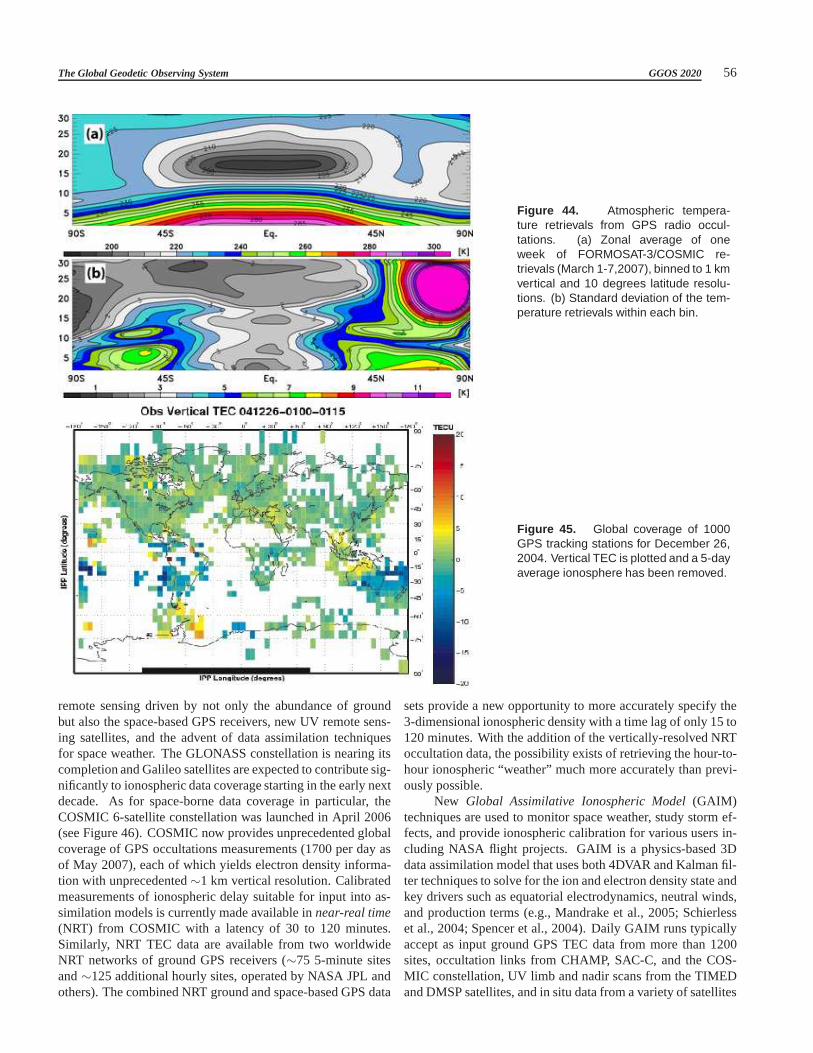
The Global Geodetic Observing System GGOS 2020 56
Figure 44. Atmospheric tempera-ture retrievals from GPS radio occul-tations. (a) Zonal average of oneweek of FORMOSAT-3/COSMIC re-trievals (March 1-7,2007), binned to 1 kmvertical and 10 degrees latitude resolu-tions. (b) Standard deviation of the tem-perature retrievals within each bin.
Figure 45. Global coverage of 1000GPS tracking stations for December 26,2004. Vertical TEC is plotted and a 5-dayaverage ionosphere has been removed.
remote sensing driven by not only the abundance of groundbut also the space-based GPS receivers, new UV remote sens-ing satellites, and the advent of data assimilation techniquesfor space weather. The GLONASS constellation is nearing itscompletion and Galileo satellites are expected to contribute sig-nificantly to ionospheric data coverage starting in the early nextdecade. As for space-borne data coverage in particular, theCOSMIC 6-satellite constellation was launched in April 2006(see Figure 46). COSMIC now provides unprecedented globalcoverage of GPS occultations measurements (1700 per day asof May 2007), each of which yields electron density informa-tion with unprecedented∼1 km vertical resolution. Calibratedmeasurements of ionospheric delay suitable for input into as-similation models is currently made available innear-real time(NRT) from COSMIC with a latency of 30 to 120 minutes.Similarly, NRT TEC data are available from two worldwideNRT networks of ground GPS receivers (∼75 5-minute sitesand∼125 additional hourly sites, operated by NASA JPL andothers). The combined NRT ground and space-based GPS data
sets provide a new opportunity to more accurately specify the3-dimensional ionospheric density with a time lag of only 15to120 minutes. With the addition of the vertically-resolved NRToccultation data, the possibility exists of retrieving thehour-to-hour ionospheric “weather” much more accurately than previ-ously possible.
New Global Assimilative Ionospheric Model(GAIM)techniques are used to monitor space weather, study storm ef-fects, and provide ionospheric calibration for various users in-cluding NASA flight projects. GAIM is a physics-based 3Ddata assimilation model that uses both 4DVAR and Kalman fil-ter techniques to solve for the ion and electron density state andkey drivers such as equatorial electrodynamics, neutral winds,and production terms (e.g., Mandrake et al., 2005; Schierlesset al., 2004; Spencer et al., 2004). Daily GAIM runs typicallyaccept as input ground GPS TEC data from more than 1200sites, occultation links from CHAMP, SAC-C, and the COS-MIC constellation, UV limb and nadir scans from the TIMEDand DMSP satellites, and in situ data from a variety of satellites

The Global Geodetic Observing System GGOS 2020 57
Figure 46. Schematic view of COSMIC ionospheric occultations and the expected 3000 daily profiles.
(DMSP and C/NOFS). Real-Time GAIM (RTGAIM) ingestsmultiple data sources in real time, updates the 3D electron den-sity grid every 5 minutes, and solves for improved drivers every1-2 hours.
The abundance of ground and space-based GPS iono-spheric observations is expected to help create new and ex-citing applications including e.g., space weather monitoringduring ionospheric and geomagnetic storms (e.g., Fedrizziet al., 2005) and developing a tsunami early warning sys-tem using GPS-derived ionospheric signals. Researchers hasshown considerable progress in understanding the geophysicsof tsunami-atmosphere coupling and determine the feasibil-ity of using GNSS technology as part of an improved futuretsunami warning system complementing more traditional meth-ods of tsunami detection.
2.9.3 Tide gauges
Sea level measured by tide gauges is an important parameterfor geodesy for several reasons. For example, geodetic datumsin most countries have been defined historically in terms of sealevel measured at their coasts. A second example concerns thelinkage of GGOS to other components of global observing, no-tably theGlobal Climate Observing System(GCOS) and theGlobal Ocean Observing System(GOOS).
Historical tide gauge records are mainly derived from
float and stilling well devices. Tide gauges based on mechan-ical float devices have lasted for more than 150 years. Still in1983, a survey conducted by theIntergovernmental Oceano-graphic Commission(IOC) of UNESCO showed that 94% ofthe tide gauges were mechanical. The situation has consid-erably changed since then. The floating gauges are progres-sively replaced by new technologies. Modern types of gaugesare mainly based either on the measurement of the subsurfacepressure, or on the measurement of the time of flight of a pulse,acoustic or radar. It is worth pointing out here that, whateverthe technique is employed, the basic quantity provided by tidegauges is an instantaneous height difference between the levelof the sea surface and the level of a fixed point on the adja-cent land. Hence, tide gauges not only record ocean tides butalso a large variety of sea-level signals that can be caused byvariations in atmospheric pressure, density, currents, continen-tal ice melt, as well as vertical motions of the land upon whichthe measurement instrument is located. The recorded processeshave characteristic time scales from several minutes to cen-turies. Many other scientific applications than tidal researchand modelling may therefore benefit from tide gauge records(Woppelmann et al., 2006).
Sea-level data from tide staffs or tide gauges have beenused for more than a century to establish vertical referencesys-tems on land and on sea in order to define the height and depthdatums. The main elements in a height-system definition are an
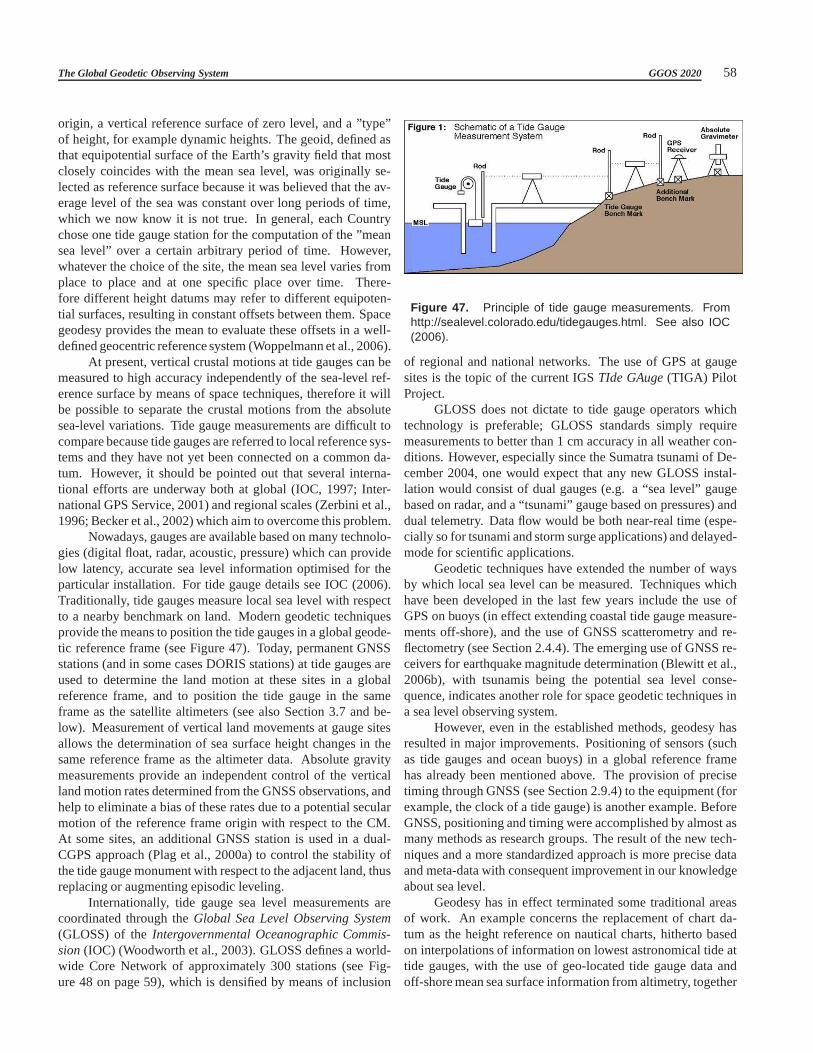
The Global Geodetic Observing System GGOS 2020 58
origin, a vertical reference surface of zero level, and a ”type”of height, for example dynamic heights. The geoid, defined asthat equipotential surface of the Earth’s gravity field thatmostclosely coincides with the mean sea level, was originally se-lected as reference surface because it was believed that theav-erage level of the sea was constant over long periods of time,which we now know it is not true. In general, each Countrychose one tide gauge station for the computation of the ”meansea level” over a certain arbitrary period of time. However,whatever the choice of the site, the mean sea level varies fromplace to place and at one specific place over time. There-fore different height datums may refer to different equipoten-tial surfaces, resulting in constant offsets between them.Spacegeodesy provides the mean to evaluate these offsets in a well-defined geocentric reference system (Woppelmann et al., 2006).
At present, vertical crustal motions at tide gauges can bemeasured to high accuracy independently of the sea-level ref-erence surface by means of space techniques, therefore it willbe possible to separate the crustal motions from the absolutesea-level variations. Tide gauge measurements are difficult tocompare because tide gauges are referred to local referencesys-tems and they have not yet been connected on a common da-tum. However, it should be pointed out that several interna-tional efforts are underway both at global (IOC, 1997; Inter-national GPS Service, 2001) and regional scales (Zerbini etal.,1996; Becker et al., 2002) which aim to overcome this problem.
Nowadays, gauges are available based on many technolo-gies (digital float, radar, acoustic, pressure) which can providelow latency, accurate sea level information optimised for theparticular installation. For tide gauge details see IOC (2006).Traditionally, tide gauges measure local sea level with respectto a nearby benchmark on land. Modern geodetic techniquesprovide the means to position the tide gauges in a global geode-tic reference frame (see Figure 47). Today, permanent GNSSstations (and in some cases DORIS stations) at tide gauges areused to determine the land motion at these sites in a globalreference frame, and to position the tide gauge in the sameframe as the satellite altimeters (see also Section 3.7 and be-low). Measurement of vertical land movements at gauge sitesallows the determination of sea surface height changes in thesame reference frame as the altimeter data. Absolute gravitymeasurements provide an independent control of the verticalland motion rates determined from the GNSS observations, andhelp to eliminate a bias of these rates due to a potential secularmotion of the reference frame origin with respect to the CM.At some sites, an additional GNSS station is used in a dual-CGPS approach (Plag et al., 2000a) to control the stability ofthe tide gauge monument with respect to the adjacent land, thusreplacing or augmenting episodic leveling.
Internationally, tide gauge sea level measurements arecoordinated through theGlobal Sea Level Observing System(GLOSS) of theIntergovernmental Oceanographic Commis-sion(IOC) (Woodworth et al., 2003). GLOSS defines a world-wide Core Network of approximately 300 stations (see Fig-ure 48 on page 59), which is densified by means of inclusion
Figure 47. Principle of tide gauge measurements. Fromhttp://sealevel.colorado.edu/tidegauges.html. See also IOC(2006).
of regional and national networks. The use of GPS at gaugesites is the topic of the current IGSTIde GAuge(TIGA) PilotProject.
GLOSS does not dictate to tide gauge operators whichtechnology is preferable; GLOSS standards simply requiremeasurements to better than 1 cm accuracy in all weather con-ditions. However, especially since the Sumatra tsunami of De-cember 2004, one would expect that any new GLOSS instal-lation would consist of dual gauges (e.g. a “sea level” gaugebased on radar, and a “tsunami” gauge based on pressures) anddual telemetry. Data flow would be both near-real time (espe-cially so for tsunami and storm surge applications) and delayed-mode for scientific applications.
Geodetic techniques have extended the number of waysby which local sea level can be measured. Techniques whichhave been developed in the last few years include the use ofGPS on buoys (in effect extending coastal tide gauge measure-ments off-shore), and the use of GNSS scatterometry and re-flectometry (see Section 2.4.4). The emerging use of GNSS re-ceivers for earthquake magnitude determination (Blewitt et al.,2006b), with tsunamis being the potential sea level conse-quence, indicates another role for space geodetic techniques ina sea level observing system.
However, even in the established methods, geodesy hasresulted in major improvements. Positioning of sensors (suchas tide gauges and ocean buoys) in a global reference framehas already been mentioned above. The provision of precisetiming through GNSS (see Section 2.9.4) to the equipment (forexample, the clock of a tide gauge) is another example. BeforeGNSS, positioning and timing were accomplished by almost asmany methods as research groups. The result of the new tech-niques and a more standardized approach is more precise dataand meta-data with consequent improvement in our knowledgeabout sea level.
Geodesy has in effect terminated some traditional areasof work. An example concerns the replacement of chart da-tum as the height reference on nautical charts, hitherto basedon interpolations of information on lowest astronomical tide attide gauges, with the use of geo-located tide gauge data andoff-shore mean sea surface information from altimetry, together
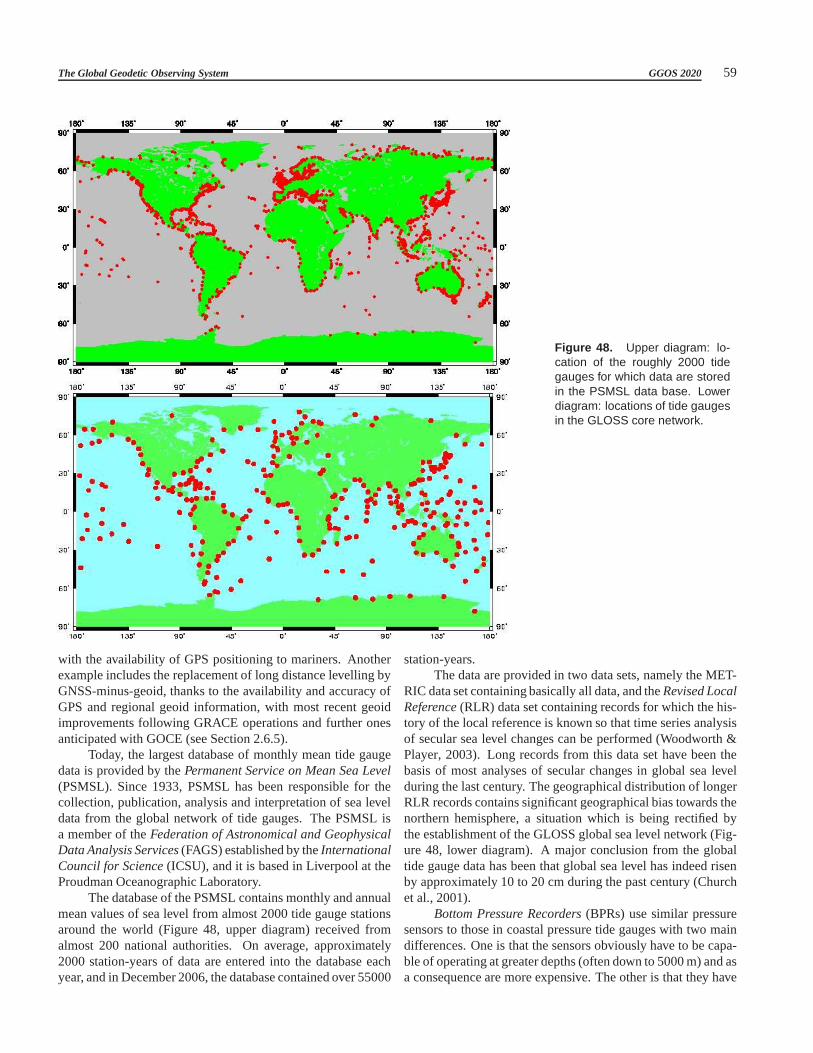
The Global Geodetic Observing System GGOS 2020 59
Figure 48. Upper diagram: lo-cation of the roughly 2000 tidegauges for which data are storedin the PSMSL data base. Lowerdiagram: locations of tide gaugesin the GLOSS core network.
with the availability of GPS positioning to mariners. Anotherexample includes the replacement of long distance levelling byGNSS-minus-geoid, thanks to the availability and accuracyofGPS and regional geoid information, with most recent geoidimprovements following GRACE operations and further onesanticipated with GOCE (see Section 2.6.5).
Today, the largest database of monthly mean tide gaugedata is provided by thePermanent Service on Mean Sea Level(PSMSL). Since 1933, PSMSL has been responsible for thecollection, publication, analysis and interpretation of sea leveldata from the global network of tide gauges. The PSMSL isa member of theFederation of Astronomical and GeophysicalData Analysis Services(FAGS) established by theInternationalCouncil for Science(ICSU), and it is based in Liverpool at theProudman Oceanographic Laboratory.
The database of the PSMSL contains monthly and annualmean values of sea level from almost 2000 tide gauge stationsaround the world (Figure 48, upper diagram) received fromalmost 200 national authorities. On average, approximately2000 station-years of data are entered into the database eachyear, and in December 2006, the database contained over 55000
station-years.The data are provided in two data sets, namely the MET-
RIC data set containing basically all data, and theRevised LocalReference(RLR) data set containing records for which the his-tory of the local reference is known so that time series analysisof secular sea level changes can be performed (Woodworth &Player, 2003). Long records from this data set have been thebasis of most analyses of secular changes in global sea levelduring the last century. The geographical distribution of longerRLR records contains significant geographical bias towardsthenorthern hemisphere, a situation which is being rectified bythe establishment of the GLOSS global sea level network (Fig-ure 48, lower diagram). A major conclusion from the globaltide gauge data has been that global sea level has indeed risenby approximately 10 to 20 cm during the past century (Churchet al., 2001).
Bottom Pressure Recorders(BPRs) use similar pressuresensors to those in coastal pressure tide gauges with two maindifferences. One is that the sensors obviously have to be capa-ble of operating at greater depths (often down to 5000 m) and asa consequence are more expensive. The other is that they have

The Global Geodetic Observing System GGOS 2020 60
Figure 49. NOAA’s DART stations. Top: Loca-tion of NOAA’s DART stations. Bottom: Schematic il-lustration of the DART system. For explanation, seetext. Figures taken from NOAA’s DART system page athttp://www.ndbc.noaa.gov/Dart/dart.shtml.
to be ’absolute’ sensors, recording total pressure at the sea bed,which includes the pressure due to the water plus atmosphericpressure. In coastal pressure gauges, it is more normal to usea ’differential’ sensor, which is compensated for atmosphericpressure, although absolute sensors employed in combinationwith conventional barometers are also available and are pre-ferred by some operators.
Data from deep ocean bottom pressure recorders are par-
ticularly relevant for comparison to temporal space gravity datafrom missions such as GRACE. However, only a few BPRshave been deployed so far explicitly for such comparison pur-poses; the POL BPRs in the SW Atlantic being one example(Hughes et al., 2007).
BPRs have a long history in oceanography, but were de-veloped most intensively in the 1970-1980s for tidal research(Spencer & Vassie, 1997). Instruments were placed on the seabed for typically a year and recovered during a second visit bya research ship. This provided a one-year record which wasadequate for a tidal analysis. More recently, BPRs have beendeployed for longer periods (up to 5 years for the POLMultiYear Return Time Level Equipment, MYRTLE) for non-tidalstudies, such as monitoring the variability of ocean currents.Data retrieval remains a major issue, and recovery by means ofacoustic release of the whole BPR by a ship is still the mainmethod. MYRTLE additionally contains a number of ’data po-dules’ which are released by a timing mechanism at regularintervals (e.g., once a year) with data transmitted from thepod-ule to a satellite when on the surface. The podule itself may berecovered if a ship happens to be nearby but can otherwise beconsidered disposable.
However, this technology can never provide real-time in-formation required for tsunami warning systems. For that, onerequires undersea cables or the use of acoustic transmissionfrom a BPR to a surface buoy. The most advanced systemscurrently in use are theDeep-ocean Assessment and Report-ing of Tsunamis(DART) stations deployed by NOAA mainlyin the Pacific (Figure 49a). DART systems consist of an an-chored seafloor bottom pressure recorder (BPR) and a compan-ion moored surface buoy for real-time communications (Gon-zalez et al., 1998, see Figure 49b). An acoustic link transmitsdata from the BPR on the seafloor to the surface buoy. The dataare then relayed via a GOES satellite link to ground stations(Milburn et al., 1996), which demodulate the signals for imme-diate dissemination to NOAA’s Tsunami Warning Centers.
A major source of uncertainty in understanding sea-levelvariations from tide gauges is the accurate knowledge of ver-tical crustal movements which are embodied in the sea-levelmeasurements. In fact, tide gauges measure sea-level changesas the difference between the height of a geodetic benchmarkattached to the Earth’s crust and the height of the sea sur-face. Vertical land movements need to be accounted for if tidegauge records are to be compared to satellite altimetry mea-surements of sea surface height changes. At global scale, postglacial rebound, a vertical crustal motion due to the isostaticreadjustment of the Earth’s crust to the last deglaciation,is theonly coherent geological contribution to the long-term sea-levelchange for which a thorough understanding of the physical pro-cess has been achieved (Mitrovica et al., 1994; Peltier, 2004).Isostatic adjustment is the process by which the Earth attainsgravitational balance with respect to superimposed forces. If agravitational instability occurs, the crust rises or sinksto com-pensate this instability. Modeling the post-glacial rebound ef-fects, however, still leaves in the vertical crustal rates different
The Global Geodetic Observing System GGOS 2020 61
regional and local isostatic components as well as tectonicef-fects which are difficult to model.
At present, vertical crustal motions at tide gauges can bemeasured to high accuracy by means of space techniques suchas, for example, the GNSS DORIS (Soudarin et al., 1999).Continuous GPS, however, has shown to be the technique ofuse in this particular application due to the ease of use, highprecision, and its direct connection to the ITRF through theproducts of the IGS. On the other hand, by means of simul-taneous GPS measurements performed at tide gauges and atfiducial reference stations of the global reference system,tidegauge benchmarks can be tied in a global well-defined refer-ence system (Becker et al., 2002; Zerbini et al., 1996). Thepossibility to refer the tide gauge data to the same high pre-cision global reference system allows the comparison betweenthe different tide gauge data sets to be made. This was not thecase until about 15 years ago when tide gauge benchmark co-ordinates were mostly available in the different national heightsystems.
The long-term sea-level trends at tide gauge stations ismeasured to about 0.3-0.5 mm/yr (Zerbini et al., 1996), pro-vided that the time series are long enough (20-50 years).The accuracy required by GPS shall be in the same range;tide gauge positions must be monitored at the level of 10mm absolute position error so that a long-term trend witha realistic error of 0.3 mm/yr can be obtained over 20years or so (Becker et al., 2002). The current accuracyof GNSS products is 3, 3, 6 mm for weekly mean val-ues of the north, east and up coordinates respectively and 2,2, 3 mm/yr for the associated linear velocities (see for in-stance http://igscb.jpl.nasa.gov/components/prods.html or Al-tamimi et al., 2002). This ensures that the required accuracy isobtained over a decadal time period. The height determinationusing GPS data is a delicate task because of several reasons,among them, the atmospheric refraction in the troposphere andthe geometric weaknesses in the height component of the GPSin general, and the complicated interactions of the GPS receiverand antenna hardware imperfections (like antenna phase-centervariations and multipath). Moreover, with the exception ofar-eas with natural or anthropogenic subsidence, active tectonicsand strong seismic events, vertical rates are smaller by an orderof magnitude as compared to the horizontal crustal motions,i.e.they are in the mm/yr range (Woppelmann et al., 2006).
2.9.4 Geodetic time and frequency transfer
High-accuracy geodetic methods using dual-frequency GPSobservables are now routinely employed to produce position-ing repeatabilities globally at the centimeter level for one-dayintegrations, as demonstrated for example in products of theIGS. Similarly, the same methods have been shown to pro-duce equivalent global time and frequency comparisons withprecisions approaching about 100 picoseconds at each analy-sis epoch, but whose accuracies are limited to roughly the 1-nslevel because of instrumental calibration uncertainties,particu-
larly for the GPS antennas. Current techniques yield calibrationuncertainties of about 3 ns for standard GPS antennas (Plumbet al., 2005).
The essential ingredients for the geodetic GNSS methodinvolve the availability of dual-frequency carrier phase as wellas pseudorange (code) observables, recorded typically at 30 sintervals, together with an analysis modeling of one-way signalpropagation accurate to the millimeter level. Standard errorsfor GPS phase and code data are about 1 cm and 1 m respec-tively with multipath believed to be the dominant source of er-ror for both. The code data are needed to separate the other-wise indistinguishable clock offset and phase cycle ambiguity.The effect of utilizing both observables in this way is that thenoisier code data are effectively smoothed by the more precisecarrier data and that the overall accuracy of the time transferis determined from the code data; the precision within a con-tinuous analysis arc (typically 1 day) is determined from thequieter carrier data. Formal errors for the geodetic clock esti-mates are typically about 120 ps (3.6 cm), but have been shownto be highly optimistic in many cases. A more realistic mea-sure of the accuracy may be determined by performing a classicrepeatability test, comparing the agreement at successiveanal-ysis arc boundaries. Such a test is only feasible if the under-lying clock stability is sufficient, which effectively restricts itsuse to GPS receivers equipped with an external H-maser fre-quency standard. A detailed analysis of day-boundary clockestimate discontinuities was performed for a subset of stationscontributing to the IGS Combined Clock Products (Ray & Se-nior, 2003, 2005). The analysis showed that performance ishighly site-specific, varies widely among the stations studied,and is independent of the choice of receiver or antenna modelused. In many cases, poor performance or abrupt changes inperformance was traced to changes in equipment or installa-tion problems such as loose cable connections or poor externalfrequency distribution. Some stations showed distinct seasonalvariations in the level of discontinuities which can not be fullyexplained by thermal effects. However, in the best cases siteshave day-boundary discontinuities (rms) that are commensu-rate with the formal errors. The stability floor for the currentstate of the art geodetic time transfer technique has been in-ferred to be about2 · 10−13τ−1/2 for τ intervals up to 1 day,consistent with a random walk process. Deducing the limit ofthe method beyond 1 day will require comparisons using moreprecise frequency standards such as cold atom clocks.
As evidenced in the above performance measure, the limitof geodetic timing is determined from the quality of the pseu-dorange data. Therefore, in order to achieve the highest qualitytime and frequency comparisons, there are some special consid-erations for monumentation and instrumentation which shouldbe made to minimize multipath and signal reflections. Re-ceivers vary widely with respect to their sensitivity to thermaleffects and so thermal control of the receivers is generallynec-essary. Also, phase stable cabling with low thermal sensitivityshould also be employed with cable runs having minimal lengthand environmental exposure. Thermal control of the antennas

The Global Geodetic Observing System GGOS 2020 62
is not required (Ray & Senior, 2001, 2003; Rieck et al., 2003),however the antenna siting should strive to minimize code andphase multipath. Some recent work has also indicated the pos-sibility that long-wavelength multipath from below may alsobe an issue (Ray & Senior, 2005; Elosegui et al., 1995). In thenear future, the largest gains in performance will likely comefrom new GNSS broadcast signal modulations whose multipathcharacteristics are likely to be greatly improved over those ofthe current GPS system.

The Global Geodetic Observing System GGOS 2020 63
3 Understanding a dynamic planet:Earth science requirements forgeodesy
R. Rummel, G. Beutler, V. Dehant, R. Gross, K. H. Ilk, H.-P.Plag, P. Poli, M. Rothacher, S. Stein, R. Thomas, P.L. Wood-worth, S. Zerbini and V. Zlotnicki
3.1 Introduction
The complexity of the Earth system has been discussed in manyfundamental documents in recent years. Trying to understandthe Earth system and improve our forecast capability step bystep are the great challenges of Earth system science. Theopening sentence of the recent NRC report “Earth Science andApplications from Space: Urgent Needs and Opportunities toServe the Nation” (2005) nicely expresses this current situa-tion: “Understanding the complex, changing planet on whichwe live, how it supports life, and how human activities affectits ability to do so in the future is one of the greatest intellec-tual challenges facing humanity. It is also one of the greatestchallenges for society as it seeks to achieve prosperity, healthand sustainability.” Chapter 1 discussed what the role of GGOSwill be in this challenge. It is evident that only a joint effort ofmany scientific disciplines will make it possible to shed morelight into the complexity of the Earth system. Despite enor-mous progress in recent years the uncertainties of predictionsare still rather high. A recent analysis of the deeper reasonforthe limited quality of climate forecasts led to the unanimousconclusion that “data are still poor” (see Hogan, 2005, and thereference therein). Data from space will and must play a cen-tral role in Earth system research. Only satellites are capableof providing data globally, of uniform quality, and with accept-able repetition rate. Moreover, complementary sensor systemscan be combined and data delivered in near real time, (com-pare, e.g., Battrick, 2006). Observations are also the crucialelement of a second central element of Earth system research,up scaling and down scaling. This is the process of establishingrepresentative and reliable connection from local data to globalprocesses and vice versa. Establishment of this connectionwillunify the wide range of temporal and spatial scales in Earthsystem models.
Geodesy is a “measurement discipline” much like as-tronomy. Its modern development and success is intimatelyconnected with progress in space science and engineering.The successes in the scientific applications of satellite and lu-nar laser ranging, microwave satellite ranging, radar altimetry,VLBI and many more result from this development.
Geodetic space techniques have reached a level of matu-rity and precision that make them an important tool for Earthsystem sciences. Important added-value and new areas of ap-plication will result from a combination of the fundamentalthree types of geodetic parameters: surface geometry, Earth
rotation and gravity. This is what GGOS intends to provide.Examples of this modern development are detection and mon-itoring of tectonic, ice and ocean motion, the determinationof mass anomalies and implicitly density anomalies, observa-tion and quantification of mass transport processes in the hy-drosphere and in the oceans, estimation of global and regionalmass changes in the Earth components, separation of the ther-mal and mass components of sea level change, ionospheric andtropospheric sounding.
This chapter deals with the science prospects resultingfrom the GGOS and with the science requirements connectedto this task. There are two dimensions to this theme. One is theanalysis of the challenges geodesy faces in the realizationof aglobal observing system at a precision level of 1 ppb relative toEarth dimension and with decadal stability in space and time.This part will be discussed in Section 3.2. The second dimen-sion is the analysis of the benefits for Earth system science andapplication that will result from GGOS. One can view this fromtwo opposite directions. The first is as Earth scientist; to elab-orate on possible benefits of GGOS for solid Earth geophysics,glaciology, oceanography and climatology. This will be donein Section 3.3 for geophysics, Section 3.4 for glaciology, Sec-tion 3.5 for oceanography, Section 3.6 for weather and climate,Section 3.7 for sea level studies, and Section 3.8 for hydrol-ogy. Alternatively the benefits of GGOS for understanding theEarth system can be considered from the geodesist’s view: theexpected added-value for Earth system sciences resulting froma combination of the three data types surface geometry, Earthrotation and gravity. Taking this perspective Section 3.9 willdeal with mass transport and mass anomalies in Earth system,Section 3.10 will describe the link between Earth rotation andgeophysical fluids, and Section 3.11 explores what Earth rota-tion tells us about core and mantle processes.
In these discussions it is worth noting two uses of theterms “model” and “modeling”. Geodetic models, e.g. grav-ity or Earth rotation models, essentially condense large num-bers of observations (satellite, VLBI and terrestrial data) into ameaningful set of parameters. In contrast, we often use the term“models” to describe the mathematical representation of somegeophysical processes such as climate, atmosphere, ocean,iceor solid Earth. These two types of modeling also appear in thescheme of Figure 50 where the geodetic modeling is termed“observation modeling” while “influence/modeling” referstomodeling in geosciences.
3.2 The scientific and technological challengesfor GGOS
Geodesy is a measuring science. Loosely speaking it providesdata in space, time and gravity at a level of 1 ppb relative tothe Earth’s dimension. One of the novel and most importantfeatures of GGOS results from the integration of the traditionalthree fundamental types of geodetic parameters: surface geom-etry, i.e., the determination and monitoring of the surfaces ofland, ice, and ocean, Earth rotation comprising nutation, po-

The Global Geodetic Observing System GGOS 2020 64
lar motion and variation in length of day, and gravity with theEarth’s gravity field and geoid. This integration will permitthe separation of the thermal and mass contribution to sea levelchange, and the study of mass anomalies, mass transport, andmass exchange in the Earth system.
Global change phenomena are very small and thereforedifficult to measure. Often changes cannot be measured di-rectly but are inferred from data derived by complementary sen-sor and observation systems and by comparison with numericalmodels (see Figure 50 on page 65). A good example is dynamicocean topography. It is derived from accurate radar altimet-ric measurements of the ocean surface along satellite tracks incombination with a geoid surface based on global gravity mod-els derived from the data of gravimetric satellite missions. Bothaltimetry and the geoid model have to refer the same global co-ordinate system, free of any distortion. Processing of altimetry(a data model in Figure 50) requires elimination of effects suchas ionosphere, troposphere, tides and sea state biases and has tobe consistent with a similar processing chain that leads to thegeoid model. Hence a variety of sensor systems, mission char-acteristics, tracking systems, and sampling patterns haveto lead— with high precision — to a unified and consistent model ofdynamic ocean topography. In a second step ocean transportestimates are derived from the assimilation of dynamic oceantopography into global or regional numerical circulation mod-els.
The resulting research challenges are:
1. The various geodetic satellite systems, comprising boththeir instrumentation and observatories that establish thelink from ground stations to the orbiters, have to oper-ate as a global entity in a global reference frame. Thus,space techniques (SLR, VLBI, GPS, DORIS, (differen-tial) INSAR, ocean altimetry, ice altimetry), gravimet-ric space techniques (orbit perturbation analysis, high-low and low-low satellite-to-satellite tracking, satellite ac-celerometry and gradiometry), relevant astrometric tech-niques and missions, and geodetic techniques of atmo-spheric sounding from GNSS satellites to low Earth or-biters or to ground stations have to be unified and inte-grated at the 1 ppb level. Moreover, the global networkof observatories and receivers must operate in one Earthfixed coordinate system at this precision level. Specifi-cally, its 3D positions and geopotential heights must beknown and monitored with such precision and with thesame long term stability over time. For an overview seeTable 1 on page 29.
2. The space segment has to be complemented by terrestrialand airborne/ ship borne techniques and campaigns. Thisimplies the combination of measured data of very differ-ent densitiy and resolution. It may be referred to as thegeodetic ”up and down scaling problem”, (Section 3.1).Terrestrial and airborne measurements serve a threefoldpurpose. They provide calibration and validation to thespace segment, lead to a regional densification in terms of
spatial and temporal resolution and accuracy and are es-sential in the attempt to separate individual geophysicaleffects which can be observed from space only in their su-perposition. The land, ice and ocean surfaces are to bemonitored with high spatial resolution. The required res-olution depends on the surface type (land, ice, or ocean)and on the region (tectonically active zones, major oceancurrents etc.). The latter implies the necessity of estab-lishment and integration of regional projects in areas ofparticular geophysical relevance. These projects have tocomply with the overall GGOS standards. The develop-ment of new terrestrial and airborne/ship borne techniquesneeds attention and encouragement.
3. A link has to be established between the global time se-ries of geodetic parameters delivered by GGOS and rele-vant geophysical process models. This is a demanding andhighly interdisciplinary task that requires a close coopera-tion with geophysicists/geologists, glaciologists, oceanog-raphers, hydrographers and atmospheric physicists. Thus,geodesists will need to be involved into numerical Earthmodeling. The ultimate goal is the development of a com-prehensive Earth model constrained by geodetic time se-ries of global surface processes, rotation parameters, grav-ity models and mass transport and exchange data. Theyshould contribute to our understanding of solid Earth pro-cesses such asGlacial Isostatic Adjustment(GIA), tec-tonic motion, volcanic activity or earthquakes, ice massdynamics and balance and the dynamics of sea ice, thestructure and changes of ocean circulation, and mass andheat transport in the oceans, to the various components ofsea level change and to their separation and quantification,to the global water cycle, and to atmospheric dynamics.
4. The measured temporal variations of Earth rotation andgravity and geoid represent the total integrated effect of allmass changes in the Earth system. Thus, strategies have tobe developed for their separation into individual contribu-tions (although interaction between the various processesat or above the accuracy level may not allow for separa-tion and rather require an integrated modeling approach).The complementarities of satellite techniques, samplingstrategies, formation flights of several satellites, terrestrialcalibration sites, permanent recordings and campaigns andgeophysical models will prove important for this task. Ofsimilar character is the problem of the limited resolutionin time and space of any space configuration, which leadsto aliasing problems that need careful analysis.
The rationale of this program is summarized in Figure 50.The left box lists the most important geodetic measurementtechniques. They have to be processed and combined in a con-sistent manner to form a unified and global observatory. Theyyield geodetic parameter sets and time series for surface geom-etry, Earth rotation and gravity. Their contribution to thestudyof the Earth system results from their introduction, assimila-tion and/ or integration into models of Earth processes. In ad-

The Global Geodetic Observing System GGOS 2020 65
Figure 50. Measuring and modeling the Earth system.
dition to forward modeling, there results a reverse feedback.Improved Earth process modeling can also improve analysis ofthe geodetic parameter sets and lead to a more consistent dataprocessing.
These goals are at the cutting edge of what is possibletoday and in the near future. They require a joint effort intheory, numerical methods, data handling, measurements andcampaigns, instrument development, organization and manage-ment. The defined goals for precision, uniformity, consistencyand stability result in a series of geodetic requirements for allcomponents and stages of geodetic data processing. Several,that are complex and not yet fully understood, have to be re-garded as research topics. Agreement has to be reached interms of:
• fundamental constants;
• geodetic world datum in space, time and geopotential at 1ppm;
• standards;
• geophysical background models (solid Earth and oceantides, atmosphere, oceans, ice, loading, ionosphere, tropo-sphere) used for data reduction, remove-restore steps andseparation of effects;
• combination and comparison of global and regional/localdata;
• determination of field quantities (gravity field) from finitesampling in space and time (aliasing, leakage, truncation,filtering, regularization, etc.);
• complementary measurements from other disciplines.
In the past the use of separate geodetic and geophysicalmodels for data reduction and analysis was acceptable. How-ever, when generating time series of the very small geodetic“global change” parameters, resulting from a combination ofthe three parameter types surface geometry, Earth rotationandgravity, the consistency of these models is mandatory. Develop-ing a unified geodetic Earth system model that is applicable toall geodetic observation techniques is challenging but certainlyworthwhile considering.
A central contribution of geodesy to Earth science is theprovision of a stable reference frame and tools to assign coor-dinates in this reference frame to any point with high accuracy,and spatial and temporal resolution. This enables scientists toreliably monitor processes on land, on ice, and on the oceanwith high short-term accuracy and long-term stability. It hasallowed accurately positioning sensors in motion (e.g. on airplanes, ships, satellites), and thus facilitated the developmentof observation techniques with high spatial coverage. Becausegeodetic observations reflect to the mechanical processes in theEarth system, they constitute a fundamental data set for Earthsciences.
3.3 Solid Earth physics
Space geodesy has revolutionized the study of solid Earth pro-cesses through its ability to measure the deformation of theEarth’s surface and the Earth’s gravity field with extraordinaryaccuracy. These measurements provide our best data about themotion of the great plates of the Earth’s lithosphere, crucial in-sight into the resulting hazards posed by earthquakes and vol-

The Global Geodetic Observing System GGOS 2020 66
canos, and powerful constraints on the forces within the Earththat drive them.
Nonetheless, despite significant progress over the last fewcenturies, many questions remain about fundamental processesin the solid Earth (e.g NASA, 1991a; Solomon & the SolidEarth Science Working Group, 2002; Board on Earth Sciencesand Resources, 2003; Ilk et al., 2005; Space Studies Board,2005; Battrick, 2006). These reflect the complex nature of theEarth system in which chemical, physical, and biological fac-tors jointly yield a highly non-linear system in partial home-ostasies (Lovelock, 1979; Schellnhuber & Wenzel, 1998). Un-derstanding the complex Earth system requires integrated setsof observations on global to regional spatial scales and withhigh spatial and temporal resolution. In the pre-space era,few parameters were observed with global coverage or suffi-cient spatial and temporal resolution. In the space era, this haschanged for many parameters, but not for all.
These limitations of data are being addressed by regionaland global collaborative programs. The NASACrustal Dynam-ics Project(CDP) (Smith & Turcotte, 1993a,b,c) and theWork-ing group of European Geoscientists for the Establishment ofNetworks for Earth-science Research(WEGENER) (Plag et al.,1998a, e.g.,) were established in the beginning of the 1980sasinterdisciplinary programs applying space geodetic and othertechniques to the study of geodynamics and crustal dynam-ics. A recent example is the U.S. EarthScope Program, a majornational undertaking applying modern observational technolo-gies and analytical methods to the study of the structure andevolution of the North American continent and the underly-ing physical processes that cause associated phenomena suchas earthquakes and volcanic eruptions (Carlson & 42 others,2002). Earthscope is developing new facilities for seismology,geodesy, and borehole geophysics, to provide a foundation forfundamental and applied research throughout the United States.This network of geodetic and geophysical instruments is sig-nificantly expanding capabilities to observe the structureandongoing deformation of the North American continent. Earth-Scope seeks to promote multidisciplinary research addressingsome of the grand scientific challenges in Earth science.
Geodetic observations play a major role in these programsbecause they are fundamental for the understanding and mod-eling of Earth system processes. Changes in the Earth’s shape,its gravitational field, and its rotation are caused by externalforces acting on the Earth system and internal processes in-volving mass transfer and exchange of angular and linear mo-mentum. Thus, variations in these geodetic quantities reflectand constrain mechanical and thermo-dynamic processes in theEarth system.
Understanding these processes transcends purely scien-tific goals because these processes have significant societalimpact (Solomon & the Solid Earth Science Working Group,2002). Thus, understanding of these processes and their inter-actions is important for sustainable development and has im-portant consequences.for natural hazard mitigation.
This Section examines some of the scientific problems in
solid Earth physics that would benefit from improved geode-tic observations. In particular, it elaborates on the added-valueof the combination of time-dependant positioning (geometry),Earth rotation and gravity/geoid.
This analysis is designed to motivate the design of thefuture GGOS in terms of requirements for accuracy and res-olution of geodetic observations. Typically, scientific require-ments are simply ’as good as possible’. Nevertheless, we at-tempt to identify quantitative including threshold and target re-quirements that are likely to help distinguish between modelsand hypotheses and thus improve our knowledge significantly.
We also attempt to anticipate the impact of likely tech-nological developments. One is the maturing of geodesy onthe ocean bottom. Because the ocean covers two-third of theEarth’s surface, seafloor geodesy could lead to significantly bet-ter understanding of geodynamic processes. Spiess (1990) pre-dicted thatby the year 2000 we will be discussing at least a fewreal multi-year data sets and using them to constrain our mod-els of the structure and dynamics of the crust beneath the sea-its genesis, its evolution as it moves away from the mid-oceanridges, its destruction in the trenches, and the effects of its in-teraction with continents and islands. However, progress hasbeen slower than anticipated in that statement. The programdocuments of theInternational Year of Planet Earth(IYPE)again emphasize the need to extend geodesy to the ocean floor(Chen et al., 2005).
Another example are time measurements, where accu-racy and daily stability of10−16 should be possible with ACESclocks. Time is the geodetic observable from which geode-tic parameters are derived. The anticipated progress in timemeasurements should significantly improve geodetic measure-ments, and thus make them even more valuable.
Improved geodetic data should advance our understand-ing of many open questions related to mass movements in theEarth system, deformation of the Earth’s surface, and dynamicsof the solid Earth:
• Convection: are the anomalies in seismic velocities de-tected by seismic tomography in the Earth’s mantle dueto chemical anomalies or temperature anomalies? Thisis crucial for the question of whether convection extendsthroughout the whole mantle or is layered, which has ma-jor consequences for the thermal, chemical, and mechani-cal evolution of the Earth.
• Plate tectonics: the location of some plate boundariesand the processes that occur at plate boundaries still posemany questions. Large uncertainties exist particularly forthe ocean bottom, which covers more than two-third ofthe Earth’s surface. Likewise, the extent of deformationzones is uncertain in many regions of the Earth’s surface(see Figure 51). Strain rates which vary in space and time,are known only for parts of the Earth’s surface, as illus-trated by the problems in defining the “stable parts” of thecontinents (e.g., Nocquet et al., 2001) and assessing seis-mic hazards there . The strain field of the ocean floor is

The Global Geodetic Observing System GGOS 2020 67
Figure 51. Model of tectonic plates. The model of the stableparts of the tectonic plates (top) is derived from the strain field(bottom) (Kreemer et al., 2003). The upper diagram showsthe individual stable parts of the plates by different colors. Forlarge areas, the surface is deforming and the exact locationof the plate boundaries is often uncertain.
mostly unknown, which is a severe limitation assessingearthquake and tsunami hazards.
• Ice sheets/glaciers and sea level:there are large uncer-tainties with respect to the ice load history, in particular,for Antarctica. Even the sign of the present-day changesin ice sheets are still not known. Consequently, their con-tribution to sea level changes are highly uncertain.
• Rheology: despite its fundamental importance the appro-priate rheology (linear or non-linear) of the Earth’s mantleand its dependence on time scales (transient versus steady-state) is not well understood. Moreover, understanding theeffect of lateral heterogeneities in mantle and crust (in-cluding plate boundaries) is still in an early stage (Plaget al., 1998b) and models incorporating these effects arejust emerging (e.g., Latychev et al., 2005).
• Core mantle dynamics: much remains to be learnedabout processes at the core-mantle boundary, the dynam-ics of the core, and its coupling with the mantle.
• Hydrological cycle: better quantification of the fluxes be-tween the different reservoirs is required. How large aregroundwater movements? What are the variations in con-tinental water storage?
• Solid Earth response to loading: much remains to belearned about the mass loads on the Earth’s surface, in par-ticular continental water storage, non-tidal ocean loading,and ice loads, and the resultant deformations of the Earths(including gravity changes), which depend on crust andmantle composition and rheology.
• Rotational dynamics: despite recent progress, issues re-main in the areas of the coupling of angular and linear mo-mentum equations, free modes of the ocean on a rotatingEarth, and the forcing of rotational perturbations.
• Tides: validation of ocean tide models and an improvedknowledge of tidal friction is both important on its ownand for analysis of other geodetic data..
• Earthquakes: Plate tectonics provides a general kine-matic framework for relating individual earthquakes to ge-ological deformations . However, understanding earth-quakes as a physical process, as a source of societalhazard, and as manifestations of Earth deformation re-mains a major challenge. Among the fundamental ques-tions remaining are how earthquakes result from the cy-cle of strain accumulation at faults, how rupture begins,and whether earthquakes can be predicted. It is unclearwhy in some areas crustal strains localize on major faults,whereas others show more continuous deformation. It isnot clear how brittle crustal deformation couples to theductile motion of the convecting solid mantle? Such ques-tions connect the study of earthquakes to many basic as-pects of solid-Earth research. (from Board on Earth Sci-ences and Resources, 2003).
• Earth structure: Despite great recent progress, much re-mains unknown about the structure and composition of thedeep Earth, and its relation to lithospheric, asthenospheric,and mantle dynamics.
3.3.1 Plate motion
Space geodesy is revolutionizing tectonics by providing ourfirst measurements of plate motions over time scales of years- rather than millions of years - and our first clear insight intothe motions within the deforming zones at plate boundaries thatcover about 15% of Earth’s surface and are homes to about 40%of the human population.
Using space-based measurements to measure plate mo-tions was suggested by Alfred Wegener when he proposed thetheory of continental drift in 1915. Wegener realized that prov-ing continents moved apart was a formidable challenge. Unfor-tunately, current surveying methods offered no hope of mea-suring these slow motions. Wegener thus decided to measurethe distance between continents using astronomical observa-tions. However, because measuring continental drift called formeasurement accuracies far greater than ever before to showsmall changes in positions over a few years, Wegener’s attemptsfailed, and the idea of continental drift was largely rejected.

The Global Geodetic Observing System GGOS 2020 68
By the 1970s the story was very different. Geologists ac-cepted continental drift, in large part because paleomagneticmeasurements showed that continents had in fact moved overmillions of years. It thus seemed natural to see if modernspace-based technology could accomplish Wegener’s dream ofmeasuring continental motions over a few years. Three basicapproaches were attempted. Each faced formidable technicalchallenges - and all succeeded. Hence plate motions can nowmeasured to precision of a few mm/yr or better using a fewyears of data from systems including VLBI, SLR, and GPS.
Space geodesy measures both the rate and azimuth of themotions between sites, and can thus be used to compute rela-tive plate motions. One of the most important results of spacegeodesy is that plate motions have remained generally steadyover the past few million years. This is shown by the strik-ing agreement between motions measured over a few years byspace geodesy and the predictions of global plate motion mod-els that average over the past several million years. The gen-eral agreement is consistent with the idea that although motionat plate boundaries can be episodic, as in large earthquakes,the viscous asthenosphere damps out the transient motions andcauses steady motion between plate interiors. This steadinessimplies that plate motion models can be used for comparisonwith earthquake data.
Space geodesy also gives detailed views of the spatialdistribution of deformation within broad plate boundary zoneslike western North America, the Mediterranean, and the Hi-malayas. This surmounts a major difficulty faced by geologicplate motion models, which predict only the net motion acrossthe boundary. Hence they give only partial insight into earth-quakes, volcanism, and other deformation occur in boundaryzones. Understanding this deformation is a major geologicalproblem, which also has social relevance because of the result-ing geologic hazards to populated areas. Thus space geodeticdata play a rapidly growing role in assessing hazards and de-veloping strategies to mitigate them.
Building on these successes, space geodesy is poisedfor significant advances in several areas in years to come, Asgeodetic data improve due to additional sites, longer time se-ries, and higher precision analyses, we are likely to see majorprogress on topics including:
• Resolving plate motions in complex boundary zones:Even after the giant 2004 Sumatra earthquake, we knowlittle about the plate geometry and motions that caused it,and hence how often such earthquakes recur. The earth-quake resulted from subduction of the Indian plate beneaththe Burma microplate, a sliver plate between India and thecomplex deforming zone in southeast Asia that can be re-garded as a single Sunda plate or a series of microplates.The southern extent of rupture may be where the sub-ducting plate changes from India to Australia. None ofthe plates’ motions are well constrained, because of thelimited GPS data and because many of the sites are neartrenches and thus influenced by interseismic strain accu-mulation. Similarly, the plate geometry and motions are
very poorly known in areas like NE Eurasia (from Siberiato northern Japan) or the East Africa rift. New GPS andInSAR data, ideally complemented by seafloor geodesy,will be of great value.
• Time variability of plate motions: Space geodesy hasreached the point where discrepancies between plate mo-tions inferred from space geodesy and from geologic mod-els are no longer regarded as necessarily due to errors inone or both techniques. Increasingly, they appear to in-dicate real changes in motions over the past few millionyears. For example, GPS data show that as the Andesmountains grew, the subduction of the Nazca plate be-neath South America slowed. Similarly, we appear to beseeing a slowing of the opening of the South Atlantic, andchanges in the plate motions around the Adriatic. As thesedata improve due to additional sites, longer time series,and higher precision analyses, they will give new insightinto the physical processes changing plate motions.
• Relation between earthquakes and deformation in plateboundary zones: By mapping the present strain fieldsin boundary zones like the eastern Mediterranean, west-ern North America, or the India-Eurasia convergent zone,space geodesy is giving crucial insight into the dynam-ics of these areas. A major research thrust is understand-ing how the geodetic deformation seen today relates tothe historic record of earthquakes and geologic record offaulting. It is becoming increasingly clear that loci of seis-micity and faulting have migrated with time within someboundary zones, and in some places are doing so today.Improved geodetic data are crucial for characterizing theseeffects, modeling their dynamics, and using the results tobetter understand earthquake hazards.
• Intracontinental earthquakes: Space geodesy is givingnew insight into the mysterious, relatively rare, but some-times large, earthquakes within plates. It shows thatthe deformation causing these earthquakes is surprisinglyslow. The geodetic data are being combined with earth-quake locations, focal mechanisms, and other geologi-cal and geophysical data to investigate the motions andstresses within plates and how they give rise to earth-quakes. A growing body of evidence finds that continen-tal intraplate earthquakes often occur in temporal clusterson faults that remain active for some time, and then havelong quiescent periods during which seismicity migratesto other faults. Space geodetic data are letting us ob-serve these processes as they occur today, with importantprospects for hazard estimation.
3.3.2 Earthquake and volcano physics
Space geodesy observes the deformation that occurs during thelong intervals between earthquakes and volcanic eruptions, andthus provides important insight into the physical processes thatcontrol them and for strategies to mitigate their hazards.
The Global Geodetic Observing System GGOS 2020 69
Traditional earthquake and volcanic eruption studies fo-cus on what occurs during these dramatic events and the results,with a goal of understanding the underlying processes. Spacegeodesy can now expand this view by observing the deforma-tion field between events and spanning a broad region around afault or volcano. GPS measurements are being complementedby InSAR from satellites, which does not require monumentson the ground.
The advent of space-based methods like GPS and InSAR,which make collecting geodetic data faster and easier, havemade geodesy and seismic wave studies complementary ap-proaches to earthquake studies. Hence although seismologyand earthquake geodesy had been viewed as distinct, owingto the different instrumentation, earthquake geodesy is increas-ingly viewed as very-low-frequency seismology (or earthquakeseismology as high-frequency geodesy).
In years to come, we expect these advances to continue.In particular we anticipate:
• Continued advances in observing and understanding thephysics of faulting: Space geodetic measurements are pro-viding important information about earthquake mechan-ics. Data from many regions show that significant af-terslip, not detectable seismologically, is a common phe-nomenon. These observations offer insight into the effectsof the stress changes during earthquake, and provide con-straints on the rheology of the lithosphere and astheno-sphere. Such data are of special importance given theemerging view that stress transfer between faults may con-tribute to earthquake triggering. GPS and InSAR data arealso showing transient deformation between earthquakesin some regions, notably at subduction zones, and thusproviding new insight into the processes by which strainaccumulates and hence where and how it can be released.These data are increasingly being used in earthquake andtsunami hazard assessment. In addition, GPS and InSARdata permit comparison of geodetic, seismological, andgeologic estimates of the rates and directions of deforma-tion within active regions. Initial data from around theworld suggest that these rates can be quite different, andshould lead to an improved understanding of the partition-ing between seismic and aseismic deformation. The issueof this partitioning is crucial for seismic hazard assess-ment.
• Major advances in volcano monitoring: Although less ap-preciated by the public, volcanoes can pose dangers justas severe as the weather. Eruptions directly threaten over200 million people worldwide, can potentially knock jetaircraft out of the sky by choking their engines with ash,and can disrupt global commerce by suddenly blanket-ing key regions with thick layers of debris. In contrastto earthquakes, which commonly strike without warning,volcanoes typically show telltale signs of unrest. Nonethe-less, our ability to forecast the timing, magnitude and im-pact of future eruptions is frustratingly imprecise. For ev-
ery major predictive success, like at the Philippines’ Mt.Pinatubo in 1991, which saved over $ 1 billion of equip-ment and tens of thousands of lives, there are tragic fail-ures, like at Colombia’s Nevada del Ruiz in 1985, wheremudflows triggered by a small eruption killed over 25,000people. Most hazardous volcanos are not presently moni-tored, largly due to the costs involved. Space geodetic dataare proving a powerful tool for volcano monitoring. Theyprovide a less expensive, rapid and remote (hence safe)way of measuring surface deformation associated withvolcanic processes, which will both, significantly improveour fundamental understanding of volcanic processes andwill aid in eruption forecasting.
3.3.3 Deep Earth dynamics
Observations of motions at the surface, together with gravitydata that constrain mass distribution at depth, provide crucialconstraints on mantle dynamics and thus the earth’s thermaland mechanical structure and evolution.
Plate tectonics is the primary surface manifestation of theheat engine whose nature and history govern the planet’s ther-mal, mechanical, and chemical evolution. Because the litho-sphere is the cold outer boundary layer of the mantle’s con-vection system, our most important constraint on this systemcomes from the rates and directions of plate motion. Spacegeodetic data are crucial for this purpose, especially via theirability to resolve plate motions on time scales of years for com-parison with those observed over geologic time. Our abilitytoobserve these changes provides important constraints for un-derstanding how they result from plate driving forces. Simi-larly, understanding the deformation pattern in boundary zoneslike mountain belts is prompting new models of the processesat work, some which involve complex interactions between tec-tonics and climate.
Space geodetic data also provide other constraints. GPSand gravity data from the GRACE mission are giving new in-sight into postglacial rebound or glacial isostatic adjustment(GIA), the response of the solid Earth to the changing surfaceload brought about by the waxing and waning of ice sheets andglaciers. In the past 20,000 years GIA has caused up to sev-eral hundred meters of relative sea-level fall and over 100 mof sea-level rise in different parts of North America and Eu-rope. Until recently, present-day observations of GIA werelimited in two important ways. First, horizontal motions couldnot be observed. Second, vertical motions were measured onlyalong coasts via sea and lake level changes, which requires cli-matic and hydrographic corrections. The advent of space-basedgeodesy, which can measure crustal velocities of less than afew mm/yr and provide detailed images of the changing grav-ity field, has changed this situation.
This is important because GIA is the subject of active re-search for three major reasons. First, the delayed responsetodeglaciation is one of the few ways of constraining the viscositystructure of the mantle, which is crucial for understandingthe

The Global Geodetic Observing System GGOS 2020 70
mantle convection process. Second, GIA can provide a pow-erful constraint on the distribution and thickness of ice sincethe last glacial maximum, about 21,000 years ago. Althoughthe general pattern is known from glacial geomorphology, sig-nificant questions remain on which GIA can provide importantinformation. Third, GIA has been suspected to be a major causeof deformation and thus within continental plates interiors.
The gravity data are also important for mapping theEarth’s deep interior. Although we seek to understand the com-position, mineralogy, and temperature at depth, our measure-ments are sensitive instead to parameters like density and seis-mic velocity that can result from various combinations of com-position, mineralogy, and temperature at a various depths.As aresult, our ideas reflect inferences from combining geodetic andseismological data with results from geology, geomagnetism,cosmochemistry, and the physics and chemistry of materialsat high temperature and pressure. These give a snapshot ofthe present stage of the earth’s thermal and chemical evolution,which is our best constraint on the earth’s evolution and crucialin developing our ideas about the other terrestrial planets.
In years to come, we anticipate that the increased densityand accuracy of space geodetic data will dramatically improvemodels of both the rheology of the Earth’s interior and of thehistory of glacial loading. This potential is shown by the factthat although the vertical motions are generally consistent withthe predictions of GIA models, the horizontal data illustrate theneed and opportunity to improve the models via more accuratedescriptions of the ice load and laterally-variable mantlevis-cosity.
3.3.4 Exogenic forces
Mass re-location on the solid Earth’s surface and in the fluidenvelope constantly loads the solid Earth and induces deforma-tions and changes in the gravity field. On time scales of minutesto years, most of the loading is due to mass re-location in at-mosphere, ocean, terrestrial hydrosphere and cryosphere,i.e.the global water cycle. On decadal to century time scales, slowclimatological changes in land water storage, glaciers andicesheets are major sources of loading. The cycle of ice ages withthe associated large changes in ice sheets has typical time scalesof 103 to 104 years. Sediment loading induces significant loadon even longer time scales of up to several million years.
While the theory for the elastic response to loading is welldeveloped (see, e.g., Farrell, 1972), major uncertaintiesexistin the atmospheric, oceanic and hydrological loads (see, e.g.,Van Dam et al., 2003). For ocean tidal loading, the accuracy ofthe ocean tidal models has increased considerably over the lastyears, and the ocean tidal loading signal in surface displace-ment and gravity changes can be predicted with high accuracy,particularly for locations not directly at the coast. For non-tidalocean loading, the ocean bottom pressure field is still a ma-jor source of uncertainty. Uncertainties may be reduced withthe help of gravity satellite missions. For atmospheric loading,the surface pressure field is a major uncertainty (Plag et al.,
2007a), which can be reduce to improved processing. Modelsfor changes in land water storage show still large inter-modeldifferences, indicating large uncertainties. Here, too, satellitegravity missions may be a viable source for improvements.
For longer time scale, the rheology of the Earth’s man-tle and simplifications of the Earth model still constitutessig-nificant contributions to the uncertainties (see, e.g. Plaget al.,1998b). For postglacial rebound, these uncertainties alsoim-pact the ice history derived from relevant observations. Icehistories determined on the basis of spherical symmetric Earthmodels and model predictions of the present-day postglacialrebound signal in surface displacement, gravity field, and rota-tion show a wide range of variations, which in turn hampers theinterpretation of geodetic observations in terms of present-daychanges in, for example, ice sheets and global sea level.
Recent attempts to include lateral heterogeneities in theEarth model (e.g., Latychev et al., 2005) are necessary stepsbut these models are just a beginning. 3-D Earth models need tobe developed. However, results from seismic tomography alsoshow a wide range of possible Earth models and research willhave to focus on these issues in order to improve the interpreta-tion of the geodetic observations in terms of mas re-locations.
3.4 The cryosphere
Ice sheets, glaciers, and sea ice are intricately linked to theEarth’s climate system. They store a record of past climate;they strongly affect surface energy budget, global water cycle,and sea-level change; and they are sensitive indicators of cli-mate change.
Geodesy is crucial for these studies because of its abil-ity to measure the motions of ice masses and changes in theirvolumes. Since the mid 1990s, new geodetic observation tech-niques have shown rapid changes: Arctic sea ice is shrinking,both in extent and thickness; low-latitude glaciers and icecapsare losing mass at rapidly accelerating rates; and even parts ofthe vast ice sheets in Greenland and Antarctica are also shrink-ing.
Various geodetic techniques, largely involving measure-ments from aircraft and, increasingly, from satellites have led tothe recent improvement in our knowledge of what is happeningto ice on Earth. Detailed imagery, at wavelengths ranging fromvisible to microwave, precise altimetry, and measurementsoftemporal changes in gravity have yielded the largest returns:highly-accurate measurements of ice velocity from repeatedGPS surveys; spatially detailed measurements of glacier mo-tion from interferometric SAR (InSAR); ice thickness measure-ments over glaciers and ice sheets from low-frequency radar;ice-sheet thickening/thinning rates over vast areas from laserand radar altimeters; estimates of rates of change of the massof entire ice sheets from satellite measurements of temporalchanges in Earth’s gravity field; time series of sea-ice extentand motion from passive-microwave and SAR images; and rou-tine mapping over almost entire ice sheets of characteristics,such as temperatures, icyness, and wetness, of surface snow.

The Global Geodetic Observing System GGOS 2020 71
Although some of these data have been available for manyyears, recent advances allow much more data to be acquired andallow more accurate quantitative estimates. These advances in-volve both measurement systemsnand improved geodetic ref-erence frames. In particular, many techniques that are nowthe “bread and butter” of glaciological research became pos-sible only after GPS data became easily available and widelyapplied.
The importance of geodesy to ice research is highlightedby the rapid changes in the ice sheets that have been revealedonly recently. Their detection, and investigation of theircauses,would not have been possible without accurate geodesy. A keyquestion posed by these changes was how much could be ex-plained by natural variability in snowfall and melt rates, andhow much required longer-lasting changes in ice-sheet dynam-ics. I Ice velocities measured by interferometric SAR data fromsatellites showed that, in many regions, the observed rapidthin-ning was accompanied by local glacier acceleration, indicatingsubstantial changes in glacier dynamics.
Calculation of highly accurate orbits and aircraft trajecto-ries requires a reliable reference frame and continued trackingof key satellites and Earth crustal motion. This has direct ben-efits for glaciological research by improving the accuracy ofmeasured parameters, such as ice-surface elevation, detectionof temporal changes in ice cover and ice-surface velocities, andindirect benefits, such as improved knowledge of rates of sea-level change and post-glacial uplift.
Until recently, the most reliable information on the massbalance (net rates of mass change) of glaciers and ice sheetswas provided by our knowledge of sea-level change. This pro-vided bounds on how rapidly the mass of land ice could bechanging, that were more reliable than the results of decades ofglaciological measurements. Recent advances in our ability tomeasure ice behaviour have changed this situation. Ten yearsago, it was not possible to determine even whether total masswas increasing or decreasing. Now, measurements show that,over those ten years, ice has contributed an average of about1 mm/yr to sea-level rise. Setting this information in contextrequires accurate measurement of total sea-level change, whichalso depends on geodesy, both to provide a reliable referenceframe to tie together tide gauges from all over the globe, andtoprovide accurate orbits for altimetric satellites used to map sea-level over entire oceans. Results show that recent changes inice mass are responsible for∼30% of a total sea-level increaseof > 3 mm/yr.
There are three ways to measure the mass balance of thelargeice sheets in Greenland and Antarctica: comparison ofto-tal snowfall with total losses; measurement of volume changes,using altimetry of the ice surface; and measurement of tempo-ral changes in gravity that are indicative of mass changes. Allbut the first require correction for changes in the elevationofrock beneath the ice. This is particularly so for interpretationof gravity changes, because rock is much denser than ice. Bynecessity, the required estimates of crustal motion beneath icesheets come from models, which become progressively more
reliable as more information becomes available on actual ver-tical motion. This in turn depends heavily on highly accurategeodetic measurements.
In addition to these approaches for measuring ice-sheetmass balance, changes in length of day and in the direction ofthe Earth’s rotation axis also reveal mass redistribution.Thesetechniques are still under development, but also require precisegeodetic measurements.
3.5 Ocean processes and their climatologicalimplications
Geodetic instrumentation and techniques are at the heart ofpresent day ocean studies. First, geodesy provides preciseposi-tions for shipboard samples or those from floating instruments.Second, geodesy provides direct observations. Satellite altime-try has become an essential input for numerical ocean models.Gravimetric satellites provide the horizontal for altimetric de-terminations of surface pressure gradient. Time varying gravitydata from gravimetric satellites, the latest entry into this field,yields information on time varying ocean heat content and bot-tom currents, as well as ice mass variation, a sensitive indicatorof climate change.
Geodesy will play an increasing role in ocean circulationand climate studies in years to come: It will provide techniquesto monitor the oceans and cryosphere for seasonal to interan-nual changes, which is of immediate societal relevance. Thisability to provide long term climate-quality time series toseeour planet change on decadal time scales must be a fundamen-tal goal of GGOS. Hence the technology should be designed toincrease coverage and resolution and monitor new observables.
3.5.1 Providing the reference frame and the means forprecise positioning
The accurate determination of position at sea is much moredemanding in terms of reference frame than on land, wherelandmarks provide information about position. Marine ob-servations such as a sample from the sea floor, the temper-ature and salinity of seawater,or wind at the surface, requireaccurate measurement of the position of the sensors. Tidegauges are peculiar instruments, always affixed to land, butmeasuring an ocean property (sea level). Their position ina reference frame is essential to determine whether the seasurface went up, or the land surface went down. GPS, andmore general GNSS, has become the standard for all thesemeasurements, although positioning by Argos transmitters(http://www.cls.fr/html/argos/welcomeen.html) is still popu-lar with moving platforms (such as for tracking animals), dueto the low mass and power consumption of the transmitter.GLONASS, and the imminent Galileo constellation will greatlyexpand the positioning service, and thus minimize the length oftime a float needs to be at the surface, while increasing the ac-curacy of its position, and thus of the derived water velocity.This crucial application requires accurate reference frames to

The Global Geodetic Observing System GGOS 2020 72
which highly accurate satellite positions can be referenced. Al-though these reference frames have little visibility outside thegeodetic community and often are taken for granted, they arecrucial to the success of present day ocean studies.
3.5.2 Altimetry and ocean circulation
Satellite radar altimetry has existed for over 30 years, sinceSkylab carried the first radar altimeter. The subsequentTOPEX/POSEIDON (T/P) mission, launched in 1992, and itssuccessor Jason-1, produced a large improvement in accuracyto 4 cm or better overall, which opened the door to a varietyof new discoveries in ocean physics. The largest source of thatimprovement was the precision orbit determination for the al-timeters. Since tides are the largest ocean signal and must beremoved before other signals can be studied, renewed interestin modeling ocean tides was spurred. This not only producedthe most accurate global ocean tidal models to date (Ander-sen et al., 1995), and better estimates of their energy dissipa-tion, but also led to a new understanding of the possible energysource for the meridional overturning circulation, the slow (or-der of 100 years) predominantly vertical transport of waters ofdifferent densities. Another fundamental observation wasthatRossby waves, the slow, westward propagating waves crucialincarrying information from one location in the ocean to another,had a velocity versus latitude function that differed significantlyfrom that in standard theory. This led to a revision of theoriesto describe these waves.
These advances have practical applications. Satellite al-timetry lets us ’see’ an El Nino/Southern Oscillation mode ofinterannual variability in its early stages of development, al-lowing accurate forecasts of its consequences. Radar altimetrylets us map the ocean’s heat content at low latitudes, a quan-tity termed ’hurricane potential’ for its ability to feed thesestorms, thus helping forecast their path and intensity. More-over, global satellite altimetry data are being assimilated intonumerical models of the ocean circulation data to determinethe state of the oceans at any one time which is consistent withocean physics and the available data. This capability has be-come the basis for operational oceanography.
An interesting indirect application of satellite altimetryto ocean circulation studies comes from the close relationshipbetween the shorter scales (order 100 km) of the gravity fieldover the oceans and bathymetry. Thus gravity data are used toderive maps of bathymetry (Smith & Sandwell, 2004) whichprovide information on the ocean bottom roughness that is asource of mixing rate variation (Kunze & Smith, 2004), withdirect effect on climate.
The next generation of instruments should permit furtheradvances. To date radar altimetry uses downward (nadir) point-ing instruments on satellites usually flying alone, or at bestfrom 2 or 3 satellites not intended for joint operation. Thishasprevented extending detailed mapping of coastal waters, wherethe length scales are much shorter than in the deep ocean, andthus shorter than the 150 or 300 km between tracks of nadir
altimeters. We envision several advances: a) an imaging in-strument, essentially an interferometric SAR that draws a wideswath along the ocean, rather than a narrow thin one, b) aconstellation of relatively inexpensive nadir altimeters; thesewould avoid many of the characteristics that made T./P expen-sive, such as an onboard radiometer, etc, paired with one T/Pclass high accuracy altimeter for crossover adjustments, and c)a constellation of satellites of opportunity equipped withan-tennae and electronics capable of detecting reflections from thesignals transmitted by the GPS satellites.
3.5.3 Satellite gravity, ocean circulation and climate
A basic application of satellite gravimetry in oceanography isto provide the horizontal at every point on the ocean surface,because the slope of the sea surface measured by radar altime-try relative to this horizontal is the pressure gradient associatedwith the geostrophic component of surface currents (and theother component, called the Ekman component, is associatedwith winds and has no signal in sea surface height). For this cal-culation, time changes in the gravity field are much smaller thanuncertainties in the mean sea surface. This calculation wasdra-matically improved by the CHAMP and GRACE gravity mis-sions. The surface component of velocity can also be derivedfrom in situdata, with the latter providing the shorter scales andsatellite altimetry minus the geoid providing the longer scales.
Precise measurements of the time variations in the globalgravity field from GRACE offer a powerful new method tostudy the oceans and the cryosphere. Measurements of thetemporal variations in gravity averaged over the global oceansshow the exchange of water between the atmosphere, land,cryosphere, and ocean reservoirs. Such measurements showchanges in deep pressure gradients, indicative of temporalchanges in deep currents or in vertically-averaged currents
When combined with sea surface heights inferred byradar altimetry, the gravity data provide information on thegeographic distribution of monthly or submonthly changes inocean heat content. Altimeter record changes in local watercolumn height, whether produced by expansion due to heat(and, to a lesser extent, salt), or by mass addition, whereasgrav-ity is only sensitive to the latter. Hence the difference revealschanges associated with heat and salt, dominated by the former.
The gravity data also are valuable for cryospheric and cli-matic studies. One of the most dramatic results from GRACEis detection of ice mass losses from Antarctica and Greenland(Velicogna & Wahr, 2005, 2006).
The next section will discuss further applications of time-averaged and time-varying satellite gravity measurements, incombination with other data. Given what has been accom-plished in the 6 and 4 years of the CHAMP and GRACE mis-sions (see Section 2.6.5), both of which were the first of a kindand produced new data scientists were unaccustomed to and arestill learning to exploit, further important discoveries are likelyahead of us.
Because of the long lead times needed to get new satellite

The Global Geodetic Observing System GGOS 2020 73
missions approved, and the need to demonstrate results fromfirst-of-a-kind missions such as CHAMP and GRACE, it is es-sential that further missions to measure the gravity field fromspace, especially its time-varying component, are plannedandbudgeted. GOCE, which is scheduled to launch in 2007 andwill provide much shorter scales of the global gravity field thanCHAMP or GRACE, is an excellent first step.
3.5.4 Synergistic combination of measurements
The greatest power of the measurements discussed abovecomes when two or more technologies measure essentially thesame quantity. For example, surface ocean velocity is measuredboth from space and by surface drifters (although the position-ing relies on GNSS). The velocity includes both Ekman andgeostrophic components, the latter of which is directly linkedto much deeper velocities. After modeling and removing theEkman component, in principle one is left with the geostrophiccomponent. Thus, current efforts are blending the two datatypes to resolve their different scales and error characteristics.
Similarly, time varying ocean heat content distributionscan be obtained from satellite gravity and altimetry, or from seasurface (ARGO) floats. However, owing to limited coverage,data from the ARGO floats need to be combined with GRACEand altimetry time-varying data
A third example of synergistic application of data is esti-mating the flux of moisture from the ocean into the land. Oneapproach combines data from atmospheric sounders that yieldatmospheric water vapor with surface ocean vector wind mea-surements from scatterometers. For comparison, river runofffrom the land can be obtained from poorly constrained cli-matological estimates of evaporation minus precipitationoverland. However, by mass conservation, the balance of the previ-ous terms is the storage of water over the land, and so can beestimated from GRACE data. Ultimately, all the data are as-similated into numerical models to constrain a physically plau-sible description of the coupled system including the oceans,cryosphere, land, and atmosphere. Thus, the satellite dataarecombined with observations at or below the sea surface and as-similated into numerical models of the oceans. The satellitedata improve this process significantly.
3.5.5 Future needs
Longer-term altimeter observations from multiple missions areclearly needed in the future and with sufficient overlap. Sincegravitational field observations, such as those from GRACE,are sensitive to processes that change the Earth’s mass distribu-tion, they can be used to investigate sea level rise and ice sheetvolume changes. Moreover, since the Earth’s gravitationalfieldis not sensitive to the thermal expansion of sea water, observa-tions of the gravitational field can be used in concert with sealevel change observations to separate the change due to ther-mal expansion or contraction from that due to oceanic masschanges, thereby helping to quantify the extent to which green-house warming is sequestered in the oceans. Satellite altime-
try provides measurements of the time-varying sea level which,when assimilated into oceanic general circulation models alongwith other remotely sensed and in situ measurements, provideimproved estimates of the three-dimensional oceanic temper-ature, salinity, and velocity fields. The Earth’s gravitationalfield will change as the ocean-bottom pressure changes, and,under the principle of the conservation of angular momentum,the Earth’s rotation will change as the oceanic angular momen-tum varies due to fluctuations in the ocean-bottom pressure andvelocity fields. These three data sets (satellite altimetry, grav-ity, and Earth rotation) therefore provide a powerful meansofinvestigating the causes and consequences of sea level change(Blewitt et al., 2006a).
3.6 Studies of weather and climate processes
The contribution of geodesy to the study of the weather isfour-fold. Geodesy can help observation and prediction of theweather by (1) geo-referencing meteorological observing sys-tems, (2) providing atmospheric weather models with space-and time-varying gravity fields, (3) collecting observationsof the stratospheric mass and lower tropospheric water va-por fields, and (4) contributing to tracking atmospheric globalchange.
3.6.1 Geo-referencing of all meteorological observations
Since the early days of meteorology, the need for time syn-chronization of atmospheric observations has been recognizedin order to be able to compare simultaneous measurements andestablish a dynamically consistent picture of the weather.Ob-servations must also be referred spatial, both in horizontal andvertical position. As measurements have moved away from theground to be made aloft, from aircraft or balloons, pressurewas chosen as the independent coordinate to reference mea-surements in the vertical. Horizontal positioning was obtainedby various systems and now more commonly by GPS. Thesein situ measurements are now complemented by thousands ofremote measurements from satellites. Many of these are pas-sive emissions for which vertical positioning does not apply.However, more and more such measurements are (and will be)LIDAR returns and limb sounding radio occultation refraction(or delay) data, both with an unprecedented vertical accuracy.In order to exploit these measurements and use them in combi-nation with in situ measurements, considering all atmosphericmeasurements in a single reference frame is crucial .
TheWorld Meteorological Organization(WMO) recently(November 2006) adopted a world geodetic system and globalgeoid model for positioning all weather observing stations. Me-teorological measurements reported to WMO are now locatedin the horizontal (latitude, longitude) using WGS-84, and in thevertical (altitude) with respect to EGM-96. Hence the contin-ued improvement of these reference frames is a powerful toolfor meteorologists. The close alignment of WGS-84 to ITRFensures the accuracy of WGS-84.

The Global Geodetic Observing System GGOS 2020 74
3.6.2 Providing atmospheric weather models with space-and time-varying gravity fields
Weather observations today are assimilated into numericalmodels to predict the weather and issue forecasts. Most of thesemodel atmospheric circulation assuming a perfectly sphericalEarth, a constant gravity acceleration, and a thin layer of atmo-sphere. However, the use of observations from the real worldforces atmospheric models to recreate surface pressure fieldsconsistent with observations and in line with the actual shapeof the Earth. It is currently only in that process where the modelassumptions of spherical symmetry and constant gravity arestarting to be accounted for. Future, atmospheric models coulduse geodetic data to refining some of these assumptions.
Geodesy could provide weather models with three-dimensional gravity fields at regular time intervals. Thesefieldswould be used to map the observations’ altitudes onto geopo-tential heights and constrain newer models whose dynamicshave been upgraded to account for non-constant gravity fields.
3.6.3 Collecting observations of the upper-atmosphericmass and lower tropospheric water vapor fields
Extreme weather events are often associated with significantrainfall and latent heat release. The prediction of the timingand intensity of these events is critical to ensure proper warningand preparation of the affected populations. Although atmo-spheric water vapor is currently observed globally, using pas-sive sounders andin situ measurements, the time- and space-resolution is too poor to support efficient warning for extremeevents.
This situation is changing due to space-based geodesy.Instruments using GPS and VLBI technology rely on radiosignals that traverse the atmosphere between platforms on theground and space-based instruments or distant radio sourcesoutside the atmosphere. These signals are modified by theatmosphere, which introduces a noise from the geodesist’spoint of view that is now routinely accounted for to yieldatmospheric-corrected geodetic observations. The converse ofthat process is that geodesy produces atmospheric observationsfrom the complex web of radio links that constitute the core ofGGOS.
Weather prediction already benefits from atmospheric ob-servations made from the ground with GPS receivers (e.g. El-gered et al., 2005). For example, Meteo France now uses obser-vations of zenith radio path delays as part of its global and Eu-ropean weather forecast systems after trials showed that thesedata helped improve the forecasts.
Similar observations made with the radio occultationtechnique using GPS receivers on LEO such as CHAMP havebeen shown to help improve weather forecasts in the strato-sphere at several national weather centers (see also Section 2.9).Radio occultation observations of (refraction) bending anglesprovide indirect information on the stratospheric mass field andhence information on the stratospheric temperature (assuminghydrostatic equilibrium).
Geodesy already helps atmospheric science by providinghigh-temporal resolution observations of the lower tropospherevia atmospheric delays that contain information on the atmo-spheric water vapor field. Densification and improved timeli-ness of such observations could benefit the prediction of intenserainfall events.
Radio occultation observations are now collected in near-real time by the recent COSMIC mission, with an array of 6receivers (see Section 2.9). Current missions such as CHAMPand GRACE and future missions are expected to deliver similarobservations. Ensuring the processing and delivery of these toweather prediction centers would help them observe and fore-cast temperatures in the stratosphere.
3.6.4 Tracking global change in the atmosphere
The attempts of atmospheric physicists to monitor long-termatmospheric trends have been limited by the issue of instru-ment calibration. Some of the instruments that make up theGGOS hold the key for auto-calibrated, long-term stable atmo-spheric measurements. Because GPS satellites rely on accu-rate (atomic) clocks, the phase of the signals they transmitiscalibrated from atomic clocks on board, which are regularlyupdated with clocks on the ground. In contrast, no other obser-vation of Earth’s atmosphere relies on such a recurrent, atomiccalibration procedure. For example, measurements of passiveinfrared radiation need to be calibrated with respect to a black-body of known temperature to compensate for optics and de-tector aging in the instrument. However, monitoring the decayof that blackbody over a long period of time proves difficult(if not possible), unless it is brought back to known experi-mental conditions in a laboratory. Because this is impossibleto do with in-orbit radiometers, their time drift is thus difficultto estimate. GGOS could develop a record of atmospheric de-lays from a set of ground stations whose position is monitoredover time using other means such as VLBI. A similar recordbased on atmospheric-induced frequency shifts could also becollected by radio occultation missions. Thus, GGOS couldprovide data on the climate change effects anticipated in: tem-peratures, altitudes of constant pressure levels, and atmosphericmass transport.
The metric most often used for assessing climate changeis the rate of change of atmospheric temperature near the sur-face, because it is related to human activities and controlsour environment To monitor that temperature, instruments andmethods must be designed to collect measurements with an ac-curacy within the suggested climate trends of 0.1 K per decade.While it is important to plan and realize such measurementswith the desired accuracy, it is equally important to measurethe consequence of such trends on the static and the dynamicstructures of our atmosphere.
For example a magnifying effect of temperature changeis on air density and hence atmospheric layer thicknesses. As-suming for example a 0.1 K homogeneous warming throughoutany given atmospheric layer whose boundaries are defined by

The Global Geodetic Observing System GGOS 2020 75
fixed pressure levels, that atmospheric slab would expand byabout 0.04% of its original thickness. In real terms and witha tropospheric average temperature of 250K, this would raisethe mid-latitude near-tropopause level of 200 hPa by 5 meters.With GGOS system capable of ensuring a reference frame witha decimeter accuracy over a decade to locate upper-air atmo-spheric pressurein situ sensors, and accounting also for pos-sible changes in height at the Earth surface in the same time-frame, this trend could be identified.
Temperature change would also affect patterns of at-mospheric circulation. As horizontal temperature gradientschange, the cells that make up the general circulation are af-fected in their strength and shape (including extent and posi-tion). (Vecchi et al., 2006) have found evidence of a weaken-ing in the tropical Pacific Walker circulation between 1861 and1992 based on sea level pressure observations in that region.Using climate models to elaborate on the origin of that decline,they found that anthropogenic changes in the atmosphere couldexplain the observed decrease in sea level pressure gradient.Similarly, IPCC simulations made at Meteo France, predict aweakening of the Hadley cell. The total mass of air flowingthrough the upper branch of that cell at the latitude 15N andbetween 200 and 100 hPa pressure levels is currently about 50Megatons per second in January. A shift in the location ofthat upper branch of the Hadley cell predicts that by January2030 this flow would decrease by up to 5 Megatons per sec-ond. GGOS could help in measuring such changes by lookingat mass displacements, which would complement atmosphericmeasurements of air density and wind flow measurements inthe example mentioned here.
3.7 Sea level change
From a geophysical point of view, sea level has a twofold in-terest both because the ocean itself is one of the major compo-nents of the Earth system and because sea level is the boundarybetween the ocean and the atmosphere. Recently, due to theincreasing attention and evidences for anthropogenic changesinduced in the Earth system, one aspect of sea-level has comeinto focus: a rise in global sea level is considered as one ofthe more severe consequences of the predicted global warming.However, besides this impact aspect, sea level may also proveto be an important indicator of global warming, especially if anacceleration of the sea-level rise can be detected.
Observations of sea-level variations on different timescales are highly relevant. On the one hand, they allow forthe analysis and description of sea-level variability which isa prerequisite to a better understanding of the causes behindthese variations. On the other hand, they constitute crucial con-straints for models related to sea level, such as hydrodynamicalmodels or coupled atmosphere-ocean circulation models (Plaget al., 2000b).
The contributions of geodesy to sea level science can bedivided into two main groups. Geodesy provides the essen-tial data sets needed to monitor sea level change and vertical
land movements. It can also supply a range of information bywhich the reasons for sea level change can be understood, lead-ing eventually to more precise sea level change prediction.
3.7.1 Geo-location of sea and land levels and their changes
Information on historical sea level changes takes the form ofmeasurements of the height of the ocean surface relative tothat of the nearby land (see Section 2.9.3). This is true of all“relative” sea level measurements, whether geological, archae-ological or tide gauge. The long term changes in sea levelsestimated by such methods are necessarily affected by verti-cal movements of the land itself with respect to theCenter ofMass of the whole Earth system(CM) which for some loca-tions and timescales can exceed the changes of the sea surfacewith respect to the CM. Carefully conducted combined GNSSand absolute gravity measurements can provide an independentmonitor of vertical land movement, and thereby facilitate de-coupling of sea surface and land level changes in tide gaugerecords. Such a decoupling supports an improved understand-ing of the various processes responsible for change.
The use of GNSS at tide gauge sites is far from straight-forward, requiring suitable benchmark monumentation andprecise leveling in port areas which are often extremely busyand subject to frequent redevelopment. In addition, operationsat the coast can potentially lead to larger tropospheric variabil-ity in GPS data sets than those from inland.
The spatial variability of vertical land movements can bestudied with networks of GNSS receivers and from space byINSAR. The latter is of special interest in providing insight intothe spatial variations in land movement in the local areas nearto tide gauges, and thereby into how well the movements mea-sured by GPS at the gauge apply also at some distance from it(e.g. whether very localised subsidence exists). With the use ofdata from various geodetic techniques, complementary global,regional and local models of vertical land movement can beconstructed for application to tide gauge data for which no cor-responding GNSS information might exist (e.g., in developingcountries).
Satellite radar altimeters measure the sea surface posi-tions in a geometric reference frame through precise orbit de-termination of satellites such as TOPEX/Poseidon and Jason-1by SLR, GPS and DORIS (see Section 2.4.3). Such space datasets can be calibrated by means of tide gauge sea level mea-surements located in the same geometric reference frame withGNSS, thus enabling effective combination of measurementsfrom the two sources.
While sea surface measurements are relatively straight-forward to undertake from space, a major challenge is to makemeasurements relative to a geopotential surface (geoid) bymeans of which absolute ocean currents and fluxes can be de-termined, enabling direct comparison of transports measuredin situ (e.g., by current meters) to those inferred from sea leveldata, and the constraint of such parameters in ocean and climatemodels. The GOCE mission (see Section 2.6.5) should provide
The Global Geodetic Observing System GGOS 2020 76
such insight into the geoid for application to oceanographic re-search, including sea level science, and to an extended range ofgeophysics.
Temporal space gravity measurements such as those byGRACE (see Section 2.6.5) provide information on the vari-ability of mass around the globe, which over the ocean can bestudied as a parameter akin to ocean bottom pressure (essen-tially barotropic sea level). Such changes, when combined withdata on sea level variability from altimetry and tide gauges, en-able a decoupling of barotropic and baroclinic ocean variations.The latter in effect allow oceanographers to study ocean prop-erties beneath the surface of a global ocean, something whichcan be performed less comprehensively only with hydrographicvessels or a network of sub-surface floats (Argo). Complemen-tary sub-surface information derived fromin situmeasurementsand from space can be assimilated into ocean models providingongoing 3-D assessment of the state of the ocean.
3.7.2 Understanding sea level change
Geodetic techniques have revolutionised our understanding ofsea level variability through the provision of new data setsandmore accurate versions of existing ones. Such understandingis reviewed and summarised at regular intervals in the researchassessments of the Intergovernmental Panel on Climate Change(IPCC), with the 4th Assessment Report due for publication in2007.
One might summarise several of the main reasons for sealevel change and how geodesy contributes as follows:
• Thermal expansion: space gravity missions (e.g.GRACE) provide observations that allow the determina-tion of effective bottom pressure; GNSS locates Argofloats.
• Cryosphere changes:GNSS allows the measurement ofchanges in the height and extent of glaciers and ice sheetsand their flow rates and thereby provides insight into theirdynamics (see Section 3.4); space gravity missions pro-vide estimates of changes in mass balance of glaciers;laser and radar altimetry measure topographic changes(see Section 2.4.3.
• Hydrosphere changes:Space gravity missions provideobservations related to ground water changes in largebasins.
• Geosphere changes:GNSS, in particular if combinedwith absolute gravity measurements can aid improvementin models of postglacial rebound and tectonic processes.
• Meteorological changes: GNSS-meteorology con-tributes to improved atmospheric models and subsequentair pressure and wind fields; water vapour measurementsare of direct importance to altimetric data accuracy.
The importance of geodesy to ocean and climate modellingcan be mentioned in its own right. GPS on research vessels
and advanced hydrographic techniques (acoustic depth gauges,Doppler current meters etc.), together with satellite altimetryand gravity data, provide information on shape and bathymetryof ocean basins and the currents in them which modellers re-quire. Space gravity is a particularly exciting recent devel-opment: GOCE should enable absolute estimation of absoluteocean transports down to short (∼100 km) spatial scales for ap-plication throughout deep and coastal ocean and climate mod-elling, and temporal gravity (GRACE) data may help to selectbest choices of parameterisation of physical processes in At-mosphere Ocean General Circulation Models. Such modellingresults in improved modelling and understanding of the oceanicreasons for sea level change.
Sea level is intimately connected to the three “pillars ofgeodesy”. Consequently, geodetic observations can character-ize highly precise spatial and temporal changes of the Earthsystem that relate to sea level changes. The challenge for quan-tifying long-term change in sea and land levels imposes moststringent observation requirements, and can only be addressedwithin the context of a stable, global reference frame, suchthatmeasurements today can be meaningfully compared with mea-surements several decades years later with millimeter accuracy.The reference frame becomes the foundation to connect obser-vations in space and time and defines the framework in whichglobal and regional observations of sea level change can be un-derstood and properly interpreted.
However, long-term stability of the reference frame aloneis not sufficient. Since the sea surface adjusts closely to anequipotential surface of the Earth’s gravitational field, theRef-erence Frame Origin(RFO) needs to be tied to the CM. A po-tential secular translation of the RFO with respect to the CMis expected to bias global sea level trend estimates on the order0.2 to 0.3 mm/yr (see Section 2.2).
Consequently, improvements of ITRF are a crucial re-quirement for sea level studies. Moreover, observations ofchanges in Earth’s shape with GNSS and other techniques(VLBI, SLR, DORIS), in LOD, and in polar motion are es-sential data sets for the understanding of the processes forcingsea level variations. Deformations on land as a result of loadchanges (ice, ground water, etc.) and geological processes,which can subsequently result in a sea level signal, can alsobe monitored by GNSS, complementing space measurementsby GRACE. Therefore, a rich source of geodetic informationneeds to be maintained if the reasons for any future observedsea level change are to be properly identified and understood.
3.8 The hydrological cycle
Considering the importance of the hydrological cycle for thefunctioning of the biosphere as well as of the most near-surfaceprocesses of the Earth system, and its role as a major con-stituent of the climate engine, the need for innovation in tech-niques applicable to the monitoring of water-mass movementscannot be over-emphasized. There is a clear need for novelapproaches in this field including, for example, the continu-

The Global Geodetic Observing System GGOS 2020 77
ity of the new generation of gravity missions such as GRACE(Tapley et al., 2004b) designed to detect relatively small massmovements in the Earth system (Plag et al., 2000b; Ilk et al.,2005).
Many parameters characterizing the hydrological cyclesuch as ground moisture, effects of infiltration on groundwa-ter renewal, percolation of groundwater, subsurface dischargeof groundwater into the ocean are known with large uncer-tainty limits. The uncertainties are basically due to spatiallyand temporally insufficient observations of the transport of wa-ter within nearly all components of the hydrological cycle.To alarge extent, this lack of observations is caused by the absenceof technologies that allow sufficient monitoring of the relevantparameters within given economic constraints.
From a geophysical point of view, sea level has a twofoldinterest both because the ocean itself is one of the major compo-nents of the Earth system and because sea level is the boundarybetween the ocean and the atmosphere. Recently, due to theincreasing attention and evidences for anthropogenic changesinduced in the Earth system, one aspect of sea-level has comeinto focus: a rise in global sea level is considered as one ofthe more severe consequences of the predicted global warming.However, besides this impact aspect, sea level may also proveto be an important indicator of global warming, especially if anacceleration of the sea-level rise can be detected.
Changes in global sea level due to volumetric changes ofthe ocean water are thought to constitute the ”climate signal” insea level, which is composed of two parts: (1) melting of land-based ice adds water to the ocean, and (2) a change in the heatcontent of the water of the oceans leads to a volume change,for example, warming of the ocean increases the volume of thewater. Therefore, knowledge of the global ocean water massand volume as function of time constitutes a crucial constraintfor the reconstruction of past climates, as well as the validationof models used to predict future changes in the global oceanmass and volume. However, extracting this climate signal fromsea level records is a delicate task. One reason for this delicacyis the complicated mass budget of the ocean which is the majorreservoir of the global hydrological cycle. Thus, a once estab-lished change in global sea level cannot directly be equatedtothe climate signal (Zerbini et al., 1996). Ignoring in this contextchanges in the volume of the ocean basins which are believed tobe relatively small, the global ocean mass and volume may beaffected by all changes in the other reservoirs of this cyclesuchas groundwater, soil moisture, humidity of the air, terrestrialsurface, ice sheets, glaciers or perma-frost. At present, humaninterference such as deforestation, groundwater extraction, ir-rigation, river basin developments or reduced infiltrationdueto infrastructures and urban development are at a level wherethe global hydrological cycle is significantly affected. Variousstudies have been conducted on these anthropogenic influences;however, there are considerable differences in the resultsob-tained, mostly because these studies were based on insufficientdata.
A major contribution to the ocean mass changes is due to
land ice which, if it were all to melt, would cause more than 60m sea-level rise. Glaciers in most mountain regions are knownto be retreating. In Greenland thinning of the ice sheets pre-dominates at rates that are increasing with time. The pictureis less clear for Antarctica, but net loss appears probable,withdynamic losses also increasing with time (Steffen et al., 2006).
Monitoring the changes of the surfaces of the large icesheets still poses considerable problems to the remote sensingmethods currently in use including satellite radar altimetry andsatellite and airborne laser altimetry. These problems will notbe addressed here. The GRACE mission data allow deriving in-formation on temporal changes in the mass distribution of theice sheets and underlying rock. Because of the GRACE satellitealtitude, mass balance estimates with spatial resolution of onlyseveral hundred km are possible; however, there is the advan-tage of covering entire ice sheets, which is extremely difficultusing other techniques (Steffen et al., 2006).
Besides mass exchange with the cryosphere, the volumeincrease due to thermal expansion of the ocean is consideredasa major contributor to sea-level change and variability. Sig-nificant progress has been made during the past 20 years inobserving and understanding the decadal variability and, to alesser extent, the multi-decadal trends in global ocean heat con-tent and thermosteric sea level. As of the 1980’s, the sign ofglobal thermosteric sea-level change was unknown due to in-sufficient sampling. Among other reasons, advances in technol-ogy have contributed to change the nature of the problem dra-matically. The World Ocean Circulation Experiment (WOCE)provided a global top-to-bottom survey of ocean temperatureand salinity during the 1990’s and it enabled the global Argoarray whose implementation began in 2000. Future predictionof ocean thermal expansion and thus future sea-level rise (in-cluding its regional distribution) depends on coupled ocean at-mosphere models (Roemmich et al., 2006).
3.9 Mass transport and mass anomalies in theEarth system
3.9.1 Mass redistributions and geodesy
The gravity field and its variations - measured by satelliteswithunprecedented accuracy - are closely interrelated with masstransport and mass distribution. Figure 52 gives an overview ofgravity related phenomena, associated with anomalous signalsin the geoid, in gravity or with temporal changes of geoid orgravity. The atmosphere, hydrosphere, ice covers, biosphere,land surface and solid Earth interact in various ways, rang-ing from sub-seasonal and interannual to decadal and secularvariations on a global to regional spatial scale. This makesitdifficult to develop realistic models that are capable to yieldrealistic predictions. Rather sophisticated partial models ex-ist, for example, for weather predictions, the coupled atmo-spheric and ocean circulation, of local hydrological scales, ofglacial isostatic mass adjustment, but we are still far fromacomprehensive description and understanding of the dynamicsof Earth system. An important, and so far missing, segment

The Global Geodetic Observing System GGOS 2020 78
Figure 52. The interrelation of gravity, gravity variations, mass transport and distribution.
of Earth system models is the determination of mass anoma-lies, mass transport and mass exchange between Earth systemcomponents and, ultimately, the establishment of global massbalance.
Quantification and understanding of mass transport andmass distribution requires a close cooperation of many Earthsystem research areas: oceanic transport, continental hydrol-ogy, ice mass balance and sea level, dynamics of mantle andcrust, and geodetic signal analysis of the satellite missions, seeFigure 52. Such an interdisciplinary approach is necessarydueto two reasons. The first reason is the importance of watermass exchange across the boundaries of the system componentsoceans, land, ice and atmosphere. The goal is a consistent mod-eling, where mass output from one model (e.g. for an ice sheet)is used as mass input for another model (e.g. for the neigh-boring ocean). The other reason is the integral character ofthesatellite observations. The satellite gravity data as wellas sur-face geometry changes observed by satellite altimetry contain acomplex superposition of various mass signals. For instance, inAntarctica gravity and height changes due to ice mass changesare superimposed by similar signals from mass change in theEarth’s mantle due to glacial isostatic adjustment, from tecton-ics, and from mass changes in the adjacent oceans and in theatmosphere. To enable a reliable separation of such effects, anintensive exchange of results is required.
The quantities to be delivered from the combination ofthe three fundamental pillars geometry, gravity/geoid, Earth ro-tation are small and therefore difficult to determine. In orderto be useful for global change studies they have to be derivedfree of bias and consistently in space and time. In general theyare derived from the combination of complementary sensor andobservation systems. For example, dynamic ocean topographyis to be derived from the accurate measurement of the ocean
surface by radar altimetry in combination with a geoid surfaceprovided by gravity satellite missions. It shows that a variety ofsensor systems, mission characteristics, and tracking systemshave to be combined with utmost precision. The interconnec-tions between mass transport processes, and the relations be-tween observable parameters of gravity and geometry and thedifferent processes are sketched in Figure 53.
Earthquakes, volcano eruptions, tectonic deformations,land slides, glacial isostatic adjustment, deglaciation,sea levelrise, ocean mass and heat transport, deep ocean circulation, thewater cycle, atmospheric and ocean loading and many more aretypical and well known phenomena of this kind. Mass anoma-lies, the transport and exchange of masses and mass balancesare not measurable by any other means and add significantly tothe understanding of global Earth dynamics. But it is clear thatnot all different phenomena can be detected because of limita-tions in space and time. Figure 54 shows for the gravity fieldthe requirements on the static gravity field in terms of spatialresolution and typical time periods for the temporal variations.In the following, mass transport phenomena are briefly listedwhich can be detected by a careful signal analysis and signalbalancing. Subsequently, these phenomena are addressed inmore detail in individual sections.
Ocean circulation and transport: The combination of geoidand altimetry allows for the first time the direct determinationof the global dynamic ocean topography. The geostrophic bal-anced surface currents can be deduced from the inclinationsof the dynamic topography. From these, complete profiles ofthe ocean circulation can be derived by combination with tradi-tional hydrographical measurements. New insights in globaland basin related heat and mass transport can be expected.Temporal variations of the dynamic ocean surface are caused

The Global Geodetic Observing System GGOS 2020 79
Figure 53. Interconnections between processesand research themes related to mass transport andmass distribution. Arrows in the center of the fig-ure indicate mass exchange and dynamic feedbackmechanisms. Other arrows connect the gravimetricand geometric observations (on top of the figure)to the physical processes or indicate external influ-ences and complementary fields (at the bottom ofthe figure).
mainly by temperature related volume changes where the masscolumn remains unchanged. Mass changes by fluid dynam-ics causes more problems and can be detected only by changesof the gravity field as expected by the GRACE mission. Thiswill lead to a clear progress in the understanding of ocean cir-culation. Future topics of research include the determinationof large-scale heat and mass transport, the investigation of cir-culation systems such as the Antarctic circum polar current,Weddell- and Ross eddies, the separation of steric and eustaticchanges of the global sea surface and of the dynamics of cur-rents, and the interaction of temporal and quasi-static circula-tions (eddies, fronts).
Hydrological cycle: The time dependent gravity field as ex-pected from the GRACE mission enables for the first time todetect continental mass changes with a resolution of 1 cm wa-ter column in monthly snapshots. This allows to close the hy-drological cycle at different scales in time and space. Topicsof research include the global water balance and water trans-fer between atmosphere, continents, oceans and ice shield,thelarge-scale variations of terrestrial water storage undercharac-teristic conditions, the large scale temporal variations of evap-otranspiration, the evaluation and development of large-scalehydrological models, the water balances in difficult accessibleregions, the long term trends of continental water storage asa consequence of environmental changes, and identificationofhydrological problem zones with respect to water managementand the availabilty of water resources.
Ice mass balance and sea surface:The polar ice caps play akey role in Earth system because imbalanced masses and result-
ing changes of the sea surface are global. Of central relevanceis the precise determination of the mass balance of the com-plete ice shields by the actual gravity field missions CHAMP,GRACE and GOCE. Altimetry enables the precise measure-ment of the topography and of ice height changes, with themissions CryoSat and ICESat also in the climate sensitive iceshield regions. Interferometric SAR (ENVISAT) enables thearea wise determination of ice motions which can be comparedto balance velocity models. The precise measurement of thethickness of the sea ice (CryoSat) provides new insight in theactual climate development. Topics of research are: registrationof mass changes of the polar ice caps and the consequences forsea level rise; investigation of the changes in the border areas ofice masses; validation and improvement of glaciological mod-els as important component in coupled climate models; deter-mination of ice mass induced recent crust deformations (glacialisostasy); additional data sets for validation, densification andinterpretation of satellite data; modelling of sea ice dynamicsbased on new remote sensing data.
Crust and mantle: The new gravity field missions opennew dimensions in the research for geodynamic mass trans-port within the Earth: GOCE will improve the resolution of thestatic gravity potential and its gradients in the medium andshortwavelength range by more than one magnitude; GRACE willprovide for the first time the temporal variation of the potentialdown to a resolution of 400 km; it can be expected that massdistribution and mass transport will become directly observ-able. Topics of research are: glacial-isostatic adjustment pro-cesses and lateral variations of mantle viscosity; global masstransport in the mantle and dynamic topography based on new

The Global Geodetic Observing System GGOS 2020 80
Figure 54. Resolvability of Mass transport bysatellite missions. Mass transport phenom-ena and mass distribution characteristics andits resolvability by the satellite missions CHAMP,GRACE and GOCE.
seismic tomography data and 3D-distributions of mantle vis-cosity; sub-lithosphere mantle convection and deviationsofseismic discontinuities in 410 and 600 km depth; models of ac-tive and passive continental margins based on high-resolutiongravity data, decoupling processes at active subduction zones;episodic mass redistributions at plate margins; improvement ofglobal and regional crust and lithosphere models.
3.10 Earth rotation: understanding Earth sys-tem dynamics
3.10.1 Earth rotation measurements
Changes in the Earth’s rate of rotation become apparent whencomparing time kept by the rotating Earth, known as Uni-versal Time, to uniform time scales based either upon atomicclocks or upon the motion of the Sun and other celestial bod-ies. Prior to the development of atomic clocks, the most ac-curate measurements of changes in the Earth’s rate of rota-tion were obtained by timing the occultations of stars by theMoon. With the advent of atomic clocks in 1955, a uniformatomic time scale became available that could be used as a ref-
erence when measuring the transit times of stars as they passthrough the local meridian. Changes in the Earth’s rate of ro-tation could then be determined more accurately from opticalastrometric measurements of star transits than they could frommeasurements of lunar occultations. And prior to the devel-opment of space-geodetic techniques, optical astrometricmea-surements of changes in the apparent latitudes of observingsta-tions yielded the most accurate estimates of polar motion. Thespace-geodetic techniques of VLBI, GNSS like GPS, and SLRand LLR are now the most accurate techniques available formeasuring changes in both the Earth’s rate of rotation and inpolar motion.
An integral part of geodesy has always been the defini-tion and realization of a terrestrial, body-fixed referenceframe,a celestial, space-fixed reference frame, and the determinationof the Earth orientation parameters (precession, nutation, spin,and polar motion) that link these two reference frames together.But with the advent of space geodesy-with the placement oflaser retro-reflectors on the Moon by Apollo astronauts andSoviet landers, the launch of the LAGEOSs, the developmentof very long baseline interferometry, and the development of
The Global Geodetic Observing System GGOS 2020 81
global navigation satellite systems like the global positioningsystem-a quantum leap has been taken in our ability to realizethe terrestrial and celestial reference frames and to determinethe Earth orientation parameters.
The only space-geodetic measurement technique capableof independently determining all of the Earth orientation pa-rameters (EOPs) is multibaseline VLBI. All of the other tech-niques need to either apply external constraints to the deter-mined Earth orientation parameters or can determine only sub-sets of the EOPs, only linear combinations of the EOPs, or onlytheir time rates-of-change.
Ring laser gyroscopes are a promising emerging technol-ogy for determining the Earth’s rotation. In a ring laser gyro-scope, two laser beams propagate in opposite directions arounda ring. Since the ring laser gyroscope is rotating with the Earth,the effective path length of the beam that is corotating withtheEarth is slightly longer than the path that is counter-rotatingwith it. Because the effective path lengths of the two beamsdiffer, their frequencies differ, so they interfere with each otherto produce a beat pattern, the frequency of which is propor-tional to that component of the instantaneous angular velocityΩ(t) of the Earth that is parallel to the normal of the plane ofthe ring. Ring laser gyroscopes measure the absolute rotationof the Earth in the sense that, in principle, just a single mea-surement is required to determine the Earth’s instantaneous ro-tation. All of the other techniques discussed above are relativesensors because they infer the Earth’s rotation from the changein the orientation of the Earth that takes place between at leasttwo measurements that are separated in time.
Earth orientation parameters can be determined frommeasurements taken by each of the techniques discussed above.But each technique has its own unique strengths and weak-nesses in this regard. Not only is each technique sensitive to adifferent subset and/or linear combination of the Earth orienta-tion parameters, but the averaging time for their determinationis different, as is the interval between observations, the preci-sion with which they can be determined, and the duration of theresulting EOP series. By combining the individual series deter-mined by each technique, a series of the Earth’s orientationcanbe obtained that is based upon independent measurements andthat spans the greatest possible time interval.
3.10.2 UT1 and Length-of-Day Variations
Length-of-day observations show that it consists mainly of: (1)a linear trend of rate−1.8 ms/cy, (2) decadal variations havingan amplitude of a few milliseconds, (3) tidal variations havingan amplitude of about 1 ms, (4) seasonal variations having anamplitude of about 0.5 ms, and (5) smaller amplitude variationsoccurring on all measurable time scales.
Linear trend: Tidal dissipation causes the Earth’s angularvelocity and hence rotational angular momentum to decrease.Since the angular momentum of the Earth-Moon system is con-served, the orbital angular momentum of the Moon must in-
crease to balance the decrease in the Earth’s rotational angularmomentum. The increase in the orbital angular momentum ofthe Moon is accomplished by an increase in the radius of theMoon’s orbit and a decrease in the Moon’s orbital angular ve-locity. The tidal acceleration of the Moon can be determinedfrom observations of the timings of transits of Mercury as wellas from satellite and lunar laser ranging measurements. Tidalforces distort the figure of the Earth and hence its gravitationalfield which in turn perturbs the orbits of the Moon and artificialsatellites. Lunar and satellite laser ranging measurements candetect these tidal perturbations in the satellites’ orbitsand cantherefore be used to construct tide models and hence determinethe tidal acceleration of the Moon. Using LLR measurements,avalue of25.73±0.5 ”/cy2 for the tidal acceleration of the Moonis found, which by Kepler’s law corresponds to an increase of3.79 ± 0.07 cm/yr in the semimajor axis of the Moon’s orbit,and which should be accompanied by a2.3 ms/cy increase inthe length of the day.
By a priori adopting a value for the tidal acceleration ofthe Moon, lunar and solar eclipse observations can be used todetermine the secular increase in the length of the day over thepast few thousand years. Using eclipse observations spanning700 BC to 1600 AD, lunar occultation observations spanning1600 to 1955.5, and optical astrometric and space-geodeticmeasurements spanning 1955.5 to 1990, it was found that thelength-of-day has increased at a rate of1.80 ± 0.1 ms/cy onaverage during the past 2700 years.
Since the observed increase in the length of the day is1.8ms/cy, whereas the observed tidal acceleration of the Moon im-plies a2.3 ms/cy increase in the length of the day, some othermechanism or combination of mechanisms must be acting tochange the length of the day by 0.5 ms/cy. One of the mostimportant mechanisms acting to cause a secular trend in thelength-of-day on time scales of a few thousand years is glacialisostatic adjustment (GIA). Other possible mechanisms includepresent-day changes in glacier and ice sheet mass and the ac-companying change in nonsteric sea level, tectonic processestaking place under non-isostatic conditions, plate subduction,earthquakes, and deformation of the mantle caused by pressurevariations acting at the core-mantle boundary that are associ-ated with motion of the fluid core.
Decadal variations The most important mechanism acting tocause decadal variations in the length of the day is core-mantlecoupling. It has been recognized for quite some time that thecore is the only viable source of the large decadal LOD varia-tions that are observed, and current models of defacronymCoreAngular MomentumCAM predict decadal length-of-day varia-tions that agree reasonably well with those observed.
While the exchange of CAM with the solid Earth canclearly cause decadal LOD variations of approximately theright amplitude and phase, the mechanism or mechanisms bywhich the angular momentum is exchanged between the coreand solid Earth is less certain. Possible core-mantle couplingmechanisms are viscous torques, topographic torques, electro-
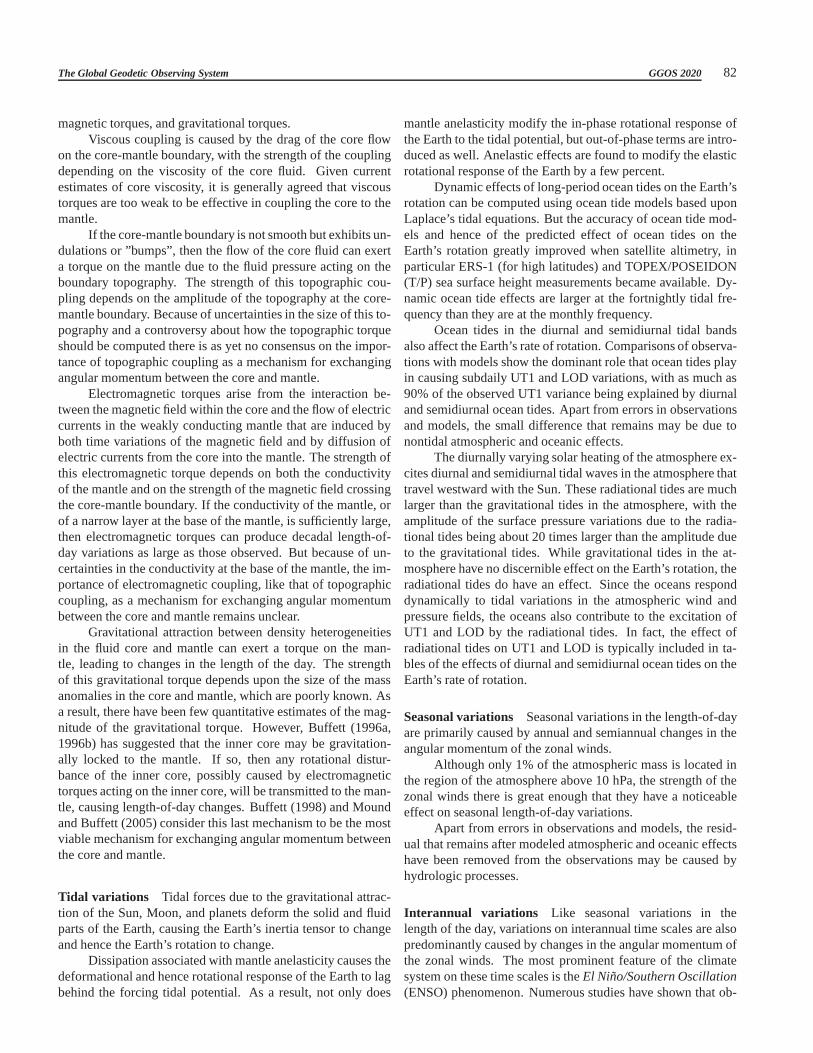
The Global Geodetic Observing System GGOS 2020 82
magnetic torques, and gravitational torques.Viscous coupling is caused by the drag of the core flow
on the core-mantle boundary, with the strength of the couplingdepending on the viscosity of the core fluid. Given currentestimates of core viscosity, it is generally agreed that viscoustorques are too weak to be effective in coupling the core to themantle.
If the core-mantle boundary is not smooth but exhibits un-dulations or ”bumps”, then the flow of the core fluid can exerta torque on the mantle due to the fluid pressure acting on theboundary topography. The strength of this topographic cou-pling depends on the amplitude of the topography at the core-mantle boundary. Because of uncertainties in the size of this to-pography and a controversy about how the topographic torqueshould be computed there is as yet no consensus on the impor-tance of topographic coupling as a mechanism for exchangingangular momentum between the core and mantle.
Electromagnetic torques arise from the interaction be-tween the magnetic field within the core and the flow of electriccurrents in the weakly conducting mantle that are induced byboth time variations of the magnetic field and by diffusion ofelectric currents from the core into the mantle. The strength ofthis electromagnetic torque depends on both the conductivityof the mantle and on the strength of the magnetic field crossingthe core-mantle boundary. If the conductivity of the mantle, orof a narrow layer at the base of the mantle, is sufficiently large,then electromagnetic torques can produce decadal length-of-day variations as large as those observed. But because of un-certainties in the conductivity at the base of the mantle, the im-portance of electromagnetic coupling, like that of topographiccoupling, as a mechanism for exchanging angular momentumbetween the core and mantle remains unclear.
Gravitational attraction between density heterogeneitiesin the fluid core and mantle can exert a torque on the man-tle, leading to changes in the length of the day. The strengthof this gravitational torque depends upon the size of the massanomalies in the core and mantle, which are poorly known. Asa result, there have been few quantitative estimates of the mag-nitude of the gravitational torque. However, Buffett (1996a,1996b) has suggested that the inner core may be gravitation-ally locked to the mantle. If so, then any rotational distur-bance of the inner core, possibly caused by electromagnetictorques acting on the inner core, will be transmitted to the man-tle, causing length-of-day changes. Buffett (1998) and Moundand Buffett (2005) consider this last mechanism to be the mostviable mechanism for exchanging angular momentum betweenthe core and mantle.
Tidal variations Tidal forces due to the gravitational attrac-tion of the Sun, Moon, and planets deform the solid and fluidparts of the Earth, causing the Earth’s inertia tensor to changeand hence the Earth’s rotation to change.
Dissipation associated with mantle anelasticity causes thedeformational and hence rotational response of the Earth tolagbehind the forcing tidal potential. As a result, not only does
mantle anelasticity modify the in-phase rotational response ofthe Earth to the tidal potential, but out-of-phase terms areintro-duced as well. Anelastic effects are found to modify the elasticrotational response of the Earth by a few percent.
Dynamic effects of long-period ocean tides on the Earth’srotation can be computed using ocean tide models based uponLaplace’s tidal equations. But the accuracy of ocean tide mod-els and hence of the predicted effect of ocean tides on theEarth’s rotation greatly improved when satellite altimetry, inparticular ERS-1 (for high latitudes) and TOPEX/POSEIDON(T/P) sea surface height measurements became available. Dy-namic ocean tide effects are larger at the fortnightly tidalfre-quency than they are at the monthly frequency.
Ocean tides in the diurnal and semidiurnal tidal bandsalso affect the Earth’s rate of rotation. Comparisons of observa-tions with models show the dominant role that ocean tides playin causing subdaily UT1 and LOD variations, with as much as90% of the observed UT1 variance being explained by diurnaland semidiurnal ocean tides. Apart from errors in observationsand models, the small difference that remains may be due tonontidal atmospheric and oceanic effects.
The diurnally varying solar heating of the atmosphere ex-cites diurnal and semidiurnal tidal waves in the atmospherethattravel westward with the Sun. These radiational tides are muchlarger than the gravitational tides in the atmosphere, withtheamplitude of the surface pressure variations due to the radia-tional tides being about 20 times larger than the amplitude dueto the gravitational tides. While gravitational tides in the at-mosphere have no discernible effect on the Earth’s rotation, theradiational tides do have an effect. Since the oceans responddynamically to tidal variations in the atmospheric wind andpressure fields, the oceans also contribute to the excitation ofUT1 and LOD by the radiational tides. In fact, the effect ofradiational tides on UT1 and LOD is typically included in ta-bles of the effects of diurnal and semidiurnal ocean tides ontheEarth’s rate of rotation.
Seasonal variations Seasonal variations in the length-of-dayare primarily caused by annual and semiannual changes in theangular momentum of the zonal winds.
Although only 1% of the atmospheric mass is located inthe region of the atmosphere above 10 hPa, the strength of thezonal winds there is great enough that they have a noticeableeffect on seasonal length-of-day variations.
Apart from errors in observations and models, the resid-ual that remains after modeled atmospheric and oceanic effectshave been removed from the observations may be caused byhydrologic processes.
Interannual variations Like seasonal variations in thelength of the day, variations on interannual time scales arealsopredominantly caused by changes in the angular momentum ofthe zonal winds. The most prominent feature of the climatesystem on these time scales is theEl Nino/Southern Oscillation(ENSO) phenomenon. Numerous studies have shown that ob-

The Global Geodetic Observing System GGOS 2020 83
served LOD variations on interannual time scales, as well asinterannual variations in the angular momentum of the zonalwinds, are (negatively) correlated with the SOI, reflectingtheimpact on the length-of-day of changes in the zonal winds as-sociated with ENSO.
Studies of the effects of oceanic processes show that theyare only marginally effective in causing interannual length-of-day variations.
The interannual LOD signal that remains after atmo-spheric and oceanic effects are removed may be caused by hy-drologic processes.
Like seasonal variations, better atmospheric, oceanic, andhydrologic models are needed to close the LOD budget on in-terannual time scales.
Intraseasonal variations Like the seasonal and interannualvariations in the length of the day, variations on intraseasonaltime scales are also predominantly caused by changes in theangular momentum of the zonal winds. The Madden-Julian os-cillation with a period of 30 to 60 days is the most prominentfeature in the atmosphere on these time scales and a number ofstudies have shown that fluctuations in the zonal winds associ-ated with this oscillation cause the length-of-day to change.
Studies of the effects of oceanic processes show that theyare only marginally effective in causing intraseasonal length-of-day variations.
Hydrologic effects on intraseasonal length-of-day vari-ations are thought to be relatively insignificant, althoughthemonthly sampling interval of current hydrologic models makesit difficult to study such rapid variations.
3.10.3 Polar Motion
Observations of polar motion show that it consists mainly of:(1) a forced annual wobble having a nearly constant amplitudeof about 100 mas, (2) the free Chandler wobble having a pe-riod of about 433 days and a variable amplitude ranging fromabout 100 to 200 mas, (3) quasi-periodic variations on decadaltime scales having amplitudes of about 30 mas known as theMarkowitz wobble, (4) a linear trend having a rate of about 3.5mas/yr and a direction towards 79W longitude, and (5) smalleramplitude variations occurring on all measurable time scales.
Linear trend One of the most important mechanisms actingto cause a linear trend in the path of the pole on time scalesof a few thousand years is glacial isostatic adjustment (GIA).The isostatic adjustment of the solid Earth as it responds tothe decreasing load on it following the last deglaciation causesthe figure of the Earth to change, and hence the pole to drift.Models of GIA show that its effect on the pole path is sensitiveto the assumed value of lower mantle viscosity, to the assumedthickness and rheology of the lithosphere, to the treatmentofthe density discontinuity at 670 km depth, and to the assumedcompressibility of the Earth model.
However, GIA is not the only mechanism that will cause
a trend in the pole path. The present-day change in glacier andice sheet mass and the accompanying change in nonsteric sealevel will also cause a linear trend in polar motion. But theeffect of this mechanism is very sensitive to the still unknownpresent-day mass change of glaciers and ice sheets, particularlyof the Antarctic ice sheet. Other mechanisms that may cause alinear trend in the path of the pole include tectonic processestaking place under non-isostatic conditions, plate subduction,mantle convection, upwelling mantle plumes, and earthquakes.
Decadal variations Since optical astrometric measurementsare known to be corrupted by systematic errors, there has al-ways been some doubt about the reality of the decadal vari-ations evident in these measurements. But since the highlyaccurate space-geodetic measurements are less susceptible tosystematic error than are optical astrometric measurements,decadal variations seen in the space-geodetic measurementscan be considered to be reliable.
The cause of the decadal-scale polar motion variationsevident in space-geodetic measurements is currently unknown.Since core-mantle processes are known to cause decadal vari-ations in the length of the day, they may also excite decadalvariations in polar motion. But electromagnetic coupling be-tween the core and mantle appears to be two to three ordersof magnitude too weak and topographic coupling appears to betoo weak by a factor of three to ten. Like the decadal variationsin the length-of-day, invoking the inner core when modelingcore-mantle processes may ultimately provide the long-soughtexplanation for the cause of the decadal variations in polarmo-tion.
Tidal variations Tidally induced deformations of the solidEarth caused by the second-degree zonal tide raising potentialcause long-period changes in the Earth’s rate of rotation. Butsince this potential is symmetric about the polar axis, tidal de-formations of the axisymmetric solid Earth cannot excite polarmotion. However, due to the nonaxisymmetric shape of thecoastlines, the second-degree zonal tide raising potential actingon the oceans can generate polar motion via the exchange ofnonaxial oceanic tidal angular momentum with the solid Earth.
Better observations of the effect of long-period oceantides on polar motion are needed, as are better models for theseeffects. Observations of these effects are internally incosistent,and predictions from the available theoretical ocean tide mod-els do not agree with each other or with the observations.
Comparisons of observations with models show the majorrole that ocean tides play in causing subdaily polar motion vari-ations, with as much as 60% of the observed polar motion vari-ance being explained by diurnal and semidiurnal ocean tides.Apart from errors in observations and models, the differencethat remains may be due to nontidal atmospheric and oceaniceffects.
Chandler wobble Any irregularly shaped solid body rotat-ing about some axis that is not aligned with its figure axis will

The Global Geodetic Observing System GGOS 2020 84
freely wobble as it rotates. The Eulerian free wobble of theEarth is known as the Chandler wobble in honor of Seth CarloChandler, Jr. who first observed it. Unlike the forced wobblesof the Earth, such as the annual wobble, whose periods are thesame as the periods of the forcing mechanisms, the period ofthe free Chandler wobble is a function of the internal structureand rheology of the Earth and its decay time constant, or qual-ity factor Q, is a function of the dissipation mechanisms actingto dampen it. The observed values for the period and Q of theChandler wobble can therefore be used to better understand theinternal structure of the Earth and the dissipation mechanisms,such as mantle anelasticity, that dampen the Chandler wobblecausing its amplitude to decay in the absence of excitation.
While there is growing agreement that the Chandler wob-ble is excited by a combination of atmospheric, oceanic, andhydrologic processes, the relative contribution of each processto its excitation is still being debated.
Seasonal polar motion The annual wobble is a forced wob-ble of the Earth that is caused largely by the annual appearanceof a high atmospheric pressure system over Siberia every win-ter.
A rather large residual remains after the effects of the at-mosphere and oceans are removed from the observed seasonalpolar motion excitation. This residual is probably at leastpartlydue to errors in the atmospheric and oceanic models, but couldalso be due to the neglect of other excitation processes suchashydrologic processes.
Interannual polar motion Like the seasonal wobbles, thewobbling motion of the Earth on interannual time scales is aforced response of the Earth to its excitation mechanisms. Forperiods between 1 year and 6 years excluding the annual cycle,oceanic processes are much more important than atmosphericin exciting interannual polar motions.
Intraseasonal polar motion Like the seasonal and interan-nual wobbles, the wobbling motion of the Earth on intrasea-sonal time scales is a forced response of the Earth to its ex-citation mechanisms. For periods between 5 days and 1 yearexcluding the seasonal cycles, atmospheric processes are moreeffective than oceanic in exciting polar motion.
3.11 Earth rotation: understanding processes inthe solid Earth
The key questions that are addressed in this note are the follow-ing: What can we learn from Earth rotation about the Earth’s in-terior (core, mantle)? What can we learn about the exterior flu-ids (global mass balance, hydrological cycle, global change)?Similar techniques can be applied to the other terrestrial planetsand help us to better understand their interior, their evolution,and their external and internal fluids. The Section 6.1 will ad-dress that question.
Figure 55. Geophysical parameters obtained from nutation.
3.11.1 Earth’s interior from Earth rotation
The Earth rotation and orientation are measured by VLBI,satellite observations using DORIS, GNSS, as well as SLR, andLLR. The precise use of reference frame, terrestrial and celes-tial reference frames, allows a very good determination of theEarth position and orientation in space as a function of time.This allows a very good precision on the EOP as a functionof time that comprise precession, nutation, length-of-dayvari-ations, and polar motion. Precession and nutation allow gettinginformation on phenomena related to the deep Earth interiorsuch as core-mantle coupling, mantle anelasticity, or inner corecoupling with the liquid core and the mantle. Figure 55 presentsthe geophysical parameters that are determined from nutation.
At this step it must be noted that the very good constraintsthat are obtained are constraints on the coupling constantsbutnot really on the coupling mechanisms involved. In otherwords, the coupling constant can be determined from the EOPbut for explaining these coupling constants, one needs to con-sider the physical mechanisms such as inertial coupling, elec-tromagnetic coupling, topographic coupling, or viscous cou-pling. The choice of the mechanism is related to other con-sideration. The evaluation of the relative influence is relatedto further computation and improvements are still necessary inthat field. The situation for nutation is a good example. Thereis a trade-off between the flattening of the core (in particular thenon-hydrostatic contribution) and the real part of the couplingconstant at the core mantle boundary (CMB). The presentlyadopted nutation theory has considered electromagnetic cou-pling as coupling mechanism at the CMB. Consequently, withthe help of a complicate theory, it was possible to relate theimaginary part of the coupling constant and its real part. Theflattening of the core could be determined to correspond to anincrease of about 350m of the equatorial radius with respectto the polar radius, in addition to the hydrostatic contributioncomputed from the core rotation inside the Earth. But if thecoupling mechanism is different or is a combination betweenelectromagnetic coupling and topographic coupling, this may
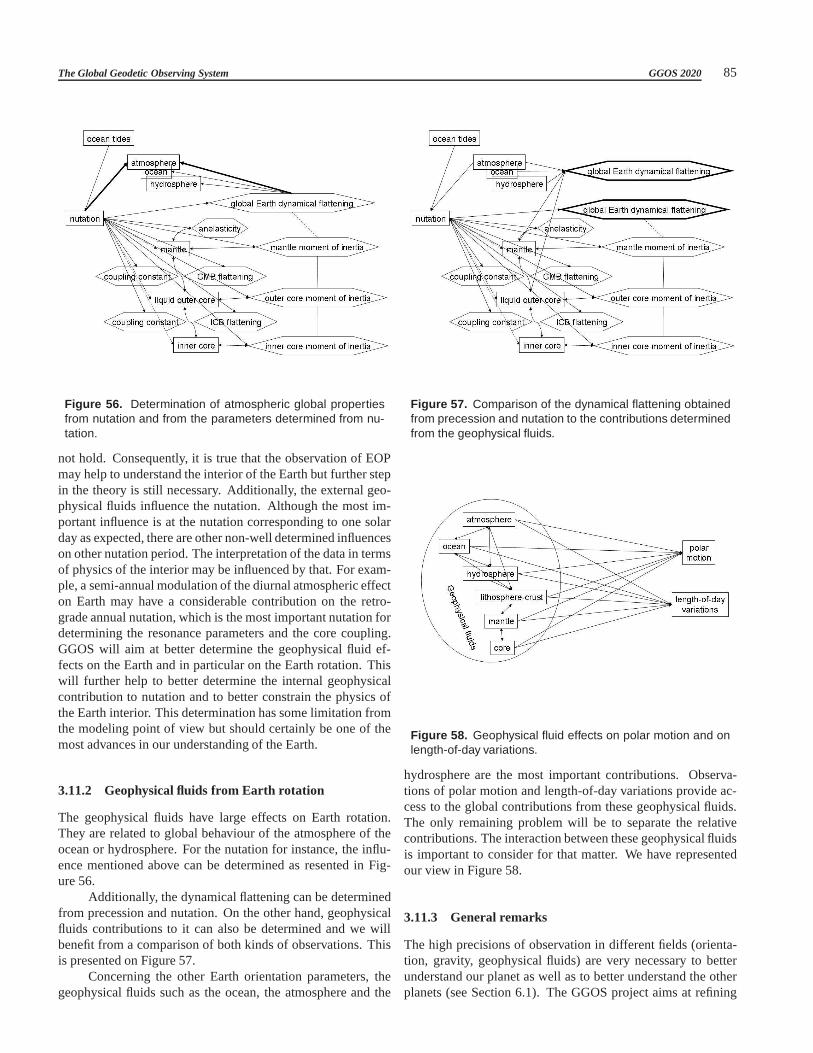
The Global Geodetic Observing System GGOS 2020 85
Figure 56. Determination of atmospheric global propertiesfrom nutation and from the parameters determined from nu-tation.
not hold. Consequently, it is true that the observation of EOPmay help to understand the interior of the Earth but further stepin the theory is still necessary. Additionally, the external geo-physical fluids influence the nutation. Although the most im-portant influence is at the nutation corresponding to one solarday as expected, there are other non-well determined influenceson other nutation period. The interpretation of the data in termsof physics of the interior may be influenced by that. For exam-ple, a semi-annual modulation of the diurnal atmospheric effecton Earth may have a considerable contribution on the retro-grade annual nutation, which is the most important nutationfordetermining the resonance parameters and the core coupling.GGOS will aim at better determine the geophysical fluid ef-fects on the Earth and in particular on the Earth rotation. Thiswill further help to better determine the internal geophysicalcontribution to nutation and to better constrain the physics ofthe Earth interior. This determination has some limitationfromthe modeling point of view but should certainly be one of themost advances in our understanding of the Earth.
3.11.2 Geophysical fluids from Earth rotation
The geophysical fluids have large effects on Earth rotation.They are related to global behaviour of the atmosphere of theocean or hydrosphere. For the nutation for instance, the influ-ence mentioned above can be determined as resented in Fig-ure 56.
Additionally, the dynamical flattening can be determinedfrom precession and nutation. On the other hand, geophysicalfluids contributions to it can also be determined and we willbenefit from a comparison of both kinds of observations. Thisis presented on Figure 57.
Concerning the other Earth orientation parameters, thegeophysical fluids such as the ocean, the atmosphere and the
Figure 57. Comparison of the dynamical flattening obtainedfrom precession and nutation to the contributions determinedfrom the geophysical fluids.
Figure 58. Geophysical fluid effects on polar motion and onlength-of-day variations.
hydrosphere are the most important contributions. Observa-tions of polar motion and length-of-day variations provideac-cess to the global contributions from these geophysical fluids.The only remaining problem will be to separate the relativecontributions. The interaction between these geophysicalfluidsis important to consider for that matter. We have representedour view in Figure 58.
3.11.3 General remarks
The high precisions of observation in different fields (orienta-tion, gravity, geophysical fluids) are very necessary to betterunderstand our planet as well as to better understand the otherplanets (see Section 6.1). The GGOS project aims at refining

The Global Geodetic Observing System GGOS 2020 86
the consistency and determination of all these and will con-sequently greatly enhance our understanding of the interior ofthe Earth. Similar projects of synergism are very much wishedand already the concept is applied to other planets. The conse-quences of the GGOS effort will be huge and have a very largepotential for a better understanding the interior of the Earth.

The Global Geodetic Observing System GGOS 2020 87
4 Maintaining a modern society
C. Rizos, D. Brzezinska, R. Forsberg, G. Johnston, D. Smith,S. Kenyon
In innumerable ways, geodesy contributes to the func-tioning of a modern society. While that contribution is critical,it is not necessarily well known or understood by most out-side the geodetic community. Geodesy defines the infrastruc-ture underlying many of the functions of modern society. Likethe wooden frame of a house, that infrastructure is the unseenframework upon which different “layers” of spatial information(e.g., the geometric data and thematic description of spatial el-ements such as points, polygons, lines, 3D objects, and theirtopologies – i.e., how they relate to each other –, and imageryfrom space and airborne platforms) are constructed so that theyalign with each other perfectly. This infrastructure is knownasSpatial Data Infrastructure(SDI), and geodesy is the toolwhich defines the SDI. In this chapter the terms “spatial” and“geospatial” will be assumed to be inter-changeable. In manycountries, the importance of SDI has risen to the level of gov-ernment mandate. In parallel with this SDI issue, positioning isincreasingly needed in many aspects of life, in many businessand engineering applications, and to aid decision-making at alllevels of government and private enterprise. Due to the global-ization and interoperability requirements, spatial data and po-sitioning are increasingly required with respect to a global ref-erence frame. Both, spatial data and (geo)positioning relyongeodesy and increasingly on global geodesy.
4.1 Spatial data infrastructure
In the U.S., for example, the government’sOffice of Man-agement and Budget(OMB) issued circular A-16 (“Coordina-tion of Geographic Information and Related Spatial Data Ac-tivities”). This document establishes that theFederal Geo-graphic Data Committee(FGDC) be in charge of establishingtheNational Spatial Data Infrastructure(NSDI). Furthermore,it identifies theNational Oceanic and Atmospheric Agency(NOAA) as the “lead agency” in providing “geodetic control”for the federal government in support of the NSDI. The geode-tic control is specifically referred to as theNational SpatialReference System(NSRS). Because no other agency inside ofNOAA deals in establishing geodetic control (nor specificallythe NSRS), the naming of NOAA as the lead agency effectivelytranslates into theNational Geodetic Survey(NGS), an officewithin NOAA. This means that in the United States NGS mustdefine, maintain and provide access to the NSRS - that is, makesure that everyone who needs to reference anything spatially(e.g. to “position” anything), can do so consistently with oth-ers.
One important aspect for georeferencing for military andcivilian activities all over the world is the use of a globally con-sistent reference frame such as the ITRF. As the most accuraterealization of ITRS, the ITRF provides a single, commonly ac-
cessible 3D reference frame for geospatial data from a varietyof sources. Another global reference system currently still usedfor many applications is the WGS 84. As pointed out in Sec-tion 2.2, the realizations of WGS 84 (through GPS) today areclosely aligned to ITRF and supported by ITRF.
Local maps and geodetic control are still commonly usedworldwide and the ability to convert this information into acommon system provides users with the ability to unambigu-ously georeference with respect to locations on or above theEarth’s surface. It also minimizes possible errors when us-ing modern satellite-based geopositioning technologies such asGNSS. Hence increasingly national, and even local, datums are“compatible” with ITRF, i.e. these datums are Earth-centered,Earth-fixed, and their relationship to the very accurate, high in-tegrity ITRF is determined to a very high level of confidence.In many countries and regions, the relations between the na-tional or regional frames are monitored on a continuous basisby the national agency responsible for operational geodesyinthat country.
In Australia SDIs are being developed largely within in-dividual government jurisdictions: federal, state and territoryand, increasingly, local government. TheAustralia and NewZealand Land Information Council(ANZLIC), the peak Spa-tial Information Council comprising senior government offi-cials from the Australian Government, eight State and Terri-tory governments, and New Zealand, coordinates the devel-opment of theAustralian Spatial Data Infrastructure(ASDI).ANZLIC has a number of standing committees to advise it ontechnical issues, amongst which theIntergovernmental Com-mittee on Surveying and Mapping(ICSM) develops and pro-motes data standards across the jurisdictions. The most tangi-ble component of the ASDI is theAustralian Spatial Data Di-rectory(ASDD), comprising 25 geographically distributed andindependently maintained nodes, collectively containingover40,000 metadata records. Groups of agencies are coming to-gether to develop coordinated SDIs in response to major na-tional priorities. Australian Government agencies, for example,have formed the Australian Ocean Data Center Joint Facilitytocoordinate marine data. The Australian SDI comprises a di-verse set of organizations and locations and relies heavilyupontheAustralian National Geospatial Reference System(NGRS)to link them together and provide seamless coordinate sets forthe entire continent. For this reason the responsibility for main-tenance of the national geodetic infrastructure, and provision ofthe linkage to the international geodetic infrastructure,falls tothe agencyGeoscience Australia(GA). The national datumsare maintained cooperatively by GA and the respective stategovernments.
A similar federated model exists in Canada. TheCana-dian Geospatial Data Infrastructure(CGDI) contains all of thetechnology, standards, access systems and protocols necessaryto harmonize all of Canada’s geospatial databases, and makethem available on the Internet (Geoconnection, 2007). Geospa-tial databases include: topographic maps, air photos, satel-lite images, nautical and aeronautical charts, census and elec-

The Global Geodetic Observing System GGOS 2020 88
toral areas, forestry, soil, marine and biodiversity inventories.Geospatial information plays an important role in the everydaylives of Canada’s citizens, echoing the drivers of the NSDI andASDI referred to already. In essence, geospatial informationprovides details or characteristics (i.e. buildings, roads, demo-graphics, water, soil, weather, topography, wildlife, farming,etc.) regarding a geographic location, on land or water, andat a street, local, regional, provincial, national, or global level.As in the case of the US, Australia and Europe (see below),the Canadians have recognized that developments in informa-tion technology over the past decade have made both the accessto and the need for geospatial information expand exponen-tially. In 1999, the Government of Canada invested Canadian$60 million in a national partnership initiative to improveac-cess to geospatial information over the Internet. This initiative,known as “GeoConnections” (http://www.geoconnections.org),was led by Natural Resources Canada and was mandated to ac-celerate the development of a CGDI.
In Europe the SDI program is known as theInfras-tructure for Spatial Information in Europe(INSPIRE) (seehttp://inspire.jrc.it/home.html). The general situation regardingspatial information in Europe is one of fragmentation of datasets and sources, gaps in availability, lack of harmonizationbetween data sets at different geographical scales, and dupli-cation of information collection. It was concluded that ”theseproblems make it difficult to identify, access and use data thatis available.” Awareness has been growing at both the nationaland EU level regarding the need for quality geo-referenced in-formation to support, in the case of one quoted example, ”un-derstanding of the complexity and interactions between humanactivities and environmental pressures and impacts.” On the29 January 2007, the European Council adopted a directiveaimed at establishing INSPIRE, in accordance with the jointtext agreed by the Council and the European Parliament on 21November 2006 (see http://inspire.jrc.it/home.html for details).
While SDI initiatives are much more than about referenceframes and coordinates, there is a trend towards ever higherac-curacies in the SDI. This means that a corresponding improve-ment in the accuracy of the geodetic infrastructure generallyone order of magnitude higher is required. The SDI can bevisualised as many layers of spatial information resting onastrong geodetic “foundation” (see Figure 59, an example takenfrom the ASDI). Hence this foundation must be defined andmaintained to a high level of integrity. Any crustal motion im-pacts the realization of the national reference frame, and musttherefore be monitored so that a valid 4D reference system canalways be reconstructed. Furthermore, all geospatial datasetsmust be referenced to the correct 4D reference frame or da-tum. The transformations between different data, some histori-cal (e.g. contained within analog or digital cartographic data),some contemporary, must be defined to the appropriate levelof accuracy. Finally, the quality and integrity of the GNSSs(the geopositioning “workhorse”) technology and the associ-ated high accuracy techniques, must be consistent and quantifi-able if the crucial connection between geopositioning and SDI
is to be maintained for the benefit of so many applications.The potential economic, social or environmental impacts
of inconsistent geopositioning or misaligned spatial datasetsare illustrated by the following examples:
1) Two engineering crews building a bridge from oppositesides of a bay; failing to align properly when they meet inthe middle.
2) Floodplain maps, levee construction, and ocean stormsurge models all using different height systems; thus fail-ing to adequately identify which city areas are in dangerof flooding during hurricanes or storm surges.
3) Road construction and car navigation systems using differ-ent coordinate systems; failing to safely determine whichlane a car is driving in.
4) Automated airline navigation systems which takeoff andland at airports using different, inconsistent geoposition-ing for their runways; thus potentially causing safety fail-ures.
5) Geospatial products to support disaster relief efforts,suchas in the case of Hurricanes Katrina and Rita last year inthe U.S. Gulf Coast Region.
These examples are but a handful that demonstrate the criticalnature of a well-defined and widely-adopted SDI. The use ofgeodesy to define the spatial data infrastructure of a city, region,country or even of the entire planet (the ultimate goal) impactsthe functioning of modern society in so many ways. Withoutan appreciation of SDI, the applications discussed here wouldappear disjointed and unconnected, yet the reality is very dif-ferent. This chapter will highlight the economic and socialim-pact of geodesy in different application areas by focusing on thecommon thread - that geodesy is the foundation for all high fi-delity spatial data, and the very different applications ofgeopo-sitioning and spatial information are merely industry-specificexamples.
4.2 Navigation
Navigation is the act of guiding person or vehicle (ship, air-craft, spacecraft) in a safe and expeditious manner from onepoint to a destination. A crucial characteristic of navigation isthat geopositioning is required inreal time, while underway.For many centuries navigational science has been a driver foradvances in geodesy, applied mathematics, cartography, me-chanical (and in the20th century electronic) position determi-nation technology, to name but a few. Initially navigation wasintimately related to maritime commerce and warfare, but inthe20th century navigation has been applied first to air flight, laterto spacecraft operations, and increasingly in the last decades toland and personal navigation. The next frontier is navigation asan indispensable capability of robotics or autonomous devices(Section 4.3). Modern navigation is reliant on geopositioning

The Global Geodetic Observing System GGOS 2020 89
Figure 59. A Model of the Australian Spatial Data Infrastructure.
technology (these days principally GNSS) and spatial data (i.e.,digital maps and geospatial databases).
The GPS of the U.S. has truly revolutionized geodesy,surveying and navigation in the last two decades. Remarkably,the same space hardware and control facilities allow geodesiststo determine the ITRF to sub-cm accuracy, and navigators at seato position their ships to ten meter accuracy. Hence GPS (andsoon other GNSSs) is one of the “threads” that links geodesyto vital applications such as navigation. Although maritimenavigation is subject to guidelines issued by theInternationalMaritime Organisation(IMO), and aircraft navigation to stan-dards and procedures approved by theInternational Civil Avia-tion Organisation(ICAO), both have identified GPS/GNSS asthe critical geopositioning technology. Furthermore, nationaland international charts (and other forms of spatial information)are increasingly based on a reference frame defined throughgeodesy. Therefore, another benefit of the SDI is to ensurethe layer of spatial information vital for safe navigation on thesurface of the Earth is “aligned” with all other data, such asthe natural topography, transport infrastructure, the built envi-ronment, etc. The WGS84 datum, although not of the samefidelity as ITRF, is important as it is the reference system ofbroadcast GPS data and thus is the “default” reference frameof non-augmented real-time GPS point positioning. Many in-ternational maritime and aeronautical charts are based on theWGS84 datum.
4.2.1 Marine navigation
The ever increasing reliance of navigation on GPS/GNSS, andspatial information georeferenced by the geodetic frameworkor datum, means that society benefits enormously from the in-creased efficiency and safety of maritime, air, space and landnavigation. This can be illustrated with many examples, butconsider one from maritime navigation. In the United States,the NGS participated in a navigation demonstration in the SanFrancisco Bay region. Bathymetric charts were converted toan ellipsoid height system (to be totally consistent with GPSheights, which are also ellipsoidal) and GPS receivers wereplaced around the Bay, on buoys and at three locations on aship (to determine roll, pitch and yaw). These sources of data,combined with detailed information about the size and shapeofthe ship were used with kinematic positioning software to de-termine, in real time, the location of the ship’s underkeel loca-tion to a few centimeters of accuracy in real time. Because thebathymetric charts had been converted from a hydrographic toa geodetic (ellipsoid) frame, they were consistent with theGPSpositions of the ship. This allowed for a accurate location of thebottom of the ship relative to the dredged channel in the Bayto be determined to a few centimeters accuracy (requiring thebathymetric charts to be of equal accuracy). Normally, a ship’sknowledge of its underkeel clearance is on the order of a meteror so and this often means that ships must maintain greater thana meter of clearance as a safety buffer, simply because of ver-
The Global Geodetic Observing System GGOS 2020 90
tical uncertainties. And what that, in turn, means is that shipspurposefully carried less cargo, so as to float higher to maintainthis larger safety buffer. What the demonstration proved wasthat this buffer could be significantly decreased, while main-taining safe passage. Specifically for the shipping industry thismeans an increase in cargo capacity, increased shipping effi-ciency, lower freight charges (and increased profit), without theneed for expensive port and channel upgrades.
4.2.2 Air navigation
Similar examples may be quoted from civil aviation, whichhas made GNSS the cornerstone of theFuture Air Naviga-tion System(FANS). According to ICAO, at its simplest level,FANS-equipped aircraft use GPS to determine their locationand altitude. GPS in this context replaces older and less ac-curate navigation systems. The aircraft transmits its locationusing VHF or satellite communications so that air traffic con-trol (ATC) can learn the locations of aircraft without the needto use radar. ATC radar is often absent over oceans and certaincontinental areas, so the first benefit is an increase of safety -decreasing the risk of midair collisions. Prior to the advent ofFANS, pilots had to speak their location over voice links, typ-ically HF radio. Given the inaccuracy ofInertial NavigationSystems(INS) and the noise present on HF links, ATC wouldinsist on quite large separations between aircraft. By increasingaccuracy and thus decreasing separations, FANS allows aircraftto fly closer to their preferred routes or ideal routes. An idealroute is typically: a) that great circle route (the shortestdis-tance between two locations), and b) the route best suited tothe prevailing winds. The optimal route is to position the air-craft with a maximum tail wind, certainly doing the utmost toavoid strong head winds. However, for air navigation more im-portance is often placed on the reliability and integrity ofthegeopositioning technology (and the charts/maps) than on nav-igational accuracy. For this reason ICAO has encouraged thedevelopment of independent GNSSs (e.g. Russia’s GLONASS,and the planned EU Galileo), as well as new transmitted GNSSsignals, in order to provide for sufficient redundancy. Geodeticmonitoring of the quality of GNSS, as well as the datum uponwhich the terrain features are mapped, are critical contributionsthat geodesy makes to air navigation.
The potential use of GNSS positioning to assist aircraftlandings, particularly in low visibility conditions, is also cur-rently being considered, Clearly this is one example where con-sistency of SDI is imperative, ensuring the airfield informationis compatible with the datum used by the aircraft.
4.2.3 Land navigation
The land navigation market is a rapidly growing segment ofwhat is now generally konwn as the “telematics” market, andit also relies on the “twin” geodesy contributions of a precisegeopositioning technology such as GNSS on the one hand, anddigital road/map data on the other. Newlocation-based ser-vices(LBS), for consumer and enterprise users, are valued at
tens of billions of dollars per year, and represent a new industrysegment with massive potential for growth (expected to growatover 10% per year over the next decade or so). Increasingly theSDIs must expand to accommodate ever more spatial data setsof interests to LBS users, such as points-of-interest and eveninformation with short temporal relevance.
4.3 Engineering, surveying and mapping
This field has traditionally been the preserve of experts in mea-surement and geopositioning. However, as in the case of navi-gation, with the advent of GNSS, the ability of more and morepeople to access quick, easy and accurate geopositioning infor-mation has grown exponentially. There is no doubt that fieldmapping/surveying (and construction/mining engineeringthatare dependent upon the products of mapping/surveying) has in-creased significantly in productivity, reliability and accuracy- leading to associated savings in construction and mappingcosts. Increased automation of machinery, advances inInfor-mation and Communication Technology(ICT), increased inte-gration of different geospatial measurement and imaging tech-nologies, and the trend to more real-time operations (includingsophisticated field-to-finish surveying systems that exchangegeospatial information between office and field units, acrossdata networks, and even between field units), all will place evergreater demands on geodesy and geopositioning technologies.That includes offshore engineering and hydrographic mappingoperations.
There is unfortunately a downside. In mere seconds, usersof GNSS can obtain 3D coordinates. However, detailed knowl-edge of what reference frame or datum the positions are re-ferred to, the type of height obtained, and the accuracy of thecoordinates may not be obvious to those without professionaleducation. This situation is exacerbated when new technolo-gies such asReal-Time Kinematic(RTK)-GNSS are used in en-gineering and other precise applications. The RTK systems al-lows a sub-centimeter differential positioning between a “basestation” and a “rover”. The most egregious problem with thissituation is that a base station whose true location is not prop-erly known will yield rover coordinates that are equally in error.Consider, for example, the situation where two local govern-ments (say a municipality and a state) offer RTK base stationsand an RTK subscription service. If those two overlapping ser-vices do not have their base stations consistent with one another(e.g. through ties in some form to the SDI), then all engineeringprojects built with one service will not align properly withthoseof the second service. This coordinate inconsistency couldleadto massive economic losses and is a critical challenge to gov-ernments at all levels. The issue of overlapping RTK networksalready exists in many places in the world. In the United States,this issue has spurred NGS to begin investigating the creationof an RTK accreditation system to ensure that overlapping RTKnetworks will be “NSRS compatible.”

The Global Geodetic Observing System GGOS 2020 91
4.3.1 Machine guidance
For example, the guidance of construction machinery is pri-marily based on centimeter level RTK-GNSS techniques, pos-sibly augmented with INS, optical guidance and other position-ing sensors. The driver is “guided” so that trenching, grad-ing and other operations are carried out according to a designmodel. This results in greater certainty in construction, higherproductivity and less waste (e.g. over-excavating), and less la-bor, with commensurate improvements in safety. In addition,when the track of machinery has been is determined and trans-mitted back to an office, a permanent digital record of the newterrain surface becomes available. The trend is toward fully-automated machinery, “controlled” by precise GNSS naviga-tion and its augmentations (inertial, etc.). Similar trends areexpected with the automation of farming (see Section 5.9.3),container port loading/unloading operations and opencut min-ing, to name but a few potential machine automation applica-tions. Initially such automation will take place for machineryoperations on the surface of the earth, where GNSS signals canbe tracked. Indoor positioning at such high levels of accuracyare far more challenging, and advances in technology and itsimplementation will be slower than in the case of “open sky”applications. However, it must be emphasized that for many ofthese applications what is required is accuracy and reliabilityof geopositioning, both in a coordinate/reference frame sense(i.e., the coordinates must be expressed in the correct datum, towhich other spatial data are referred) and relative to the “realworld” (i.e., objects and terrain that the machinery must navi-gate around and over).
4.3.2 Land titling and development
Land development and infrastructure engineering requiresin-tegrity of coordinates (both those derived from technologiessuch as GNSS, as well as implied from previously mapped fea-tures). Imagine that the uncertainty of land boundaries is com-bined with ambiguous geopositioning in the field: Designs fora new road or other piece of infrastructure would be wrong,and this mistake would be compounded in the field when thegeopositioning technology guides construction machinerytothe wrong location. Land ownership remains to this day oneof the cornerstones of national and personal wealth. Currenttrends are towards a cadastre where parcel boundaries are de-scribed by coordinates rather than length. This trend is in re-sponse to the need to overlay a series of other land managementdata sets onto the cadastre, and to implement efficiencies whensurveyors relocate existing boundary corners. Land ownersandgovernmental instrumentalities can now correctly interpret landuse patterns on a parcel-by-parcel basis, including the locationof underground services like sewage, water and electricity. Aunique challenge occurs in mining operations: how to relateunderground operations (where GNSS cannot be used) to thesurface (where increasingly GNSS is the critical geopositioningtechnology). Furthermore, with increasing interest in the“ma-rine cadastre”, and the definition of offshore boundaries ingen-
eral (Exclusive Economic Zone, state jurisdiction, continentalshelf, fisheries, mining/drilling, conservation zones, etc.), coor-dinates on the ocean surface and those at the sea bottom mustbe seamlessly connected to a nation’s land datum. Again, theSDI layer model is pertinent.
Another concept is the inclusion of cadastral survey ob-servations into regional geodetic adjustments constrained byspace geodetic techniques. This is commonly referred to as a“geodetic cadastre”, and has the impact of propagating geode-tic coordinates at a far greater density than most geodetic net-works could hope to achieve. In countries like New Zealandthis is used to monitor the temporal variation in network geom-etry caused by localized tectonics.
4.3.3 Engineering geodesy and structural monitoring
Engineering Geodesy is the term that describes the use of veryprecise measurement and analysis models to monitor the defor-mation of anthropogenic structures such as tall buildings,stadi-ums, bridges, breakwaters and other port engineering, offshoreplatforms, dams, etc., as well as ground subsidence due to aunderground mining, soil compaction and fluid extraction (e.g.,oil, water, gas). Increasingly GNSS receivers, accelerometersand a variety of geotechnical sensors (inclinometers, strain-meters, fiber-optic cables, etc.) are being installed at thetimeof construction. Such a whole-of-life “structural health mon-itoring” approach to infrastructure management is a growingtrend. This is in contrast to the current practice of retrofittingstructures to monitor loads (and subsequent deformations)afterthey have been built, for example to ensure safe continued op-eration of a structure as it nears the end of its life, or when/afterit is subjected to loads well beyond what it was designed towithstand. A precise, consistent and time-stable geodeticrefer-ence frame (which may be a local datum, and not necessarily aglobal one) is essential, as well as high integrity geopositioningtechnologies such as GNSS and differential InSAR (in the caseof ground subsidence).
4.3.4 Geographic information systems
Mapping technologies such as scanning and imaging sensorsneed direct georeferencing (e.g. using GNSS/INS). These daysgeospatial data is stored, manipulated, analyzed and visualizedwithin special database and computer graphics systems knownasGeographic Information Systems(GIS). GIS is designed toallow the display and query of spatial data in the form of “lay-ers”. To “stack” the spatial data layers so that they are alignedcorrectly requires that they be carefully referenced to theun-derlying geodetic layer or datum (Figure 59). Geographic el-ements within each layer include points, lines and polygons,each with “attribute” information (e.g., describing what it is,and other pertinent textual/contextual information). A specialexample of point data are terrain models such as ground-levelDigital Elevation Models(DEM), or tree/building-topDigitalSurface Models(DSM). It is this combination of spatial andtext information that gives GIS its unique abilities to provide

The Global Geodetic Observing System GGOS 2020 92
both graphical and quantitative answers to “what if?” scenar-ios and queries framed in terms of Boolean operations, as wellas to create “custom” thematic maps or graphical outputs. GISis increasingly being used as a decision-making tool, assistingpolicy advisers, government agencies and businesses to deter-mine the consequences of a certain action or impact on land,communities, infrastructure, biota, etc. GIS technology,geopo-sitioning and spatial information are all necessary for naturaland built environmental monitoring, natural resource manage-ment, land development, disaster and emergency management(see Section 4.5), transport planning, epidemological studies,and much more.
Increasingly GIS capabilities are being offered via theWorld Wide Web(WWW, “web-GIS”), so that users can createcustom “views” of spatial data by selecting from many spatialdata sets those that are of interest to them. Queries can thenbe made as in the case of traditional desktop GIS (see above).Again, it is crucial for correct decision-making that the data setsare integrated within the SDI, so that there are no ambiguitieswith respect to the datum.
Mapping technologies such as aerial laser scanners (LI-DAR), and airborne and satellite digital cameras/sensors,aregenerating enormous volumes of data. The growth of spatialdatabases, especially those containing remote sensed highres-olution (i.e. sub-meter ground object resolution) satellite im-ages, is very rapid. Direct georeferencing ensures that thisdata can be correctly integrated with historical spatial data anddata generated from ground-level surveys. The management ofthese spatial databases is an increasingly challenging problem.
4.3.5 Height systems
The vertical datum is a critical issue for many engineering,surveying, and mapping operations. Extremely accurate air-borne and helicopter LIDAR systems are being used to sup-port many engineering projects and to develop new DEMs andDSMs, but in many cases they depend on the quality of the ver-tical reference surface to meet the requirements of the project.The reason is LIDAR systems, as in the case of digital andtraditional photogrammetric systems, derive their georeferenc-ing information from GNSS/INS. Hence the height informa-tion is in relation to a reference ellipsoid, and not to the geoid(or other physical/mean sea level datum). Local geoid modelsderived from detailed surface gravity observations andEarthGravitational Models(EGM) can define the vertical surfacesto which heights are referenced, but being global in nature,are incapable of capturing local geoid structures. This canlead to errors of decimeters to meters over areas tens to hun-dreds of km across. In the case of the NASA/NGAShuttleRadar Topographic Model(SRTM), all heights are referencedto a geoid model such as EGM96, while many heights usedfor engineering and surveying projects in the continental U.S.use the detailed geoid models developed by NGS, the latestreferred to as GEOID03. In Australia the geoid model, de-veloped by GA, is known as AUSGEOID98, and involves a
combination of geopotential model, surface and oceanic grav-ity anomalies, leveling data and satellite altimetry data.In Eu-rope theEuropean Gravimetric Geoid 1997(EGG97) is be-ing updated because significant new and improved data setshave become available since the last computation in 1997.These improvements include better global geopotential mod-els from the CHAMP and GRACE missions, better DEMs insome regions (e.g., new national DEMs, SRTM3, GTOPO30),updated gravity data sets for selected regions, updated shipand altimetric gravity data including improved merging pro-cedures, the use of GPS/leveling data, as well as improvedmodeling and computation techniques. In Canada the verti-cal heights derived from GNSS can be converted to the systemknown as CGVD28 using a geoid-based transformation model(http://www.geod.nrcan.gc.ca/software/gpshte.php). Everynation maintains their own vertical reference system, tradition-ally tied to mean sea level and therefore “connected” to thelocal geoid by some means. Increasingly it is being recognizedthat geodesy must unify these vertical datums in order to en-sure intercompatibility, in much the same way that most nationshave migrated to an ECEF-datum such as an ITRS realization.
4.4 Timing applications
GPS is used for time transfer between precise “clocks” (seeSection 2.9.4), as well as an inexpensive and readily avail-able time-base for synchronization of computer networks,telecommunications switches, energy grids, etc. The integrityof GNSS, which can be considered a byproduct of moderngeodesy, is therefore vital.
4.5 Early warning and emergency management
Search and rescue operations rely on accurate geopositioningand up-to-date spatial information. For example NGA devel-oped a host of GIS products for emergency management ofHurricanes Katrina and Rita in 2005, and the tsunami thathit Indonesia in 2004. Efficient rescue operations depend onmaps and GIS information that are of high quality, and in-creasingly developed from the latest spatial data sources,e.g.commercial high-resolution satellite imagery, or in future from”rapid mapping systems” based on UAV-mounted and terres-trial imaging/scanning systems. The ability of a host of agen-cies to then utilize high quality GIS information provides su-perior situation-awareness and allows policy-makers the meansto make informed decisions. Emergency crews then “navigate”the disaster area, and relief supplies and equipment are deliv-ered, using GPS/GNSS technology.
Risk management requires modeling the effects of severenatural events such as cyclones and tsunamis, which requireauniform and accurate understanding of the topography, includ-ing the transition from land-based DEMs to bathymetry. Thisallows engineers to accurately estimate inundation zones andwind speed variations in the case of cyclones, and inundationand run-up zones for tsunami events. The only system capable
The Global Geodetic Observing System GGOS 2020 93
of providing accurate heighting for both is based on the ellip-soid, since the relationship between Lowest Astronomical Tide(generally used for bathymetry) and Mean Sea Level (generally,though erroneously used for DEMs) is not well understood atall locations. Geodetic infrastructure provides access toan ac-curate ellipsoid.
Another emerging application of geopositioning in theemergency management area is vehicle and personal locationsystems in emergencies, particularly bushfires where visibilityis much reduced. An understanding of the location of assets di-rectly impacts on fire management, and evacuation processes.This is analogous to “friendly fire” avoidance in the militaryenvironment.
Many high-profile events held around the world, includ-ing the Olympics, Super Bowl, World Series, Soccer WorldCup, political conventions, G8 and APEC leaders meetings,etc., depend on high quality geospatial information in prepa-ration for possible emergencies that may arise from an act ofterrorism or other threat. These GIS products are built fromimagery and other geospatial data, and need to be referencedtoa common datum, and be accessible to emergency managementofficials if and as they are needed. The rapid deployment andresponse of emergency personnel can only happen if they knowprecisely the geospatial “picture” of the situation.
4.6 Infomobility
Modern society is mobile, requiring timely answers to suchqueries as: “Where am I?”, “Where are you?”, “Where isthat?”, “How do I get from here to there?” while on themove. The availability, on the one hand, of wireless com-munications and sophisticated mobile information devices(thecell or mobile phone, personal digital assistant, etc.), togetherwith GPS/GNSS and GIS on the other hand, has spawned anew field of “infomobility”. This new cross-disciplinary field(also known as location-aware computing, context-aware com-puting, telematics, telegeoinformatics, etc.) links informationtechnology and wireless communications (together represent-ing the ICT discipline), and geopositioning systems to digitalmaps and geographically-referenced data delivers information-rich services appropriate to the location of a person or object,via a mobile device. Infomobility is part of the broader fieldof geotechnology (also known as geoIT, geospatial informa-tion science, etc.) identified by the US Department of Labor in2004 as one of the three most important emerging and evolvingfields, along with nanotechnology and biotechnology (Gewin,2004). The characteristic which most distinguishes infomobil-ity from other geotechnology applications is the small interac-tive mobile device having both wireless connectivity (to webservers via the mobile Internet) and location determination ca-pability (via GPS or some other means), running specially de-veloped client software.
Infomobility applications are also often referred to asLBS, although it could be argued that LBS is a subset of in-fomobility as it implies some sort of “transaction” betweenthe
mobile user and a service provider. Infomobility may be parti-tioned into three major categories:
• Vehicle-based applications, sometimes also known as“telematics” services, comprising essentially of car nav-igation systems, driver and passenger assistance ser-vices, and vehicle management systems (Rizos & Drane,2004). These rely primarly on GPS/GNSS, augmentedwith wheel sensors and map-matching to provide continu-ous location information, even in urban areas and tunnelswhere GNSS signals do not penetrate.
• Personal services, many of them similar to vehicle telem-atics services, but delivered to a portable device to aid peo-ple on the move. The requirements to deliver geoposition-ing is far more stringent than for vehicles, as people spenda lot of their time inside buildings, where GPS/GNSS isnot well suited (though Assisted-GNSS techniques do in-crease the sensitivity of receivers to weak satellite signalsattenuated by buildings, walls, trees, etc. Therefore pedes-trian navigation requires a ”mix” of geopositioning tech-nologies, including cellphone signals, WiFi, inertial, pe-dometer, and so on.
• The tracking of inanimate objects, in logistics and ware-housing applications. These may be for individual highvalue assets, or container/pallet tracking. As with pedes-trian applications, the mix of geopositioning technologieshas GNSS as a core, but augmented with short range com-munications sensors, such as RF tags known as RFID andWiFi to give indoor coverage.
What sets infomobility or LBS-type applications apartfrom “information on the move” (e.g., m-commerce, e-commerce) is the central role played by geopositioning andgeospatial data in general. GNSS is a key technology, but thereare other geopositioning sensors that may be used in combina-tion with GNSS (or even on their own), such as inertial sensors,pedometers, altimeters, WiFi, cellphone, UWB, RFID, and vi-sion systems. It must be emphasized that these applicationshave commercial (or business) counterexamples to personal(orconsumer) ones. For example:
• The tracking of commercial fleets (taxis, couriers, publictransport, dangerous cargoes, etc.) is an important vehicletelematics application.
• Positioning/tracking of emergency service workers (e.g.firefighters, police, rescue workers) and soldiers, are ex-amples of personal infomobility applications. The envi-ronments in which these are expected to operate challengestandard GNSS technology, which has led to considerableinnovation in geopositioning.
• The massive uptake of RFID “tagging” systems will dis-place barcodes as the primary means of keeping track ofstock in warehouses, in transit, in retail shops, etc. Withina decade many household items will be “tagged”, andhence “trackable”.

The Global Geodetic Observing System GGOS 2020 94
It is predicted that there will be a massive growth in such appli-cations, and listed here are just some of these in order to givean impression of the future infomobility applications:
• cyber-geography, geo-blogging, GeoSearch, georeferenc-ing web pages, the Geospatial Web,
• spatialized (media) art, location-based games,
• context-sensitive (location-based) advertising, spatialsearches (e.g. Google Earth, NASA’s World Wind, MSN’sLocal Live, Yahoo), tourism guides,
• augmented and mixed reality for work and pleasure,
• supranet, smart dust, sensor nets, etc.,
• information portals for mobile workers (answering ques-tions such as “where are you?”, “are you all right?”),
• tracking and location privacy (rights and freedoms in amodern technological society),
• RFID-tracking, enterprise databases and navigationqueries (answering questions “where is it?” about inan-imate objects), and
• telematics and Intelligent Transport Systems.
Geospatial information is the IT “content” for most, ifnot all, of these applications. As with many other geospatialapplications, geoIT requires that different spatial data (the co-ordinates of a mobile device, the location of a place-of-interest,the road network linking different parts of the city, and so on)must all be consistent, i.e. on the same geodetic datum.
4.7 Management of and access to natural re-sources
4.7.1 Water management and hydrology
The SDI of geodesy provides a framework for basic water man-agement - river monitoring relies on a fundamental referencesystem, and the assessment of water rights is fundamentallytied to the properties of area and geography. The assessmentof aquifers is aided by new technology: satellite and abso-lute gravity measurements can infer changing volumes of wa-ter stored in subterrain aquifers, and repeated GPS observationsand InSAR can detect surface movements caused by depletionof such aquifers. Geodesy therefore can play a role in monitor-ing the rate of fluid extraction (including illegal groundwatermining), providing information to policy-makers.
The new type of satellite missions measuring gravitychange (currently, GRACE) promises major impacts on thequantification and understanding of the global hydrological cy-cle. Whereas traditional hydrological models have focusedon details, using models of snow and rain falls, groundwa-ter changes, river runoff, etc., on local to regional scales, themeasurement of gravitational changes gives overall integrated
bounds on the hydrological cycle on continental scales. Theproven monitoring of the yearly hydrological cycle over ma-jor tropical jungle areas such as the Amazon and South-EastAsia are spectacular examples of the success of the new classof gravity field change satellites, and with likely new tech-nological breakthroughs (laser interferometry missions)withinthe next decade, the gravitational monitoring of major drainagebasins on a global scale is within reach.
Major engineering structures used for water management(dams, channels, etc.) are obviously heavily relying on thegeodetic SDI. The level of water is dependent on the gravityfield, and highly accurate 3D-networks with associated gravi-tational information (geoid models) are a necessity for majorconstruction projects. The monitoring of such projects afterconstruction is another domain where geodesy plays a key role,with the long-term stability of reference frames and monumentsbeing essential for the monitoring of any movements or subsi-dence of the structures and artificial lakes.
4.7.2 Energy resources
Energy, in the form of electricity, is derived from a varietyofrenewable and non-renewable sources. Examples of the formerinclude photovoltaic technology, wind, hydrodynamic and tidalpower. The latter include coal, nuclear and gas-fired powersta-tions. All forms of energy generation require massive invest-ments in infrastructure: power stations, pipelines, transmissionlines, power grids, etc. From a strictly engineering point ofview, such infrastructure must be designed and built in the rightlocation, the structures may need to be monitored (episodicallyor continuously), and the components must “fit” together (notjust in a physical sense, but operations need to be synchronisedto microsecond levels of accuracy - see Section 4.4).
Traditionally the geodesy and surveying disciplines haveassisted exploration geophysicists in locating buried coal orebodies and oil fields. There is still considerable activity in seek-ing out non-renewable sources of energy from offshore loca-tions, in deeper water, further away from shore. Offshore engi-neering is a discipline that is becoming increasingly important.However, apart from the challenge of working in a watery en-vironment, the SDI off shore is very much wanting. Geospatialdata quality is very patchy, and it is generally conceded that thequality of maps of the moon’s surface is better than for manyparts of the Earth’s deep oceans. The challenge in ocean bot-tom geodesy has long been recognized (Spiess, 1990, e.g.,),and despite the fact that for the IYPE, extending the successof geodesy on land onto the ocean bottom is a key goal (Chenet al., 2005), it is not likely that considerable progress will bemade soon.
Increasingly the geodesy and surveying skills (and the un-derlying geodetic reference frame) must support new powergeneration technologies, such as designing new wind farms,tidal power systems, etc. In these cases use is made of GIS toassess the likely impact of new infrastructure on the land, com-munities and biota. A new field of mapping is in support of

The Global Geodetic Observing System GGOS 2020 95
Carbon Credits, e.g. in the planting and monitoring of forests.
4.8 Monitoring the environment and improvingpredictability
Vulnerability of the society to extreme weather events, distur-bances in critical infrastructure through environmental varia-tions, and potential impacts of climate change necessitateim-proved predictions of weather, climate, and other environmen-tal events. Geodetic techniques, in particular, GNSS, sense theatmosphere with electronmagnetic waves, which can be usedto extract information on ionospheric electron content, tropo-spheric water content, and, potentially, carbon dioxide. Below,GPS meteorology and space weather are considered as exam-ples. Other applications such as monitoring of sea level, icesheets, lake levels, and carbon dixoide are addressed in otherchapters.
4.8.1 GPS meteorology
Water vapor plays a crucial role in the dynamics and thermo-dynamics of many atmospheric processes that act over a widerange of temporal and spatial scales. Covering both the globalhydrological and energy cycles, which effectively define the lo-cal and global climate change, contributing largely to the green-house effect, and playing a critical role in the vertical stabilityof the atmosphere and in the structure of the evolution of atmo-spheric storm systems. The scarcity of traditional meteorologi-cal observations, especially over the Southern Ocean and PolarRegions, as well as the shortcomings of the traditional meth-ods over the land, have contributed greatly to uncertainties in aglobal and regional weather analysis. GNSS offers a new, moreeconomical, and in principle real-time, method of measuringatmospheric water vapor.
A number of studies conducted in the 1990s have shownthat the amount of precipitable water contained in the neutral at-mosphere can, in fact, be retrieved using ground-based GPS re-ceivers (see Section 2.9.1, Figure 41 on page 54). In addition, ithas been demonstrated that a GPS receiver aboard a microsatel-lite in a low Earth orbit, supported by a ground-based networkof receivers, can be used to determine the atmospheric refrac-tive index as a function of altitude during the event of satelliteoccultation by the Earth (Figure 42 on page 55). Thus, theavailability of remote sensing observations from GPS radiooc-cultation sensors provides a unique opportunity to improvethequality of regional meteorological analysis, particularly overthe traditionally under-sampled regions, as well as promise ofhigher spatial and temporal resolutions, if a sufficient numberof sensors are launched and supported by an adequate ground-based tracking network.
4.8.2 Space weather
Space weather refers to conditions on the sun and in the solarwind, magnetosphere, ionosphere and thermosphere that caninfluence the performance and reliability of space-borne and
ground based technological systems and can even endanger hu-man life or health. Thus, ionospheric irregularities are one ofthe key components of the space weather that require specialat-tention. Advances in space weather forecast require improvedunderstanding in the area of the ionosphere/thermosphere sys-tem. Any forecast model must begin with a detailed specifica-tion of the current state of the system, which is provided eitherby empirical models or by assimilative models. The ionosphereis one of the most detrimental error sources in satellite naviga-tion and communication systems. While spatial and temporaldistribution of ionospheric disturbances are of primary interestin their own scientific context, they are also of special interestto communication, surveillance and safety-critical systems sup-porting air navigation, as they affect the skywave signal channelcharacteristics.
A large number of worldwide stations permanently track-ing GNSS can deliver large volumes of data suitable for con-tinuous, near real-time ionosphere monitoring during the dis-turbed and quiet geomagnetic conditions, and offers an attrac-tive alternative to the traditional methods. GNSS provideshigh-resolution TEC measurements. Classical ionosphere moni-toring methods based on ionosondes andIncoherent ScatterRadars(ISR) have many disadvantages as compared to GNSS.Hence GNSS geodesy offers the best option for providing de-tailed information on ionospheric conditions, an essential com-ponent of any space weather monitoring system.

The Global Geodetic Observing System GGOS 2020 96
5 Earth observation: Serving the needsof an increasingly global society
D. Sahagian, J. Abshire, D. Alsdorf, P. Davis, P. Houser, C.Kreemer, J. Melack, M. Pearlman, H.-P. Plag, P. Poli, S. Reid,M. Rodell, R. Thomas, P. L. Woodworth
In this chapter, we examine the potential of geodesy fromthe point of view of what society needs in terms of Earth obser-vations to ensure the security of people and resources, and toachieve a sustainable sustainable utilization of ecosytemgoodsand services. Many of these applications depend on Earth ob-servations, bothin situ and remotely from space or airbornesensors. The framework for these observations is dominatedbya few international programs, such are implemented and sup-ported by GEO, IGOS-P, CEOS, the European Commission,UN agencies, and national contributions.
GEO’s visions for GEOSS, in brief, is to enable a futurewhere decisions can be based on information (see GEO, 2005a,for the full text of the vision; also on page 164). GEO is fo-cused around nineSocietal Benefit Areas(SBA) of Earth ob-servation as identified by EOS-II (see Table 7). Thus, we starthere from the information needs of these SBAs, which then canbe translated into observational needs. Finally, the potentialcontribution of geodesy can be extracted from these needs. Inthe next section, we will briefly review the Earth observationframework and introduce the nine SBAs. Subsequently, we de-vote separate sections to each of the SBAs that can benefit fromgeodetic observations and/or products.
5.1 The current and future framework of globalEarth observations
Major early milestones towards integration of the global Earthobserving systems were the definition of the IGOS, and the es-tablishment of threeGlobal Observing Systems(G3OS) in thecontext of theUnited Nations Framework Convention on Cli-mate Change(UNFCCC) in the mid-1990’s. Initially, IGOSwas of particular importance within Earth monitoring basedonremote sensing (see, e.g., Williams & Townshend, 1998), anditwas developed in the framework of the G3OS (see, e.g., Dahl,1998). The drivers for IGOS are the scale of the issues (globalclimate change, sustainable development) to be addressed,thecost of space components for remote sensing of the Earth envi-ronment, the logistics especially forin situ data, and the needfor data integration from multiple sources for products of use todecision makers, science, and society at large. For key variablesof the Earth system, IGOS attempts to provide long-term con-tinuity, adequate data archives and accessibility, consistency ofdata records, and the ancillary data required for data qualityassessment. IGOS provides the framework for a coherent re-sponse of the monitoring system to the integrated user require-ments. IGOS intends to build upon existing strategies for inter-national observation programs, focusing on the identification of
areas where the existing systems can be improved, where du-plication of observations can be reduced, and gaps in observa-tions and data sets can be identified. If effectively implemented,IGOS appears to be the strategy for providing the observationalbasis for a future Earth information system. A key issue iden-tified in IGOS is the need to transform many observational ac-tivities from their research states into operational monitoring.
In 1998 the further development and implementation ofIGOS was put into the frame of theIntegrated Global Observ-ing Strategy Partnership(IGOS-P) (see, e.g., Smith, 1998, forthe early development of IGOS-P). IGOS-P is a partnershipof organizations that are concerned with global environmentalchange issues. IGOS-P links research, long-term monitoringand operational programs. IGOS-P seeks to provide a com-prehensive framework to harmonize the common interests ofthe major space-based andin situ systems for global observa-tions of the Earth. Its aim is to provide an over-arching strat-egy for conducting observations relating to climate and atmo-sphere, oceans and coasts, the land surface and the Earth’s in-terior. The Partners, through IGOS, build upon the strategiesof existing international global observing programs, and uponcurrent achievements, in seeking to improve observing capacityand deliver observations in a cost-effective and timely fashion.Main efforts of IGOS-P are directed to those areas where sat-isfactory international arrangements and structures do not cur-rently exist. Most of the IGOS-P efforts are concentrated inasmall number of so-called Themes with strong linkages to crit-ical social issues.
The last few years have seen a rapid programmatic de-velopment in Earth observations on global scale, stimulated inpart by activities in Europe. There, theGlobal Monitoring forEnvironment and Security(GMES) initiative was launched inMay 1998 and adopted by ESA and the EU Councils in Juneand November 2001, respectively. The overall aim of GMESis to support Europe’s goals regarding sustainable developmentand global governance by providing timely and quality data,information and knowledge (European Commission and ESA,2003).
Following up the recommendations of theWorld Summiton Sustainable Development(WSSD) held in Johannesburg in2002, the firstEarth Observation Summit(EOS-I) was held inWashington, DC, in July 2003. This summit initiated an un-precedented global effort towards coordination of global Earthobservation. Through its declaration (see Annex 1 in GEO,2005b), EOS-I established thead hocGEO with the task todraft a 10-year Implementation Plan for GEOSS. Subsequently,this ad hocGEO met six times, and supported by several Sub-groups, drafted the requested plan (GEO, 2005a) together witha reference document containing many details of the vision forGEOSS (GEO, 2005b). It is noted here that in less than twoyears of its existence, the membership of thead hocGEO hadgrown from initially about 30 countries to more than 60 coun-tries.
The work of GEO was guided by the Framework Docu-ment adopted by the EOS-II, which was held in Tokyo in April

The Global Geodetic Observing System GGOS 2020 97
Table 7. The nine societal benefit areas of Earth observations as identified by EOS-II. From GEO (2005b).
Area Objective of GEO
Disaster Reducing loss of life and property from natural andhuman-made disastersHealth Understanding environmental factors affecting human health and well beingEnergy resources Improving management of energy resourcesClimate Understanding, assessing, predicting, mitigating, and adopting to climate variability and changeWater Improving water resource management through better understanding of the water cycleWeather Improving weather information, forecasting, and warningEcosystems Improving the management and protection of terrestrial, coastal, and marine ecosystemsAgriculture Supporting sustainable agriculture and combating desertificationBiodiversity Understanding, monitoring and conserving biodiversity
2004 (see Annex 2 in GEO, 2005b, for the full text). ThisFramework document identified nine major SBAs of Earth ob-servations (see Table 7) and emphasized strongly the impor-tance of coordinated global Earth observations.
The GEOSS Implementation Plan was adopted by EOS-III, which took place in February 2005 in Brussels. The samemeeting transitioned thead hocGEO into a permanent group.The presence is dominated (and so will be the next few years)by the first steps towards an implementation of GEOSS. IAGis involved in this process in order to ensure that the geodeticobserving system is developed consistently with the needs andprogress of GEOSS for a maximum benefit.
GEO (2005b) provides for each of the benefit areas anoverview of the requirements in terms of quantity and statusofthe observational capacity. Extracting the quantities potentiallycoming or benefiting from GGOS results in the list compiled inTable 8.
Geodetic observations contribute to Earth observation intwo very distinctive ways, namely (1) geodesy provides thereference frame in which all Earth observations can be asso-ciated with coordinates, and (2) geodesy provides observationsof quantities related to relevant processes (see Section 2.3).
All measurements depend upon a suitable reference framein which positions can be determined and against whichchanges in position can be measured. Based on the availabletools (see Chapter 2) geodesy provides this reference frameforthe Earth on a global scale in the form of the ITRF as well asfor space in form of the ICRF (see Section 2.2). With thesereference frames, geodesy serves a common need for all SBAsand society at large (see Chapter 4). In the following, we willnot address these requirements to any detail. Rather, we willfocus on the requirements for geodetic observations.
Geodetic observations can provide insights into a num-ber of critical areas that impact human society. These rangefrom understanding earthquake processes, assessments of haz-ards, detecting and tracking tsunamis to monitoring the effectsof climate change, and even prediction of volcanic eruptions(see Chapter 3). The following sections consider the observa-tional needs for each of the the SBAs listed in Table 7.
Table 8. Requirements for geodetic observables for the ninebenefit areas as reported in GEO (2005b). The fields andtheir status are extracted from the discussion of the URs forthe nine benefit areas in GEO (2005b). There, the status isindicated with the follow classes: 0: ok; 1: marginally accept-able accuracy and resolution; 2: could be ok within two years;3: could be available in six years; 4: still in research.
Observable quantity StatusDeformation monitoring, 3-D, over broad areas 3Subsidence maps 3Strain and creep monitoring, specific features or struc-tures
2
Gravity, magnetic, electric fields - all scales 3Gravity and magnetic field anomaly data 2/3Groundwater level and pore pressure 4-1Tides, coastal water levels 1Sea level 2-1Glacier and ice caps 2Snow cover 2Moisture content of atmosphere/water vapor 2Extreme weather and climate event forecasts 3Precipitation and soil moisture 3-1
5.2 Disasters: Reducing loss of life and propertyfrom natural and human-made disasters
One of the most important services that science can provide tosociety is understanding, predicting, and reducing of vulnera-bility to natural hazards. These can be divided into those stem-ming from the dynamics of the fluid envelope of the Earth suchas storms, storm surges and floods, those stemming for the dy-namics of the solid Earth, such as earthquakes, volcanoes, sink-holes, subsidence, precarious rocks, rockslides, and landslides,and those resulting from interaction of the solid Earth withitsfluid envelop, in particular tsunamis triggered by earthquakes,rockslides, volcanic eruptions, and submarine landslides.
In disaster prevention and mitigation, Earth observationsare pivotal in at least three aspects: (1) understanding thepro-cesses causing these hazards and assessing their risks for plan-ning and mitigation, (2) monitoring the development of haz-ardous situations and providing a basis for a decision on earlywarnings, and (3) determining the extent of a disaster as sup-

The Global Geodetic Observing System GGOS 2020 98
port for rescue and damage assessment. The first two aspectsare central for early warning systems. A comprehensive andeffective early warning system requires four elements, namely
• risk knowledge:a priori knowledge of the likely risk sce-narios a community might be faced with;
• monitoring and warning service: the capacity to monitorrisks and rapid and reliable decision mechanisms for earlywarning;
• communication: the ability to disseminate understandablewarnings to those at risk;
• response capability: knowledge and preparedness capac-ity by all partners of the information chain to act appropri-ately.
Geohazards are intimately connected to displacementsand deformations of the Earth’s surface. Consequently, geode-tic observations play a crucial role in all three aspects of dis-aster prevention and mitigation, including risk knowlegdeandthe monitoring of hazardous situations required for the im-plementation of early warning systems. The importance ofgeodetic observations for these hazards has been emphasizedby many (e.g. UNAVCO, 1998; Solomon & the Solid EarthScience Working Group, 2002; Raymond et al., 2003). Marsh& the Geohazards Theme Team (2004) state that “Geohazardsdriven directly by geological processes all involve groundde-formations. Their common observational requirements are forglobal, baseline topography and geoscience mapping, againstwhich surface deformations ... can be monitored.” Thus, theobservations provided by existing global and regional geodeticnetworks have already transformed our understanding of geo-hazards, and it is likely that these networks will play an evenmore important role in the future as their coverage and preci-sion improve. In many regions, observing systems dedicatedtogeohazards would also have to be flexible in spatial and tem-poral resolution, as well as readiness on demand. Therefore, inmany parts of the world, dedicated ground-based geodetic net-works are needed. In addition to the classical, point-orientedgeodetic techniques, 2-dimensional imaging techniques suchas InSAR are also needed. These techniques allow the mon-itoring of relevant areas with high spatial resolution, althoughcurrently not with the low latency and temporal resolution re-quired for some geohazards applications.
5.2.1 Landslides, rock falls and subsidence
Landslides are a major hazard causing many fatalities and sig-nificant damage in many locations. In the past century (1903-2006), landslides killed more than 60,000 people globally,af-fected more than 10 million people (many of them homelessafter the event), and caused damage on the order of 5 billiondollars (Salichon et al., 2007). Many landslides take placeinwidespread areas of slope instabilities caused by severe storms,
earthquakes, volcanic activity, coastal wave erosion, andwild-fires. Landslide danger may be high even as emergency person-nel are providing rescue and recovery services. Often, earth-quakes are accompanied by landslides, rockfalls, and othersur-face disruptions that can cause as much or more damage to an-thropogenic structures and systems than the earthquakes them-selves. These events are difficult to predict, but depend on re-cent weather conditions (i.e., precipitation and soil moisture),as well as land cover, topography, and earthquake recurrenceinterval. Steep topography near lakes and fjords has the poten-tial of large waves caused by rockslides into the water belowand pose a potential threat in some areas. Moreover, in manymountainous areas, the steep hill sides are a potential threat forthe people living at the base of these slopes or for the infras-tructure at the bottom of such hills. In many areas, slop slidesor slow landslides pose a problem, too.
In order to provide accurate landslide hazard maps, fore-casts of landslide occurrence, and information on how to avoidor mitigate landslide impacts, several questions must be con-sidered: Where and when will landslides occur? How big willthey be? How fast and how far will they move? What areaswill they affect or damage? How frequently do they occur in agiven area?
In known instable areas, networks of campaign-type orpermanent GNSS stations can be used to detect a change in themotion and thus indicate a potentially perilous situation.How-ever, the recurrence period of land- and rockslides can be longand in many areas the risk is not obvious. InSAR is an emergingtechnology that allows the determination of surface deforma-tion with high spatial resolution and accuracy in many regions(see Section 2.4.5). InSAR is expected to play a leading rolein the detection of geohazards and the monitoring of hazardousareas. InSAR has been successfully applied to the mapping ofcoseismic displacements (e.g., Massonet et al., 1993), deforma-tion at volcanoes, silent landslides (Ferretti et al., 2004), andanthropogenic subsidence. In particular, the combinationofpermanent GNSS stations with InSAR is expected to improvethe time series of deformation measurements considerably.
Potentially hazardous landslides and slow landslides as-sociated with human activities, as well as anthropogenic soilsubsidence caused by groundwater, oil, and gas extraction andmining activities, can increasingly be detected by using InSAR.Ferretti et al. (2004) analyzed an InSAR-based time series ofsurface displacements and detected several instable areasin theSan Francisco Bay area. In order to reveal such areas at an earlystage of the development of landslides or larger deformations,an accuracy of 1 mm/yr and high spatial resolution (< 100 m)are required.
The monitoring of anthropogenic subsidence also re-quires high spatial resolution and the determination of changesin the secular velocity of vertical land motion on the level of1 mm/yr. In areas with active mining and groundwater extrac-tion, changes in secular land motion have to be available withlow latency in order to detect potential hazards in a timely man-ner.

The Global Geodetic Observing System GGOS 2020 99
5.2.2 Volcano eruptions
Volcanic eruptions are comparable to landslides in number offatalities and extent of damage (Salichon et al., 2007). Volcaniceruptions have local to global impacts, and are typically pre-saged by directly observable events, including seismicity, gasrelease, and surface deformation. Modern volcano monitoringsystems integrate localized monitoring components and remotesensing.
GNSS and gravity measurements are integral parts of anymonitoring system of potentially hazardous volcanoes. Thecombination of these measurements provides a basis for under-standing the dynamics of subsurface magma movements andthe development of hazardous situations. Surface displace-ments can indicate magma movements not necessarily associ-ated with increased seismicity.
Increasingly, InSAR is applied to the monitoring of vol-canoes (see Section 2.4.5). However, for early warning pur-poses, the combination with local GNSS networks is crucial.Unfortunately, many of the hazardous volcanoes are not or notsufficiently monitored. The development of relatively cheapdisposable GNSS stations would be an advantage at hazardousvolcanoes.
5.2.3 Earthquakes
Earthquakes are a major source of disasters which over the lasthundred years (1903-2006) killed nearly 2 million people, af-fected nearly 100 million people, and caused damage of morethan 300 billion US dollars (Salichon et al., 2007). Increas-ingly, megacities are developing in areas prone to experiencemajor earthquakes, so making disasters more likely. As inthe case of volcano monitoring, localin situ observation sys-tems are increasingly supplemented by continuous and broadscale networks such as thePlate Boundary Observatory(PBO)in the U.S. The GNSS networks provide fundamental obser-vations of the deformation process during the complete earth-quake cycle from preseismic to co- and postseismic deforma-tions. Hence, strain rates determined from geodetic observa-tions are increasingly used in hazard assessments. Moreover,image techniques such as InSAR are increasingly supplement-ing the ground-based techniques.
Much of the geodetic infrastructure is currently focusedon research related to the processes causing earthquakes. In-creasingly, the geodetic networks also support the rapid detec-tion of earthquakes for early warning and damage reduction(e.g., by rapid shutdown of gas pipelines, stalling of traffic onroads and railroads, shutting down of nuclear power plants,etc.This application requires real-time detection of ground motionwith reaction times in the range of a few seconds), as well asrapid damage assessment in support of rescue.
Seismic hazards can also result from mining, filling ofreservoirs, and extraction of oil and gas. In order to detectseis-mic hazards induced by mining, monitoring of the strain ratesin the mining area is the appropriate tool. The seismic haz-ard associated with the filling of large reservoirs is thought to
be caused by changes in the subsurface pore pressure and notthe loading-induced stress (Roeloffs, 1988; Talwani & Acree,1985).
5.2.4 Tsunamis
Tsunamis are generated by submarine earthquakes, landslidesand volcanic eruptions. Although tsunamis are frequent, mosthave small amplitudes (a few centimeters) and do not pose anydanger for coastal areas. Only large earthquakes (moment mag-nitude greater than 7.5) with an epicenter at shallow depth canexcite tsunamis which can result in dangerous coastal waveheights larger than a few meters. Generation of tsunamis byearthquakes is therefore restricted to submarine seismogenicregions with shallow and potentially large earthquakes. How-ever, knowledge of the location of these faults is not sufficientto identify all potentially hazardous areas. Therefore, anim-portant task is the detection of potentially hazardous regions inthe ocean.
Over the last hundred years, most of the large earthquakeswith magnitudes of 8.5 and larger, which are potentially respon-sible for devastating ocean-wide tsunamis, were located aroundthe Pacific Ocean (Figure 60). However, large tsunamis canalso originate in other regions. Smaller tsunamigenic earth-quakes occur in many other regions (e.g., the Mediterraneanand the Caribbean), and pose a danger for nearby coastal areas.
Submarine landslides can happen in large areas of thecontinental shelves, where sufficient sediments have accumu-lated to allow turbidity currents to form. Moreover, in somear-eas of steep topographyand appropriate geology, rockslides canoccur, as in the Mona Rift area north of Puerto Rico (Grindlay& Hearne, 2005). Coastal landslides can result in large waves ifsufficient material is involved. Examples are the landslides onStromboli on 30 December 2003, where the ash deposits slidand created a tsunami traveling around the coast of the islandand causing considerable damage, with waves reaching max-imum heights of 5 to 10 m (Bonaccorso et al., 2003). Muchlarger slides have happened at this island over the last 13,000years, which are likely to have caused large tsunamis affectingthe Aeolian Islands and the coasts of South Italy (see La Roccaet al., 2004, and the references therein).
The major difference between tsunami generation by alandslide and an earthquake is in the movement of the sourceregion. For an earthquake, a tsunami is generated mainly byvertical movement in the source region (usually 100 kilome-ters or more wide), causing a sea surface anomaly. However,in a landslide, a much smaller source region moves mainly hor-izontally. As a consequence, the long-wave approximation isvalid for tsunamis generated by earthquakes, but not for land-slides. Moreover, directivity of the tsunami is generally moreexpressed for those created by landslides.
Submarine volcanic eruptions are mainly associated withmid-ocean ridges, hotspots, and back-arc basins. However,inmost cases, the mid-ocean ridge and hotspot volcanoes are notlikely to be explosive, and these eruptions are not likely tocre-

The Global Geodetic Observing System GGOS 2020 100
Figure 60. Location of the largest earth-quakes since 1900. Indicated are the lo-cations of earthquakes with Mw > 8.5.
ate tsunamis. Similarly, earthquakes at mid-ocean ridges arenormally not large enough to trigger significant tsunamis.
Knowledge of the tsunamigenic source locations is onlya first step in establishing the tsunami hazards for a givencoast. Most tsunamigenic sources have strong anisotrophy inthe propagation of tsunami energy away from the source (e.g.Titov et al., 2005b). Consequently, the tsunami hazard at anypoint on a coast depends not only on the distance to potentialsources, but also the direction with respect to the propagationpattern for a particular source. Moreover, the shape of the coast,its topography and the bathymetry of the ocean basin betweenthe coast and the source are important factors determining thetsunami hazard.
Tsunami hazard maps, and more generally, sea level haz-ards maps, are necessary for planning of a reliable and econom-ically feasible sea level hazard observing system. This hasalsobeen acknowledged in the definition of a task for the GEO WorkPlan focusing on aGlobal Tsunami Hazard Map(GTHM). Themethodology will have to take into account problems that theincomplete record of events causes for the direct applicationof a probabilistic analysis, comparable to probabilistic seismichazard analysis (see e.g. Wang & Ormsbee, 2005). The expe-rience gained in establishing theGlobal Seismic Hazard Map(Shedlock et al., 2000), theGlobal Stress Map(Heidbach et al.,2004) and the Global Strain Map (Kreemer et al., 2003) canhelp in developing the methodology for the GTHM, and the in-formation contained in these maps is of direct relevance. Thus,geodetic observations of the kinematics of the Earth’s surfacethat allow the determination of the strain field near subductionzones, are an important input to this hazard assessment.
Geodesy also comes in with respect to the monitoring re-quired for any early warning system. A rapid and precise quan-tification of earthquake sources is central to tsunami warningsystems, because tsunami models are initialized by assuminga displacement field of the ocean floor. The early predictionof tsunamis on the basis of detected earthquakes is currentlylimited due to two shortcomings:
• First estimates of the magnitude of large earthquakes often
prove to be too low (Kerr, 2005; Menke & Levin, 2005)due to saturation of the near-real time methods, leading toan underestimation of the tsunamigenic potential.
• Tsunami propagation models are sensitive to the initialconditions (i.e., the model of the seismic rupture pro-cess, Titov et al., 2005a). However, establishing the rup-ture processes of particularly large earthquakes for a spe-cific earthquake in near-real time is difficult. Currently, ittakes considerable studies before the relevant details areinvestigated (as well illustrated by the sequence of pa-pers addressing the magnitude and rupture process of the2004 Sumatra-Andaman earthquake, see, e.g., Plag et al.,2006b, for references).
After the 2004 Sumatra tsunami, at least seven largeundersea earthquakes occurred. Large-scale tsunami warn-ings were issued for five of them (Nias, March 2005, M 8.7;West California, June 2005, M 7.1; Tonga, May 2006, M 7.8;Kuril Islands, November 2006, M 8.3; and Kuril Islands, Jan-uary 2007, M 8.1). Although these warnings caused panic insurrounding countries, the events did not generate significanttsunamis in the areas for which warnings were issued. How-ever, the July 2006 West Java event with a magnitude of 7.7and the April 2007 Solomon earthquake with magnitude 8.0each generated unexpectedly large local tsunamis that killedmore than 600 and 30 people, respectively. These incidents il-lustrate that the currently used method for early warnings basedon earthquake-magnitudes from seismometers alone is not reli-able to accurately predict the size and impact area of tsunamis.In the case of an earthquake, there are two steps in the predic-tion of tsunami impact in a specific region: (1) determination ofthe tsunami potential of the event based on the magnitude andrupture process, (2) prediction and/or detection of the tsunamipropagation towards the specific region.
Static co-seismic displacements determined from GPSstations in the near-field of earthquakes agree well with thedisplacements determined through integration of strong motionrecords (Larson et al., 2003; Miyazaki et al., 2004). Blewitt

The Global Geodetic Observing System GGOS 2020 101
Figure 61. Seismic moment deter-mination based on GNSS. Time series(blue lines) of east component of grounddisplacements after the great December2004 Sumatra earthquake, recorded bycontinuous GPS sites in Southeast Asia.The earthquake produced changes insite positions that are large enough toallow the magnitude of the earthquaketo be assessed within 15 minutes, fasterthan was possible with seismic dataalone. This time interval is shorter thanthe time required by the tsunami to crossthe Indian Ocean, illustrating that GNSSdata can contribute to tsunami warningby assessing whether an earthquake islarge enough to generate an oceanwidetsunami. The tsunami arrival times (colorcontours on map) are made available byNOAA Center for Tsunami Research (di-rector: Dr. Frank Gonzalez). From Ble-witt et al. (2006b)
et al. (2006b) demonstrated that a relatively sparse GPS stationnetwork with a radius of about 2000 km around the epicenterof the 2004 Sumatra earthquake was sufficient to determine themagnitude of this event accurately using the GPS data up to15 minutes after the earthquake origin time (Figure 61). Theirresults indicate that if GNSS data from a sufficiently dense net-work around the source of a large earthquake were availablein real time, GNSS ground-based stations could yield realisticlow-latency (order 15 minutes) estimates of the seismic mo-ment and displacement field of the event. This informationwould be a valuable addition to tsunami warning systems fordevastating oceanwide tsunamis. However, even with such net-works in place and an operational processing set up, it wouldstill take about 30 minutes for reliable tsunami predictions. Al-though such predictions would be of very high value for ocean-wide tsunamis, this time lag is unacceptable for coastal areasclose to the epicenter.
In summary, the current state-of-the-art in the low-latencydetection of tsunamigenic sources and the subsequent low-latency prediction of the tsunami propagation and impact donotwarrant a tsunami monitoring system based solely on sourcedetection and numerical propagation predictions (Defra, 2005).Moreover, some tsunamigenic events are not associated withstrong or clear seismic signals (e.g. landslides, impacts)and
cannot be detected easily. Therefore, a key element in a mon-itoring system for early warning purposes will directly focuson the propagation phase of the tsunami and aim to detect atsunami at an early stage of this propagation phase.
In most cases, sea level information gathered by a suit-able monitoring network will help to reduce the uncertaintiesin the source detection and classification, and thus provideasound basis for the decision to issue timely warnings. In manycases, only an observing system aiming at the tsunami itselfwill provide the necessary observations to identify a tsunami.This monitoring system in principle will also be applicabletoother sea level hazards, in particular large storm surges. How-ever, sea level observations alone may not be sufficient sincemost existing sea level sensors currently are located at coastallocations, while the sea level events need to be detected beforethey reach the coastal parts under risk. Tsunami monitoringsystems in the Pacific therefore apply a number of ocean bot-tom sensors both for the detection of tsunamigenic events andthe monitoring of the tsunami itself (see Section 2.9.3). Butthese systems are expensive and demanding in maintenance,and it is unrealistic to assume a dense-enough network in manyparts of the global oceans.
In the aftermath of the Sumatra-Andaman earthquake, anumber of studies have suggested other approaches that may

The Global Geodetic Observing System GGOS 2020 102
help in tsunami warning. For example, Garces et al. (2005)indicated the detection potential of deep infrasound associatedwith tsunamis. Plag et al. (2006b) pointed out that GPS net-works and gravimeters, in principle, could sense the loadingdeformations induced by the tsunami and the associated grav-ity perturbations, respectively. Tilt meters and horizontal seis-mometers can observe loading induced tilt. GNSS buoys canmeasure the sea level variations caused by a passing wave, andin some cases, i.e. in shallower areas, also currents associatedwith the orbital motion of the particles in these waves. Baoet al. (2005) showed that the Sumatra tsunami affected GRACEobservations. Gower (2005) studied the signal of the 2004Sumatra tsunami in satellite altimetry and found these obser-vations valuable for the post-event validation of model predic-tions, although real-time applications are currently technicallynot feasible due to the need for a satellite in the appropriatelocation. Coupled ocean-ionospheric signals have also beenstudied with respect to their early warning potential (Occhip-inti et al., 2006).
Storm surges and tsunamis are barotropic waves associ-ated with transport of large masses that load and deform thesolid Earth’s surface, similar to ocean tides, and thus producesurface displacements, tilts, and gravity signals. For example,large storm surges in the German Bight induce surface displace-ments of up to 50 mm. The tsunami excited by the 2004 Suma-tra earthquake resulted in maximum vertical displacementsofthe Earth’s surface of the order of 20 mm (Plag et al., 2006b)with a deformational signal of the order of 10 mm arriving inCeylon and India about 20 minutes before the tsunami. Thesegeodetic signals in principle can be measured with GNSS, sen-sitive gravimeters, and tiltmeters, respectively. While the directmeasurement of the vertical displacement at single GNSS sitesmay be difficult to achieve against the typical noise level ofhigh-resolution GNSS time series, it is likely that GNSS net-works can sense the deformational signal, particularly if thesenetworks extend sufficiently far in-land. Free oscillations ofthe Earth, which have periods in the same range as the tsunamiwaves, are not expected to create significant problems for theGNSS detection of the loading signals, as the geometric ampli-tudes of the free oscillations are extremely small and expectedto be at the maximum at the 1 mm level. Single gravimeter sta-tions equipped with superconducting gravimeters in principleare able to measure the gravity signal resulting from the sumofthe mass relocation and the induced deformation. This applica-tion requires procedures which allow the separation of the non-tidal part of the signal in near-real time. For large earthquakes,which generate free oscillations of the solid Earth, the separa-tion of these free oscillations from the loading induced signalin gravity constitutes a particular challenge. The advantage ofall signals induced by the loading is that they propagate wellin advance of the load. However, most of the available sensorshave a relatively high noise level at the time scale important forthe detection of an event from minutes to several hours. It isexpected that the noise level in displacements determined fromGNSS data with high sampling rates (1 to 30 s) can be reduced
considerably in the near future through improved processing al-gorithms. Nevertheless, all these techniques are currently in aresearch state.
Most of the quantities mentioned above require feasibil-ity studies quantifying the tsunami and storm surge signalsaswell as the ambient noise levels in the quantities. Moreover,development of observational techniques capable of detectingthe signals in those quantities that turn out to be promisingisrequired.
The occurrence of devastating tsunamis and extremestorm surges is relative rare. As pointed out in a recent U.K.re-port (Defra, 2005), only a system used more or less continu-ously can be expected to be operational in the case of a rareevent. Thus, a dedicated tsunami detection system is likelynotto be operational in the case of a rare but devastating tsunami,while a multi-hazard and multi-application system is far morelikely to ensure continuous operation. GNSS networks withtheir many applications are therefore well suited for integrationin early warning systems for rare events, and their potential forlow-latency detection of displacement fields, loading signals,and ionospheric signals should be exploited.
5.2.5 Storm surges
Many of the World’s coasts have a long history of disasterscaused by storm surges, with large loss of lives and property.Though many of these areas are today protected by advancedsystems of dikes, barriers and levies, these protective devicescan fail under extreme storm surges. Preparedness for extremeevents is low and the resulting disaster can be expected to beofregional scale, affecting the economic development of wholecountries or regions. The potential and long-lasting effect ofevents leading to failure of coastal protections has been sadlydemonstrated by the 2005 New Orleans disaster.
There is considerable knowledge and understanding ofstorm surge hazards for many coastal areas based on those ex-perienced over the last few hundred years. However, recentfindings indicate that storm surge statistics based on the obser-vational records might severely underestimate the risk of ex-treme storm surges exceeding those observed in the last fewhundred years. For some coastal areas combined meteorologi-cal and hydrodynamicmodels predict storm surges with consid-erable accuracy. However, because extreme storm are likelytobe underestimated by the current models, it appears reasonableto include detection of extreme storm surges into a monitoringsystem for tsunami detection.
In coastal regions, there is growing concern about the im-pacts of hurricanes and other major storms. Although theseevents are frequent, their courses and landfall positions arechallenging to predict before the storm developes, at whichpoint present system do increasingly well. unpredictable in ad-vance. However, precise gravimetric measurements of oceanthermal structure both horizontally and vertically, make it pos-sible to forecast the development and intensity of major stormsalong various path scenarios dependent on synoptic atmo-

The Global Geodetic Observing System GGOS 2020 103
spheric circulation systems and location of air masses in thevicinity of the storm. More precise elevation mapping can bet-ter characterize coastal vulnerability to such events. Similar tothe case of tsunamis (see Section 5.2.4 above), geodetic obser-vations can also play a role in detecting a moving surge as partof a warning system.
5.2.6 Flooding
River floods in continental interiors lead to devastation ofin-frastructure, loss of crops, and often loss of life. While itis rel-atively straightforward to predict the frequency of floods on astatistical basis (100-yr floods, etc.), typical land uses in flood-plains (urban, agricultural, etc.) are too valuable for completeand permanent abandonment in anticipation of rare events.Consequently, there is great value in the ability to predictfloodsusing runoff and soil moisture observations upstream of a lo-cality of interest. For major drainage basins, gravimetrictech-niques (e.g., GRACE, see Chapter 2) can be applied to the mon-itoring of available and mobile surface and near-surface watermasses and their variability in time and space, so that drainagenetwork models can be reliably applied to prediction of flood-ing in key locations, such as St. Louis (1993) or New Orleans(2005). In the interest of preparing for the impacts of flooding,more precise elevation maps of the soil surface (cm resolution),and ultimately of the water table (m resolution) would be ben-eficial to disaster preparation and identification of vulnerableareas.
Floods due to failure of natural or anthropogenic reser-voir dams can be disastrous. Therefore, geodetic monitoring ofmajor reservoir dams should be considered in order to detectany instabilities at an early stage.
5.2.7 The slowly developing disasters: sea level rise
A slowly changingLocal Sea Level(LSL) by itself need notconstitute a severe sea level hazard. Many coastal areas copewith secular LSL changes of up to±10 mm/yr, and some lo-cations with large extraction of ground water, oil or gas, withconsiderably larger rates. In many cases, LSL changes of theorder of a few mm/yr are easily accommodated by slow adapta-tions through coastal engineering. However, slow LSL changesaffect the statistics of extreme sea levels and can lead to signif-icant changes in hazards and risks. A recent example is NewOrleans, where rapid subsidence combined with a LSL rise in-creased the vulnerability of the area and contributed to thedis-aster caused by Hurricane Katrina (Dixon et al., 2006).
Moreover, changes in atmospheric conditions also affectthe statistics of the extremes and in particular the maximumsealevels that can be expected in a specific location. Consequently,in assessing the sea level hazards at a given location, scenar-ios of future LSL on all relevant time scales (for storm surges,tsunamis, and slow LSL changes) will have to be considered.
In the recent past, LSL changes caused by increased icesheet melting has gained considerable public attention. A rapidmelting of the Greenland ice sheet, as considered by Zwally
24
26
28
30
32
24
26
28
30
32
276 278 280
276 278 280
24
26
28
30
32
24
26
28
30
32
276 278 280
276 278 280
24
26
28
30
32
24
26
28
30
32
276 278 280
276 278 280
24
26
28
30
32
24
26
28
30
32
276 278 280
276 278 280
Figure 62. Effect of a regional LSL rise of 4 m on the coastline in Florida. Although a regional rise in LSL of 4 m isnot predicted by any of the IPCC scenarios (Bindoff et al.,2007), a catastrophic disintegration of parts of the Greenlandor Antarctic ice sheet, as discussed for example by Zwallyet al. (2002) for Greenland, could lead to changes of this or-der of magnitude. Left: present day coast line. Right: Coastline after a regional sea level rise of 4 m.
et al. (2002), would have severe global consequence includingwide-spread societal impacts due to migration of coastal pop-ulation. GEO considers secular LSL changes as a potential,slowly developing disaster. The film ’An inconvenient Truth’also focuses on the implications of future sea level rise. Thesevere consequence of a significant rise in sea level for coastalzones in the world were illustrated by Rowley et al. (2007). Asan example, the effect of a regional sea level rise of four me-ters around Florida is illustrated in Figure 62. Day et al. (2007)discuss the potential contribution of a stabilitized sea level af-ter the last deglaciation for the emergence of complex societies.The changes in coastline expected as a consequence of a rapidsea level rise could have the reverse effect and significantly im-pact the stability of the global society.
At any location, the position of the sea surface is deter-mined by a number of processes in the atmosphere, ocean, andsolid Earth. Its position with respect to the underlying landsurface, i.e., LSL, is the output of numerous Earth system pro-cesses acting on a wide range of spatial and temporal scales.For low frequencies, this leads to a complex equation of LSLas a function of the heat and salinity distribution in the ocean,ocean currents and atmospheric circulation, mass changes inthe ocean, large ice sheets, continental glaciers, and the ter-restrial hydrosphere, postglacial rebound, endogenic andan-thropogenic vertical land motion and geoid changes, as wellaschanges in shape and extent of the ocean basins (Plag, 2006a,, and Figure 63). As a consequence, local and regional LSLchanges show large deviations from a global average. Over thelast century, a global average rise in sea level of 1 to 2 mm/yrhas been determined (see Section 5.6.4). However, in manyregions and locations, secular trends in LSL of the order±10mm/y and more are seen.
Understanding sea level variations requires observationsfrom a very carefully designed observing system providing allquantities in a long-term stable reference frame well tied to thegravity field (i.e., the CM). In fact, understanding and predict-ing LSL changes may be one of the most demanding applica-tions for geodetic observations. Because the sea surface adjusts
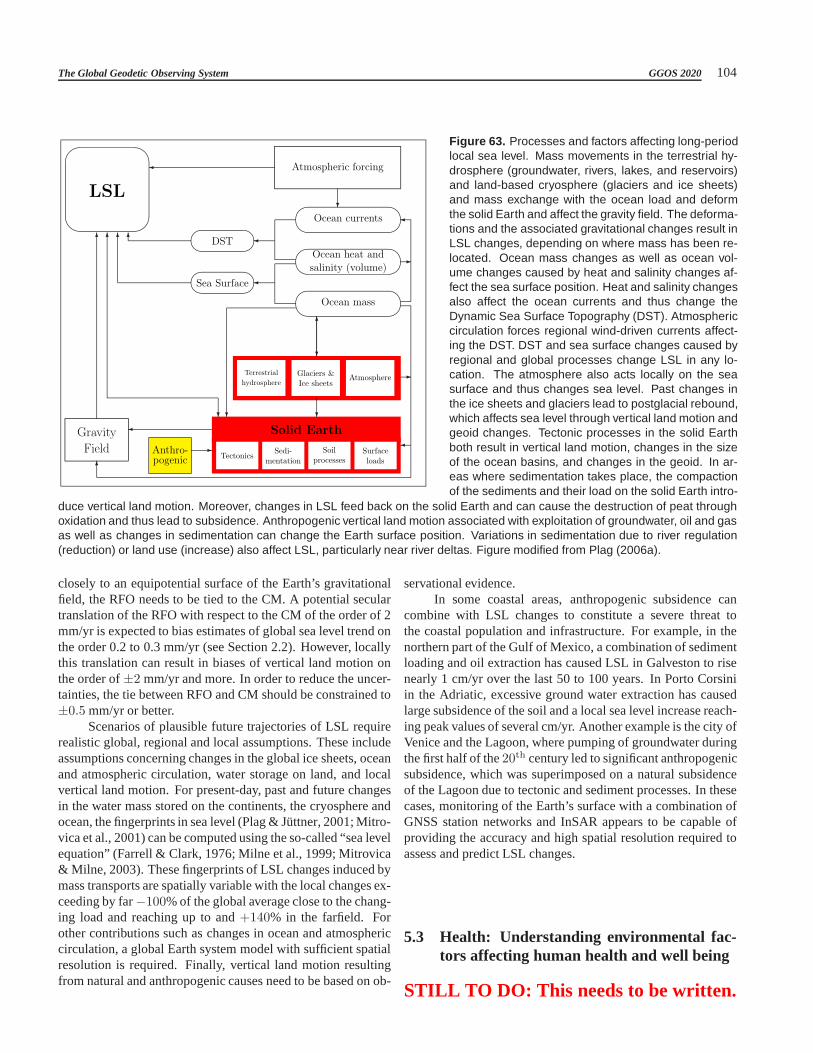
The Global Geodetic Observing System GGOS 2020 104
Gravity
Field
Solid Earth
TectonicsSedi-
mentation
Soil
processes
Surface
loads
Terrestrial
hydrosphere
Glaciers &
Ice sheetsAtmosphere
Ocean mass
Ocean heat and
salinity (volume)
Ocean currents
Atmospheric forcing
LSL
'
&
$
%DST
Sea Surface
Anthro-pogenic
-
-
6
-
?
6
?
6
?
6 6
??
6
Figure 63. Processes and factors affecting long-periodlocal sea level. Mass movements in the terrestrial hy-drosphere (groundwater, rivers, lakes, and reservoirs)and land-based cryosphere (glaciers and ice sheets)and mass exchange with the ocean load and deformthe solid Earth and affect the gravity field. The deforma-tions and the associated gravitational changes result inLSL changes, depending on where mass has been re-located. Ocean mass changes as well as ocean vol-ume changes caused by heat and salinity changes af-fect the sea surface position. Heat and salinity changesalso affect the ocean currents and thus change theDynamic Sea Surface Topography (DST). Atmosphericcirculation forces regional wind-driven currents affect-ing the DST. DST and sea surface changes caused byregional and global processes change LSL in any lo-cation. The atmosphere also acts locally on the seasurface and thus changes sea level. Past changes inthe ice sheets and glaciers lead to postglacial rebound,which affects sea level through vertical land motion andgeoid changes. Tectonic processes in the solid Earthboth result in vertical land motion, changes in the sizeof the ocean basins, and changes in the geoid. In ar-eas where sedimentation takes place, the compactionof the sediments and their load on the solid Earth intro-
duce vertical land motion. Moreover, changes in LSL feed back on the solid Earth and can cause the destruction of peat throughoxidation and thus lead to subsidence. Anthropogenic vertical land motion associated with exploitation of groundwater, oil and gasas well as changes in sedimentation can change the Earth surface position. Variations in sedimentation due to river regulation(reduction) or land use (increase) also affect LSL, particularly near river deltas. Figure modified from Plag (2006a).
closely to an equipotential surface of the Earth’s gravitationalfield, the RFO needs to be tied to the CM. A potential seculartranslation of the RFO with respect to the CM of the order of 2mm/yr is expected to bias estimates of global sea level trendonthe order 0.2 to 0.3 mm/yr (see Section 2.2). However, locallythis translation can result in biases of vertical land motion onthe order of±2 mm/yr and more. In order to reduce the uncer-tainties, the tie between RFO and CM should be constrained to±0.5 mm/yr or better.
Scenarios of plausible future trajectories of LSL requirerealistic global, regional and local assumptions. These includeassumptions concerning changes in the global ice sheets, oceanand atmospheric circulation, water storage on land, and localvertical land motion. For present-day, past and future changesin the water mass stored on the continents, the cryosphere andocean, the fingerprints in sea level (Plag & Juttner, 2001; Mitro-vica et al., 2001) can be computed using the so-called “sea levelequation” (Farrell & Clark, 1976; Milne et al., 1999; Mitrovica& Milne, 2003). These fingerprints of LSL changes induced bymass transports are spatially variable with the local changes ex-ceeding by far−100% of the global average close to the chang-ing load and reaching up to and+140% in the farfield. Forother contributions such as changes in ocean and atmosphericcirculation, a global Earth system model with sufficient spatialresolution is required. Finally, vertical land motion resultingfrom natural and anthropogenic causes need to be based on ob-
servational evidence.In some coastal areas, anthropogenic subsidence can
combine with LSL changes to constitute a severe threat tothe coastal population and infrastructure. For example, inthenorthern part of the Gulf of Mexico, a combination of sedimentloading and oil extraction has caused LSL in Galveston to risenearly 1 cm/yr over the last 50 to 100 years. In Porto Corsiniin the Adriatic, excessive ground water extraction has causedlarge subsidence of the soil and a local sea level increase reach-ing peak values of several cm/yr. Another example is the cityofVenice and the Lagoon, where pumping of groundwater duringthe first half of the20th century led to significant anthropogenicsubsidence, which was superimposed on a natural subsidenceof the Lagoon due to tectonic and sediment processes. In thesecases, monitoring of the Earth’s surface with a combinationofGNSS station networks and InSAR appears to be capable ofproviding the accuracy and high spatial resolution required toassess and predict LSL changes.
5.3 Health: Understanding environmental fac-tors affecting human health and well being
STILL TO DO: This needs to be written.
The Global Geodetic Observing System GGOS 2020 105
5.4 Energy Resources: Improving managementof energy resources
Traditionally, geodesy has contributed to the explorationof en-ergy sources such as oil and gas resources in particular bymeasuring gravity anomalies (see Section 4.7.2). Airbornegravimetry (see Section 2.6.4) has contributed substantiallyto our knowledge of the geographic location of potential re-sources.
Exploitation of energy resources such as oil, gas and coalis inevitably associated with impacts on the Earth surface andthe infrastructure implemented for the exploitation. Space-geodetic techniques allow the monitoring of surface displace-ments in the vicinity of mines or in areas of oil and gas ex-traction. These displacements are indicative of the reservoirdynamics and the observations help to enable a controlled ex-ploitation.
Stability of infrastructure such as offshore oil and gasplatforms is intimately related to the exploitation of the under-lying resources. GNSS measurements on platforms allow thedetermination of instantaneous subsidence rates, which can beused to regulate the extraction rates. However,the currentsta-bility of the global geodetic reference frame is not sufficientto provide reliable velocities on monthly to yearly time scales,particularly for sites far off-shore, where no nearby stable refer-ence sites can be found (Plag, 2005). In cases, where platformsettlement is observed, the subsidence of the platform measuredby GNSS provides information on the vertical displacement ofthe ocean floor, which in turn is directly related to reservoirproperties (Plag, 2005).
In open-pit mining, the steering of heavy equipment in-creasingly depends on geodetic techniques (see Section 4.3).Currently, the steering is mainly based on local augmentationsystems, requiring a high level of local technical skills. It canbe expected that improved access to a global reference framewould reduce the level of local skills required.
The use of renewable energy sources also benefits fromgeodetic techniques, observations and tools. Efficient manage-ment of forests is greatly eased by having precise positioningavailable, for example, to registered infested trees and tomon-itor spreading of tree disease. Wind fields are increasinglyde-rived from SAR observations. Mapping tidal and wave energyalso benefits from satellite altimetry and SAR, respectively.
The improved capability to measure surface displacementwith GNSS and from these observations to deduce strain fieldshas led to new applications of geodetic techniques related toenergy resources. One example is in the area of geothermalenergy. Geothermal activity in places such as Iceland andNew Zealand is generally associated with magmatic processesand has an evident impact on the surrounding landscape. Non-magmatic geothermal activity, on the other hand, is often muchless evident at the Earth’s surface, yet its potential as an energysource can be significant. For example, most of the geothermalresources in the Great Basin in the western United States arenon-magmatic. Of particular interest is northwestern Nevada,
which finds itself tectonically between crustal extension in theEast and shear deformation in the West. Deformation that re-sults from tectonic activity can generally be expressed in termsof a strain rate tensor field and can be quantified through theuse of geodetic velocities.
A GPS network has been installed in northwesternNevada to make semi-continuous measurements in order to ob-tain a station velocity solution that is then used to map the 2Dstrain-rate tensor field. Crustal strain is correlated withthe lo-cations of current geothermal systems and details of the ten-sor style, and its spatial variation are explored (Blewitt et al.,2003, 2005; Kreemer et al., 2006a). Current findings suggesta strong correlation between locations of existing systemsandthe level of transtensional strain. Transtensional strainis a com-bination of shear and dilatation and can be accommodatedthrough strike-slip and normal faulting, respectively. Concep-tually, shear strain would continuously fracture fault planesthrough the entire crust, whereas dilatation tends to pull faultplanes apart, allowing pathways for the movement of fluids.The combination of shear and dilatation can thus create fluidconduits to great depths, and sustain them through continuedstress.
If geothermal output is controlled at a crustal scale, thegeodetic stations need to be separated no further than the thick-ness of the seismogenic crust (∼15 to 20 km in Nevada) to bestmap crustal strain. Smaller spatial scaling adds redundancy, be-cause the measured strain distribution is the result of slipatdepth on a fault that is locked at the surface, and hence is spa-tially smoothed by an amount related to the seismogenic thick-ness. Thus geodetic networks can be used to characterize re-gional strain partitioning, but cannot determine whether parti-tioning occurs along a single fault.
The network deployed in Nevada consists of stainlesssteel pins as markers, which allows for the antenna to be re-mounted with sub-millimeter precision at each measurementcampaign. Sites are occupied about 30 to 50% of the time. Thecombination of monument set-up and site occupation historyhas provided velocities that after 2.5 years of data collectionoverlap within 95% confidence with those determined at avail-able co-located deep-braced continuous monuments over morethan 6 years. The average strain rate in northwest Nevada isabout 20 nanostrain/yr. Thus for a network of about 20 kmspacing, the differential station velocity is∼0.4 mm/yr. For-mal uncertainties in velocity after 2.5 year data collection arean order of magnitude smaller than this suggesting that we canadequately resolve velocity variations on the scale of individualcrustal blocks.
Because the aim is to relate geothermal resources to the(often slow) interseismic strain accumulation, InSAR tech-niques may not be useful as a direct application tool. However,the exploration of geothermal resources often requires substan-tial water pumping which can affect the local deformation fieldnear existing facilities. InSAR is a very effective tool forquan-tifying the extent and depth of such deformation. As such itcan benefit the interpretation of potential local strain anomalies
The Global Geodetic Observing System GGOS 2020 106
derived from the GPS measurements.
5.5 Climate change: Understanding, assessing,predicting, mitigating, and adopting to cli-mate variability and change
One of the major consequences of climate change is the propen-sity of all systems to generate feedback which may operate inconcert or in opposition. A clear example of a positive feed-back mechanism arose from the anthropogenically-induced de-pletion of the ozone layer. A reduction in ozone led to weakerabsorption of ultraviolet radiation in the middle stratosphere,which in turn led to stratospheric cooling which helped tosustain the heterogeneous processes responsible for destroyingozone, thereby cooling the stratosphere still further.
The ozone loss problem has been largely resolved by ban-ning (or at least reducing) the emissions of chlorofluorocarbons(CFCs), substituting species which tend to break down in thetroposphere (hydrochlorofluorocarbons, or HCFCs) which are,themselves, in the process of being phased out. In mitigatingthe stratospheric ozone loss problem, we have managed to con-tribute to tropospheric warming by replacing ozone destroyingcatalysts with strong greenhouse gasses.
The long-term effects of altering atmospheric composi-tion, such as elevating the concentrations of greenhouse gases,are only partially understood. Viewed against the backdropofthe large natural variability in the Earth system, it may seemto some as if the relatively small anthropogenic alterations inplanetary radiative balance are insignificant and do not warrantmitigation. However, the impacts of sea level rise, meltingper-mafrost, and an increase in extreme atmospheric events suchas Hurricanes Katrina and Rita offer sobering reminders of thedevastating influence of extreme atmospheric events, and thatit would be wise to tread with caution.
Recent research (e.g., Emanuel, 2003; Pielke Jr. & Land-sea, 1998) suggests there is some causality between hurricaneintensity and rising ocean temperatures, this sensitive, theyclaim, to global warming. Whether warming is due to naturalor to anthropogenic forcing is immaterial, but it does empha-size the need for a better understanding of the complexitiesofthe Earth system before further modifying the composition ofthe atmosphere.
Evidence for climate change has been gathered by scien-tists in several areas, such as ice caps melting, sea level rise,modification of migrating species habitats, and others. Thesechanges have a strong impact on some particularly exposedcommunities (e.g. low-level islands). The global society needsto prepare for these proven effects which will eventually con-cern all of us either via the food chain or via population mi-gration. Identification of future risks is required for properpreparation. Such identification requires that climate changebe partly understood and quantified, and then to a certain ex-tent forecast. Forecast in that field cannot be dissociated fromthe ability to first observe the phenomena associated with cli-mate change.
The attribution of climate trends in the current atmo-spheric observations is complicated by natural atmosphericvariability and large-scale oscillations such as theEl NinoSouthern Oscillation(ENSO) or the eleven-year solar cycle.However, reanalyses enable us to infer climate signals fromacombination of model and ensemble of measurement systems.It has been suggested that reanalyses would be more robustand reliable than single instrument records. This superiorityhas emerged only recently as new methods such as variationalbias correction are being used to detect and correct instrumentaldrifts as well as instrument problems, provided some referenceobservations are available. These climate reanalysis models canbe used to simulate the past and can also be used to project fu-ture climate to help us prepare for changes.
Critical to that process is the availability of long-termrecords from single instruments, free of breaks and instrumen-tal biases, and to which the entire data assimilation systemrunscan be anchored. The instruments that are part of GGOS canprovide such observations of atmospheric-induced delays in re-gions away from the lower boundary (ground) where other ef-fects (urban heat islands, land use changes, etc.) may inter-fere with the atmospheric trends observed. Measurements ofdelays in GNSS propagation signals between transmitters andreceivers placed in low-Earth orbit can provide such so-calledradio occultation measurements (see Section 2.9.1) and thus of-fer a way to monitor the stratospheric mass field in climate re-analyses.
Geodetic observations are also valuable for the validationof reanalyses. Atmospheric and oceanic mass transport inducesignals in the geodetic observations. Mass transport changesthe gravity field and, through interaction with the solid Earthimpacts Earth rotation. The surface loading associated with themass transport in atmosphere and ocean loads and deforms thesolid Earth. The improvement in models to predict these sig-nals will allow validation of climate models based on geodeticobservations.
The metric of choice most often used for assessing cli-mate change is the rate of change of atmospheric temperaturenear the surface, because it is easily measurable and because itcontrols other environmental parameters. In order to monitorthat temperature, particular emphasis has been given to design-ing instruments and methods to collect measurements with pre-cision within the suggested climate trends of 0.1 K per decade.While it is important to plan and obtain such measurementswith the necessary precision, it is equally important to measurethe consequence of such trends on the static and the dynamicstructures of the atmosphere. As such, magnified effects of cli-mate change are also to be considered.
For a static illustration, referring to the hydrostatic equi-librium of the atmosphere, there is a magnifying effect oftemperature change on air density and hence atmosphericlayer thicknesses. Assuming for example a 0.1 K homoge-neous warming throughout any given atmospheric layer whoseboundaries are defined by fixed pressure levels, that atmo-spheric slab would expand by about 0.04% of its original thick-

The Global Geodetic Observing System GGOS 2020 107
ness. In real terms and with a tropospheric average temperatureof 250 K, this would amount to raising the mid-latitude near-tropopause level of 200 hPa by 5 m, all other parameters heldconstant. With GGOS ensuring a reference frame with centime-ter accuracy over a decade, positioning upper-air atmosphericpressurein situ sensors, accounting also for possible changesin height at the Earth surface in the same timeframe, this trendcould be identified with high reliability.
The dynamic impact of climate change is reflected in al-terations in the patterns of atmospheric circulation. As hor-izontal temperature gradients change, the cells that make upthe general circulation system are affected in their strength andshape (including extent and position). Vecchi et al. (2006)havefound evidence of a weakening in the tropical Pacific Walkercirculation over 130 years (between 1861 and 1992) based onsea level pressure observations in that region. Using climatemodels to elaborate on the origin of that decline, they foundthat anthropogenic changes in the atmoshere could explain theobserved decrease in sea level pressure gradient. Similarly, onthe basis of IPCC simulations made at Meteo France, a weak-ening of the Hadley cell circulation system is also predictedunder IPCC climate scenarios. The total mass of air flowingthrough the upper branch of that cell at latitude 15N and be-tween 200–100 hPa pressure levels is currently about 50 Mega-tons per second in January. A shift in the location of that upperbranch of the Hadley cell in the climate runs mentioned herewould mean that by January 2030 this atmospheric flow woulddecrease by up to 5 Megatons per second. With an ability tomeasure mass displacements, GGOS could help in monitoringsuch changes. This would complement the atmospheric effortsto measure detailed structural changes such as air density andwind measurements.
Moreover, changes in ocean and atmospheric circulationwill affect the angular momentum transfer between ocean andatmosphere on the one hand and the solid Earth on the other.This will affect Earth rotation. Therefore, observations of Earthrotation variations are a data set providing constraints for gen-eral circulation models.
Geodesy thus has the potential to bring to climatologistsdata sets that will help anchor and validate climate models fromwhich forecasts of atmospheric trends can be made for the pur-pose of preparing for the impact of climate change on the globalsociety.
In terms of monitoring climate change, geodetic obser-vations are pivotal in several aspects. Changes in the dynamicsea surface topography are derived from satellite altimetry ob-servations and can be compared to those changes derived fromtemperature and salinity data.
Because of the sensitivity of the ice sheets and glaciersto global warming, monitoring of the mass and volume of theEarth’s ice bodies are a key activity, also fundamentally relyingon the geodetic reference frame and being facilitated by newmeasurement techniques. Satellite and airborne measurementsof ice surface heights by laser and radar provide direct measure-ments of changes. However, glaciers are very dynamic bodies,
and local elevation changes are often a consequence of chang-ing ice dynamics, which is not always representative of largerregions. Therefore repeated large-scale monitoring is required,notably by a combination of laser, radar and gravity satellitemissions. Such missions are complementary and will eventu-ally give the full picture of change both on local and continentalscales.
To asses the results of such ice monitoring missions,knowledge of crustal uplift associated with melting ice sheets isneeded. Such assessment requires data from permanent GNSSstations and repeated absolute gravity measurements from net-works spanning wide zones around the ice sheets (Wahr et al.,1995; Plag et al., 2007a). Currently such uplift models are thelimiting factor for gravitational change monitoring of Antarc-tica, whereas the melting of the margins of the Greenland icesheet is clearly demonstrated with GRACE.
Geodesy is fundamental in monitoring sea level changes,one of the most serious impacts of climate change. Global sealevel changes are derived from satellite altimetry observations,which pose the most stringent requirements to the stabilityofthe geodetic reference frame (e.g., Blewitt et al., 2006a).Pro-jected scenarios of local and regional sea level rise provide abasis for planning of mitigation and adaptation strategies, butrequire detailed understanding of trends in oceanic and solidEarth contributions. The latter poses high demands on the tiebetween RFO and the CM.
5.6 Water: Improving water resource manage-ment through better understanding of thewater cycle
5.6.1 The global hydrological cycle
Earth is a unique, living planet due to the abundance and vig-orous cycling and replenishing of water throughout the globalenvironment. The water cycle operates on a continuum of timeand space scales and exchanges large amounts of energy as wa-ter undergoes phase changes and is moved from one part of theEarth system to another. Water is essential to life and is cen-tral to society’s welfare, progress, and sustainable economicgrowth. However, global water cycle variability which regu-lates flood, drought, and disease hazards is being continuouslytransformed by climate change, erosion, pollution, salinization,and agriculture and civil engineering practices. The watercycledelivers the consequences of climate change while respondingdirectly to the drivers of that change. The most visible mani-festation that could be expected from climate warming wouldbe changes in the distribution of precipitation and evaporation,and the exacerbation of extreme hydrological events, floodsanddroughts. From both scientific and practical perspectives,thekey question is whether projected climate change will entailsignificant changes in the Earth’s global water cycle.
The water cycle plays the following key roles in the Earthsystem:
• Water exists in all three phases in the climate system and
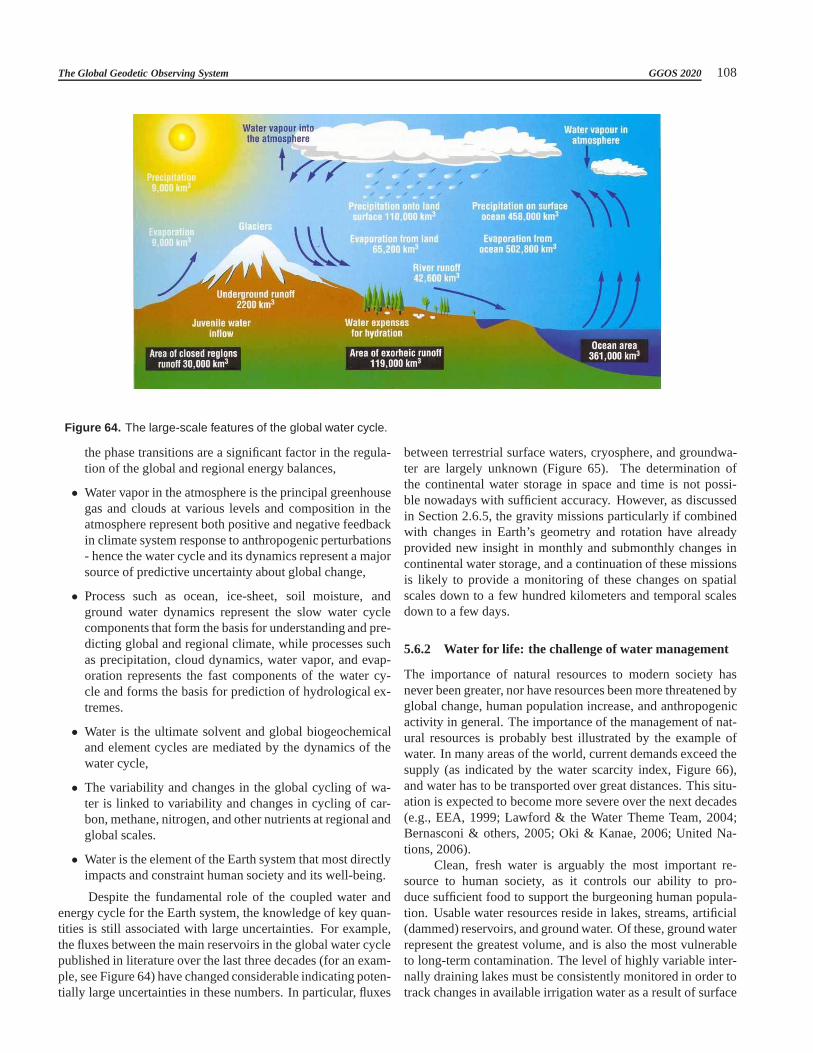
The Global Geodetic Observing System GGOS 2020 108
Figure 64. The large-scale features of the global water cycle.
the phase transitions are a significant factor in the regula-tion of the global and regional energy balances,
• Water vapor in the atmosphere is the principal greenhousegas and clouds at various levels and composition in theatmosphere represent both positive and negative feedbackin climate system response to anthropogenic perturbations- hence the water cycle and its dynamics represent a majorsource of predictive uncertainty about global change,
• Process such as ocean, ice-sheet, soil moisture, andground water dynamics represent the slow water cyclecomponents that form the basis for understanding and pre-dicting global and regional climate, while processes suchas precipitation, cloud dynamics, water vapor, and evap-oration represents the fast components of the water cy-cle and forms the basis for prediction of hydrological ex-tremes.
• Water is the ultimate solvent and global biogeochemicaland element cycles are mediated by the dynamics of thewater cycle,
• The variability and changes in the global cycling of wa-ter is linked to variability and changes in cycling of car-bon, methane, nitrogen, and other nutrients at regional andglobal scales.
• Water is the element of the Earth system that most directlyimpacts and constraint human society and its well-being.
Despite the fundamental role of the coupled water andenergy cycle for the Earth system, the knowledge of key quan-tities is still associated with large uncertainties. For example,the fluxes between the main reservoirs in the global water cyclepublished in literature over the last three decades (for an exam-ple, see Figure 64) have changed considerable indicating poten-tially large uncertainties in these numbers. In particular, fluxes
between terrestrial surface waters, cryosphere, and groundwa-ter are largely unknown (Figure 65). The determination ofthe continental water storage in space and time is not possi-ble nowadays with sufficient accuracy. However, as discussedin Section 2.6.5, the gravity missions particularly if combinedwith changes in Earth’s geometry and rotation have alreadyprovided new insight in monthly and submonthly changes incontinental water storage, and a continuation of these missionsis likely to provide a monitoring of these changes on spatialscales down to a few hundred kilometers and temporal scalesdown to a few days.
5.6.2 Water for life: the challenge of water management
The importance of natural resources to modern society hasnever been greater, nor have resources been more threatenedbyglobal change, human population increase, and anthropogenicactivity in general. The importance of the management of nat-ural resources is probably best illustrated by the example ofwater. In many areas of the world, current demands exceed thesupply (as indicated by the water scarcity index, Figure 66),and water has to be transported over great distances. This situ-ation is expected to become more severe over the next decades(e.g., EEA, 1999; Lawford & the Water Theme Team, 2004;Bernasconi & others, 2005; Oki & Kanae, 2006; United Na-tions, 2006).
Clean, fresh water is arguably the most important re-source to human society, as it controls our ability to pro-duce sufficient food to support the burgeoning human popula-tion. Usable water resources reside in lakes, streams, artificial(dammed) reservoirs, and ground water. Of these, ground waterrepresent the greatest volume, and is also the most vulnerableto long-term contamination. The level of highly variable inter-nally draining lakes must be consistently monitored in order totrack changes in available irrigation water as a result of surface
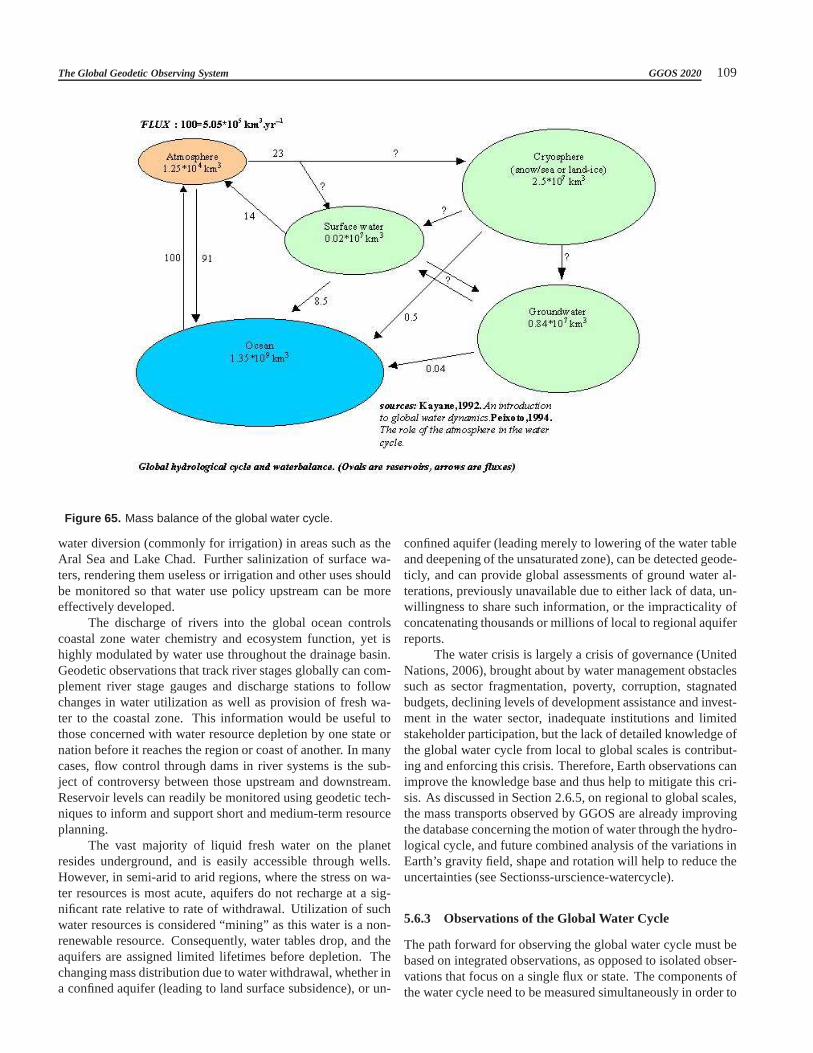
The Global Geodetic Observing System GGOS 2020 109
Figure 65. Mass balance of the global water cycle.
water diversion (commonly for irrigation) in areas such as theAral Sea and Lake Chad. Further salinization of surface wa-ters, rendering them useless or irrigation and other uses shouldbe monitored so that water use policy upstream can be moreeffectively developed.
The discharge of rivers into the global ocean controlscoastal zone water chemistry and ecosystem function, yet ishighly modulated by water use throughout the drainage basin.Geodetic observations that track river stages globally cancom-plement river stage gauges and discharge stations to followchanges in water utilization as well as provision of fresh wa-ter to the coastal zone. This information would be useful tothose concerned with water resource depletion by one state ornation before it reaches the region or coast of another. In manycases, flow control through dams in river systems is the sub-ject of controversy between those upstream and downstream.Reservoir levels can readily be monitored using geodetic tech-niques to inform and support short and medium-term resourceplanning.
The vast majority of liquid fresh water on the planetresides underground, and is easily accessible through wells.However, in semi-arid to arid regions, where the stress on wa-ter resources is most acute, aquifers do not recharge at a sig-nificant rate relative to rate of withdrawal. Utilization ofsuchwater resources is considered “mining” as this water is a non-renewable resource. Consequently, water tables drop, and theaquifers are assigned limited lifetimes before depletion.Thechanging mass distribution due to water withdrawal, whether ina confined aquifer (leading to land surface subsidence), or un-
confined aquifer (leading merely to lowering of the water tableand deepening of the unsaturated zone), can be detected geode-ticly, and can provide global assessments of ground water al-terations, previously unavailable due to either lack of data, un-willingness to share such information, or the impracticality ofconcatenating thousands or millions of local to regional aquiferreports.
The water crisis is largely a crisis of governance (UnitedNations, 2006), brought about by water management obstaclessuch as sector fragmentation, poverty, corruption, stagnatedbudgets, declining levels of development assistance and invest-ment in the water sector, inadequate institutions and limitedstakeholder participation, but the lack of detailed knowledge ofthe global water cycle from local to global scales is contribut-ing and enforcing this crisis. Therefore, Earth observations canimprove the knowledge base and thus help to mitigate this cri-sis. As discussed in Section 2.6.5, on regional to global scales,the mass transports observed by GGOS are already improvingthe database concerning the motion of water through the hydro-logical cycle, and future combined analysis of the variations inEarth’s gravity field, shape and rotation will help to reducetheuncertainties (see Sectionss-urscience-watercycle).
5.6.3 Observations of the Global Water Cycle
The path forward for observing the global water cycle must bebased on integrated observations, as opposed to isolated obser-vations that focus on a single flux or state. The components ofthe water cycle need to be measured simultaneously in order to

The Global Geodetic Observing System GGOS 2020 110
Figure 66. Earth’s water resources: relation of supplies todemands. From Oki & Kanae (2006).
allow the estimation of fluxes between the components of theclimate system. Precipitation and evapotranspiration over landand ocean surfaces require that the state of the system at thesurface and in the atmosphere be monitored simultaneously.Byintegrated observations, we mean the simultaneous retrieval ofrelated water cycle variables. From a technical perspective, thissuggests a satellite platform with sensors for multiple frequen-cies, combining passive and active sensors, and perhaps lidar.From an Earth science perspective, the water cycle variablesand the required spatial and temporal observation requirementsto satisfy the science and applications should drive the sensorpackage and not (as is often done traditionally) the inverse.
It would be most useful to develop the water cycle ob-servational perspective considering that the water cycle can bedivided into slow and fast branches. The ’slow branch’ wouldconsist of measurements relevant to the retrieval of soil mois-ture, ground water, snow and ice, freeze-thaw states, oceandy-namics, ocean salinity and perhaps water body extent and river
discharge. These components do not have a regular diurnal cy-cle. The ’fast branch’ would consist of precipitation (liquidand solid), evapotranspiration, clouds and water vapor. The dy-namics of the components can vary significantly within a day.Table 9 provides a summary of the measurement requirementsfor a complete monitoring of the water cycle and the capabil-ity to retrieve fluxes at interfaces of the land, atmosphere,andocean components of the water cycle.
From an observational and technological perspective, the’slow branch’ would be observed fromLow Earth Orbit(LEO),with the technological focus primarily on improved spatialres-olution and ’fast branch’ having the technological challenge ofobtaining the needed resolution at aGeoStationary Earth orbit(GSO or GSO-like). Below we lay out some challenges thatshould be met over the next decade or so.
5.6.4 Slow branch challenges
The challenge for observing the slow branch of the water cycleis to progress from single-variable isolated water cycle instru-ments to multi-variable integrated water cycle instruments. Itis most likely that the desired integration will progress alongthe lines of extending and integrating the capabilities of sensortechnologies in given electromagnetic band families. For ex-ample, we have several current sensors that make observationsin different microwave wavelengths - our suggestion is thatweprogress towards integrating these capabilities into fewer morecapable instruments that can simultaneously observe multiplecomponents of the water cycle. Because the slow branch ofthe water cycle generally changes on timescales longer than1day, LEO orbits are appropriate. Below we summarize a fewof the current and planned measurements of the slow branch ofthe water cycle that should be progressively integrated over thenext few decades.
Soil moisture and freeze-thaw state: Given its critical rolein the terrestrial hydrosphere as the ’regulator’ between the wa-ter and energy cycles, it is clear that improvements in weatherand seasonal climate forecasting will depend on improved soilmoisture observations. Soil moisture (including its freeze/thawstate) is a key variable that links the water, energy, and biogeo-chemical (carbon, nutrients, and elements) cycles. It has longbeen recognized that this state of the terrestrial hydrosphereneeds to be monitored at high resolution and with good fidelityin order to make significant advances in Earth system scienceas a whole. It is expected that the availability of soil mois-ture data will link the science communities in water, climate-energy, and biogeochemistry. In addition, soil moisture servesas the memory of the terrestrial hydrosphere and it has signifi-cant impacts on operational weather and seasonal predictabilityof the climate system. Further, there are long-standing needs ofthese primary observations for decision makers, especially inthe area of drought management. Currently soil moisture is be-ing estimated from the NASA Aqua AMSR-E sensor at 10.7GHz, with a nominal resolution of about 50-km and posted at a
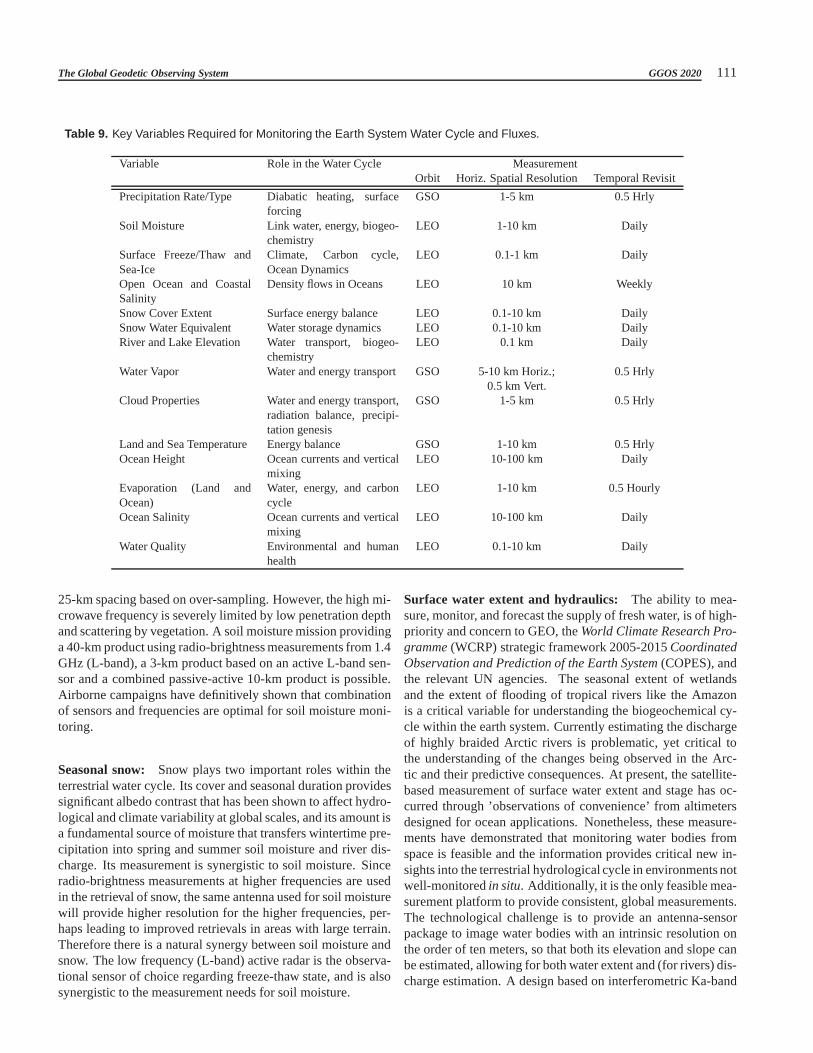
The Global Geodetic Observing System GGOS 2020 111
Table 9. Key Variables Required for Monitoring the Earth System Water Cycle and Fluxes.
Variable Role in the Water Cycle MeasurementOrbit Horiz. Spatial Resolution Temporal Revisit
Precipitation Rate/Type Diabatic heating, surfaceforcing
GSO 1-5 km 0.5 Hrly
Soil Moisture Link water, energy, biogeo-chemistry
LEO 1-10 km Daily
Surface Freeze/Thaw andSea-Ice
Climate, Carbon cycle,Ocean Dynamics
LEO 0.1-1 km Daily
Open Ocean and CoastalSalinity
Density flows in Oceans LEO 10 km Weekly
Snow Cover Extent Surface energy balance LEO 0.1-10 km DailySnow Water Equivalent Water storage dynamics LEO 0.1-10 km DailyRiver and Lake Elevation Water transport, biogeo-
chemistryLEO 0.1 km Daily
Water Vapor Water and energy transport GSO 5-10 km Horiz.; 0.5 Hrly0.5 km Vert.
Cloud Properties Water and energy transport,radiation balance, precipi-tation genesis
GSO 1-5 km 0.5 Hrly
Land and Sea Temperature Energy balance GSO 1-10 km 0.5 HrlyOcean Height Ocean currents and vertical
mixingLEO 10-100 km Daily
Evaporation (Land andOcean)
Water, energy, and carboncycle
LEO 1-10 km 0.5 Hourly
Ocean Salinity Ocean currents and verticalmixing
LEO 10-100 km Daily
Water Quality Environmental and humanhealth
LEO 0.1-10 km Daily
25-km spacing based on over-sampling. However, the high mi-crowave frequency is severely limited by low penetration depthand scattering by vegetation. A soil moisture mission providinga 40-km product using radio-brightness measurements from 1.4GHz (L-band), a 3-km product based on an active L-band sen-sor and a combined passive-active 10-km product is possible.Airborne campaigns have definitively shown that combinationof sensors and frequencies are optimal for soil moisture moni-toring.
Seasonal snow: Snow plays two important roles within theterrestrial water cycle. Its cover and seasonal duration providessignificant albedo contrast that has been shown to affect hydro-logical and climate variability at global scales, and its amount isa fundamental source of moisture that transfers wintertimepre-cipitation into spring and summer soil moisture and river dis-charge. Its measurement is synergistic to soil moisture. Sinceradio-brightness measurements at higher frequencies are usedin the retrieval of snow, the same antenna used for soil moisturewill provide higher resolution for the higher frequencies,per-haps leading to improved retrievals in areas with large terrain.Therefore there is a natural synergy between soil moisture andsnow. The low frequency (L-band) active radar is the observa-tional sensor of choice regarding freeze-thaw state, and isalsosynergistic to the measurement needs for soil moisture.
Surface water extent and hydraulics: The ability to mea-sure, monitor, and forecast the supply of fresh water, is of high-priority and concern to GEO, theWorld Climate Research Pro-gramme(WCRP) strategic framework 2005-2015CoordinatedObservation and Prediction of the Earth System(COPES), andthe relevant UN agencies. The seasonal extent of wetlandsand the extent of flooding of tropical rivers like the Amazonis a critical variable for understanding the biogeochemical cy-cle within the earth system. Currently estimating the dischargeof highly braided Arctic rivers is problematic, yet critical tothe understanding of the changes being observed in the Arc-tic and their predictive consequences. At present, the satellite-based measurement of surface water extent and stage has oc-curred through ’observations of convenience’ from altimetersdesigned for ocean applications. Nonetheless, these measure-ments have demonstrated that monitoring water bodies fromspace is feasible and the information provides critical newin-sights into the terrestrial hydrological cycle in environments notwell-monitoredin situ. Additionally, it is the only feasible mea-surement platform to provide consistent, global measurements.The technological challenge is to provide an antenna-sensorpackage to image water bodies with an intrinsic resolution onthe order of ten meters, so that both its elevation and slope canbe estimated, allowing for both water extent and (for rivers) dis-charge estimation. A design based on interferometric Ka-band

The Global Geodetic Observing System GGOS 2020 112
radar with a baseline of∼10 m would allow for these retrievals.Such a satellite system is needed to determine the spatial andtemporal variability in freshwater stored in the world’s terres-trial water bodies-a most critical water cycle issue.
Ground-water mass: A promising measurement concept isthe gravimetric determination of changes in ground water stor-age, based on extremely precise observation of time-dependentvariations in the Earth gravity field, using space-based gravitygradiometer systems. Groundwater constitutes ninety-sixper-cent of Earth’s unfrozen fresh water (Shiklomanov, 1993 Shik-lomanov, 1993). It is a vital resource which provides for irriga-tion, industry, and domestic usage. In many parts of the world itis being depleted due to unsustainable rates of pumping, whichmay lead to future conflicts and human hardship. Groundwatervaries slowly relative to soil moisture, surface water, andnon-permanent snow cover, but it is dynamic on seasonal to interan-nual timescales (Alley et al., 2002 Alley et al., 2002). Indeed,changes in terrestrial water storage, particularly groundwaterstorage, have contributed to observed changes in sea level dur-ing the past two decades (Milly et al., 2003; Sahagian 2000Milly et al., 2003; Sahagian, 2000). Quantifying groundwaterstorage variations is critical for improving large scale water bal-ance assessments (see also above, Section 5.6.2). Groundwatermaintains streams between storms by supplying baseflow, and,with soil moisture, it determines the infiltration to runoffratioand thus the timing, duration, and intensity of floods. Ground-water also feeds back to atmospheric processes and the carboncycle by enabling phreatophytes to continue to transpire duringdroughts.
Despite its importance, groundwater’s natural variabilityand vulnerability to overproduction and climate change havenot been adequately characterized by the scientific and waterresources communities. It is often assumed that over the courseof a year, a zero net change in groundwater storage will occur.In fact, the interannual variability of aquifer storage canbe sub-stantial, of the same magnitude as root zone soil water storagevariability (e.g. Eltahir and Yeh, 1999; Rodell and Famiglietti,2001; Seneviratne et al., 2004 Eltahir & Yeh, 1999; Rodell &Famiglietti, 2001; Seneviratne et al., 2004). Groundwatermaybe an important indicator of natural and human induced cli-mate variations, if the effects of pumping and injections can beremoved.
Inadequate monitoring, political boundaries, and the ab-sence of centralized, digital archives of measured groundwaterlevels have restricted the number and quality of aquifer storageand flux assessments, even in developed nations. Indeed, twomajor conclusions of National Research Council (2004) were,1) “Our ability to quantify spatial and temporal variability inrecharge and discharge is inadequate and must be improvedgiven the importance of groundwater in the hydrological cycle,the contribution of groundwater to base flow in streams andinflow to lakes, and society’s reliance upon groundwater forwater supply”, and 2) “The roles of groundwater storage, andrecharge and discharge fluxes in the climate system are under-
appreciated and poorly understood”.Geodetic measurement systems can be valuable to
groundwater resources assessments and scientific investiga-tions because they enable data to be obtained through non-destructive means (i.e., without digging). In particular,satel-lite based monitoring of Earth’s time variable gravity fieldhasthe potential to revolutionize the study of hydrology providingglobal observations of water mass redistribution. Whereasthecurrent generation of radar and radiometer based remote sen-sors only provide data on water stored in the upper few cen-timeters of the soil column, satellite gravimetry has an unlim-ited penetration depth.
The GRACE mission (see Section 2.6.5), which is the firsttwin satellite gravimetry mission, is now being used to gener-ate time series of total terrestrial water variations, among otherapplications (e.g. Tapley et al., 2004a). Rodell & Famiglietti(2002); Rodell et al. (2006) have shown how groundwater stor-age variations can be isolated from the GRACE derived wa-ter storage fields. However, the resolution and accuracy of thegravimetry technique must be improved before it is fully em-braced by the hydrological community. The sensitivity of thisfirst demonstration of “photon-less” remote sensing is expectedto allow detection of changes in mass distribution equivalent to±1 cm variation in water storage over a500 × 500 km2 area.Current GRACE measurement uncertainties are on the order of10 kg H2O/m2 (1 cm equivalent height of water) over a 750,000km2 region, and they degrade rapidly as the spatial resolutionincreases (Wahr et al., 2006). While this is sufficient for manylarge scale hydrological and oceanic investigations, mostwaterresources, meteorological, agricultural, and natural hazards ap-plications require higher resolution data. Furthermore, GRACElaunched in 2002 with an expected lifetime of nine years, whileclimate variability assessments require a longer, nearly contin-uous record. This emphasizes the importance of developinga follow-on gravimetry mission with advanced technology toincrease spatial resolution while decreasing uncertainty. Themonthly temporal resolution of GRACE is an issue for manyapplications, but it should be sufficient for groundwater assess-ments. Moreover, recently introduced new analysis methodsofGRACE data have yielded submonthly temporal resolution (seeSection 2.6.5 and Luthcke et al., 2006).
Cryosphere: Ice in the boreal and polar latitudes shows sig-nificant interannual variability in the instrumental record. Theice cover has a significant effect on surface albedo and henceitis a source of diabatic heating anomalies on large scales. Theice is also a significant insulator, and subsurface thermal regimeand heat fluxes into the atmosphere are affected by variabilityin seasonal ice cover. Recent studies in atmosphere and oceandynamics have demonstrated that sea ice could be a significantsource of interannual memory in the climatic system. Its ex-tent is also a major determinant of polar amplification of globalchange. Major melting of polar cryosphere could also be thetrigger for catastrophic climate change if the ocean thermoha-line circulation is disrupted by major flow of freshwater into po-
The Global Geodetic Observing System GGOS 2020 113
lar saline oceans. Paleoclimate indicators show that the oceanthermohaline circulation can change regimes if freshwaterin-puts are dramatically changed - an example is the freshwaterinput into the North Atlantic due to the break-up of the Lauren-tide ice sheet. All these considerations indicate that the mon-itoring of the cryosphere is important for understanding andpredicting the role of the water cycle on the Earth system. Theage of ice (first-year versus multi-year ice) and ice extent athigh-resolution need to be estimated. New multi-frequencyac-tive and passive microwave systems will be required in orderto overcome the confounding effects of snow cover and meltpools that limit current capabilities.
The contribution of geodesy to the investigation of icesheets, glaciers, and sea ice is discussed in Chapter 2, andhere we consider the relevance of such investigations to society.Since the mid 1990s, new observation techniques have shownthat nearly all ice on Earth is undergoing rapid change: Arcticsea ice is shrinking, both in extent and thickness; low-latitudeglaciers and ice caps are losing mass at rapidly acceleratingrates; and even parts of the vast ice sheets in Greenland andAntarctica are shrinking (although there is considerable uncer-tainty in mass balance, especially for Antarctica). Althoughsome of these changes may simply represent natural variabil-ity that we are only seeing now because of the new observationtechniques, some undoubtedly represent recent changes result-ing from substantial local warming. These changes have clearsocietal impacts: shrinking low-latitude glaciers affecttourismand local water availability; shrinking Arctic sea ice affects re-gional weather, climate, and living conditions for Arctic floraand fauna, including humans, and potentially opens new shiproutes; and increasing losses from glaciers and ice sheets cer-tainly affect the rate of sea-level rise, and potentially affectocean circulation patterns, and hence global climate. Thus,apart from the scientific motivation to improve understandingof our planet, there are important practical reasons for monitor-ing the behaviour of these ice bodies.
As discussed in Chapter 2, the recent improvement in ourknowledge of what is happening to ice on Earth results largelyfrom remote-sensing measurements from aircraft and, increas-ingly, from satellites. This includes the measurement of param-eters that are of obvious relevance to glaciology, such as ice-surface elevation and velocity and ice thickness, but also mea-surements of less obvious relevance. These include measure-ments of temporal changes in Earth’s gravity field, which giveinsights into the rates of change of the mass of entire ice sheets,estimates of the rate of sea-level change from tide gauges andsatellite altimeters, and estimation of the rate of crustalmotionbeneath the ice. All of these measurements share a heavy de-pendence on geodesy to provide an accurate framework withinwhich to set the measurements, and very accurate aircraft andsatellite trajectories to ensure that the accuracy of the measure-ments and their locations within the framework are known, witha good understanding of associated errors.
There are three ways to measure the mass balance of thebig ice sheets in Greenland and Antarctica: comparison of to-
tal snowfall with total losses; measurement of volume changes,using altimetry of the ice surface; and measurement of tempo-ral changes in gravity, indicative of mass changes. Of these, allbut the first require correction for changes in the elevationofrock beneath the ice. This is particularly so for interpretationof gravity changes, because rock is so much denser than ice. Bynecessity, the required estimates of crustal motion beneath icesheets come from models, which become progressively morereliable as more information becomes available on actual verti-cal motion to constrain the models. This in turn depends heav-ily on highly accurate geodetic measurements.
In addition to the approaches described above for mea-suring ice-sheet mass balance, changes in length of day and inthe direction of the Earth’s rotation axis also reveal mass re-distribution. These techniques are still under development, butclearly they also require precise geodetic measurements.
Climate change and global ecology: Earth’s climate ischanging, with temperatures increasing almost everywhere. Inmost regions, the increase is slow and accompanied by peri-ods of cooling, but in others, such as the Antarctic Peninsulaand parts of Greenland, it is remarkably fast. Ice is respondingto these changes, but it also has the potential to affect them.As the spatial extent of Arctic summer sea ice shrinks, it is re-placed by dark ocean, capable of absorbing far more solar radi-ation than the sea ice, and thus amplifying the warming. Moresubtly, drainage of meltwater from shrinking glaciers and icesheets, affects the density “layering” of the sea, and this affectsthe deep ocean currents responsible for transferring enormousamounts of heat from low to high latitudes. Possible conse-quences are the subject of ongoing research, and there is littleagreement on whether they may be serious, but in view of thevery large amounts of heat transferred by the ocean, this is anissue that cannot be ignored. Required research will include adetailed monitoring of Earth’s ice.
Climate affects all life on Earth, with small changes hav-ing serious impact on some life forms, some of which may playimportant, and perhaps yet unrecognized, roles in processes af-fecting human welfare. Thus, even those humans with littleinterest in global ecology would be well advised to preserveecosystems and the environment that sustains them to the ex-tent possible. Already, climate change is affecting many as-pects of global ecology, including: growing season for cropsand forests; fish and sea mammal migrations; patterns of in-sect migration, with associated effects on the distribution ofdiseases; and the viability of polar bears in a world of diminish-ing summer sea ice. On a more frivolous, yet of local economicconcern level, climate change is affecting our recreation habits,with ski slopes closing from lack of snow, and fewer glacierstovisit as they retreat to higher and higher elevations. Far moresignificant than impacts on tourism, such changes have the veryserious effect of substantially altering the timing and amount ofmeltwater available to sustain nearby agriculture.

The Global Geodetic Observing System GGOS 2020 114
Sea-level change: Results from the measuring techniqueslargely made possible by accurate geodesy show that changesin ice mass since the mid 1990s are responsible for∼30% ofa total sea-level increase of> 3 mm/yr, and that this contribu-tion is increasing with time. Clearly, as a progressively increas-ing percentage of humanity shifts to homes near the coast, thisis a source of increasing concern. Only a decade or two ago,it was generally accepted that sea level was rising by about 1mm/yr over the20th century, and, although this was probablyan under-estimate (1 - 2 mm/yr may be a better average), weare now experiencing triple this rate. Some of the observed in-crease has been caused by ocean warming, with the remainderlikely to be caused by melting ice. There is a third componentin the sea level equation that may have been confounding at-tempts to project future sea level rise from the observed20th
century sea level records from tide gauges. This componentstems from direct human activities that transfer water betweenreservoirs (e.g. between continents and ocean). While someactivities such as ground water mining, deforestation, andsur-face water diversion serve to transfer water from continents tooceans, thus increasing the rate of sea level rise, these contri-butions were likely overwhelmed in the20th century by theconstruction of new dams and water impoundment on the conti-nents (Sahagian et al., 1994; Chao, 1994). With dams “holdingback” water at a rate of at least 0.5 mm/yr sea level equivalent(and perhaps up to 2 mm/yr), tide gauge measurements over the20th century would not have reflected the entire contribution ofocean warming and glacial melting. As such, if the construc-tion of new dams in the21st century is not continued at as greata rate as it was in the20th (as it is not expected to for variousreasons), we should expect to see an increase in observed sealevel rise, as indeed, we are already seeing, and the reservoirsof ice on Earth are vast enough to raise sea level by 55 m if allice melted. Although this would take many thousand of years,it is clear that even the melting of just a small percentage ofthisice could be catastrophic for tens of millions of people and im-pact hundreds of millions, with enormous costs both to globalfinances and to global security. Continuing to monitor ice onEarth, as well as ocean density, structure, and continentalwaterimpoundment distribution will play a key role in future studiesof sea-level change, and this in turn requires continuationandenhancement of geodetic measurements.
Ocean height: The data from the early ERS and TOPEXocean height missions provided oceanographers with unprece-dented means to constrain the models of ocean circulation.They transformed the discipline and allowed oceanographers tomodel and predict case situations in ocean climate. The successof the early missions motivated follow-ons with the currentJa-son and planned OSTM missions. These ocean height missionprovide data at fairly coarse resolution. Development of futurecapability to perform high-resolution and high-repetition map-ping of ocean height will enable oceanographers to address theocean weather challenge in support of coastal hazards and bio-geochemical cycle applications.
Ocean salinity: Surface ocean salinity affects the density ofsurface waters and the extent of vertical mixing. The verticalmixing is a significant determinant of ocean heating gradientsand circulation. The vertical mixing rate across the oceansisalso a significant factor in the biogeochemical cycles. Currentthe Aquarius ESSP is scheduled to provide open ocean salinitymeasurements. Follow-on capabilities should include sensorsthat can map coastal waters at high resolution. Mixing in thecoastal zone has significant implications for water qualitymon-itoring and biogeochemical cycles science.
5.6.5 Fast branch challenges
In addition to the integration of sensor technologies to enablesimultaneous multi-variable observations of the fast branch ofthe water cycle, we are also challenged with providing obser-vations at a sufficiently high temporal resolution that processessuch as storms can be tracked. The ability of GOES to track wa-ter vapor from GSO should motivate the extension of these ca-pabilities to precipitation, cloud properties and highly accuratemeasurements of air temperature, humidity, clouds, and surfacetemperature: A GSO version of GPM, CloudSat, Calipso andAIRS (Atmospheric Infrared Sounder). Without such sensorsystems, it is unclear whether the critical advances in cloud re-solving parameterizations, and subsequent advances in weatherforecasting, can be achieved. While studies that evaluate thetrade-offs between temporal and spatial resolution need tobecarried out, we need to become creative in developing technol-ogy to achieve these goals. Below we summarize a few of thecurrent and planned measurements of the fast branch of the wa-ter cycle that should be progressively integrated and movedtogeostationary platforms over the next few decades.
Precipitation: The experimental Tropical Rainfall Measur-ing Mission (TRMM) demonstrated the capability to combinethe advantages of the active and passive microwave techniquesfor precipitation observation. Precipitation radar-datacan beused to better constrain the cloud models incorporated in re-trieval algorithms, thereby considerably improving the accu-racy of retrievals based on passive microwave observationsonly. The seminal work of the TRMM team forms the scientificand technological basis for a global precipitation measuring-system, combining observations from at least one active pre-cipitation radar in inclined orbit, a constellation of several (6-8)passive microwave imaging radiometer-spacecraft in staged po-lar orbits, and surface-based rain gauges. This Global Precipi-tation Measurement (GPM) mission constellation concept , to-gether with more detailed characterization and improved mod-eling of cloud structure and properties, constitutes the best cur-rently feasible approach for quantifying the rate of the globalwater cycle. GPM is one of the next generation of systematicmeasurement missions that will be launched around 2010 by aconsortium of international space agency partners.

The Global Geodetic Observing System GGOS 2020 115
Water vapor and clouds: Water vapor in the lower tropo-sphere directly impacts precipitation forecasts, and water vapor(principally) in the upper-troposphere is the largest contributorto the atmospheric greenhouse effect. NASA has made a ma-jor scientific and technological investment in the developmentof the experimentalAtmospheric Infra-Red Sounder(AIRS)instrument. Imaging multispectral radiometers, such as theModerate-Resolution Imaging Spectroradiometer(MODIS) onEOS Terra and Aqua provide measurements of a variety of ba-sic water and energy cycle variables, from sea- and land-surfacetemperature to cloud amount and optical properties and radi-ation fluxes. In addition, the planned experimental missionsCloudsat and CALIPSO will provide measurements of globalcloud properties and their vertical structure. CloudSat isde-signed to measure the vertical structure of clouds and precipi-tation from space. A measurement and algorithm approach isused that combines radar information with radiance data ob-tained from other sensors of the EOS constellation. Infor-mation derived from this combination includes detailed ver-tical profile information about the water and ice contents ofclouds, the occurrence of precipitation and quantitative infor-mation about precipitation (solid and liquid precipitation arereadily detected by 94 GHz radar). CloudSat will provide newknowledge about clouds and precipitation and the connectionof clouds to the large-scale motions of the atmosphere, offer-ing tests of global climate and weather forecast models as wellas cloud resolving models and related parameterizations. Fi-nally, the AIRS/AMSU/HSB instrument suite observes surfacetemperature, cloud fraction, cloud top pressure and tempera-ture, profiles of atmospheric temperature and water vapor, plusa rain flag. All are directly or indirectly relevant to the hydro-logical cycle. Challenges remain, however, before the AIRSobservations reach their full potential for forecasting precipita-tion events.
Evaporation: Evaporation from continents and ocean sur-faces serves as the crucial link between the surface water andenergy budgets. To date, efforts have aimed to provide esti-mates of ocean evaporation from remotely-sensed data of theSpecial Sensor Microwave/Imager(SSM/I) measuring near-surface humidity and winds. However, the veracity and util-ity of these estimates are limited by the quality of the retrieveddata, the absence of other crucial data (such as near-surfacetemperature), and assumptions regarding the algorithmic for-mulas. Thus improvements can be made in two ways, throughimproved satellite data (such as QuickScat which could pro-vide improve near-surface winds and EOS Aqua with higherquality humidity retrievals) as well as the advancement of ex-isting algorithms that use not only current space-based instru-ment measurements but also adapt to forthcoming satellite re-trievals. The feasibility of measuring continental evaporationvia remotely sensed data (from the SSM/I and theAdvancedVery High Resolution Radiometer(AVHRR)) has been demon-strated. However, most of these pilot studies are limited inspace and time and therefore currently posses no capabilityto
globally estimate continental evaporation. Our only current ca-pabilities for providing global estimates of continental evapora-tion rest upon global land modeling efforts - such as the GlobalSoil Wetness Project and the Global Land Data AssimilationSystem. A two-fold effort is needed to improve our capabili-ties to remotely sense evaporation. First, the surface and near-surface atmospheric quantities which are required as inputforalgorithms must be advanced, either by revisiting previousdataor by exploiting data from future missions. This not only in-cludes data used for algorithmic expressions, but also in-situdata that can verify the veracity of the remotely sensed mea-surements. Equally important is to revisit previous efforts andadvance them through further development of the theoreticalframework upon which the retrieval algorithms are based.
Innovative technology solutions: There are potentiallymany solutions to the above challenges, but long-term techno-logical development is needed. Taking the required resolutionsfrom Table 9, we need to convert these into antenna (and re-lated hardware) requirements, and develop a technology strat-egy with end dates related to space demonstration. Below threeareas are briefly presented:
• Carpet Sensors:One potential area for innovative tech-nology is the development of ’carpet satellites’. Herea ’mat’ of 9 to 16, small-scale sensors would fly information-like a sensor mat-resulting in an effective large-scale antenna, not unlike the 2-D array of the ESA SMOSstick antenna. Location among the sensors would be donethrough laser ranging, and the result would be an effec-tive antenna perhaps a few kilometers in size. Differentsensors may be on different micro-satellites, with a ’cen-tral’ satellite having a more complete set of sensors thanon some of the other components. This idea is perhapsthe most innovative (risky) and a multi-decadal effort ofOSSE studies and demonstrations would be required, butit would offer solutions that otherwise may be totally elu-sive to Earth observations.
• Technology for GSO observations:Table 9 lists mea-surements at GSO that are new and difficult, such as pre-cipitation or cloud properties. Through OSSEs, the obser-vational and sensor requirements can be developed so thatthe technological challenges can be laid out. If large an-tennae cannot be deployed at GSO, sensor carpets mightbe an alternative. The spatial-temporal trade-off for pre-cipitation measurements at GSO versus LEO will deter-mine how this technology can contribute, although it isoften stated that these measurements at GSO cannot bedone, but this must be re-examined continuously.
• Space-borne lasers:We must continue technology so-lutions to improve space-borne lasers. This is criticalfor a number of science needs, including improved rang-ing, altimetry, and measuring chemical constituents, in-cluding CO2. For example, the development of accurate

The Global Geodetic Observing System GGOS 2020 116
laser ranging and signal processing could enhance futureGRACE-like missions, as well as provide interferometricobservations.
New solutions for old problems: There are a number of yet-resolved technology problems that require additional effort.Lasers have already been cited. Others include the develop-ment of large-scale antennae, either inflatable or ultra-large,lightweight mesh antenna to provide improved resolution forlow-frequency radiometry. Some years ago there was a testdeployment of an inflatable antenna of∼100 m, but any con-tinued work on this important technology does not seem to takeplace. Additionally, there has been little progress in developingcheaper, light weight, low power space radars. There must bea technological solution to this (old) problem as well. Anothermundane, but important area is the development of improvedcorrelators, especially if stick antenna or sensor carpetsare im-plemented.
Advanced radiative transfer methods Satellite remotesensing requires inverting the radiative transfer equation to re-trieve geophysical quantities of interest. In view of the sensitiv-ity of retrieval products to even small changes in outgoing radi-ation, the inversion (retrieval) process must be based on the bestpossible radiative transfer model(s) that cover all wavelengthsfrom UV to microwave, discriminate polarizations in incoher-ent and coherent radiation, and accommodate both passive andactive sensing techniques. To support the development of ad-vanced satellite retrievals, radiation transfer models must havephysically consistent representations of atmospheric composi-tion, cloud ice and water particles, hydrometeors and precipita-tion, surface roughness, and vegetation or soil propertiesacrossthe whole electromagnetic spectrum. Models should specifyeach component in terms of physical variables (even if valueshave to be assumed) instead of empirical relationships, andag-gregate detailed scattering and emission parameters on satel-lite footprint scales. Further advances in fundamental quantumphysics and spectroscopy may be required to accurately modelcontinuum absorption and emission of gases.
Radiation transfer codes that fully satisfy these require-ments do not currently exist. The development of more accu-rate radiation transfer models is the fundamental underpinningof any major new advance in satellite remote sensing. There-fore, we call for the development of a new generation of radia-tion transfer codes for water cycle remote sensing applications.The radiative transfer processes for wavelengths from UV tomicrowave for irregularly shaped objects and uncommon sizedistributions, and in complex inhomogeneous media, such asice and snow particles and snow packs, grass and tree leavesand vegetation canopies, and soils, are major difficulties of ra-diation calculations, and must be investigated deeply.
Most current retrieval techniques exploit only a few se-lected wavelengths from a single satellite instrument, andthere-fore do not provide either the best analysis of the availablesatellite data nor total physical consistency across data prod-
ucts. New, faster retrieval techniques (e.g., adjoined modelequations or statistical-inverse models) must be developed, thatare general enough to allow the simultaneous retrieval of arange of geophysical quantities from multiple wavelength,mul-tiple sensor and multiple platform measurements. Such meth-ods must be based on rigorous forward models of the measuredradiation. We must develop advanced multi-variate retrievalmethods that can exploit the totality of the spectral informa-tion acquired by future satellite constellations, and eventuallyanalyze data from the whole energy and water cycle observingsystem. The development of more powerful radiative transfercodes and multi-variate retrieval methods is a prerequisite foracquiring crucial information for the success of water cycle re-search.
5.7 Weather: Improving weather information,forecasting, and warning
Predicting the weather is of utmost importance for many rou-tine human activities today, ranging for example from agricul-ture to energy distribution, including transportation of passen-gers and freight by air and sea routes, and many other activities.Daily weather prediction also aims at the early prediction of ex-treme weather events which can have significant human and fi-nancial impacts. This is exemplified for example in the coastalregions of the Gulf of Mexico where population has increasedin the past twenty years and so has the overall population ex-posure to hurricanes. Issuing weather prediction today requiresnumerical models which ingest millions of atmospheric obser-vations every day.
Much time has passed since scarce observations of theweather were made by passionate individuals with limited in-strument technology. Since the 1960s, the Earth has been ob-served from space by weather satellites. Observations of theatmosphere today have increased to large numbers, increasingtenfold in the last five years and approaching now107 indi-vidual observations per day. This wealth of information is in-gested at first and within a few hours after collection into at-mospheric models to issue weather forecasts. As for the obser-vations collected a few years ago, they are also useful in theframework of reanalysis initiatives that recreate a best estimateof the past weather using all available information at the time.This means that the atmospheric measurements of today servetwo purposes: today, the prediction of weather, and, tomorrow,the reconstruction of today’s climate via reanalyses. However,many aspects of our atmosphere remain poorly observed suchas the global wind field and the water cycle.
An increasing number of observations of the atmosphereare collected every day. These observations are useful forweather forecasting and climate monitoring. In order to be use-ful to everybody, atmospheric observations would need to bereferenced in a consistent reference frame. Weather predictionwould benefit from such a consistent reference frame to locatevarious platforms, the number and the variety of which is boundto increase. Also, weather prediction lacks good water vapour

The Global Geodetic Observing System GGOS 2020 117
observations.Like many other technology areas, weather observing and
data dissemination systems move toward more distributed sys-tems, rather than centralized systems. Such distributed observ-ing networks will eventually communicate intelligently witheach other and some of them be located optimally. The timingand location of observations will be targeted to areas of par-ticular forecast error sensitivity. Complementing the existingand developing weather space missions,unmanned aerial vehi-cles(UAV) will collect measurements in the lowermost part ofthe atmosphere where weather affects the most human activi-ties and violent events such as tornadoes unleash their destruc-tive force. UAVs present the advantage of bringing to atmo-spheric scientists and meteorologists the power ofin situ ob-servations with an on-demand location and timing possibility.Furthermore, the easily upgradeable technology onboard UAVsrequires less technological advances than space-compatible so-lutions at a fraction of the cost. Finally, the vicinity of the mea-surements to the phenomena of interest puts less constraintson optics and detector technology that do not need to reachthe fast integration times required by fast-moving space plat-forms located several hundred of kilometers above the Earthatmosphere. However, unlike their satellite counterparts, UAVswill measure phenomena of very fine horizontal and verticalscale (about ten meters) and location errors acceptable today forsatellite location determination will be unacceptable forUAVmeasurements, should one want to assimilate the data. Withthe renewal of the GPS constellation and the addition of a moreprecise L2C signal, and the advent of the GALILEO system,positioning UAVs in real-time with high accuracy in ITRF willbecome feasible at low cost.
Year-round, manifestations of violent weather remind usthat improvements in forecast accuracy and lead time need tobe achieved in order to increase preparedness of affected pop-ulations. Among the various basic meteorological observables,water vapor is both important in regard to the phenomena inwhich it is involved (e.g., hurricanes, flash floods, etc.) anddifficult to observe, for it presents a very high space- and time-variability. Water vapor plays a crucial role in the dynamicsand thermodynamics of many atmospheric processes that actover a wide range of temporal and spatial scales, covering theglobal hydrological and energy cycles that effectively definethe local and global climate change, contributing largely to thegreenhouse effect, and playing a critical role in the vertical sta-bility of the atmosphere and in the structure of the evolution ofatmospheric storm systems. The scarcity of traditional meteo-rological observations, especially over the Southern Ocean andPolar Regions, as well as the shortcomings of the traditionalmethods over the land, have contributed greatly to uncertain-ties in a global and regional weather analysis. Given that wedonot currently have the means to observe on a global scale thesources and sinks of water vapor (evaporation at the surfaceandprecipitation over land and ocean), observing the water vaporfield is a another way of studying the water cycle (which is alsorelevant for water resources management). Improving the qual-
ity of weather forecasts will require observations of waterva-por with more geographical coverage and higher temporal fre-quency than what is available today fromin situ measurementsor passive infra-red and micro-wave sounders. GNSS offers anew, more economical, and in principle, real-time method ofatmospheric water vapor recovery (see Section 2.9.1). There-fore, GGOS can provide atmospheric scientists with near-real-time observations of atmospheric delays encountered by GNSSsignals. If observed along the vertical, these delays can bringinformation on the lower tropospheric water vapor content.Ifobserved between a GNSS satellite and a receiver in low-Earthorbit, these delays can help gather information on the strato-spheric mass field.
5.8 Ecosystems: Improving the managementand protection of terrestrial, coastal, andmarine ecosystems
Management and protection of ecosystems depends on our abil-ity to observe certain key environmental parameters that controltheir behavior, and upon which they depend. All ecosystemsare closely linked to the global carbon cycle, and terrestrial wet-lands are particularly important, as they are both highly produc-tive yet vulnerable to land use, and readily monitored remotely.
5.8.1 Measurements of CO2 spatial and temporal distri-bution to better understand the Earth’s carbon cycle
There is very strong scientific evidence now that the increas-ing concentration of greenhouse gases is seriously affecting theEarth’s climate. Of greatest concern is the increasing concen-tration of CO2 which is resulting from human activity such asthe burning fossil fuels and the tropical biomass. Current CO2
mixing ratios in the atmosphere are 30% above those at the be-ginning at the industrial revolution and are increasing at about1.5 parts per million per year.
The processes that generate CO2 are relatively well un-derstood; the substantial sinks that absorb CO2 are not. In or-der to understand how the CO2 cycle works and how we areaffecting this cycle over the long term, the nature and loca-tion of these sinks must be understood. The location and na-ture of these sinks influence the spatial and temporal distribu-tion of CO2 within the atmosphere’s boundary layer. Mappingand monitoring the CO2 distributions, combined with transportmodels, can be used to better understand the CO2 cycle andthereby better determine the processes and spatial location ofsinks.
Presently, CO2 is measured within situ sensors near thesurface and on towers. Occasional measurements are made viasampling on research aircraft. Several activities are underwayto extend the observation of CO2 from the surface of the Earthand from space. Differential absorption LIDAR techniques arebeing developed at Goddard Space Flight Center and other in-stitutions to monitor the vertical profile on and off a CO2 ab-sorption line in the near infrared. Initial activities are focused

The Global Geodetic Observing System GGOS 2020 118
on measurements in the boundary layer, but as more powerfullasers become available this work will be extended to higheraltitudes. This program is being developed in response to re-quirements from the North American Carbon Program to makemeasurements of CO2 within the boundary layer of 1 pppmvolume (1 ppmv) with a vertical resolution of∼10 meters. Thefirst instruments have been built during the last few years andare being tested.
Laser-based sensing techniques are also being developedat Goddard Space Flight Center, other NASA centers, and byESA for measuring CO2 column densities from airborne andeventually from space space The first step is to demonstrate alidar that will measure the CO2 column density from an air-craft. The ultimate goal is a space based lidar sensor that canmeasure the CO2 mixing ratio to 1 ppmv to provide a continu-ous synoptic measurement of its spatial distribution in thelowertroposphere. These will measure at all times of day and contin-uously over the ocean. A flight mission approach is being de-veloped for an anticipated flight opportunity in the 2013 - 2016time frame.
5.8.2 Monitoring wetlands
Flows of water in wetlands, especially in extensive lowlandsystems such as the Pantanal, Amazon, Everglades, Niger in-land delta and Okavango, are forced largely by subtle slopesor differences in head, e.g., mm to a few cm. These slopes aregenerated by spatial variations in the inputs and losses of wa-ter across the wetlands (Lesack and Melack 1995 Lesack &Melack, 1995). Since stage gauging of rivers or lakes very sel-dom includes measurements within adjacent wetlands and be-cause of the spatial heterogeneity of the subtle differences inhead within wetlands, it is quite difficult to determine water,solute or particulate fluxes in wetlands. Recent applications ofinterferometric synthetic aperture radar have demonstrated thepossibility of quantifying the differences in elevation across ex-tensive wetlands (Alsdorf et al., 2000, 2001b,a). However,vali-dation of these results and implementation of hydraulic modelswithin wetlands requires accurately and precisely measuringthe levels of multiple stage gauges. Current capabilities withhigh end GPS units permit making the required measurements,in principle, but doing so in large remote systems is quite diffi-cult. Establishing a network of base stations or repeatedlymov-ing and repositioning a base station is necessary and lengthyrecording at each site from a floating platform compounds thedifficulty of the process.
5.9 Agriculture: Supporting sustainable agri-culture and combating desertification
Agriculture, including forestry, has had a profound impactonthe composition of soil, land cover, and changes in topography(e.g., Turner II et al., 1990). Monitoring the impact of agri-culture and society at large on land cover therefore is of crucialimportance in order to understand the interactions of humanac-
tivities and the environment. The advent of remote sensing hasbeen a boon for monitoring human modifications of the Earth’sland surface so that the impacts of land use on global systems,including climate, can be better assessed. With remote sens-ing, continuous and consistent characterizations of the Earth’sland surface became possible. Landsat satellite data has es-pecially become the standard for mapping land cover changesdue to human activities. Landsat 1 was launched by NASA in1972, and measurements continue today with Landsat 7, mak-ing it the longest running remote sensing program. Monitoringthe changes in land use and cover caused by deforestation andagriculture are considered in Sections 5.9.1 and 5.9.2, respec-tively.
Considering the great impact of agriculture on the envi-ronment, efficiency in terms of nutrients and chemicals intro-duced into the environment is beneficial. Based on geodetictechniques,Precision Farming(PF) is developed and increas-ingly used to reduce the resources required in food production,thus not only keeping prices for food at a low level but alsoreducing the environmental impact of farming (Section 5.9.3).
5.9.1 Monitoring deforestation and logging
Landsat data, with 30 m resolution, is ideal for mapping landcover changes over large areas. In particular, it has becomevaluable for monitoring deforestation around the world. Thefirst large-scale deforestation mapping using satellite imagerywas applied to the Brazilian Amazon. More recently, throughthe NASA Pathfinder Humid Tropical Deforestation project, re-peat assessments have been made by various studies for theAmazon (Tardin & da Cunha, 1990; Skole & Tucker, 1993),and for much of the tropics (Skole et al., 1994).
However, while Landsat data are valuable for mappingland cover change over large areas, they have still been tooexpensive in terms of effort, time, and labor costs, for map-ping land cover change continuously over the entire tropicsor the entire planet. Therefore, several attempts have beenmade to map deforestation using a sampling approach. TheFAO Remote Sensing Survey (reference) used a 10% samplingof Landsat scenes to map tropical deforestation for the 1980sand 1990s. However, FAO’s 10% sampling approach has beendeemed insufficient to map forest change because deforestationis clustered, and not randomly distributed (Townshend & Jus-tice, 1995). Some studies have suggested that complete wall-to-wall mapping is necessary (Townshend & Justice, 1995), whileothers have suggested that a 10% sample is sufficient for large-area estimates (CITE). A sampling of Landsat scenes was alsoused by the recent TREES II project of the Joint Research Cen-ter of the European Commission to map deforestation rates forthe entire humid tropics (Achard et al., 2002, 2004). How-ever, to address the concern about the clustered nature of de-forestation, they used a stratified random sampling approach,which focused the samples withina priori delineated deforesta-tion hotspots in the humid tropics. Another approach to mapdeforestation over large areas has used the coarse-resolution

The Global Geodetic Observing System GGOS 2020 119
AVHRR Pathfinder data (about 8 km resolution) over the 1982-1999 period (Hansen & DeFries, 2004), calibrated to regionswith known estimates of deforestation mapped using higher-resolution remote sensing. Both the TREES II and AVHRRstudies indicated that deforestation rates were much lowerthanreported in theFood and Agriculture Organization’s(FAO)Forest Resources Assessment (Hansen & DeFries, 2004).
Two other recent studies using remote sensing to examinedeforestation dynamics is worth mentioning. While Landsatdata have been used to map large-scale deforestation aroundthe world, good estimates of selective logging have not beenavailable. Asner et al. (2005, 2006) developed a method to es-timate selective logging over the Amazon Basin using Landsatdata, and found that forest area damage from selective loggingmatched or exceeded reported rates of deforestation. This hasbeen a remarkable advance in our ability to use remote sens-ing data to map fine-scale patterns of land use practices suchaslogging. In another recent study, Pongratz et al. (2006) exam-ined the dynamics of land cover change following deforesta-tion in Mato Grosso, Brazil. Mato Grosso state has seen enor-mous expansion of soybeans in recent years, and it has beendebated whether the soybean expansion has occurred on aban-doned pasture land, or whether it is resulting in new deforesta-tion. Pongratz et al. (2006) estimated that total conversion offorest to cropland exceeded 540,000 ha over the 2001-2004 pe-riod, peaking at 23% of the total deforestation in 2003.
5.9.2 Agricultural land cover and land use
Mapping agricultural land cover and land use over large areashas proved surprisingly more challenging. Global satellite datasuch as the 1 km AVHRR data or the more recent 250 m-1 kmMODIS data have been used to derive global land cover maps(e.g., IGBP DISCover product (CITE), University of Mary-land land-cover maps (CITE), or Boston University land cover(CITE)), but have paid scant attention to detailed characteriza-tion of the world’s agricultural lands (McCabe & Wood, 2006).While deforestation registers a clear signal in global satellitedata, it has been difficult to characterize the heterogeneous agri-cultural land use practices around the world. While large-scalemechanized intensive agriculture in regions such as Iowa andKansas are clearly visible from satellites (CITE Earthshots), itis more difficult to characterize the heterogeneous landscapesin places like West Africa (Ramankutty, 2004).
5.9.3 Precision farming
There is a trend toPrecision Farming(PF), which in commonwith many engineering activities (see Section 4.3.3) requiresprecise geopositioning of farm machinery, and reliable spa-tial information (e.g., maps of the property, terrain, soiltype,growing patterns, etc.). Farmers in North America (U.S. andCanada) and Australia are adopting PF practices very rapidly.Benefits of PF include sustainable farming practices, 24 hour-operations, increased automation, which all together result intoreduced environmental impact of farming and contribute to
lower food prices.A particularly challenging form of PF iscontrol track
farming (CTF). Currently, GNSS-RTK is used to guide thefarm machinery during all stages of the grain growing cycle,so that the wheels of the machinery always travel along thesame “ruts” of compacted soil. This leads to less breakup ofthe soil, decreases soil erosion, and makes possible innova-tive practices such as growing a second crop interlaced withthe main grain crop. The ability of the farmer to guide his/hermachinery along the same ruts, over and over again, is possi-ble because the GNSS datum can be defined to the centimeterlevel. However, currently PF and CTF depend on the avail-ability of local augmentation system providing the accuracy atthe few centimeter level. Improved real-time access to ITRFand compatibility of databases with this reference frame wouldsupport these applications globally without local expertise inestablishing and maintaining augmentation systems.
Forestry practices also benefit from geodetic innovationssuch as directly georeferenced airborne laser scanners. Theseinstruments known as LIDAR, can determine the DEM andDSM, as well as scan understorey, etc. In effect the differ-ence between the two surfaces can be used to estimate biomass,and help forest management practices, such as when to harvest,where tree growth is sub-optimal, etc.
The increased availability of GNSS and improved accessto ITRF also provides the means to change livestock practices.Examples could be livestock equipped with GNSS sensors,which would make them trackable. Particularly in open ranch-ing, the combination of such sensor on free ranging livestockwith spatial information could also be used for warning systemsindicating animals approaching roads through open ranchingcountry.
5.10 Biodiversity: Understanding, monitoringand conserving biodiversity
STILL TO DO: This Section needs to bewritten.

The Global Geodetic Observing System GGOS 2020 120
6 Geodesy: foundation for exploringthe planets, the solar system and be-yond
J. F. Zumberge, J. S. Border, V. Dehant, W. M. Folkner, D. L.Jones, T. Martin-Mur, J. Oberst, J. G. Williams, X. Wu
The utility of a Global Geodetic Observing System is not lim-ited to our home planet, but also extends to scientific studies ofthe planets and their moons (including our own Moon), obser-vations beyond the solar system, and the exploration of spacein general. Examples of the first two of these include PlanetaryGeodesy and Radio Science, where the GGOS infrastructureis a requirement for making and interpreting measurements forthese sciences; we include a section on each.
The exploration of space in general involves spacecraft inEarth orbit and beyond. Tracking these spacecraft from Earthdepends critically on the GGOS infrastructure. In the sectionon Inter-planetary navigation we describe the current and futurerequirements of GGOS for this application.
6.1 Planetary geodesy
The most accurate estimates of the time-dependent orientationof the planets and their satellites are based on radio-frequencyrange and Doppler measurements between spacecraft in orbitorlanded on those bodies and Earth tracking stations. Planetarygeodesy provides invaluable information about the distributionand state of the matter of which they are comprised. Futuremeasurements are expected to help in determining whether liq-uid water exists under the surface of bodies such as Europa.Rotation variations also provide means to measure the inter-action between the planetary surface and the atmosphere. Themost accurate planetary orientation measurements are for Mars,where the large number of past and present landers and orbitersprovides a large data set.
The accuracy of the determination of the Mars orientationis approaching that of the Earth not very long ago. The accu-racy is expected to improve over the next decade with a newgeneration of landers with improved radio capabilities.
The reference frame for planetary geodesy is establishedby measurement of the Earth’s orientation. Thus maintainingand even increasing the accuracy of knowledge of the orienta-tion of the Earth is needed to improve our understanding of theother bodies in the solar system.
In the following sections, we first discuss the relevanceof geodetic quantities to rotation and interior propertiesof theplanets. Sections 6.1.2 to 6.1.4 illustrate the challengesin plan-etary geodesy using examples of Mars, the Moon, and Europa.Finally, Section 6.1.5 discusses future geodetic infrastructureon or near to the planets and their satellites.
6.1.1 Planetary rotation and interior properties
The principle of using rotation parameters as discussed in Sec-tion 3.11 for obtaining information on the interior propertiesmay be applied to the other terrestrial planets. The interior in-fluences on nutations, the determination of the free modes suchas the Chandler Wobble, the Free Core nutation etc. may beapplied to other terrestrial planets with rapid rotation such asMars. Librations are also influenced by interior properties, andas such, observations of librations will lead to further knowl-edge on the interior of the other slowly rotating planets such asMercury.
Precession and nutation are induced by the tidal gravita-tional torque on an oblate planet; this is the case for Mars andfor the Earth. This motion is very helpful for studying the deepinterior of Mars, mainly because it is different for a planetwitha solid core than for a planet with a liquid core. The dimensionof the core (or equivalently the core moment of inertia) can alsobe determined from these observations. Figure 67 shows therelative influence of the dimension of the core on the nutationtransfer function of Mars.
Similarly for the planet Mercury in a spin-orbit resonance3:2, one has librations at the level of 500 meters at the equatorof a Mercury-size Planet with a liquid core and half of thatvalue for a solid core. The dimension of the core also influencethese values. Generally speaking the global parameters suchas the mass, the moment of inertia, the rotation, the orientationchanges may be used to better constrain the interior propertiesof terrestrial planets.
Length-of-day variations are deviations from the uniformrotation speed of a planet. They are mostly related to anygeophysical fluids (core, ocean, atmosphere, hydrosphere,etc.)in the system, if they exist. For Mars the seasonal conden-sation/sublimation of the icecaps induce polar motion as wellas large changes in the length-of-day at the seasonal periods.This is easy to understand from the moment of inertia changesinduced by the mass repartition and from angular momentumconservation between the solid part of the planet and the fluidsurrounding it. The seasonal length-of-day changes correspondto a change with respect to the uniform rotation at the level of15 meters at the equator, which can be computed from generalcirculation models and constraints from the observations.
In parallel, information on planetary interiors can alsobe obtained from measurements of global parameters from thegravity field. The determination in parallel of Love numbersrepresenting the tidal effects are also important global parame-ters that can be used to determine the internal structure of theterrestrial planets and their satellites in the solar system.
6.1.2 Example: Mars
The only observations of Mars which provide insight into itsinterior structure are based on geodesy. (Other clues to theinte-rior structure are provided by meteorites found on Earth whichoriginated on Mars, though these may be more indicative of thesurface than of the interior.) A series of spacecraft, from the

The Global Geodetic Observing System GGOS 2020 121
Figure 67. Resonance induced when different dimensionsof the core are considered. The vertical lines show wherenutation could be observed.
Viking orbiters in the 1970’s to the current Mars Reconnais-sance Orbiter and Mars Express spacecraft have provided in-creasingly accurate determinations of the Martian gravityfield(Smith et al., 1998 Smith et al., 1998; Konopliv et al., 2006).The martian precession constant was originally determinedbymeasurements of the Viking landers and the Mars Pathfinderlander radio signals (Folkner et al., 1997 Folkner et al., 1997).The combination of the precession constant and the low-ordergravity field determine the polar moment of inertia, which givesthe first indication of the size and mass of the martian core. Themore recent gravity field determinations are increasingly sen-sitive to the martian orientation and can provide estimatesofthe precession constant with accuracy comparable to the Vikingand Pathfinder landers (Konopliv et al., 2006).
The martian gravity field is also sensitive to the distortionof the planet as its distance from the sun varies due to Mars’eccentric orbit. Estimates of the tidal deformation Love numberk2 suggest that the core is liquid rather than solid (Yoder et al.,2003; Konopliv et al., 2006). Comparison of the gravity fieldto topography allows estimation of the crustal thickness andexplanation for the dichotomy between the southern lowlandsand the northern highlands (e.g., Smrekar et al., 2004).
The martian rotation rate varies due to seasonal evapora-tion and condensation of the polar CO2 icecaps. The lander andorbiter radio measurements provide estimates of the variationin the distribution of the mass of the icecaps, providing insightinto the climate and formation of polar layered deposits.
Future landers with improved radio instrumentation areexpected to improve the accuracy of the martian precessionconstant by a factor of ten or more, and also be accurate enoughto measure nutation and polar motion with sufficient accuracyto determine the size, density, and state of the martian core.
These will complement expected seismometry measurementsto provide a much more thorough understanding of the structureand formation of Mars. The future martian geodesy measure-ments will approach milli-arcsecond accuracy, comparabletothe current accuracy of Earth orientation measurements. Con-tinued monitoring of Earth orientation to at least this accuracywill be required to accurately interpret the martian measure-ments.
6.1.3 Example: Earth’s Moon
Missions to the Moon include orbiters, impactors, landers andsurface rovers. There have also been flybys of spacecraft head-ing for other destinations. Orbiting missions may have exper-iments to image the surface at different wavelengths and alsoto measure surface topography by altimetry, gravity field byspacecraft tracking, magnetic field, remote sensing of surfacecomposition, and near Moon particles and fields. Landers candeliver instruments (fixed or roving) and astronauts to the sur-face for exploration. The future LCROSS experiment will im-pact the Moon throwing up material to be analyzed. Also in thefuture, there will be a need to follow the movements of roversand astronauts on the lunar surface.
Orbiting, landing, roving and impacting missions mustknow how the position of the spacecraft changes with time. Or-biters need the direction and distance to surface targets understudy. Tracking of the highest accuracy is needed for gravityfield determination. For an impactor, the location and time ofimpact are needed. Landers need to arrive at their intended des-tination.
The use of tracking data for navigation of spacecraft re-quires Earth orientation information. For operations and ma-neuvers this information must be extrapolated forward fromrecent accurate measurements, so quick analysis is important.The fitting of tracking data for determining the gravity fieldcan take advantage of the more accurate past Earth orienta-tion parameters available from analyzing measurements afterthe tracking data is taken.
Radio range and Doppler as well as laser ranging tech-niques have been used for tracking at the lunar surface. LLRrequires no power source on the Moon which has allowedranges to be acquired for more than three decades. LLR dataanalysis has contributed to lunar science, gravitational physics,ephemerides, and Earth science. LLR is both a contributor toand a user of Earth orientation information. The laser rangeaccuracy is presently making a transition from centimeter tomillimeter levels. With current renewed interest in lunar ex-ploration, studies on future lunar geodesy experiments arecur-rently under way involving active lasers on the lunar surfacepointed at Earth. Current lunar ranging requires sophisticatedground equipment and is carried out by few Earth stations only.On the other hand, signals from strong (50 mJ) lasers on theMoon could be within the sensitivity of all stations in the globalSLR network. Such a laser station should be combined witha co-located small radio transmitter, which would be observ-

The Global Geodetic Observing System GGOS 2020 122
able to VLBI stations and which would enable us to firmlytie lunar coordinates to the celestial reference frame of radiosources. Earth orientation parameters of comparable accuracyare needed.
6.1.4 Example: Europa
A Europa orbiter to detect a possible underground liquid wa-ter ocean remains a high science priority for the planetary sci-ence community and NASA. The primary scientific goal of asystematic geodetic and geophysical experiment is to measuretidal gravity, displacements and libration on Europa to deter-mine the existence and dimensions of the ocean and other in-terior structures. Doppler tracking from DSN stations is essen-tial to achieve these measurement objectives by determining theLove numberk2 and mantle libration amplitude through orbitdynamics, and by providing accurate orbital positions for sur-face geodetic measurements from altimeter or InSAR instru-ments. To assess effects of uncertainties in geocentric positionsof DSN stations, tropospheric delay, and EOP, orbit determina-tion simulations were carried out and covariance analyses fora nominal Europa orbiter were considered. Even with conser-vative uncertainties in these ground geodetic parameters,theireffects on dynamic parameters such ask2 and mantle librationare negligible compared with their achievable accuracies.Theeffects on orbital positions are generally at the level of sev-eral centimeters along the unfavorable (along- and cross-track)directions. This level of uncertainty is fairly small comparedwith the anticipated peak tidal displacement amplitude of 30 mwith the liquid ocean. Current levels of accuracies in geocentricDSN station coordinates, polar motion and UT1 are also ade-quate for the planned ESA BepiColombo mission to Mercurywith very precise multi-frequency (including Ka band) trackingfrom the DSN sites equipped with water vapor radiometers fortests of general relativity and the internal structures.
6.1.5 Planetary mapping
Thanks to the radio experiments on the US Mars Pathfinder andto the radio and laser ranging experimentsMars Orbiting LaserAltimeter (MOLA) on the Mars Global Surveyor spacecraft,Mars possesses a well-defined coordinate system. MOLA hasmapped the planet at high accuracy and with globally consistentquality within this coordinate system. Consequently, morpho-logic features anywhere on the surface of Mars can be locatedwithin the Mars coordinate system to within 100 m. TheHighResolution Stereo Camera(HRSC), a camera on the Mars Ex-press mission, dedicated to accurate topographic mapping,iscurrently refining the resolution of these maps.
For the Moon, in spite of the fact that it is closer toEarth than Mars, the currently available mapping control isless accurate. The Apollo Laser retroreflectors provide excel-lent control points and practically define the coordinate systemof the Moon. Hence, coordinates of features near the Apollosites (where the Apollo spacecraft in their near-equatorial or-bits provided image coverage at high resolution) are well es-
tablished. Unfortunately, geodetic control rapidly decreases to-wards higher latitudes and towards the Lunar farside. Coor-dinate uncertainties may amount to several kilometers. Such“map-tie” errors are annoying to spacecraft engineers whowould like to target a spacecraft to a specific surface locationseen in images. The situation is expected to improve with ar-rival of data from the Japanese SELENE mission or the USReconnaissance Orbiter, which are both equipped with laseral-timeters and sophisticated camera systems.
6.2 Radio science and interferometry
Radio science with tracking data Radio science encom-passes a wide range of techniques, with a correspondingly di-verse set of geodesy requirements. Studies of planetary atmo-spheres, rings, and the interplanetary medium through occulta-tion and scattering measurements do not often depend on ex-tremely accurate Earth orientation or antenna location knowl-edge; however, the study of local gravitational fields throughaccurate spacecraft orbit determination does require a verygood terrestrial reference frame. Errors in UT1, polar motion,or antenna positions translate directly into errors in the angularposition of a spacecraft.
State-of-the-art radio science observations rely on groundsystem performance that often exceeds the formal require-ments. The geodetic aspect of this is after-the-fact knowledgeof UT1 and pole offsets to 0.5 cm, and antenna positions to 1cm. The current (2005) requirements are 5 cm for after-the-factEarth orientation and 3 cm for antenna positions.
Imaging Very-Long-Baseline Interferometry VLBI imag-ing of radio sources generally relies on self-calibration to re-move the effects of antenna-dependent errors. This techniquecan dramatically improve the dynamic range and fidelity of ra-dio images, but absolute position information is lost. Conse-quently, VLBI imaging is relatively immune to errors in an-tenna positions or Earth orientation. Requirements on the ter-restrial geodetic system imposed by other uses will be morethan adequate for high-resolution radio source imaging.
Astrometric Very-Long-Baseline Interferometry Preciseposition measurements of radio sources are directly dependenton the accuracy of the terrestrial geodetic system. For narrow-angle differential (phase-referenced) astrometry most terrestrialerror sources are reduced by the angular separation of the ra-dio sources in radians. For wide-angle (absolute) astrometry,there is no reduction in terrestrial error sources. Wide-angle as-trometric measurements are the basis of the celestial referenceframe.
The best current wide-angle VLBI position measurementaccuracies are∼1 nrad. This implies knowledge of UT1 andpolar motion to 0.5-1.0 cm, exceeding the current Earth ori-entation requirement by up to an order of magnitude. The re-quirement on antenna positions is less straightforward becausethe effect of a baseline error on a position measurement de-
The Global Geodetic Observing System GGOS 2020 123
pends on the relative orientation of the baseline and the line ofsight to the radio source. Knowledge of antenna positions to2cm would be adequate, with a long-term goal of 1 cm.
Earth-space interferometry The use of baselines betweenground antennas and antennas on Earth-orbiting spacecraft(e.g., the Japanese VSOP and VSOP-2 missions) requires anaccurate spacecraft orbit as well as geodetic parameters. Nor-mally errors in orbit determination exceed those of the globalgeodetic system. Consequently this type of observation doesnot impose any new or more stringent requirements on geode-tic parameters.
6.3 Inter-planetary navigation
Geodesists and students of Geodesy do not always realize thecritical role that geodesy plays in the exploration of worlds be-yond our own. Although this application is often overlooked,national space agencies must provide geodesy-related “calibra-tions” to support their lunar and planetary missions. Thesecalibrations are necessary to chart the course of spacecraft enroute to other bodies in the Solar System. The radio link fromspacecraft to Earth not only serves for communications but alsoprovides tracking observables that are the primary source ofdata about spacecraft position and velocity for most missions.While spacecraft move in a celestial reference frame, observerson Earth have positions known in a terrestrial reference frame.Definitions of reference frames, catalogs of objects, relationsbetween reference frames, and modeling of radio signal propa-gation delays are all important aspects of spacecraft navigation.
6.3.1 Current and future tracking datatypes
Thornton & Border (2000) give an excellent treatise on radio-metric tracking techniques for deep-space navigation. Considertheir equation 3.2-1 to illustrate the importance of geodeticquantities:
ρ(t) = r(t) + ωers cos δ sin(ωet + φ + λs − α). (1)
Hereρ is the range from a tracking station to a distant space-craft andρ its time derivative. On the right-hand sider is thegeocentric range rate,ωe the Earth’s rotation rate,rs the dis-tance of the tracking station from the axis of rotation of theEarth,λs the longitude of the tracking station,α the right as-cension of the spacecraft, andδ its declination. Ift is in univer-sal time thenφ is the instantaneous right ascension of the meanSun. The radiometric observables transmitted from a space-craft and received by an antenna on Earth are modeled withthis equation or some variant, making it immediately clear thatknowledge of station locations and Earth orientation are criticalin using Doppler (the ratio of received frequency to transmittedfrequency is1− ρ/c), for example, to determine spacecraft co-ordinates.
As an example, the time-of-day component of Earth ori-entation isUT1 ≈ Reωet (in dimensions of length;Re ≈ 6378
km is the Earth equatorial radius). Thus a 10-cm error in UT1corresponds to an error in spacecraft right ascension of about10 cm/6378 km≈ 16 nrad. For a spacecraft approaching Mars,assuming an Earth-to-Mars distance near its minimum of∼80million km, this translates to about 1.3 km. Details on the sen-sitivity of deep-space navigation to EOP errors can be foundinEstefan & Folkner (1995), while the determination of stationlocations of NASA’s deep-space tracking stations is describedin Folkner (1996).
In addition to Doppler measurements, range and interfer-ometric observables are also used for navigation. Range mea-surements are based on the round-trip light time for a code up-linked from a tracking station, transponded by a spacecraft, andreceived back at a tracking station. Normally the same stationis used for the uplink and downlink functions, though this isn’tstrictly necessary given good clock synchronization. Interfer-ometric observables are based on the difference in arrival timefor a spacecraft signal that is received at two separate stations.Observations of natural radio sources are usually includedaspart of an interferometric measurement session in order to cal-ibrate the instrument, and this data type is referred to as Delta-VLBI. While Doppler and range provide line-of-sight determi-nations of spacecraft state, Delta-VLBI determines spacecraftposition and velocity on the plane-of-sky. The different datatypes have differing sensitivities to geodetic parameters, butthey share one thing in common: the precision of the radio linkat the microwave frequencies of the Space Research bands isquite high. Given adequate signal-to-noise ratios, Doppler ob-servables provide precision of 0.01 mm/sec, range precision is10 cm, and VLBI precision is 1 cm. Any unmodeled effects inthe propagation equation at this level or worse will affect inter-pretation of the data. Transition to higher frequencies, drivenby the need for more communications bandwidth, will resultin even better metric observable precision and hence interest inimproved geodetic calibrations.
Spacecraft equations of motion are integrated in a celes-tial reference frame. Today, the celestial reference frameis de-fined by the positions of quasars in the ICRF as described byMa et al. (1998). The origin of right ascension is a certain lin-ear combination of catalog coordinates. The Earth’s equatorand the equinox of the Earth’s orbit are measured quantitiesin this frame. Planetary ephemerides, based largely on radarrange measurements of the planets, and range and interferomet-ric measurements of spacecraft landed or in orbit about planets,are constrained to be consistent with the ICRF. By the same to-ken, accurate geodetic models are needed to interpret measure-ments of planetary positions. Sources from the ICRF catalogare used for Delta-VLBI observations. Enhancements to thecatalog, including densification and refinement of the coordi-nates of individual sources, would directly benefit the Delta-VLBI technique.
Tracking stations have coordinates given in the ITRF.Tracking networks used for deep space applications tend tohave just a few stations at a few widely separated sites. Build-ing a global reference frame to include these stations has

The Global Geodetic Observing System GGOS 2020 124
Table 10. Current and future requirements for radiometric observables, geodetic coordinates and related calibration parameters.The future columns are speculative, and will ultimately depend on specific mission requirements.
Tracking Error Source (1 sigma Ac-curacy)
units current ca-pability
2005 reqt 2010 reqt 2020 reqt 2030 reqt
Doppler/random (60s) mm/s 0.03 0.05 0.03 0.03 0.02Doppler/systematic (60s) mm/s 0.001 0.05 0.003 0.003 0.002Range/random m 0.3 0.8 0.5 0.3 0.1Range/systematic m 1.1 0.6 2 2 1Delta-VLBI nrad 2.5 5 2 1 0.5Troposphere zenith delay cm 0.8 1 0.5 0.5 0.3Ionosphere TECU 5 5 5 3 2Earth orientation (real-time) cm 7 30 5 3 2Earth orientation (after update) cm 5 5 3 2 0.5Station locations (geocentric) cm 3 3 2 2 1Quasar coordinates nrad 1 1 1 1 0.5Mars ephemeris nrad 2 - 3 2 1
greatly benefited from ties and modeling consistency betweenstations employing different techniques including VLBI, GPS,DORIS, SLR, and LLR. With spacecraft data arcs spanningdays to years, and measurement precision at the cm level, it isimportant to model effects including plate motion, solid Earthtide, pole tide, ocean loading, and atmospheric loading.
Space agencies understand the importance of determin-ing the state of the Earth platform and are active contributorsto cooperative efforts to improve the knowledge of referencesframes and the interrelation between the terrestrial and celes-tial reference frames. Data reduction employs transformationsbetween reference frames and models for precession, nutation,and EOP. Rapid delivery of current estimates of the parametersthat are more difficult to predict, especially UT1, is necessaryto support targeting for an encounter.
Calibration of media delays is also important to the inter-pretation of radiometric observations. Data from GPS receiversco-located with tracking antennas, and data from receiversatsurrounding locales, are used to develop calibrations for zenithtroposphere delay and for line-of-sight ionospheric delay. Eventhough GPS data may be very precise, the modeling used totransform GPS measurements to the spacecraft line-of-sight in-troduces errors at the level of precision of the spacecraft track-ing data or worse. The availability of additional satellites andreceivers, with more geometric coverage, could lead to usefulimprovements in media calibrations.
Spacecraftin situmeasurements are required in some sce-narios, such as landing on an asteroid with a poorly knownephemeris, and may be efficient for use in other scenarios, suchas relative navigation between networks of landed and orbit-ing assets at another body. But Earth-based observations arelikely to remain an important input to the navigation processfor at least some phases of most missions. Details of measure-ment techniques may change. Large arrays may be used forspacecraft communications, enabling more powerful interfero-metric techniques. Higher frequencies and eventually optical
links may be used. But in all cases geodesy-related calibrationsare needed for interpretation of Earth-based measurements.
6.3.2 Interplanetary trajectory determination
Many future interplanetary missions will require higher naviga-tional accuracy than that needed by past and current missions.Some future mission scenarios, such as pinpoint landing, willrequire very precise delivery to either an atmospheric interface,or to the surface for bodies without atmosphere. The mainnavigational tracking methods can be split into ground-basedmethods, such as range, Doppler and VLBI, and spacecraft-based methods, such as optical navigation and spacecraft-to-spacecraft tracking. Ground-based tracking methods are used,at least for some part of the missions, by all missions, and mosttimes ground-based and spacecraft-based methods complementeach other more than replace each other. All of the ground-based tracking methods rely on the precise knowledge of theposition of the Earth station in the celestial frame that is usedfor trajectory integration. This requires precise knowledge ofthe position of the station in the terrestrial reference frame, in-cluding tidal effects and plate motion, and precise transforma-tions between the terrestrial and the celestial reference frame,including up-to-date knowledge of polar motion and Earth ro-tation (UT1), as well as accurate models for nutation and pre-cession. Also very important for spacecraft navigation is thedetermination of the ephemeris of the natural bodies that thespacecraft target to, and the determination of the positionofcelestial sources used for VLBI and optical navigation. Theseephemerides and positions are mostly derived from data fromground observatories, and the same kind of precise geodeticdata is needed in order to reduce the observations to estimatethe location of the celestial bodies.

The Global Geodetic Observing System GGOS 2020 125
6.3.3 Current and future requirements of GGOS for in-terplanetary navigation
Indicated in Table 10 are NASA’s current and anticipated deep-space mission requirements for Earth orientation, stationcoor-dinates, and related calibration parameters (Martin-Mur et al.,2006). The EOP components PMx, PMy, UT1 change fromday to day, depending primarily on atmospheric effects. Thetightening requirements shown in the table would likely requirenear-real time VLBI measurements of UT1.
The future columns in Table 10 are speculative, and willdepend on specific mission requirements. Martin-Mur et al.(2006) indicate that there will be an “Increased need for higheraccuracy in guidance, navigation, and control, in order to per-form pinpoint landing, and to take advantage of higher reso-lution instruments.” An example of a demanding future re-quirement could come from a Mars sample return mission ora manned mission to Mars.
To achieve a pinpoint landing, very high accuracy wouldbe needed to deliver a spacecraft to the atmospheric interface.Given this, the requirements on the complexity of the guid-ance system to lower the spacecraft through the atmosphereto the desired landing location could be kept to a minimum.Improvements would be needed in several areas, as indicatedin Table 10, to substantially improve overall navigation per-formance. In addition to improvements in measurement pre-cision and geodetic and Earth orientation models, there wouldalso have to be reductions in errors due to transmission media,improvement in celestial reference frame models, and an im-proved ephemeris for Mars.
The Global Geodetic Observing System GGOS 2020 126
7 Integrated scientific and societal userrequirements and functional specifi-cations for the GGOS
R. Gross, G. Beutler, H.-P. Plag
7.1 Introduction
As discussed in the previous chapters, the terrestrial refer-ence frame is the foundation for virtually all space-based andground-based Earth observations. Through its tie to the ce-lestial reference frame by the time-dependent Earth rotationparameters it is also fundamentally important for interplane-tary spacecraft tracking and navigation. Providing an accu-rate, stable, homogeneous, and maintainable terrestrial refer-ence frame, celestial reference frame, and the Earth rotationparameters linking them together is one of the essential goalsof GGOS.
In recent decades, the geodetic techniques also contributeto the database of Earth observations in particular relatedtomass transport, dynamics, and ionosphere and troposphere pa-rameters. Observations of changes in the Earth’s geometry(solid Earth surface, sea surface, lake surfaces, and ice surfaces)are an important contribution to the Earth observation databaseserving a wide range of applications.
In this chapter, the requirements of the diverse set of sci-entific and societal users concerning the terrestrial and celestialreference frames, the associated Earth rotation parameters, andthe complementary gravity measurements are first summarized.Subsequently, the requirements in terms of a number of quanti-ties observed by geodetic techniques or determined in geodeticanalysis are compiled. The tasks, products, and specificationsof the GGOS that are needed in order to meet the most demand-ing requirements of the users are then presented.
7.2 Summary of user requirements
7.2.1 Societal applications
Most societal applications are concerned with determiningtheposition of some object, whether it be the fixed position of sur-vey markers on the ground, buildings, bridges, dams, and oilplatforms or the mobile position of cell phones, farm equip-ment, automobiles, trucks, trains, airplanes, and ships. Whilemost users may not be aware of it, geodesy and GGOS playa fundamental role in societal applications by providing theinfrastructure, including the underlying terrestrial referenceframe, that enables the position of the object to be determined.The position of the object is determined within some underly-ing reference frame and the accuracy of the position determi-nation will ultimately depend on the accuracy of that frame.Asa general rule-of-thumb, the reference frame should be an or-der of magnitude more accurate than the required accuracy of
the position determination. Moreover, the accuracy of the posi-tion depends on the latency with which the position is required.Positions determined in near-real time will in general be lessaccurate than those determined with longer measuring and pro-cessing time. Thus, the mode in which access to positions inthe reference frame are determined is crucial for the achievableaccuracy.
GNSS is increasingly being used to determine the verti-cal position of objects. Since GNSS determines the height ofthe object above the ellipsoid, an accurate geoid is required inorder to convert the ellipsoidal height to a geopotential-relatedheight above mean sea level (the geoid). For the most part,societal users do not need accurate Earth rotation parametersexcept to the extent that they are needed when determining po-sitions with GNSS. However, for highly accurate positions,therequirements in terms of Earth rotation are rather demanding.
Geodesy and GGOS also provide the infrastructure thatallows different spatial information, such as imagery fromdif-ferent space and airborne platforms, to be georeferenced andaligned with each other. The importance of accurately georef-erencing spatial information is being recognized by many na-tional governments (see Section 4.1).
An important aspect of georeferencing is the use of aglobal reference frame to allow spatial information to be con-verted into a common system that is consistent for all users.Global aviation, marine traffic, and cross-boundary land trafficare examples benefiting from compatible spatial databases.
7.2.2 Earth observations
Recognizing the need for coordinated and comprehensive mon-itoring of the Earth and its interacting systems to support sus-tainable development, the intergovernmental GEO was formedwith the task of implementing a GEOSS (see Section 5.1). Allof the nine SBAs of GEO (see Table 7 on page 97) require anaccurate, stable, and homogeneous terrestrial reference frameas the foundation for the observations, and they rely on geode-tic measurements to provide accurate trajectories of the aircraftand satellite platforms housing their instruments. In addition,the disaster, climate, water, and weather SBAs depend directlyon geodetic measurement techniques to provide some of theirobservations. The requirements in terms of geodetic quantitiesfor the nine SBAs as extracted from GEO (2005b) are given inTable 8 on page 97.
7.2.3 Natural hazards
Mitigating the impact on human life and property of naturalhazards such as earthquakes, volcanic eruptions, debris flows,landslides, land subsidence, sea level change, tsunamis, floods,storm surges, hurricanes and extreme weather is an importantscientific task to which GGOS can make fundamental contri-butions. GNSS and InSAR can be used to monitor the pre-eruptive deformation of volcanoes and the preseismic deforma-tion of earthquake fault zones, aiding in the issuance of vol-canic eruption and earthquake warnings. GNSS can also be
The Global Geodetic Observing System GGOS 2020 127
used to rapidly estimate earthquake fault motion, aiding inthemodeling of tsunami genesis and the issuance of tsunami warn-ings. Gravity measurements can be used to track mass mo-tion within volcanic conduits. Gravity and altimetric measure-ments can be used to track floodwaters in river basins. Altimet-ric and tide gauge measurements can be used to monitor sealevel change. Essential to all such measurements is the under-lying terrestrial reference frame in which the measurements aremade.
In 1990, 23% of the world’s population lived both lessthan 100 km from the coast and less than 100 meters abovesea level. Nearly a fourth of the world’s population is there-fore vulnerable to the effects of a rising sea level combinedwith expected changes in extreme events. Although the long-term average rate of sea level rise is only a few mm/yr, miti-gation efforts need to be planned well in advance in order tobe prepared for rare extreme events. But great demands areplaced on GGOS because the sea level rise signal is so small.For example, the terrestrial reference frame, which shouldbe atleast an order of magnitude more accurate than the amplitudeof the signal being measured, needs to be accurate and stabletowithin about 0.1 mm/yr to support studies of sea level change.This makes sea level change studies one of the most demandingusers of GGOS.
7.2.4 Earth science
The solid Earth is surrounded by a fluid, mobile atmosphereand oceans and upon its land surface lies a continually chang-ing distribution of ice, snow, and ground water. The mantleis both thermally convecting and rebounding from the glacialloading of the last ice age, and the fluid core is undergoing sometype of hydromagnetic motion to generate the Earth’s magneticfield. The changing distribution of mass associated with themi-gration of the surficial fluids and the motion of the mantle andcore changes the Earth’s gravitational field, changes the Earth’srotation by changing its inertia tensor, and changes the Earth’sshape by changing the load on the solid Earth. GGOS mea-surements of the Earth’s changing gravity, rotation, and shapecan therefore be used to study these and other dynamical Earthprocesses. In general, the science requirements translateintothe best possible accuracy for the observations, which willthenfoster the best scientific advance in these studies.
7.2.5 Lunar and planetary science
Estimates of the shape, gravity, and rotation of the planetsandother celestial bodies is obtained by accurately tracking space-craft that are in orbit about or have landed on those bodies.Spacecraft tracking measurements are based upon radio rangeand Doppler measurements taken between the spacecraft andthe Earth-based tracking stations. Errors in the positionsof thetracking stations, including errors in Earth orientation,translatedirectly into errors in the angular position of the spacecraft andhence in the derived estimates of the shape, gravity, and rota-tion of the body. In addition, laser ranging has been used to
track retroreflectors on the lunar surface. The accuracy of thelaser ranges is currently improving from centimeter to millime-ter levels. Making full use of this improving accuracy requiresknowledge at the same millimeter level of the position of thelaser tracking stations on Earth and of the Earth orientation pa-rameters.
The interior structure of the planets and other celestialbodies can be inferred from the estimates of their shape, grav-ity, and rotation that have been determined from spacecrafttracking measurements. For example, the size and mass of theMartian core was first derived from estimates of Martian grav-ity and precession obtained from spacecraft tracking measure-ments. Estimates of the tidal deformation of Mars derived fromdeterminations of Martian gravity suggest that its core is liq-uid rather than solid. The thickness of the Martian crust canbeestimated by comparing the topography of Mars to its gravityfield. The presence of an underground ocean of liquid water onJupiter’s moon Europa could be detected by tidal gravity, de-formation, and libration estimates obtained from trackingmea-surements of a spacecraft orbiting Europa. All such inferencesof the interior structure of the planets and other celestialbodiesrely on the fundamental spacecraft tracking measurements,theaccuracy of which is limited by the errors in the position andorientation of the Earth-based tracking stations.
Tracking and navigating interplanetary spacecraft re-quires accurate terrestrial and celestial reference frames, stationpositions, and Earth orientation parameters. While spacecraftmove in the celestial frame, tracking stations are located in theterrestrial frame. Errors in the positions of the tracking stationsand errors in the Earth orientation parameters used to transformthe coordinates of the tracking stations from the terrestrial tothe celestial frame translate directly into errors in the angularposition of the spacecraft. For example, an error of 10 cm inEarth UT1 translates to a position error on Mars of about 2.6km assuming an Earth-Mars distance of150 · 106 km. Reduc-ing errors in Earth orientation and tracking station position en-ables more accurate tracking and navigation of interplanetaryspacecraft and hence more precise targeting of the spacecraftfor pinpoint landing on bodies like Mars.
National space agencies recognize the importance of ac-curate terrestrial and celestial reference frames, station posi-tions, and Earth orientation parameters and levy requirementson the accuracy of these and related radiometric observables(see Table 10 on page 124). However, the requirements leviedare typically just the accuracy with which the observable canbe measured. If the observable could be measured more ac-curately, then the requirement would be changed to reflect themore accurate measurement. This means that, in effect, track-ing and navigating interplanetary spacecraft requires as accu-rate a determination as can be made of the terrestrial and ce-lestial reference frames, station positions, and Earth orientationparameters. This makes tracking and navigating interplanetaryspacecraft one of the most demanding users of these GGOSproducts.
In summary, it can be stated that planetary geodesy, radio

The Global Geodetic Observing System GGOS 2020 128
Table 11. URs for access to position. Fr. stands for Frame, where we distinguish L: local frames, N: national frames, G: globalframe. Repro. stands for Reproducibility and gives the time window over which positions are expected to be reproducible withthe stated accuracy. Note that navigation has been excluded since it has complex requirements depending on the particularapplication. From Plag (2006a).
Application Parameter Accuracy Latency Fr. Repro.Surveying with precise 3-d coor. 10 to 50 mm days N decadespoint positioning velocity 1 mm/yr n/aMonitoring 3-d coor < 10 mm days L decades
velocity < 10 mm/yr weeks L decadesControl of processes horizontal 10 to 100 mm seconds to
minutesL decades
Construction 3-d < 10 mm seconds tominutes
L months to years
Early warning 3-d 10 mm seconds tominutes
G days
Hazards and risk assessments 3-d < 10 mm days tomonths
G decades
Numerical weather prediction IPWV 1-5 kg/m2 5-30 min-utes
G decades
Climate variations IPWV 1 kg/m2 1-2 months G decadesScientific studies 3-d coor. < 10 mm n/a G decades
velocity < 1 mm/yr n/a G decadesEarth observations 3-d coor. < 10 mm days G decades
velocity < 1 mm/yr n/a G decades
Table 12. Overview of latency and accuracy requirements ofmain user categories.
Requ. Latency time scales accuracy
UR1 real time sec. to min. < 10 cmUR2 hours to days up to diurnal < 5 mmUR3 weeks to monthly to 2-3 mm
months seasonalUR4 > months interannual < 1 mm/yr
to secular
science, interferometry (including imaging VLBI, astrometricVLBI, and Earth-space VLBI), and inter-planetary navigationin order to carry out and interpret their measurements all re-quire accurate terrestrial and celestial reference framesand thatthese frames are linked to each other through accurate Earthrotation observations. The performance of the GGOS is not alimiting factor in all of these applications. However, to meetdemanding future requirements, especially those imposed byinter-planetary navigation, GGOS will have to be enhanced tomeet the requirements identified in Table 10 (on page 124). Inparticular, GGOS needs to allow the real-time determination ofEarth orientation accurate to≤ 2 cm, which will most likely re-quire near-real-time VLBI measurements of UT1. GGOS alsoshould enable calibrations of troposphere delay and ionosphereaccurate to≤ 0.3 cm and≤ 2 TEC units, respectively.
7.3 Quantitative requirements
Quantitative requirements make more sense if they show a clearconnection to the specific application from which they origi-nate. Table 11 summarizes the current and likely future require-ments for access to positions in a terrestrial reference frame formain applications in terms of accuracy, spatial and temporalresolution, reference frame, and reproducability. The accuracyrequirements depend on both the time scales and the latencywith low-latency applications in general considering shortertime scales. Table 12 summarizes the most demanding accu-racy requirements as a function of latency and time scales.
For users requiring real-time positioning, the most ex-treme accuracy requirements are expected to be considerablyless than 10 cm and down to 1 cm (e.g., sensor positioning,hydrographic measurements, automated snow-plowing), andinsome cases even less than 1 cm (e.g., control of large min-ing and construction equipment). Some real-time applicationswill require high integrity (e.g., process control) and high up-date rates. For near-real time positioning and other near-realtime applications with latencies of hours to days, accuracyrequirements will be close to 1 cm in most of these appli-cations (monitoring of infrastructure, meteorological applica-tions) while other applications will require less accuracy(e.g.,of the order of 5 cm) but higher integrity (e.g., land survey-ing). Many applications can accept considerable latency butwill require accuracy at the 1 cm level or better for daily co-ordinates and a few millimeters or better on intraannual timescales. For long-term monitoring tasks, 1 mm/yr or better instability seems to be a critical boundary both for scientificand

The Global Geodetic Observing System GGOS 2020 129
nonscientific tasks. This number also applies to collectionofgeo-databases, which are to be maintained over time scales ofseveral decades.
Presently, GGOS contributes significantly to meeting therequirements UR3 and UR4 (Table 12), although the stabilityrequirement of< 1 mm/yr may not be meet. Based on GGOSproducts alone, the UC1 requirements cannot be met due toproperties of the GPS-alone system combined with the largelatency for required IGS products. For this UC, local and re-gional augmentations are currently required. Some but not allneeds of the UR2 are met by GPS&IGS but the large latencyof the precise IGS products and the insufficient accuracy of therapid IGS products leave a considerable share of this UR inneed of local or regional augmentation systems. While UR1and partly UR2 in Table 12 can be met by local to wide-areaaugmentation systems, UR3 and UR4 depend crucially on thequality of ITRF and the available products. Moreover, achiev-ing UR1 and UR2 through aSignal in Space(SiS, that is thesignal received from the GNSS satellites) only system wouldconsiderably increase the areas of applications and provide sig-nificant economic advantages.
Table 13 gives a more detailed overview of the quantita-tive requirements for typical science applications. For most ofthese applications requiring knowledge of the kinematic oftheEarth’s surface, the accuracy requirement in terms of motion isof the order of 1 mm/yr or less. Similarly, using precise pointpositioning for the determination of coordinates in a nationalreference frame, also requires knowledge of the velocity fieldwith an accuracy of 1 mm/yr in all three components. Moni-toring of infrastructure and hazardous areas have the same re-quirement on the accuracy of the velocity field.
The accuracy requirements for the geoid for the full uti-lization of satellite altimetry are of the order of 1 cm for wave-lengths down to a few tens of kilometers, translating into anac-curacy of10−9 or better (Table 14).In order to monitor the massmovements in the Earth system and particular the global watercycle, accuracy requirements are on the order of< 10 mm ofequivalent water column for spatial wavelengths of< 500 km,which translates into< 0.2 mm in geoid height and< 3 nms−2
for gravity. Temporal resolution is on the order of 1 month or,even better, 10 days.
For practical applications, the requirements for Earth ro-tation are dominated by the effect on positioning and the opera-tion of satellite systems. For precise point positioning, errors inEarth rotation map directly into position errors. For example,an error of 1 mas (milliarcseconds) in polar motion correspondsto errors in horizontal displacements of the Earth’s surface ofabout 30 mm, while an error of 1 ms (millisecond) in time cor-responds at the equator to an error of about 460 mm in dis-placement. These numbers illustrate the high consistency be-tween the terrestrial reference frame and Earth rotation, whichis required to links the satellite frame to the terrestrial frame.For a low-latency access to precise point positions with an ac-curacy of 10 mm, the corresponding instantaneous accuracy forEarth rotation (being a factor of ten better than the position re-
quirement) would be 0.03 mas and 0.002 ms in polar motionand rotation, respectively. Rothacher et al. (2001) reportdis-crepancies between Earth rotation parameters determined withhigh temporal resolution from GPS and those determined fromVLBI and SLR to be orders of magnitude better than these re-quirements. However, at sub-daily temporal resolutions, thepresent low-latency or near-real time accuracy of Earth rotationobservations and predictions is most likely not meeting theserequirements. de Viron et al. (2005) point out that for the deter-mination of gravity field changes with missions like GRACE,diurnal and sub-diurnal effects of the atmosphere on Earth rota-tion are of importance for the orbit determination. Their modelstudy show that atmospheric angular momentum variations atdiurnal timescale can produce polar motion near 0.2 mas. Ontime scales of several days, atmospheric effects can reach sev-eral milliarcseconds (Lambert et al., 2006), corresponding to10 cm or more in displacement.
Other requirements on Earth rotation result mainly fromscientific applications, and for these applications, an increas-ing accuracy of the observations normally leads to new appli-cations. Examples are questions related to the effect of earth-quakes (e.g., Chao & Gross, 2005), volcanic eruptions, and sea-sonal mass motion on the Earth’s surface (e.g., Chen & Wilson,2003; Gross et al., 2004) on Earth rotation, where the currentaccuracy of the observations as well as the sophistication ofmodels (see Salstein et al., 2001) are limiting the scientific un-derstanding of the processes on a rotating Earth. Likewise,thecurrent accuracy is at the margin of what is required to achieveimprovements in understanding and modeling of Earth rotationchanges induced by interactions of the solid Earth with its fluidenvelop (e.g., Plag et al., 2005). For studies of the interactionbetween fluid core and solid mantle, the length of the space-geodetic Earth rotation record with high accuracy appears tobe the main limitation. Secular rates are compromised by thelower accuracy and potential instabilities of the older parts ofthe record, which limits its application to studies of, for ex-ample, postglacial rebound effects on Earth rotation (see,e.g.,Mitrovica & Milne, 1998).
As illustrated in Section 2.9, geodetic observations in-creasingly are used in non-geodetic applications such as nu-merical weather predictions, climate studies, and space weathermonitoring. Table 15 summarizes the requirements in terms ofgeodetic infrastructure and parameters for numerical weatherprediction and climate applications. For numerical weather pre-diction, the low latency combined with high accuracy in sta-tion coordinates constitute demanding requirements. For cli-mate studies, the requirement for long-term stability appears toexceed the present capabilities.
7.4 Tasks of GGOS
The tasks of GGOS are to encourage, facilitate and promote thefollowing activities, based mainly on the combined work of theIAG Services:
• define a unique celestial reference system;

The Global Geodetic Observing System GGOS 2020 130
Table 13. User requirements for scientific applications. S.R. stands for spatial resolution, T.R. for Temporal resolution, Fr.stands for Frame, where we distinguish L: local frames, N: national frames, G: global frame. R. stands for Reproducibility andgives the time window over which the parameters are expected to be reproducible with the stated accuracy. 1 µGal is equal to10−8 ms−2. From Plag (2006a)
Application Parameter Accuracy S.R. T.R. Fr. R.Mantle convec- 3-D velocities < 1 mm/yr n/a n/a G several decadestion and plate static geoid < 10
−9 n/a n/a G and longertectonics secular strain rate 10
−19 s−110
3 km n/a GPostglacial 3-D velocities < 1 mm/yr 10
2 km n/a G several decadesrebound geoid < 10
−9 n/a n/a G and longerstrain rates 10
−15 s−110
2 km n/a GEarth rotation 0.1 mas/yr n/a n/a Glocal sea level < 1 mm/yr 2 to10 · 10
2 km n/a GClimate change, 3-D displacements 1 mm 10
2 km months G decadesincluding present 3-D velocities < 1 mm/yr < 10
2 km n/a G decadeschanges in ice local gravity < 0.3 µGal < 10
2 km n/a L decadessheets and sea geoid < 10 mm 200 km n/a G decadeslevel Earth rotation 0.1 mas/yr
local sea level < 1 mm/yr 102 km months n/a decades
Ocean circulation gravity field < 10−9
102 km months G decades
Hydrological gravity field < 10−9
102 km months G decades
cycle 3-D displacements < 1 mm 102 km months G decades
Seasonal gravity field < 10−9
102 km months G decades
variations local gravity < 1 µGal n/a months L decades3-D displacements < 1 mm 10
2 km months G decadesEarth rotation 1 mas
Atmospheric Earth rotation 1 mas days decadescirculationEarth tides gravity 0.01µGal 10
3 km hours G years3-D displacements 1 mm 10
3 km hours G yearsstrain rates 10
−15 s−1 1 to103 km < 1 day G years
Surface loading 3-D displacements < 1 mm < 102 km < 1 day G years
local gravity 0.1µGal << 102 km < 1 day G years
Seismotectonics 3-D displacements 1 mm < 102 km days G hours to years
strain rates 10−19 s−1 < 10 km years to secular L decades
Volcanoes 3-D displacements 1 mm 1 to102 km < 1 day L years
gravity 1µgal 1 to102 km days L years
Earthquakes, 3-D displacements 1 mm to 1 cm<< 102 km sec to days L weeks to decades
tsunamis strain 10−8
≈ 10 km offsets L n.a.strain rates 10
−15 s ≈ 10 km < 1 yr L yearslocal gravity 0.3µGal << 10
2 km sec to days L weeks to decadesEarth rotation
• define a unique terrestrial reference system, includinggeodetic datum;
• define a unique geodetic reference system;
• define a unique gravity reference system;
• define all the physical and mathematical models needed toanalyze GGOS observations;
• provide and maintain an accurate, stable, and homoge-neous celestial reference frame;
• provide and maintain an accurate, stable, and homoge-neous terrestrial reference frame including its origin;
• provide and maintain the time-dependent Earth orientationparameters that are used to transform coordinates betweenthe terrestrial and celestial reference frames;
• provide and maintain definitions, constants, models, etc.of the geodetic reference systems;
• provide and maintain parameters describing the static andtime-dependent components of the Earth’s gravity field;
• provide and maintain parameters describing the static andtime-dependent components of the shape of the land, ice,and ocean surfaces;
• provide and maintain parameters describing the total elec-tron content of the ionosphere;
• provide and maintain parameters describing the water va-por content of the troposphere;
• provide and maintain parameters describing the transportof mass within and between the atmosphere, oceans, andland.

The Global Geodetic Observing System GGOS 2020 131
Table 14. Measurement requirements in terms of geoid height and gravity anomaly accuracy. Taken from Drinkwater et al.(2003). Note that the requirements for both scientific and nonscientific applications are given. 1 mGal is equal to 10−5 ms−2.
Application Accuracy Spatial ResolutionGeoid Gravity half wavelength
(cm) (mGal) (km)Oceanography:Short scale 1-2 100 km
0.2 200 kmBasin scale ∼0.1 1000 kmSolid Earth:Lithosphere and upper mantle density structure 1-2 100 kmContinental lithosphere– Sedimentary basins 1-2 50-100 km– Rifts 1-2 20-100 km– Tectonic motions 1-2 100-500 km– Seismic hazards 1.0 100 kmOcean lithosphere and interactions with as-thenosphere
0.5 - 1.0 100-200 km
Geodesy:Leveling by GPS 1.0 100-1000 kmUnification of worldwide height systems 1.0 100-20000 kmInertial navigation system ∼1-5 100-1000 kmOrbits (1 cm radial orbit error for altimetricsatellites)
∼1-3 100-1000 km
Ice sheets:Rock basement 1-5 50-100 kmIce vertical movements 2.0 100-1000 kmSea-level change: Many of the above applications, with their specific require-
ments, are relevant to sea-level studies
7.5 Products available through GGOS
As a result of the above tasks, the principal products that are de-termined and provided by the IAG Services and made availablethrough GGOS include:
• a catalog of celestial radio sources including their coordi-nates that provides the celestial reference frame;
• a catalog of terrestrial sites defining the reference poly-hedron associated with the terrestrial reference frame, in-cluding their reference coordinates at a common epochand time series describing the temporal evolution of thecoordinates;
• time series of coordinates of additional terrestrial sitesorpoints that are needed to densify the terrestrial referenceframe in order to provide access to the frame anywhere onthe Earth’s surface;
• a model predicting the motion of the Earth’s surfacecaused by loading effects of atmospheric surface pressure,ocean-bottom pressure, and continental water storage in-cluding snow and ice;
• precise orbits and clocks for GNSS satellites that allowaccess to the terrestrial reference frame;
• time series of Earth rotation parameters (UT1, polar mo-tion, nutation/precession) including their time rates-of-change that provides the link between the celestial andterrestrial reference frames;
• values of the defining constants and derived physical andgeometrical parameters of the geodetic reference system;
• values of parameters describing the static component ofthe Earth’s gravity field;
• time series of parameters describing the time-dependentcomponent of the Earth’s gravity field;
• time-dependent maps of the total electron content of theionosphere;
• time series of zenith path delays that provides the watervapor content of the troposphere;
• time series of angular momenta of the atmosphere, oceans,continental water storage including ice and snow, man-tle, and core that provide estimates of the mass transportwithin the Earth system;
• time series of sea surface height and sea level measure-ments that provide estimates of the changing shape of theocean surface;

The Global Geodetic Observing System GGOS 2020 132
Table 15. Requirements for meteorological applications of GPS. Accuracy requirements are for IPWV in kg/m2 or path delay inmm. Values are from Elgered et al. (2005).
NowcastingRequirement Generic GPS Meteorology networkHorizontal domain Sub-regional Europe to nationalHorizontal sampling 5-50 km 10-100 kmRepetition cycle 0.25 - 1 h 5 min - 1 hAbsolute accuracy 1-5 kg/m2 1-5 kg/m2
Timeliness 0.25-0.5 h 5 - 30 min
Numerical Weather PredictionRequirement Generic GPS Meteorology networkHorizontal domain Global Regional Global RegionalHorizontal sampling 50-500 km 10-250 km 50-300 km 30-100 kmRepetition cycle 1-12 h 0.5-12 h 0.5-2.0 h 0.25-1.0 hIntegration time MIN(0.5 h, rep. cycle) MIN(0.25 h, rep. cycle)Absolute accuracy 1-5 kg/m2 1-5 kg/m2 3-10 mm 3-10 mmTimeliness 1-4 h 0.5-2 h 1-2 h 0.5-1.5 h
Climate MonitoringRequirement Generic GPS Meteorology networkHorizontal domain regional-global AllHorizontal sampling 10-100 km 10-250 km; indiv. stat.Time domain >> 10 years Weeks to many yearsRepetition cycle 1 h 1 hAbsolute accuracy 0.25-2.5 kg/m2 1 kg/m2
Long-term stability 0.02-0.06 kg/m2/decade 0.04-0.06 kg/m2/decadeTimeliness 3-12 h 1-2 months
• time series of ice sheet and glacier elevations that provideestimates of the changing shape of the ice surface;
• similar time-dependent, body-fixed site coordinates, ori-entation parameters, and gravity parameters for otherplanets and celestial bodies in the solar system such asthe Moon and Mars.
7.6 Accuracy of GGOS products
The GGOS products listed in the previous section, which areproduced by the IAG Services, must have sufficient accuracy,temporal and spatial resolution, and latency to meet the require-ments of all users. This can be done if the requirements of themost demanding users are met. The most demanding user ofthe terrestrial reference frame is likely to be scientific studiesof sea level change caused by climate change. Since global sealevel is rising at a rate of a few millimeters per year, and sincethe frame in which the rise is being measured should be at leaston order of magnitude more accurate than this, the terrestrialreference frame should be accurate at a level of 1 mm and bestable at a level of 0.1 mm/yr.
The most demanding users of the geoid are likely to be:(1) the use of the geoid in oceanic general circulation modelsto define the mean sea surface topography, and (2) the GNSSdetermination of the height of objects at the millimeter level.
These applications require the static geoid to be accurate at alevel of 1 mm and to be stable at a level of 0.1 mm/yr, consistentwith the accuracy and stability of the terrestrial reference frame.
The most demanding user of the Earth orientation param-eters is likely to be the tracking and navigation of interplane-tary spacecraft. This user is capability-driven and requires themost accurate EOPs that can be determined, realizing that thosedetermined in near real-time are somewhat less accurate thanthose determined with a delay of a couple of weeks. This useralso requires that the EOPs be consistent with the celestialandterrestrial reference frames. So if the terrestrial reference frameis accurate at a level of 1 mm, consistency demands that theEOPs also be accurate at the same level of 1 mm.
Specifically, the accuracies of the GGOS products re-quired by the most demanding users are:
• celestial reference frame: accurate to 25µas, stable to 3µas/yr;
• terrestrial reference frame: accurate to 1 mm, stable to0.1 mm/yr, including geocenter; scale accurate to 0.1 ppb,stable to 0.01 ppb/yr;
• Earth orientation parameters: accurate to 1 mm with a la-tency of 2 weeks, 3 mm in near real-time, with daily reso-lution;
• static geoid: accurate to 1 mm, stable to 0.1 mm/yr, with a

The Global Geodetic Observing System GGOS 2020 133
spatial resolution of 10 km;
• time varying geoid: accurate to 1 mm, stable to 0.1 mm/yr,with a spatial resolution of 50 km and a time resolution of10 days.
7.7 Functional specification for GGOS
The second part of this chapter focuses on the functional spec-ifications of the geodetic observing system in 2020. The goalhere is to have a clear picture of what GGOS should be able todeliver in 2020, based on the known or expected user require-ments as summarized above. For the functional specifications,the most demanding of these user requirements have been con-sidered as described in the previous sections.
7.7.1 Determination, maintenance, and access to theglobal terrestrial reference frame
The following functional specifications define the inherentac-curacy of the ITRF at the time of determination, as well as laterepochs. Currently, reference coordinates can only be predictedfor the reference points of the ITRF, and the underlying modelfor the prediction of the reference frame coordinates is a lin-ear model. In the future, a requirement on the terrestrial refer-ence frame is that reference positions can be predicted for anypoint on the Earth surface. Therefore, the basis for access to thereference frame is a dynamic Earth reference model, which as-similates observations of variations in Earth’s geometry,gravityfield, and rotation. Through data assimilation, the model willbe forced to closely reproduce the observed changes in the ref-erence polyhedron (the present-day ITRF) as well as observedvariations in the gravity field and rotation in a self-consistentway.
ITRF-001-DER: Provision of the reference framethrough a dynamic Earth reference model —The terrestrial ref-erence frame will be provided by an operational dynamical Earthreference model which will assimilate observations of variationsin the Earth’s geometry (in particular, for a reference polyhe-dron), the shape of the ice and ocean surfaces, the gravity field,and Earth rotation. Moreover, the reference model will also as-similate auxiliary observations, in particular meteorological ob-servations. This dynamic Earth reference model will allow theprediction of reference trajectories for any point on Earth withtemporal resolution of 1 hour and a sub-kilometer spatial reso-lution. The stability of the model in terms of geokinematic will bethat of the reference polyhedron, i.e., sub-millimeter per year.
ITRF-002-ORI: Tie between RFO and CM —The devi-ation between the reference frame origin of the terrestrial refer-ence frame and the center of mass of the Earth system will besmaller than 1 mm at any time.
The specification ITRF-002-ORI implicitly limits the sec-ular trend between RFO and CM to 0.1 mm/yr over 10 years
and even less if we look at longer time intervals. With thisspecification, GGOS meets the most important requirement forglobal sea level studies.
ITRF-003-PRE: Precision of reference coordinates —The precision of coordinates of the points of the reference poly-hedron of the ITRF will be better than 1 mm in the horizontaland 3 mm in the vertical component at any time.
Since the terrestrial reference frame will not utilize a ref-erence polyhedron based on positions and secular velocities, itdoes not make sense to specify the accuracy of velocities ora secular stability. However, ITRF-003-PRE implicitly deter-mines also the accuracy of any secular motion.
ITRF-004-SCA: Scale of the reference frame —Thescale of the reference frame will be accurate to 0.1 ppb andstable to 0.01 ppb/yr.
ITRF-005-ACC: Access to the ITRF —Standard ac-cess to the ITRF will be through precise orbits and clocks ofthe GNSS satellites and Earth rotation parameters. Low la-tency (down to real-time) orbits and clocks will have an accuracyequivalent to a range error of less than 5 cm for an availabilityof 99.999%. Post-processed orbits and clocks will allow the de-termination of single daily point coordinates with an accuracy of1 cm in the horizontal and 2 cm in the vertical anywhere on theEarth surface with high availability (99.999%) and high integrity.
The specification ITRF-005-ACC is the basis for accu-rate precise point positioning facilitating many of the applica-tions discussed in the previous chapters. For point motion ob-served with stationary, continuously observing GNSS sites, theobserved trajectory can be compared to the trajectory predictedfor that point with the dynamic Earth reference model in orderto determine anomalous motion as specified in ITRF-001-DER.At the same time, this specification implicitly provides theba-sis for monitoring surface kinematics.
7.7.2 Earth rotation
ERP-001-EOP: Earth Orientation Parameter —EarthOrientation Parameters will be determined with an accuracy of1 mm, a temporal resolution of 1 hour, and a latency of 1 week;near real-time determinations of the Earth Orientation Parame-ters will be determined with an accuracy of 3 mm.
7.7.3 Earth’s gravity field
GRAV-001-GEOID: Accuracy of the static geoid —Thestatic geoid will be provided with an accuracy of 1 mm, a long-term stability of 0.1 mm/yr and a spatial resolution of 10 km.
GRAV-002-VAR: Accuracy of the time variable gravityfield —The time variable geoid will be provided with an accu-
The Global Geodetic Observing System GGOS 2020 134
racy of 1 mm, a long-term stability of 0.1 mm/yr, a spatial reso-lution of 50 km, a temporal resolution of 10 days, and a latencyof 0.5 months.
7.7.4 Earth system monitoring: Mass transport and massredistribution
ESM-001-SSH:Sea surface height variations —The seasurface height variations will be determined globally with an in-stantaneous local accuracy of 10 mm, a temporal resolution of10 days, a spatial resolution of 10 km, a latency of 5 days, anda local secular accuracy of 0.5 mm/yr.
ESM-001-GSL:Global sea surface changes —The glob-ally average sea surface height changes will be determined withan instantaneous accuracy of 1 mm, a temporal resolution of 10days, a latency of 10 days, and a secular accuracy of 0.1 mm/yr.
ESM-002-CRY: Cryosphere mass balance —The vari-ations in the surface elevation for the large ice sheets will bedetermined with an instantaneous local accuracy of 20 mm, atemporal resolution of 10 days, a spatial resolution of 10 km, alatency of 20 days, and a local secular accuracy of 0.2 mm/yr.
ESM-003-WCY: Mass transport in the global water cy-cle —The mass transport in atmosphere, ocean, cryosphere,and terrestrial hydrosphere will be determined to an accuracy ofan equivalent of 10 mm water cover with a temporal resolutionof 10 days, a spatial resolution of 400 km, and a latency of 0.5months.
7.7.5 Determination, maintenance, and access to the celes-tial reference frame
ICRF-001-DET: Determination of the Celestial Refer-ence Frame —The ICRF will be defined by the coordinates ofa number of extragalactic radio sources distributed throughoutthe sky. The coordinates of the ICRF sources will be accurateto 25 microarcseconds and stable to 3 microarcseconds/yr..
7.8 Operational specifications for GGOS
GGOS must ensure performance of certain operations in or-der to generate products of sufficient accuracy to meet the re-quirements of the users, as expressed in the functional specifi-cation given in the previous section. The high level activitiesthat GGOS together with the IAG Services must ensure are to:
• operate global networks of geodetic reference stations,gravimeters, and tide gauges;
• operate a global sub-network of core reference stations atwhich the techniques are co-located;
• determine the survey ties between the co-located tech-niques;
• process all observations with an accuracy and consistencyof at least 1 ppb;
• operate a dynamic Earth reference model assimilatingcomprehensive observations of variations in Earth’s geom-etry, gravity field and rotation;
• document the procedures, standards, and conventions usedto generate the products;
• maintain databases of observations and products;
• ensure continuity, accuracy, and consistency of observa-tions and products as the networks and data reduction pro-cedures evolve.

The Global Geodetic Observing System GGOS 2020 135
8 The future geodetic reference frame
T. A. Herring, Z. Altamimi, H.-P. Plag, P. Poli, J. Ray
8.1 Introduction
The ingredients for future geodetic reference frames can besep-arated into at least two categories, namely (1) theoretical, con-ventional, and definitional aspects, and (2) practical implemen-tation aspects and physical components. In this Chapter, wefocus on category (1).
The present theoretical basis for the current ITRF is fairlysimple at the moment (see, for example, McCarthy & Petit,2004), which is appropriate as long as most of the infrastructurefor the determination of the ITRF is ground-based. As morecomponents of its realization and maintenance move off theEarth’s surface into near-Earth space (and maybe beyond) andas accuracy “requirements” become more strict it is likely thatcloser attention will be paid to relativistic aspects. While theIAU has elaborated its recommended metric, some work withrespect to ITRF determination and maintenance currently stilluses Newtonian reductions with some general relativity “cor-rections” applied. This may no longer be an adequate approachin 2020. But also the Newtonian part of the theory is not fullyat the targeted accuracy level. In particular, the theory ofEarthrotation is especially weak with respect to increased accuracies.Moreover, motions of theReference Frame Origin(RFO) withrespect to the CM are not explicitly accounted for, and higherdegrees of surface deformation are neglected. Any couplingofthe angular and linear momentum balance is not considered.
As pointed out in Section 2.7, it is conceivable that by2020 the international timescale will be maintained using ultra-stable frequency standards in orbit. Earth-based clocks, whichare subject to large environmental “noise”, might only be usedas local standards slaved to the orbital clock system. However,it is mentioned here that synchronization poses a severe prob-lem which is not solved so far.
Below, we do not consider relativistic effects. However,the concept and theory described below strives to provide afully self-consistent system, which can then be the basis fora conventional system and frame. Currently, this is not the casein a strict sense and most like also not at a perceptible level.There seems to be a degree of arbitrariness in assigning somecomponents or features to one feature or another (like the par-tition between nutation and polar motion). In general, if thedecision is truly arbitrary, then the critical issue is to beclearand unambiguous in the definitions and conventions.
The current concept of the terrestrial reference frame isthat of a polyhedron with secular motion of the individualpoints. This assumption is a severe limitation as it imposesa global filter of all geophysical signals and hampers the com-parison of models and observations. The central question ad-dressed here is how the non-secular deformation should be in-cluded in the mathematical models that define the future refer-
ence system. In principle, there are two alternatives to achievethis:
• (A) Maintain the secular frame similar to the current ITRFand associate to it with a deformation model that allow thecomputation of non-secular motion at any location; or
• (B) consider forming a complete model that describes boththe secular and non-secular parts.
Here, we consider alternative (B).This alternative poses considerable challenges for the im-
plementations.
8.2 Concept of reference system and referenceframe
A geodetic reference system is a set of definitions and mathe-matical models that allow geodetic measurements to be to berelated to each other in a systematic fashion. Two basic classesof geometric systems are required in modern geodesy: one re-lated to a non-rotating inertial reference frame; and the otherattached in a prescribed fashion to the rotating Earth (see Sec-tion 2.2). In addition, a reference system for potential basedmeasurements is also required. Often this latter system is re-lated to the geometric reference frame through the height ofan equipotential surface above or below a geometric referencesurface defined through the geometric reference system. Forgeometric measurements, such as ranges and angles, the ref-erence system is most commonly based on a set of Cartesianaxes. Part of the reference system definition specifies how theorigin and the direction of the axes in this reference systemare specified, but equally important are the mathematical mod-els that relate measurements to coordinates in the realizationof reference frame. On a deformable Earth all reference sys-tem definitions are complicated by the need to account for thedeformation.
The evolution of reference system definitions has pro-gressed with the accuracy of geodetic methods with refine-ments in the system definitions often leading to improved ac-curacy of geodetic methods. Conceptually a reference systemwith its origin (denoted here as RFO) at the CM, itsZ-axisalong a mean direction of the rotation axis during a specifiedinterval of time and itsX-axis passing through a specific loca-tion would appear to be useful when positional measurements(to define axes directions) and gravitational measurementsareavailable to define the CM and to contribute to the axes direc-tions through the inferred moments of inertia. However, in anera of millimeter level position determinations and gravity mea-surements accurate to 1 ppb of the main field, this type of def-inition poses problems primarily because at these levels massmotions in the system are easily detected. In modern definitionsof the reference system and its realization, which is the refer-ence frame, non-secular motions of the surface of the Earth andmass re-distributions must be explicitly accounted for. The ad-vances in computing power also allow the parameters of ref-erence frame to simultaneously estimated from potentiallya

The Global Geodetic Observing System GGOS 2020 136
wide variety of data types. The ability to simultaneously andrigorously realize an Earth reference frame is one of the majorbenefits of the Global Geodetic Observing System.
In this context, we introduce two CartesianXY Z coordi-nate systems. Precisely how one of these systems is attachedtothe Earth and how the other will define a non-rotating inertialreference frame will be defined later. For the Earth attachedsystem, we can give the time-dependent coordinates of everymass element in the Earth. A geodetic measurement site is sim-ply one of the mass elements at the surface of the Earth. Themass elements undergo a variety of motions: Tidal displace-ments due to both solid Earth tides and ocean loading, loadingsignals from atmospheric and hydrology mass movements, tec-tonic motions, and other secular motions from internal massmovements. Certain sites will also under go seismic displace-ments in the forms of coseismic and postseismic displacements,or be affected by anthropogenic subsidence.
In the terrestrial system, the external potential will begiven by
V (xp, yp, zp, t) = G
∫SolidEarth
ρs(x, y, z, t)
dspdV + (2)
G
∫FluidCore
ρc(x, y, z, t)
dcpdV +
G
∫FluidEarth
ρc(x, y, z, t)
dfpdV
whereV is the gravitational potential at positionxp, yp, zp,ρs, ρc andρf are the density of the solid earth, fluid core, andfluid earth (ocean and atmosphere),dsp, dcp, anddfp are thedistances from the integration points toxp, yp, zp, andG isthe gravitational constant. The reference system will determinehow the densities change with time. In each of the regions ofthe Earth, the motion of the mass points is different. In thesolid Earth, except at times of earthquakes, much of the motionis secular (although although at seasonal and interannual timescales, significant motion takes place). In the mantle, typicallymotion rates are similar to plate tectonic rates of 10 cm/yr.Inthe fluid core, the motions are much more uncertain but couldbe as high as km/yr and vary on decadal time scales (as evi-denced by changes in the magnetic field and decadal changesin length of day). The motions in the fluid Earth are much morerapid and have large spatial and temporal variations. When thepotential is sensed from space, the fluid Earth component canbe treated as a surface density layer.
A consequence of the moving fluids in this system isthat the loading displaces masses and consequentially the solidEarth mass motions have a contribution from the loading phe-nomena. If the changes in the mass loading are known, thenthis effect in the solid Earth integration can be accounted forand the temporal variations in density can be treated as secularmotions.
In defining a reference system that fully exploits the accu-racy of today’s measurements care must be taken. The motionsof the system need to be accounted for in a consistent fashionso that results in the reference frame can be related at different
times. The geodetic signals that reveal new things about theEarth are those that show significant deviations from the mo-tions predicted in the reference system. The system definitionmust treat consistently the deformations in the system and herein lies the current limitations in current reference systemdefi-nition and realization. Ideally all sources of mass motion anddeformation would be known (in which geodetic measurementsprobably would not be needed) but this currently is not the case.Some components of mass motion are reasonably known suchas the solid Earth tides while others such as hydrographicalloading are not well known. In a coherently constructed ref-erence system for GGOS, addressing the inconsistencies in thecurrent models should be possible.
The largest gains in non-secular deformation modelingare likely to be in the area of modeling hydrological variationsbut there could be some potential problems. Missions that mea-sure time variable gravity such as GRACE yield estimates ofmass movements, which are treated as thin-shell surface den-sity layers on the surface of the Earth. With current grav-ity missions, temporal and spatial resolution of hydrographicalmass estimates is limited, but increased spatial and temporalresolution is expected for future missions . These mass es-timates could be used to compute elastic deformations of theEarth surface provided that the mass loads the surface and isnot supported by dynamical effects in the atmosphere. Atmo-spheric dynamics typically considers two definitions for surfacepressure, namely (1) the dynamic surface pressure (denotedasPs) that is the physical quantity measured by a barometer, and(2) the hydrostatic surface pressure (denoted byπs) that wouldbe measured by an instrument only sensitive to the downwardforce induced solely by the weight of the column of air withoutits acceleration (if any). The first quantity is in fact the one col-lected byin situ barometers, and assimilated into atmosphericweather models, while the second quantity is the one predictedby global weather models, which assume that vertical acceler-ation is zero at their spatial and temporal scales (hydrostaticassumption). A general assumption is that the vertical atmo-spheric acceleration is negligible if averaged over synoptic orlarger scales (i.e., a few hours and a few tens of km in the hor-izontal). However, at smaller smaller scales (for example,< 1hour, < 1 km), (1) there may be some sources and sinks tothe atmospheric mass load (sources: volcanoes, evaporation;sinks: e.g., rain, pouring down at a rate that can make the localair column with an approximate mass of 104 kg per square me-ter lose up to 30 kg of water over the same area in an hour ofvery strong rainfall events), and (2) there may be some localac-celeration upward or downward (strong updrafts or downdraftsassociated with moist processes, and sustained downhill (so-called “katabatic”) winds (e.g. over Antarctica and Greenland)which would induce vertical accelerations at the beginningandend of the slopes on which these winds run. But these two ef-fects are usually considered to start to become significant onlyat the small scales indicated above. Thus, for atmospheric con-tribution to the mass and loading, the surface pressure outputof current (hydrostatic) global weather models appears to be

The Global Geodetic Observing System GGOS 2020 137
sufficient.As pointed out by Blewitt (2003), the appropriate Love
numbers need to be used when the loading signals are com-puted to ensure the origin of the reference frame for the loadisknown. The most common choices here areCenter of Figureof the solid Earth(CF), theCenter of Mass of the Solid Earth(CE), or the CM of the whole Earth system (Blewitt, 2003). IfCF is used, the gravity field associated with the loading willhave degree-1 terms. If CM or CE are used, then the transfor-mation to CF position estimates will need translations added.
In a dynamic reference system realization, the expectedmotions of all geodetic sites are computed. For those sites thatform the reference frame, these time dependent motions shouldbe well known. Such sites might be those away from coastalarea and that have small or well computed hydrographical sig-nals. The well monitored frame realization sites, the rotationand translation that align the coordinates to the referenceframevalues would be used to realize the reference system. Unlikecurrent reference frames, such as ITRF2005, these new ref-erence frames need to be continuously maintained with non-secular motions being measured and computed. For the refer-ence frame to be useful to all users, the non-secular motionsneed to be computed at all geographic locations (gridded at theappropriate resolution), or a service is needed that evaluates thedeformation at given location and time specified by users. Thescientifically interesting product from a reference systemreal-ization is displacement, which is the difference between mea-sured coordinates and those determined from the reference sys-tem.
8.3 Future reference frame formulations
Current global reference frames basically consist of a set ofpoint coordinates at a reference epochtR and constant veloc-ity vectors for each point. This set of coordinates describesthe secular evolution of a polyhedron over time, and the pointsimplicitly determine the axes, the RFO, and the scale of theunderlying reference system. In addition to the secular poly-hedron, the frame also includes a set of models that describedeviations of the actual motion of the Earth surface from thesecular polyhedron.
The mathematical model for the description of point po-sition ~X of the secular polyhedron as function of timet is thatof regularized coordinates
~X(i)(t) = ~X(i)0 + ~V
(i)0 · (t − t0) (3)
(McCarthy & Petit, 2004). In order to be able to assign pre-dicted reference coordinates to any point on the Earth surface,knowledge of the global velocity field~V0 = f( ~X) would berequired. This is currently not available. Therefore, precisesatellite orbits and clocks are used to make a reference posi-tions relative to the vertices of the polyhedron available at anypoint and anytime.
The simple mathematical model of regularized coordi-nates has two major problem, one being the fact that the motion
of the mass elements is not linear in general. The second prob-lem is that the velocity vectors have errors, which over timecan deform the polyhedron considerably. Therefore, frequentadjustments of the coordinates and velocities of the vertices ofthe reference polyhedron are necessary, leading to significanttemporal inhomogeneities (if complete recomputations of pastreference frame-related quantities are not performed). How-ever, if initial analysis of the geodetic data is preformed withminimal constraints applied to the system, reference frames canbe updated from covariance matrix and solutions or from nor-mal equations very rapidly.
Having more elaborated models for the prediction of theEarth’s surface motion available, the secular model can be re-placed by
~X(t) = ~X0 + δ ~X(t) (4)
whereδ ~X(t) is predicted by a reference Earth model. In prin-ciple, this reference Earth model predicts the global displace-ment fieldδ ~X(t) for any point on the Earth surface and forany timet. This also implies that the station motion modelused in space-geodetic analyses to describe the point motion asfunction of time could fully be based on the predictions of thereference Earth model. Conventionally, only those parts ofthepoint motion changing significantly over the analysis intervalare accounted for.
Over the next few years, the displacement field in practicewill be a composite of different contributions, that is,
δ ~X(t) = ~V0 · (t − t0) +
K∑k=1
gk(t, ~X), (5)
wheregk; k = 1, K are the displacement fields determinedfrom geophysical models of Earth tides, surface loading, earth-quake processes, and other surface displacements.
Considering the current and expected accuracy the ref-erence Earth model will have to be based to some degree onassimilation of observations. Alternatively, a completely em-pirical approach would be based on the observed polyhedron,which would preserve the internal consistency of the observa-tion technique and represent the time-dependent coordinates ofthe polyhedron points as
~X(i)(t) = ~O(i)(t), (6)
where~O are observed time series. This references frame wouldbe aligned to the secular model described by (3) on averagewith no internal deformation of the observed polyhedron. Thisapproach would required means for the interpolation of~O(i).For that, again the orbits and clocks of the GNSS could be uti-lized. However, this approach would benefit strongly from im-prove station motion model (i.e., predictions of the~O(i)) for theanalysis.
8.4 Origin and orientation of the TRS
The origin of the future reference frame will remain to be de-fined as the CM, which is the only point in the Earth system

The Global Geodetic Observing System GGOS 2020 138
that physically is special. Concerning the orientation of theaxes, one could consider to have these axes aligned to the prin-cipal moments of inertia. As a consequence, polar drift wouldbe zero in such a system.
8.5 Scientific challenge of the future referenceframe: the need for an Earth system model
As stated above, motion of points at the Earth’s surface re-sults from internal and external forcings, which do not onlyaffect the shape of the Earth but also the gravity field and therotation of the Earth. The internal forcing is mainly associ-ated with geodynamic and tectonic processes, and integratedmodels that would predict surface motion at a wide range ofspatial and temporal scales are not yet available. Locally andregionally, pre-, co- and postseismic deformations can be mod-eled to a certain extent (e.g., Okada, 1992; Pollitz, 1996, 1997;Kreemer et al., 2006b; Sun et al., 2006) with the accuracy ofthe predictions depending on the local and regional processesand tectonic setting. Models for the effect of earthquakes onthe gravity field and Earth rotation have also been developed(e.g., Chao & Gross, 1987; Sun & Okubo, 1998; Chao & Gross,2005). However, secular plate motion models that agree wellwith the observed present-day secular plate motion are gener-ally empirical models (e.g., DeMets et al., 1994; Bird, 2003;Kreemer et al., 2003; Sella et al., 2002), and some of thesemodels use the secular motion determined from space-geodeticobservations as constraints.
The external forcing can be separate into body and sur-face forcing with the former acting as a volume force on thewhole solid Earth and the latter acting as a surface force onthe surface of the solid Earth. While the effects of the bodyforces on the solid Earth, that is, the tidal forcing due to thetidal potential, on the shape, rotation and gravity field of theEarth is well understood and model predictions are at an ac-curacy level comparable to the accuracy of observations (e.g.,McCarthy & Petit, 2004), this does not seem to be the case forthe surface forces resulting from surface mass loads. Mass mo-tion in the fluid envelop of the solid Earth and the interior ofthe solid Earth. Rearrangements of mass within the fluid of thesolid Earth, including the atmosphere, oceans, and terrestrialhydrosphere, cause changes of the Earth’s gravitational field,force Earth’s rotation changes by changing the solid Earth’sinertia tensor and angular momentum, and induce changes inEarth’s shape by changing the load acting on the deformablesolid Earth. The main uncertainties in modeling these effectappears to be in the surface mass loads (e.g., Van Dam et al.,2003).
Because of the main uncertainties being in the surfacemass, geodetic observations have increasingly been used toin-vert for mass change. However, despite the coupling of the ef-fects in shape, rotation, and gravity field, changes in the Earth’sshape have been used independently to infer global scale massmotions (e.g., Blewitt et al., 2001; Blewitt & Clarke, 2003;Wuet al., 2002, 2003, 2006) without utilizing the concept of con-
sistency across all geodetic observations. Others have usedchanges in the Earth gravity field to infer ice load changes(e.g., Velicogna & Wahr, 2006) and changes in the global andregional hydrology (e.g., Tapley et al., 2004a) without rigor-ously testing the consistency of the inferred mass transportswith changes in Earth rotation and shape. Only recently, theimportance of consistency has been emphasized (e.g., Clarkeet al., 2005). Thus, Gross et al. (2004) inverted Earth’s rotationand shape changes for mass loads; Gross (2006) inferred massloads from observations of changes in the gravitational field androtation; and Kusche & Schrama (2005) combined changes inEarth shape and gravitational field.
All of these attempts are hampered by the fact that the ref-erence frame is biased because of the assumption of linear sec-ular motion of the reference points, which in fact constitutes aglobal filtering of the geophysical signals, which results in a re-duction of these signals in the geodetic time series. Moreover,the incomplete modeling of the reference point motion mayalso affect the scale of certain techniques because of differentstation networks (in particular, different ratios of hemisphericstation numbers), and different observation times. As an ex-treme example, with the current practices, if one system onlyobserved in winter and another only in summer, there would bean apparent scale difference due to the annual vertical signalcaused by surface loads.
Therefore, more elaborated models for the point motionneed to be integrated in the process of determining the refer-ence frame motion. However, integrated model developmentis in an initial state, and particularly models that couple aro-tating, deformable solid Earth fully with advanced models ofatmosphere, ocean, and terrestrial hydrosphere, are just begin-ning to emerge. It is clear that such model development andvalidation will depend crucially on the availability of consis-tent observations of the geodetic quantities in a well-definedreference frame that does not by definition supress the signalspredicted by the model.
8.6 Towards an Earth system model
The Earth is a dynamic system. It has a fluid, mobile atmo-sphere and oceans, a continually changing global distribution ofice, snow, and water, a fluid core that is undergoing some typeof hydromagnetic motion, a mantle both thermally convectingand rebounding from the glacial loading of the last ice age, andmobile tectonic plates. In addition, external forces due tothegravitational attraction of the Sun, Moon, and planets alsoactupon the Earth. These internal dynamical processes and ex-ternal gravitational forces exert torques on the solid Earth, ordisplace its mass, thereby causing the Earth’s rotation, gravita-tional field, and shape to change. Only if all these processescanbe modeled and predicted in a consistent Earth system modelcan we expect to make progress towards the dynamic Earth ref-erence model discussed above.
For the modeling of the mechanical processes in the Earthsystem, the system can be viewed as composed of subsystems

The Global Geodetic Observing System GGOS 2020 139
System Earth
Astronomical Forces Astronomical Input External Fields
Climate
OceanAtmo-
sphere
terrestrial
Hydro-
sphere
Bio-
sphere
Mantle & Crust
Outer Core
Inner Core
• polar motion
• length of day
• surface deformations
• tides
• extraterrestrial magnetic
field
• solar radiation
• solar wind
• Earth’s gravitational field
• Earth’s magnetic field
gra
vitationalin
tera
ctions
electrom
agnetic
inte
ractions
boundary interactions
boundary interactions
boundary interactions
'
&
$
%
'
&
$
%
'
&
$
%
'
&
$
%
'
&
$
%'
&
$
%'
&
$
%'
&
$
%
? ?
6
?
6
?
6
?
6
-
-
-
-
-
-
-
-
-
-
-
-
Figure 68. Components of the Earthsystem and their mechanical interac-tions. From Plag (2006a).
such as crust and mantle, outer and inner cores, and the fluidenvelop of the solid Earth (Figure 68). The latter consistsof ocean, atmosphere, and terrestrial hydrosphere, which arethe prominent components of the climate system. The bio-sphere is also interacting with the components of the climatesystem, and, considering the anthroposphere as part of the bio-sphere, also the solid Earth. We have chosen not to separatethe cryosphere from the ocean and terrestrial hydrosphere butrather consider the ice load on land as part of the terrestrial hy-drosphere and sea ice as part of the ocean.
The subsystems depicted in Figure 68 interact throughsurface forces at the joining boundaries and through volumeforces due to gravity or electromagnetic fields. The overallsys-tem is subject to external forces including tides and the extra-terrestrial magnetic field. Additionally, radiation absorbed inthe system and interaction with solar wind change the dynami-cal state in the system and thus these external forcings havetobe considered as input to the mechanical system.
The Earth’s rotation is an integral quantity affected, inprinciple, by all processes changing the mass distributionandthe dynamics of the system. Thus, the rotation is ultimatelycoupled to deformations and variations of the gravity field ofthe Earth.
In this mechanical view, the geometry of the solid Earthas well as the mass distribution in its interior are determinedby the forces acting on the solid Earth, such as tidal forces,surface loading, and variation in the Earth’s rotation and grav-itational field, as well as forces inside the solid Earth, such asslow redistribution of mass due to convection, or rapid redis-tributions during earthquakes. With respect to surface loadingdue to mass redistribution in the ocean, the atmosphere, andthe terrestrial hydrosphere, it is important to note that any ofthese mass movements changes the Earth’s gravitational fieldprimarily due to the mass movements, and, secondarily, due todeformations of the solid Earth. Any of these changes will af-fect the mass distribution in the ocean and thus create additional

The Global Geodetic Observing System GGOS 2020 140
loads and variations in the three geodetic quantities.In addition to the mechanical forces, on longer time scales
we also have to consider thermodynamical forcing driving theconvection in the Earth’s mantle and core and creating phenom-ena such as volcanism and plate tectonics. However, for a de-scription of the main characteristics of the geodetic variables,the mechanical view provides a valid basis.
Modeling of the Earth focusing on mechanical propertiesof the geosphere traditionally attempts to describe the wholeEarth by a single system of equations specialized for specificphenomena (see e.g. Lambeck, 1988; Wahr, 1981, for rotationand loading deformations, respectively). In order to be feasi-ble, this approach requires a high degree of simplification andmany interactions and feedbacks have to be neglected. Conse-quently, even the most advanced geophysical models presentlyavailable are highly simplified and, moreover, specializedforthe description of specific phenomena (such as nutation, Earthtides, surface deformations, geoid anomalies, glacial loading).
Over the last decades, several studies have demonstratedthat complex systems can be modeled using a modular ap-proach, with the individual modules representing subsystems orcomponents that interacting through boundary conditions (sur-face forces, energy transfer, and particle transfer), and far-fieldinteractions (gravimetric and electromagnetic volume forces).Complex climate models are built in this way, with separatesubmodels for, e.g., the ocean, atmosphere, cryosphere, clouds,and land surface.
In a modular approach to the dynamics of a rotatingplanet, the planet is represented by a number of physically de-fined subsystems coupled to each other both by boundary con-ditions and far-field interactions. Thereby, different subsystemsare described each on its own by dynamical equations. Cou-plings between different subsystems in this approach have to bedefined independently of the structure of dynamics of the sub-systems as physically meaningful quantities, e.g. forces,mo-ments or fields. There might be, moreover, external excitationsacting on one or several particular subsystems such as for in-stance a tidal potential.
With respect to geodetic variables, integrated systemshave been studied mainly for Earth rotation. Juttner & Plag(1999) used a simple modular model (Dynamical IntegratedModular Earth Rotation System, DIMERS), with submodelsfor the Earth’s mantle, fluid core, and solid core, as well asthe atmosphere and ocean to study system characteristics andto model polar motion forced by atmospheric loading. Basedon a system model (Dynamic Model for the Earth Rotationand Gravity, DyMEG) similar to DIMERS, Seitz et al. (2005)studied the noise characteristics of polar motion, while Thomaset al. (2005) investigated the contribution of the ocean to polarmotion excitation.
These model studies demonstrate that a modular approachto a Earth system model serving geodetic applications is fea-sible. In particular, these model studies show that so-calledemerging system properties (e.g. the model period of Chan-dler wobble and nearly diurnal wobble) are sensitive to sub-
model properties and coupling between the submodels, andthese models allow the studying of the emerging properties asfunction of model parameters.
However, as pointed out by Juttner & Plag (1999), thereare a number of challenges in developing a consistent theoryfor an advanced model with more realistic representation ofallsubmodels. For most subsystems, individual reference frameswill be needed, and in order to exchange of body forces andboundary conditions between the system, the relation of theindividual frames to a common model frame will have to bedetermined. For some of the submodels, such as the ocean cir-culation models, feedback from a deforming solid Earth withvariable rotation is not sufficiently considered.
Challenges are also in the solid Earth processes them-selves. Unlike a uniform description of the rotating planetas awhole, a modular theory of planetary dynamics requires directtime domain integration as an initial value problem for basi-cally two reasons. First, the transformation into the frequencyor Laplace domain and back into the time domain by a Greensfunction formalism requires linearity of the mathematicalde-scription of the whole system dynamics. That would restrictany subsystem model to a linear theory. The modular approach,however, should not restrict the internal structure of the subsys-tems in any way except for the match of couplings. Secondly,the definition of a boundary value problem refers to boundariesof particular subsystems but is characterized by eigenmodesof the system as a whole. Thereby additional links betweenall the distinct subsystems are introduced which are not physi-cally determined as interactions of subsystems but mathemati-cally as matches of certain kinematic patterns. In the treatmentas boundary value problem a complete classification of possi-ble types of normal or eigenmodes has to be achieved before-hand. This classification has to be done anew after any sub-stantial change in any subsystem thus contradicting the spiritof the modular approach. Contrarily, in the modular approachto an initial value problem new properties of the whole systememerge in course of integration.
The modular approach allows for successive sophistica-tions individually inside each of the subsystems without requir-ing any changes in the other subsystem. The only demands onthe mathematical description of dynamics of a subsystem arethat it has to supply the other subsystems with time-dependentvalues of the prescribed physical coupling parameters and thatit has to work with such coupling parameters supplied to it byother subsystems at each time step anew. Of course, special at-tention has to be paid to the definition of the interactions rightat the outset. Indeed, the isolation of subsystems of the planetand convention on the kind of their mutual interactions definesthe structure of the modular theory. Unlike changes within anysubsystem, the mere addition of a new interaction of two sub-systems requires changing both of them. Moreover, the intro-duction of a new subsystem even requires changing all othersubsystems interacting with the new one.
The choice of subsystems already characterizes a certainstructure of the planetary interior and of the circumstances at

The Global Geodetic Observing System GGOS 2020 141
the planet’s surface. For the dynamic Earth reference model,the appropriate choice of modules will be pivotal for the ac-curacy of the model predictions. It can be expected that sub-moduls will have to be introduced for different time scales.Forexample, the modeling of co- and postseismic processes mayrequire a module separate from the one used for surface load-ing. In the end the dynamic Earth reference model may turnout to be a combination of a large number of models for variousprocesses, which run in parallel and interact through boundaryconditions and far-field forces, with the overall model develop-ment “guided” by geodetic observations in real-time.

The Global Geodetic Observing System GGOS 2020 142
9 The future Global Geodetic Observ-ing System (GGOS)
M. Rothacher, G. Beutler, W. Bosch, A. Donnellan, R. Gross,J. Hinderer, C. Ma, M. Pearlman, H.-P. Plag, B. Richter, J.Ries, H. Schuh, F. Seitz, C. K. Shum, D. Smith, M. Thomas,E. Velacognia, J. Wahr, P. Willis, P. Woodworth
In this chapter, we focus on the design of the geodetic ob-serving system that will be sufficient to meet the specificationssummarized in Section 7.7 and to sustain the products listedinSection 7.5. Thus, this chapter focused on GGOS as an observ-ing system (see Section 1.3 for a discussion of the two differentmeanings of GGOS). In Chapter 10, the main focus will be onGGOS as an organization and the integration of the future sys-tem in the global context of Earth observation.
GGOS has been organized by the IAG to work with theestablished IAG Services to provide the geodetic contributionto global Earth monitoring including the the metrological andreference system basis for all Earth observing systems. GGOSforms one of the observing system making up GEOSS.
GGOS is a complex system, addressing relevant geodetic,geodynamic and geophysical problems, which have deep im-pact on vital issues concerning humankind, e.g., global change,sea level rise, global water circulation, water supply, naturaldisasters, risk reduction, etc.(see Chapter 5 for more details).It is a visionary concept based on the requirements and spec-ifications given in Chapter 7 and on the assessment of whatcomponents are needed to fulfill the very demanding goals.
To address the ambitious goals of GGOS, we will inte-grate a multitude of sensors into one global observing system,where all the instruments will work together like one extremelycomplex sensor. In the following sections the focus will be onthe technical design and rational for the future overall GGOSsystem. The individual parts of the system will be discussedand the interaction between the components will be outlined,from the geodetic observations and the interfaces to the prod-ucts for the users.
9.1 The overall system design
The overall GGOS system is designed in such a way that it sat-isfies requirements and needs coming from the scientific as wellas the societal user requirements (see Chapter 7). The taskslisted in Section 7.4 have been identified as the most importanthigh-level tasks to be conducted within GGOS, but tasks thatwill actually be performed individually and collectively by theIAG Services, not GGOS itself. This list shows a very com-plex system with many different sensors and instruments, onthe Earth, in the air and in space, that are integrated to forma global observing system appearing to the outside world asone large, comprehensive “geodetic instrument” to monitortheEarth system. In order to function as a big Earth observatoryfor the benefit of science and society, GGOS has to encom-
pass not only global terrestrial networks of observatoriesandspace missions devoted to geodetic Earth observation and plan-etary exploration, but also communication infrastructure, anal-ysis centers, coordinating centers, and internet portals (requir-ing hardware, software, and manpower). GGOS will eventu-ally generate the well-defined products, which will providethemetrological basis for Earth sciences, geo-information science,terrestrial and planetary navigation.
GGOS, therefore, consists of the following four crucialparts:
• Instrumentation: global terrestrial networks of observa-tories, Earth observing satellites and planetary missions.
• Data infrastructure: data transfer, communication links,data management and archiving systems, data and productdissemination centers, web portals, etc.
• The GGOS Portal: a unique access point for all GGOSproducts with a database of relevant metadata accordingto international standards.
• Data analysis, combination, modeling: complete andconsistent data processing chains ranging from the ac-quisition and processing of vast amounts of observationaldata to the consistent integration and assimilation of theseobservations into complex numerical models of the Earthsystem.
These four components are shown in Figure 69 and willbe described in more details in the sections below. Figure 50onpage 65 shows how GGOS is designed to connect the space andterrestrial geodetic observations (left-hand side) to theEarthsystem components and their interactions (right-hand side) byway of the three pillars of geodesy (the Earth geometry and de-formation, the Earth rotation and its variations, and the Earthgravity field with its temporal changes) in the middle of Fig-ure 50.
The principal products of GGOS are summarized in Sec-tion 7.5 and the general accuracy requirement is stated in Sec-tion 7.6. From the accuracy requirement for GGOS of 1 ppb(including consistency between all GGOS products), it followsthat consistant permanent (as opposed to sporadic) observa-tions on ground and in space are required to meet the needsof modern science and society. In order to serve the purposesmentioned in Section 7.5, long-term stability and consistencyamong all GGOS products at better than 1 ppb is required, andthe products must be available in due time (e.g., in real timeforsome of the applications) to satisfy user requirements.
9.2 The overall observing system design: the f-ive levels
The GGOS observing system will have five major levels of in-strumentation and objects, that actively perform observationsor that are passively observed or both, namely:
• Level 1: the terrestrial geodetic infrastructure;

The Global Geodetic Observing System GGOS 2020 143
Figure 69. The overall sys-tem design of the future GGOSincluding global observing net-works, satellite missions, datacenters, analysis centers and co-ordination centers, etc.
• Level 2: the LEO (Low Earth Orbiter) satellite missions;
• Level 3: the GNSS and the Lageos-type SLR satellites;
• Level 4: the planetary missions and geodetic infrastructureon planets;
• Level 5: the extragalactic objects.
These five levels of instrumentation and objects, indepen-dent of whether they are active or passive, receivers or emittersor both, are connected (see Figure 70) by many types of obser-vations in a rather complex way to form the integrated GGOSobserving system. The major observation types at present are:
• Microwave observations of the GNSS satellites from theground and from LEO satellites;
• Laser ranging to LEOs, dedicated laser ranging satellites,GNSS satellites and the Moon;
• Microwave observation of extragalactical objects(quasars) by VLBI;
• Instrumentation onboard the LEO satellites measuring ac-celerations, gravity gradients, satellite orientation, etc.;
• Radar and optical observations of the Earth surface (land,ice, glaciers, sea level, ect.) from remote sensing satellite;
• Distance measurements between satellites (K-band, opti-cal, interferometry, etc.);
• absolute and relative gravity measurements;
• tide gauge measurements.
In the future, new measurement techniques will evolveand be included into the system. The individual parts (obser-vation types) of the overall system are connected by the co-location of different instruments at the same site on Earth or onthe same satellite or object. This co-location of instruments andsensors is extremely important for the consistency and accuracyof the system and for the integration of the system to performas one large “instrument” (see Section 9.3.8 below). In particu-lar, each of the techniques has its own strength and weaknesses,and through co-location, we strive to exploit the strengthsandmitigate the weaknesses to build the strongest system.
GGOS is not the first global geodetic observing system.Such systems have long existed to monitor seasons, to producemaps and to navigate reliably and accurately on Earth. Be-fore the space age, “predecessor of GGOS” consisted of onlythree levels, namely, globally distributed observatories(Levels1), the Moon, the Sun and the planets (Level 4) and “fixed”stars and quasars (Level 5). Level 4 (the Sun, Moon and plan-ets) of the historic systems was, so to speak, the predecessorof the GGOS Level 3 (the GNSS). Cross staffs, later on opti-cal telescopes and watches (first mechanical, then atomic) wererequired as hardware components in Level 1 of the historic sys-tems. Level 5 traditionally was the system of “fixed” stars. Thestar catalogues represented the celestial reference frame. .
9.3 Level 1: Ground-based infrastructure
This level of GGOS consists of all the terrestrial networks ofgeodetic ground stations contributing to the terrestrial referenceframe or to Earth monitoring:
1) The global network of radio telescopes coordinated by theIVS;
2) The global network of SLR and LLR stations of the ILRS;

The Global Geodetic Observing System GGOS 2020 144
Figure 70. The five levels of GGOS andtheir interactions with observations ofvarious types. The combined infrastruc-ture allows the determination and main-tenance of the global geodetic referenceframes, and the determination of Earth’sgravity field and rotation. The groundnetworks and GNSS are crucial in po-sitioning. In particular, they allow themonitoring of volcanoes, earthquakes,tectonically active regions and landslide-prone areas. The LEO satellites monitorsea level, ice sheets, water storage onland, atmospheric water content, high-resolution surface motion, and variationsin the Earth’ gravity field. The latter arecause, to a large extent, by regional andglobal transport in the hydrological cycle.
3) The global network of GNSS stations of the IGS;
4) The global network of DORIS stations coordinated by theIDS;
5) The global network of superconducting gravimeters com-prised in the GGP and the global network of sites occupiedepisodically with absolute gravimeters;
6) The global network of tide gauge stations coordinatedby the Intergovernmental Oceanographic Commission(IOC);
7) Global networks of geodetic timing stations.
Most of these observing stations are equipped with additional,complementary sensors and instruments (e.g., meteorologicalsensors, water vapor radiometers, etc.) and at many of the sta-tions more than one instrument is located, an important factorfor the integration of the individual networks. The design ofthese networks as fundamental and integral parts of the GGOSis described in the following subsections (see also the respec-tive Sections in Chapter 2.
9.3.1 Core network of co-located stations
The core of the terrestrial global GGOS network, the part re-alizing the integration of the various instruments on a globalscale, will be a set of about 40 globally well-distributed corestations. These stations co-locate the major geodetic observa-tion techniques and a variety of additional sensors. The co-location of the different techniques allows not only the integra-tion of the individual technique-specific networks into a uniqueterrestrial reference frame (ITRF) but also the assessmentofthe observation quality and accuracy and the mutual validationof the results. A network of such core stations is mandatory to
monitor the global reference frame at an accuracy of 1 mm orbelow for decades.
These core stations will be equipped with the followinginstruments that are based on most recent sensor technologies,connected to real-time communications (data streaming), col-lecting data at highest observation rates, being operated fullyautomatically and highly reliably: :
• At least two or even better more geodetic VLBI telescopesto ensure continuous VLBI observation (24 hours per day,7 days a week) despite maintenance periods for individualtelescopes;
• An SLR/LLR telescope to track all major satellitesequipped with laser retro-reflectors and for some stationsthe Moon;
• At least three GNSS receivers and antennas to guaranteethat individual antennas (and receivers) can be exchanged(e.g. for the tracking of new GNSS like Galileo) withoutloosing the exact local ties to the other antennas, thus en-suring long-term mm-level stability;
• A DORIS beacon of the most recent generation;
• Terrestrial geodetic survey instruments to permanentlyand automatically monitor the local ties between the ref-erence points of the space geodetic techniques with 1 mmaccuracy;
• Ultra-stable oscillators for time and frequency keepingand transfer (with VLBI, GNSS, laser links, etc.);
• A superconducting and an absolute gravimeter to supportgravity satellite missions and geocenter determination ;

The Global Geodetic Observing System GGOS 2020 145
• Meteorological sensors for pressure, temperature and hu-midity;
• Seismometer for earthquake detection, epicenter localiza-tion and the determination of rupture parameters in com-bination with deformation from the space geodetic tech-niques and GNSS seismology;
• A variety of additional sensors (water vapor radiometers,tiltmeters, large gyroscopes, ground water sensors, etc.).
If major new observation instruments/techniques are developedin the future, that will supplying additional complementary in-formation, these sensors should be added to the instrument poolof a core station.
9.3.2 VLBI station network
The VLBI station network for 2020 is foreseen to have a sizeof about 40 globally distributed sites with one or, even better,two telescopes at each site. These telescopes should be of theVLBI2010-type. Most of the current VLBI equipment in usetoday was developed in the 1970s and 1980s. The equipmentis being pushed to the limits of performance and is costly tomaintain. The existing antennas at many sites move slowly,which makes it difficult to provide the rapid whole sky coverageneeded for the hightest accuracy. Therefore, a rejuvenation ofthe VLBI network is mandatory.
In view of the requirements of GGOS, IVS WorkingGroup 3 (WG3) on VLBI2010 was charged with and examinedthe current and future requirements for geodetic VLBI systems.The group compiled their findings in the so-called VLBI2010vision paper (Niell et al., 2006) and made recommendations forthe next generation VLBI system. Recognizing the need for astanding body within IVS that would ensure the realization andimplementation of the new system, the VLBI2010 Committeewas set up.
The VLBI2010 system is envisioned to satisfy the follow-ing criteria: low cost of construction, low cost of operation, andprompt analysis and delivery of final results. To accomplishthis, the center piece of the new system will be a small-antennaobserving system (dish size of 12 m diameter or larger) in con-cert with global high-speed network links. The lower sensi-tivity of a smaller antenna, as opposed to the present∼20 mantennas, will be more than compensated for by high slew ratesof at least 5 deg/sec and higher observational data rates (8-16Gbps and higher), which will allow many more observations tobe taken. The observing will be done over a broad, continu-ous frequency range (broadband delay approach) of 2-18 GHzallowing mitigating any radio frequency interference issues.
The rapid advance of both magnetic-disk technologyand global high-speed network technology will be utilized inVLBI2010. All data collection and transmission interfacesandformats will adhere to the set of internationally agreedVLBIStandard Interface(VSI) specifications. An array of antennasdirectly connected to the correlator via high-speed network pro-vides the possibility for real-time and near real-time processing
to produce geodetic results in a matter of hours, which is par-ticularly important to the rapid turnaround of EOP results.
The experience of the GNSS community has demon-strated the value of increasing the number of receiving sitesand improving the geographic distribution. The present geode-tic VLBI network has a very irregular distribution of antennasover the surface of the Earth; Africa, South America, and Asiaare particularly under-represented compared to the other con-tinents. Thus, important considerations for the planning of anew network are the number and locations of the sites neededto achieve the 1 mm goal. Although the detailed choices fordeployment of new stations will be driven by a combinationof science, economics, and politics, a quantitative estimate canserve to specify the lower limit for the number of sites.
The goal of combining GNSS, VLBI, SLR, and DORISgeodetic networks sets a guideline for the number of VLBIsites. The current uncertainty in GNSS daily horizontal mea-surements for a global network is approximately 3 to 5 mm andis unlikely to improve significantly. In contrast, the repeatabil-ity in regional GNSS networks of∼1000 km is down to ap-proximately 1 to 2 mm. For VLBI the horizontal repeatabilityof theVery Long Baseline Array(VLBA) antennas has been 1.5to 3 mm over the past decade, while for the new VLBI systemspecified by the VLBI2010 Committee the horizontal accuracyis expected to be better than 1 mm. In order to take advantageof the best attributes of both GNSS and VLBI, the spacing ofcombined VLBI/GNSS sites should be on the order of 2000 km.Such spacing would require approximately forty sites (Eurasia(14), Africa (7), Australia (3), Antarctica (2), Greenland(1),North America (6), South America (6), Southern Pacific (2))equipped with one or even better two or more telescopes to al-low continuous operation.
9.3.3 SLR/LLR station network
The estimated size of the GGOS SLR/LLR network is basedon satisfying 1 mm/decade stability in the origin and scale re-quirements for the reference frame. This is presumed achiev-able under realistic weather conditions and local network oper-ations strategies. The same network is also expected to coverthe needs of the large complex of satellites anticipated in theGGOS 2020 time frame. In addition to the current distribu-tion of satellite categories being supported by the ILRS, weanticipate a significant increase in the number of GNSS satel-lites (GPS, GLONASS, Galileo, COMPASS, etc.) that willbe tracked in campaign mode. GGOS will require a glob-ally distributed network of 30-40 SLR stations co-located withGNSS and VLBI, with a high percentage of these addition-ally co-located with either gravity instruments or DORIS bea-cons. These core observatories should be at globally distributedsites, with good weather conditions and stable geology. Goodweather sites should permit ranging at least 60% of the time,and have weather patterns lacking strong seasonal signatures.Sites with stable geology would be devoid of local motionsthat would corrupt the reference frame stability and be several

The Global Geodetic Observing System GGOS 2020 146
hundred kilometers from plate boundaries, faults, and ridges.Bedrock would be ideal, but may not be practical at every site.Four of the stations (on four different continents) should havelunar ranging capability to continue the long time series ofLLRsince 1969. A number of the current SLR/LLR stations wouldbe likely sites for the GGOS network; all are co-located withGNSS and several are co-located with other instruments.
The network should be populated with fourth genera-tion systems with high repetition rates (102-103 Hertz), higherquantum efficiency detectors (either avalanche photodiodes orPMT quadrant or pixilated detectors), shorter dead-time be-tween events, increased automated or autonomous operations,real time communications for data flow and centralized op-erations monitoring, and improved calibration and diagnos-tic monitoring. The higher data rate will lend itself to morerapid satellite acquisition and improved pass interleaving forenhanced satellite conflict resolution. Real time data flow willimprove upon the current 1 - 2 hour availability cycle.
Many of the fourth generation capabilities are now be-ing demonstrated in current stations. The 2 KHz operation ispresently operational at the Graz SLR station. Others are ac-tively pursuing it. Semiautonomous and automated operationsare currently routine at the Zimmerwald and Mt. Stromlo sta-tions. The NASA SLR2000 prototype is being developed withmany of the fourth generation capabilities. The stations atZim-merwald, Matera and Concepcion have begun studying the two-wavelength concept for a more accurate refraction correction.
Earth ground-based laser experiments in 2005 to theMer-cury Laser Altimeter(MLA) onboard the MESSENGER space-craft enroute to Mercury, and to the MOLA onboardMarsGlobal Surveyor(MGS) orbiting Mars demonstrated that thereis sufficient signal link for interplanetary ranging measure-ments and that laser transponder experiments are capable ofproviding accurate spacecraft ranging and timing information.With the deployment of an optical receiver and accurate on-board timing system on the upcomingLunar ReconnaissanceOrbiter (LRO), one-way ranging to the moon should be opera-tional in late 2008. Several groups are now working on two-way transponders for use in lunar and planetary ranging forstudies of lunar and planetary dynamics and gravity field. Asa result, significantly more lunar range measurements at higheraccuracy and unbiased temporal coverage will become avail-able.
9.3.4 GNSS station network
The future global GNSS network (maintained by the IGS) willbe a multipurpose observation network. It will be of vital im-portance for:
• the reference frame realization, monitoring and mainte-nance;
• the densification of the core network of core stations andthe basis for regional densifications of the global referenceframe;
• time and frequency transfer between time laboratoriesequipped with GNSS receivers;
• the monitoring of global plate tectonics and deformationphenomena (loading, etc.);
• the monitoring of the displacements after and during anearthquake (GNSS seismology, that is, observing the seis-mic waves with 20-50 Hz sampling rates) to give addi-tional information to determine earthquake magnitudesand rupture processes;
• the connection of tide gauges to the global reference framethrough co-location;
• and for ground-based atmospheric sounding (troposphereand ionosphere).
To fulfill these purposes the IGS station network of thefuture GGOS shall consist of a few 1000 GNSS stations withthe following major characteristics:
• State-of-the-art receivers tracking all GNSS satellites,i.e.,the satellites of GPS, GLONASS, GALILEO, COMPASS,and similar systems yet to come. To achieve utmost accu-racy and reliability all available GNSS satellites have to betracked. The collection of data from more than one systemmakes GGOS independent of any individual system. Thereceivers will record all major codes and carrier phases onall frequencies relevant for Earth observation.
• Homogeneous global distribution of sites, densely cover-ing all major tectonic plates. In the case of a large earth-quake, the effects on the global reference frame should beknown and available in near real-time.
• Core sites (i.e., sites co-located with other space geode-tic instruments) shall be equipped with more than one re-ceiver and antenna to allow for equipment changes with-out loss of accuracy.
• All VLBI, SLR and the majority of DORIS sites shall tobe equipped with a co-located GNSS receiver.
• Sites shall be equipped with real-time data communicationlinks and the possibility to collect data at a sampling rateof a few ten Hz.
• GNSS receivers shall be connected to (or better driven by)ultra-stable oscillators, especially from time laboratories.
This network will be fundamental to connect, through co-location of instruments, all the other networks and to makesure, that the positions of all sensors of interest for a globalgeodetic observing system will be known in a unique globalreference frame.

The Global Geodetic Observing System GGOS 2020 147
9.3.5 DORIS station network
The quality, density and homogeneity of the DORIS networkhave been continuously improving for 20 years (Fagard, 2006).With 56 well-distributed stations around the globe, it guaran-tees an excellent orbit coverage for the DORIS-equipped satel-lites, thus playing a key role in the success of the DORISsystem. Such a density makes the DORIS network an essen-tial contributor to the realisation of the International TerrestrialReference Frame on one hand, both by making the IERS net-work denser and through the co-locations available at 2 out of3 DORIS stations, and to the sea level monitoring on the otherhand, through co-locations with tide gauges available at onethird of the stations. Thanks to the general renovation processthat was carried out over six years on the network, almost allantenna monuments will guarantee from now on an excellentlong-term stability of the antenna reference point. Moreover,the massive deployment of third generation beacons will en-sure a high performance and reliability level of the network.
The IDS station network of the future GGOS shall consistof 60 to 70 stations with the following major characteristics:
• A homogeneous global distribution of sites, covering allmajor tectonic plates: the IDS network shall allow thedetermination of the movement of all major plates andshall provide a global and robust coverage for all DORIS-equipped satellites.
• The current network will be maintained, and a few newstations will be installed to fill gaps or improve robustness.
• The network warrants an efficient support to current mis-sions (SPOT, Jason-1, ENVISAT) and already decided fu-ture missions (Jason-2, CryoSat-2, ALTIKA, etc.), at leastuntil 2020.
• Third generation or new state-of-the-art beacons will im-prove measurement quality and reliability.
• More beacons shall be connected to atomic clocks to pro-vide a better connection to the International Atomic Time.
• All DORIS sites shall be equipped with accurate meteo-rological sensors to allow for precise atmospheric correc-tions of the measurements.
• Long-term stability of the antenna reference points shallbe stable on the cm-level over time frames of a fewdecades to ensure the stability of the frame.
• DORIS equipment will contribute to core stations, i.e.,stations co-located with other space geodetic instruments(SLR, VLBI, GNSS) since all techniques need to be con-nected in order to fully contribute to the InternationalTerrestrial Reference Frame. In that framework, theDORIS/VLBI interference issue will be investigated andresolved to the extent possible.
• A homogeneous global distribution of sites co-locatedwith tide gauges will help to accurately calibrate sea levelchange.
The network monitoring will be enhanced to ensure that theDORIS stations steadily provide reliable and precise measure-ments:
• Periodic site visit: equipment inspection, antenna stabilitychecking, local geodetic survey;
• Daily monitoring of technological parameters like status,failures, voltage, transmitted power on both frequencies,time synchronization, meteorological sensors status, USOwarming time, etc.;
• Remote management and control of the DORIS beacons;
• Increase the level of the operating rate to 90% with dailymonitoring of performance indicators.
9.3.6 Networks of gravimeters
For a future GGOS it is extremely important to couple the spacegeodetic techniques that deliver information about the geome-try of the Earth (shape, deformation, orientation, and rotation)with gravimetric measurements not only from gravity satellitemissions but also from sensors on the Earth’s surface. Most ofthe processes in the Earth system have an impact on all geodeticobservations and the complementarity of gravimetric sensors iscrucial for the separation of various processes involving massredistribution and transport.
To obtain time series of gravimetric measurements thatimprove the monitoring of the Earth system on a global level,anetwork of about 30 gravimetric stations (identical to the extentpossible with core sites, see Section 9.4.1) should be set up.Each of these stations should consist of a superconducting aswell as an absolute gravimeter, both continuously measuringthe gravitational acceleration and its change with time. The twoinstruments, the superconducting and the absolute gravimeter,are complementary.
9.3.7 Network of tide gauge stations and ocean bottomgeodesy
As reported in Section 2.9.3, tide gauge sea level measurementsare coordinated internationally through GLOSS, which coordi-nates a network of∼300 stations (see Figure 48 on page 59).By 2020, one would expect all of the core tide gauge net-work sites, the majority of all other sites with long sea levelrecords, the stations which provide comparison data for altime-ter calibration, and indeed many other tide gauge stations,tobe equipped with GNSS receivers. These receivers have twofunctions: to enable the tide gauge measurements to be locatedin the same reference frame as altimeter data, and to determinethe rates of vertical land movement (see Section 2.9.3).
The historical tide gauge record has been derived primar-ily from float and stilling well technology. However, nowadays
The Global Geodetic Observing System GGOS 2020 148
one can acquire acoustic, radar and pressure tide gauges, aswell as digital float systems, each of which has its advantagesand drawbacks (see Section 2.9.3 and IOC, 2006). AlthoughGLOSS standards simply require tide gauge stations to pro-vide measurements to better than 1 cm accuracy in all weatherconditions, one would expect that any new GLOSS installa-tion would take into account the experience with the Sumatratsunami of December 2004, and therefore include dual gauges(e.g., a “sea level” gauge based on radar, and a “tsunami” gaugebased on pressures) and dual telemetry. Data flow should beboth near-real time (especially so for tsunami and storm surgeapplications) and delayed-mode for scientific applications.
At the time of this writing, much experience is availablefrom float, acoustic and pressure systems, while radar devicesare relatively new and untried. However, their low cost and easeof installation and maintenance means that they will be widelyused in future. By 2020, one would expect such devices to beboth accurate and affordable, and to remove the need for ’tidegauge experts’ to a great extent. However, if one is realistic, onewould expect there to be an ongoing need for capacity buildingin their use in developing countries.
BPR are also of importance for geodetic applications(see Section 2.9.3): Data from deep ocean bottom pressurerecorders are particularly relevant for comparison to temporalspace gravity data from missions such as GRACE. However,only a few BPRs have been deployed so far explicitly for suchcomparison purposes; the POL BPRs in the SW Atlantic beingone example (Hughes et al., 2007). By 2020, the installationofa permanent global ocean network of 50-100 BPRs would betechnically feasible. However, there are currently no firm plansfor such a network, and the question of data transmission wouldneed to be addressed seriously, unless the community could ac-commodate itself to work only with delayed-mode information.
9.3.8 Co-location of instruments and auxiliary sensors
The co-location of different and complementary instruments iscrucial for several reasons:
• Without co-location sites and highly accurate local tie in-formation, it is impossible to establish a unique and com-mon global reference frame for all major space geodetictechniques.
• Co-location sites allow the comparison, validation andcombination of estimated parameters common to morethan one technique. The comparison is crucial for the de-tection of technique-specific biases and the combinationof common parameters strengthens the solutions.
• Complementary observation techniques may be the onlyway to separate different processes taking place in theEarth system.
Co-location should therefore not only be limited to thespace geodetic techniques but include additional sensors with apotential for integration and combination. A list of such instru-ments is given in Section 9.3.1.
The measurement and monitoring of the local ties be-tween different instruments should have a similar status andaccuracy in the future as the observations of the space geode-tic techniques themselves. The local tie measurements shouldbe performed with 0.1 mm-accuracy, in a fully automated wayand on an almost continuous basis, since local ties may changeas well over time. These measurements have to account forany deflection of the vertical when relating the local ties tothegeometric frame. Because of discrepancies in the results fromco-located techniques, it is extremely important to be abletofully rely on the measured local ties. This will help to identify(and eventually correct) the considerable remaining systematiceffects in the results of the individual observing techniques.
At core stations, local ties do not only have to be estab-lished between the reference points of the major space geodeticobserving techniques, but also to other sensors at such sites. Asan example, the height differences between the reference pointsof the space geodetic techniques and atmospheric sensors haveto be known with decimeter accuracy for comparison, valida-tion and combination purposes (e.g. the tropospheric delaydif-ference between the GNSS and VLBI antenna reference pointhas to be corrected for when combining the tropospheric delayestimates from GPS and VLBI; in the future it might even bedesirable to have the antenna reference points of VLBI, GNSSand DORIS at the same height to avoid “tropospheric local tieerrors”). The location of a water vapor radiometer with respectto the other observation techniques has to be known as well andthe same is true for gravimeters, tiltmeters, large gyroscopes,etc.
The core network (see Section 9.3.1) will be fundamentalfor the co-location of instruments. However, due to environ-mental conditions at the individual sites (geological and geo-dynamic stability, weather conditions for SLR/LLR, multipathenvironment, change in ground water table, etc.), it will notalways be possible (or reasonable) to co-locate all instrumenttypes at one location. “Isolated” instruments should then atleast be tied to a unique global reference frame by setting upaGNSS receiver at the same location. All instruments must beco-located with GNSS.
9.4 Level 2: satellite missions: Low Earth Or-biters and their applications
Satellite Missions:
• Continuous observations over decades, long time series(trends)
• Chains of satellite missions (altimetry, gravity, InSAR, ...)
• Constellations of satellites (COSMIC, SWARM, ...),micro- and nano-satellites
• Formation flying: several saetllites form ”one large instru-ment”
• Near real-time data transfer (inter-satellite comm.) andanalysis (early warning systems)
The Global Geodetic Observing System GGOS 2020 149
• Development of new sensors and technologies (e.g. GNSSreflectometry and scatterometry, laser interferometry be-tween satellites, ultra-stable oscillators in space)
• Satellites allowing co-location of space geodetic tech-niques (GNSS receiver , SLR retroreflector, VLBI emittor,gradiometer; SLR on GNSS satellites, VLBI in space, ...)
Satellites observing the Earth from space are an indis-pensable component of GGOS in 2020. Satellites have thebig advantage that they collect data homogeneously and con-sistently over the Earth surface, typically covering most of theEarth surface. They also allow the collection of data that cannotbe recorded at the Earth surface. These satellites are nowadaysequipped with a multitude of sensors and instruments and thusenable the monitioring of the land, ocean and ice surfaces aswell as the Earth gravity field and its temporal variations.
The potential and impact of satellite missions on Earthobservation will increase considerably due to the fact that(1)more and more satellite constellations instead of individualsatellites will be lauchned increasing the temporal and spatialresolution of the data and (2) satellites will be flown in forma-tion thus allowing to form large observing instruments com-posed of sensors on more than one satellite.
Due to the importance of the satellite component for theGGOS design and products, the observation of certain geode-tic/geophysical parameters of the Earth (e.g. the gravity fieldand its temporal variations) by a satellite mission should notend with this dedicated mission but has to be continued withfollow-on missions establishing eventually a chain of mis-sions (as in the case of the altimetry missions TOPEX, Jason-1, Jason-2, and ERS-1, ERS-2, Envisat, etc., see Table 2 onpage 38). Such chains of satellite missions are crucial for themonitoring of the Earth system over long time periods and forthe detection of long-term trends and changes in the Earth sys-tem. They are therefore to be seen as a strategic goal of theGGOS activities.
9.4.1 Gravity satellite missions
The gravity field missions CHAMP and GRACE (see Sec-tion 2.6.5) have led to a revolution in our knowledge of thestatic and time-variable gravity field. The missions improvedthe accuracy of the static gravity field models by a factorof at least 100 compared to pre-CHAMP models that weremainly determined from Satellite Laser Ranging data. Basedonmonthly gravity fields determined from CHAMP and, in partic-ular, GRACE data, seasonal variations and trends in the Earthgravity field can be monitored, giving unique information abouthighly relevant mass transport phenomena like the water cyclein large river basins, the melting of ice sheets in Antarctica andGreenland and the associated sea level change, as well as inocean current systems. The future GOCE mission by ESA willlead to another huge improvement in the resolution and accu-racy of the Earth static gravity field and our knowledge of theoceanic current systems, and will be an important step towarda more accurate unified global vertical reference frame.
In view of these developments it is clear that presentand future gravity field missions have to play a crucial rolein GGOS, indeed. It should be stressed, that an uninterruptedmonitoring of the temporal variations of the gravity field isofutmost importance for global change phenomena, i.e., the re-liable detection of small trends in the gravity field due to sealevel rise, the melting of ice sheets and changes in the oceancurrent systems.
To avoid any gaps in the time series – GRACE may lasttill 2013 – a GRACE follow-on mission with minimum changesin the design will be mandatory, since the development of newtechnologies may require several years and, thus, might notbeready before the decommissioning of the GRACE pair. GGOSwill have to work with the space agencies to ensure this follow-on mission.
For mission concepts on the longer run (beyond 2013),new scientific challenges, for example, global ocean circula-tion, hydrological cycle, secular trends of geoid, ice sheet andglacier evolution, crust and lithospheric structure and dynam-ics, big earthquakes, and vertical datum improvement, requirehigher temporal resolution, higher spatial resolution andhigheraccuracy (see Figure 54 on page 80). Accordingly, differentsensor types like accelerometers, (quantum-gradiometers, low-low and high-low satellite-to-satellite tracking/ranging (SST),optical clocks, etc.) might be most appropriate.
One obvious concept to improve the accuracy of inter-satellite measurements (low-low SST) is the replacement oftheK-band link of the GRACE mission concept by an optical link(i.e., a laser interferometer). A gain of a factor of 100-1000in the accuracy of the inter-satellite measurements can be ex-pected from such a development. Initial studies of such a con-cept have been performed by NASA and are presently lookedat by ESA as well. With such accuracies, the de-aliasing ofthe gravity field determination (removal of effects from high-frequency signals from the atmosphere, ocean tides, etc.) willbecome a major challenge. The same is true for the separationof the diverse gravity signals resulting from different sourcesand processes. To help in this respect, different orbit constella-tions and different types of satellite formations will haveto beconsidered. In addition, complementary sensor systems (sur-face deformation monitoring with GNSS, ocean bottom pres-sure sensors, airborne gravimetry, superconducting gravime-ters, etc.) will be crucial to allow for the separation of differentprocesses: a sensor integration at the very heart of the GGOSconcept anyway.
It is possible that in about 10 years, optical clocks willreach stabilities of10−18 (see Section 2.7.3). Based on thetheory of General Relativity such clocks will allow the directdetermination of potential differences between clocks corre-sponding to height differences on the level of 1 cm (geoid).With frequency comparisons between clocks in space and onthe ground a consistent global vertical reference frame canthenbe established with very high accuracy.

The Global Geodetic Observing System GGOS 2020 150
9.4.2 Ocean and ice altimetry satellite missions
STILL TO DO: Here text on future oceanand ice satellites needs to be added.
9.4.3 InSAR and optical satellite missions
InSAR observations produce spatially continuous images ofthedeformation of the Earth’s surface (see Section 2.4.5 for exam-ples). These images are complimentary to other space-basedgeodetic observations, which produce temporally smooth, butspatially discontinuous point measurements of surface motions.The need for improved coverage of the Earth’s surface is obvi-ous particularly for geohazards and Earth sciences (see Chap-ter 5).
The recent National Academy of Sciences report “EarthScience and Applications from Space: National Imperativesfor the Next Decade and Beyond” (National Research Coun-cil, 2007), represents the U.S. scientists’ consensus on criticalEarth observations from space that are required to address is-sues for climate change, water resources, ecosystem health, hu-man health, solid-earth natural hazards, and weather. The Re-port recommends that DESDynI, an L-band InSAR and laseraltimetry mission, be launched in the 2010-2013 time frame.DESDynI will measure surface and ice sheet deformation forunderstanding natural hazards and climate and vegetation struc-ture for ecosystem health. DESDynI will help scientists under-stand the effects of changing climate and land use on specieshabitats and atmospheric carbon dioxide, the response of icesheets to climate change and the impact on sea level, and wouldbe used to improve forecasts of the likelihood of earthquakes,volcanic eruptions, and landslides.
Geodetic networks support InSAR by providing geode-tic control for the observations. The geodetic networks alsoprovide tropospheric and ionospheric maps for improving theinterfeograms. The geodetic data will be used to calibrateand validate the InSAR observations and as mentioned abovewill compliment the InSAR observations by providing tempo-ral continuity to the images.
NASA proposed the implementation of theInternationalSAR Information System(ISIS) . A group around ISIS has notyet been formalized. This group will be used to set data policiesand will serve as a vehicle for delivering InSAR data to thegeneral science community and will coordinate acquisitionandprocessing of data. GGOS could be an important advocate orumbrella organization for this group .
By 2020 we anticipate a constellation of InSAR satelliteswith contributions from international partners, such as Europe,Brazil, Taiwan, and Japan. A coordinated constellation of In-SAR satellites will enable multibaseline observations fordeter-mined topography and vegetation structure. The constellationwill also allow for more frequent observations at particular lo-cations, enabling more rapid response to events such as earth-quakes, volcanoes, and landslides, as well as better determina-tion of time dependent phenomena.
Combined solution of imaging and point techniques will
be crucial in order to calibrate the dynamic Earth referencemodel proposed in Chapter 8. For that, SAR images need tobe available at least for the globally distributed fundamentalstations.
9.4.4 Future satellite mission concepts
In the last few years the technical development in various areasof satellite technology has been extremely fast, so that totallynew concepts of satellite missions become possible in the fu-ture. The most important new concepts are:
• Design of micro- or even nano-satellites;
• Constellations with a large number of satellites;
• Formation flying;
• New instrumentation.
Initially, the new concept to build micro- or nano-satellites has mainly been pushed by university projects forstudents. Nowadays, these developments are also pursued bynational space agencies as an interesting alternative to small orlarge satellites to reach certain mission goals. Due to the minia-turization of satellite components and sensors, micro-satellitescan nowadays be used for challenging mission tasks at a frac-tion of the costs of small satellites like CHAMP or GRACE.Especially in connection with formation flying or satellitecon-stellations with a huge number of satellites, this alternative be-comes very attractive.
A constellation of a large number of satellites, possiblyin different orbital planes and configurations, has the big ad-vantage, that the temporal and spatial resolution of Earth ob-servation can drastically be improved. This can be seen whenlooking at the number of radio occultations resulting from theconstellation of six COSMIC satellites compared to individualsatellites like CHAMP. Near real-time Earth monitoring basedon satellites observations (e.g., for early warning systems) willrequire a constellation approach and inter-satellite communica-tion to allow for a near real-time analysis of the data on theground. Together with the micro- and nano-satellite conceptmentioned above, constellations of 10-100 satellites willbe-come feasible and affordable. .
Formation flying is a very interesting new aspect of satel-lite missions. Compared to conventional missions it adds twonew dimensions: (1) it allows for inter-satellite measurements(e.g., the k-band link between the GRACE satellite pair) anditopens the door to build a virtual, more efficient/accurate in-strument by integrating the instruments on several satellitesinto one big observing system (e.g., the integration of theTerraSAR-X and TanDEM-X satellites for the generation ofhigh-resolution Digitial Elevation Models (DEM)). A mixedconcept of constellation and formation flying is given by theESA SWARM mission, where two of the three different satel-lites fly in a formation to measure the east-west gradients ofthemagnetic field and where the third satellite orbits the Earthat a

The Global Geodetic Observing System GGOS 2020 151
higher altitude to allow the separation of different parts of themagnetic field.
In addition to the developments mentioned above, therewill also be considerable progress in the instrumentation thatwill be available for satellite missions. Optical clocks mayreach a stability of about 10-18 in the next several years. Thiswill allow the direct measurement of the gravitational poten-tial based on the effects of general relativity on clocks (clocksin a strong gravitational field run slower than clocks in a lowgravitational field) and thus enable the unification of physicalheight reference frames on the centimetre level. Microwavelinks between satellites will be replaced by optical links (opti-cal interferometers; e.g., for GRACE-type measurements) thatwill increase the precision of the inter-satellite measurementsby at least a factor 100-1000. Reflectometry and scatterometryantennas for GNSS altimetry applications may become impor-tant add-ons to Earth observation satellites. In addition,inter-satellite communication technologies will make (near) real-time transfer possible to the Earth as required for early warningsystems.
9.4.5 Co-location onboard satellites
The co-location of different sensors and observation typeson-board a satellite is extremely important to establish connec-tions between the different observation techniques. Thesecon-nections and the complementarity may be crucial to correctlymodel certain aspects of the observations (e.g. correctionfornon-gravitational forces with accelerometers in gravity fielddetermination) and to separate effects coming from differentprocesses or components of the Earth system. In addition, theavailability of complementary instruments on a satellite (e.g.,different tracking systems like GPS, SLR, and DORIS for pre-cise orbit determination) allows for connection of techniques atthe satellite that are independent of those at co-location siteson the Earth’s surface, and allow the detection of technique-specific biases.
A good example for this is the rapid progressachieved in orbit determination with the tracking data of theTOPEX/Poseidon satellite using DORIS, GPS, SLR and al-timetry (crossovers). For future satellite missions, muchem-phasis should therefore be put on satellites that establishlinksbetween different observation and tracking techniques. Onevital aspect is that all GNSS satellites should therefore beequipped with laser retroreflectors arrays (Figure 71). VLBIobservations of GNSS satellites should also be realized in thefuture, establishing another link between techniques thatwoulddirectly connect the satellite frames to the ICRF.
9.4.6 Airborne and shipborne sensors
The instruments on the ground and in space should be supple-mented with data obtained from air-borne platforms and ships.Typically, the data stemming from airplanes and ships are ratherlocal or regional in nature compared to the data collected bysatellite missions. However, the airborne and sea surface data
Figure 71. Retroreflector arrays on GPS-35 and -36 satel-lites.
with higher spatial resolution are very important to assessthequality and accuracy of satellite or ground-based data. In ad-dition, it helps to get more detailed information about the pro-cesses considered. Although the main focus of GGOS is onglobal aspects of Earth monitoring, most of the natural hazardsare rather regional or local in nature. To understand them inmore details, GGOS will strive, starting with the global per-spective, for a higher and higher resolution of the monitoringin space and time.
Airborne and shipborne gravimetry are good examples ofhow our knowledge of the global Earth gravity field comingfrom satellite missions can be densified and improved with air-borne and shipborne sensors. The regional gravity data is com-bined with the global gravity field models from satellites togetthe high frequency part of the field.
9.5 Level 3: GNSS and laser ranging satellites
9.5.1 Global Navigation Satellite Systems
The GNSSs are evolving quickly and aGlobal NavigationSatellite System of Systems(GNSSS) can be imagined (Heinet al., 2007). The GLONASS system is being replenished witha new generation of satellites to be completed by 2010. The firstGALILEO engineering satellite has been launched; a second isdue late in 2007. The full constellation should be completedby 2011. The Chinese government is also working on a civilsatellite navigation system (COMPASS). Also GPS will be up-graded: the first new generation satellites with a second civilsignal (L2C) have already been launched. GPS III with threefrequencies is planned for the end of the 2020 time frame.
Both Japan and India intend to realize smaller regionalsystem. The JapaneseQuasi-Zenith Satellite System(QZSS)is planned with four geostationary satellites. TheIndian Ra-dionavigation Satellite System(IRNSS) will be built as a seven-satellite constellation.
In addition, Satellite-based augmentation systems(SBAS) for the GNSS are developing and adding relevantinfrastructure. Examples are theEuropean GeostationaryNavigation Overlay Service(EGNOS), the U.S.Wide Area

The Global Geodetic Observing System GGOS 2020 152
Augmentation System(WAAS), the JapaneseMultifunc-tional Transport Satellite Space-based Augmentation System(MSAS), the IndianGPS and GEO Augmented NavigationSystem(GAGAN), and theNigerian Communications Satellite(NIGCOMSAT). The SBAS add or will add additional signalsto those of the GNSS signals, and most SBAS are planned tobe interoperable with the GNSS. Many countries are interestedin a participation in these GNSS and SBAS.
GNSS are also crucial for the reference frame realizationand many applications in Earth observations (see Chapters 2and 3). Since∼2011 approximately 100 GNSS satellites willbe available, a totally new level of quality and accuracy willbe achieved. This will have a fundamental impact on most ofthe GGOS products, from the reference frame to GNSS atmo-spheric sounding, reflectometry and scatterometry.
It is therefore essential for GGOS, to make best possibleuse of a combination of the GNSS systems available for civilapplications. GGOS, through the IGS, should have the goal togenerate consistent products of highest accuracy for all theseGNSS systems. The ground network of GNSS stations shouldsupport this by the installation of receiver technology that al-lows the tracking of relevant GNSS at the same time.
To link the GNSS to SLR, corner cubes (laser retroreflec-tors) should be installed on all newly designed and launchedsatellites (see Section 9.4.5). All GLONASS and GALILEOsatellites are or are going to be equipped with laser retroreflec-tors.
9.5.2 Laser ranging satellites
Stations in the ILRS network range to a constellation of bothpassive and active satellites including the Moon (see Sec-tion 2.4.2. The SLR network will track the complex of passive,spherical geodetic satellites such as LAGEOS-1 and -2 (seeFigure 11) on page 32, Etalon-1 and -2, and Starlette and Stellafor reference frame maintenance and measurements of time-varying components of the gravity field. SLR measurementswill continue on GPS-35 and -36, the Galileo satellites and se-lected satellites in the GLONASS series. Efforts are underwayto try to include retroreflectors on the upcoming GPS-III series(see Figure 71 above). Tracking of these GNSS satellites iscrucial for the assurance of positioning quality, long termsta-bility, verifying orbit and timing accuracy, and aligning otherreference frames (e.g., WGS 84) with the ITRF. This trackingwill also verify the inter-operability of the three GNSS seriessatellite systems and further systems to come.
The retroreflector arrays flown in space to date have beenmade from solid quartz cubes, (either back-coated or uncoated).Engineering studies indicate that hollow cubes made from ei-ther aluminum or glass may provide considerably higher returnsignal strength for similar weight and area conditions on arraysat GNSS altitudes. Testing of some of these cubes is currentlyplanned at GSFC and INFN in preparation for possible use infuture GNSS satellites.
Figure 72. ICRF-E
9.6 Level 4: planetary missions
STILL TO DO: This section still needs tobe written.
9.7 Level 5: extragalactic objects
The quasars and other compact radio sources that are includedin the ICRF have point-like optical images. Their red shiftsindicate great distances so their emissions must be poweredby processes different from stars and galaxies, most proba-bly mass flows into massive black holes. At the resolutionof geodetic/astrometric VLBI using S-band (2 GHz) and X-band (8 GHz), the objects are generally not point-like but havesome structure that can also change with time. Such structurechanges can be seen as changes in position up to 1 milliarc-second. The brightest extragalactic radio sources in fact havetoo much detectable structure to be good astrometric objects.By balancing the competing criteria of source strength, com-pactness and constancy of structure and position, a set of∼100geodetic sources has been selected for routine geodetic VLBIobservations, while the rest of the ICRF sources improve thedistribution and density over the sky (Figure 72). It shouldbenoted that the small number of VLBI stations in the SouthernHemisphere causes the ICRF to be weaker in all aspects in thesouthern sky.
It is therefore essential, that the future GGOS realizes amuch more homogeneous coverage of the southern and north-ern hemispheres. This implies that about half of the 40 corestations of the future GGOS (equipped with VLBI telescopes)have to be located in the southern hemisphere. Because of rapiddevelopments in communication technologies it should be pos-sible to install such a network in the next decade.
The ICRF is essential to geodesy as it is the frame for ob-servations of Earth rotation and the ultimate frame for satelliteorbits. The ICRF is also the basis for astrometry. In this re-gard the ICRF has different realizations at various wavelengths,

The Global Geodetic Observing System GGOS 2020 153
the microwave VLBI realization being the most accurate at thistime. The astrometric satellite GAIA is scheduled for launchin late 2011 and has the potential for generating an optical ex-tragalactic realization with an order of magnitude better preci-sion and two orders of magnitude more objects. Other spacemissions may refine the positions and proper motions of thebrightest stars with corresponding improvement of star track-ing for satellite orientation. For most geodetic purposes,how-ever, these improvements will not be applicable since no corre-spondingly precise ground-based observing system exists.Anaccurate microwave realization for geodetic VLBI will still beneeded. A second realization of the VLBI ICRF making useof the improved data and modeling since 1995 is anticipated in2009.
9.8 GGOS data flow: from measurements tousers
The official products generated by the technique-specific Ser-vices will be the basis for the products made available throughthe GGOS portal (see Section 9.9). Thus, GGOS will inher-ently rely upon the data system infrastructure of the IAG Ser-vices.
The success of the IAG Services is partially due to theunderlying support of their information and archive services.Each Service provides a coordinating entity (coordinatingcen-ter or central bureau) that manages the daily operations of theService. This function also facilitates communications and co-ordinates activities both within the Service and to a broad usercommunity. A central coordinating function will also be es-tablished for GGOS (see Chapter 10), providing coordinationwithin GGOS and to the IAG Services.
The IAG Services’ data centers are the central source fordata to the analysis community and products generated by theseanalysts for the larger user community. GGOS will rely heav-ily on these data centers for service products and input to theGGOS portal.
9.8.1 Data centers and data flow
Each of the geometric IAG Services utilizes a similar struc-ture (shown in Figure 73) for the flow of information, data, andproducts from the observing stations to the user community:Network Stations (track continuously, transmit data usingpre-determined schedules), Data Centers (interface to stations andusers, perform data quality checks/conversion, archive data andproducts for analysis center and user access) and Analysis Cen-ters (generate products). Participants in service activities col-laborate at all levels to ensure consistency and timely deliveryof data and products.
Networks of tracking stations transmit data through vari-ous levels of data centers to ultimately reach the service anal-ysis centers and user community. During the design phases ofthe IAG Services, it was realized that a distributed data flowandarchive scheme would be vital to mission success. Thus, each
Figure 73. Each of the geometric IAG Services operateswith a similar component structure for data flow and archive.The service-specific global data centers will provide data andproducts to the GGOS combination centers; GGOS users willobtain data and products through the GGOS Portal or throughdirect access to the service data centers. GGOS productswill be accessible to users directly through the combinationcenters or through the GGOS portal.
Service (starting with the IGS) established a hierarchy of datacenters to distribute data from the network of tracking stations:Operational, Regional, and Global data centers. This schemeprovides for an efficient access and storage of data, thus re-ducing traffic on the Internet, as well as a level of redundancyallowing for security of the data holdings. Operational datacenters serve as the direct interface to the network stations (orcorrelators in the VLBI case), connecting to the remote sitesdaily/hourly/sub-hourly, downloading the data, and archivingthe raw station data. Regional data centers gather data fromvarious operational data centers and maintain an archive forusers interested in stations of a particular region. Furthermore,to reduce communication traffic, the regional data centers areused to collect data from several operational data centers be-fore transmitting them to the global data centers. The globaldata centers are ideally the principle data source for the anal-ysis centers and the general user community. Operational andregional data centers transmit data to these global data centerswhere they are then available on-line for ftp/web download.These data are utilized by the service analysis centers to createa range of products, which are then transmitted to the globaldata centers for public distribution. These data centers equalizeholdings of network station data and derived products on a fre-quent basis. Multiple global data centers provide each Service
The Global Geodetic Observing System GGOS 2020 154
with a level of redundancy, thus preventing a single point offailure should one data center become unavailable. Users cancontinue to reliably access data from one of the other availabledata centers. Furthermore, multiple, geographically distributedglobal data centers reduce the network traffic that could occurto a single geographical location.
9.8.2 Synergies between observing techniques
Each of the four geometric Services utilizes a similar flowof data, pioneered by the IGS and shown in Figure 73, fromthe measurement networks to the analysis centers. Standards,both technique-specific and cross-discipline, in data and prod-uct generation are utilized throughout all levels in each oftheServices. Each Service has developed its products using stan-dard models and algorithms to ensure consistency over time.Data are currently archived in technique-specific formats (e.g.,RINEX for GNSS); however, products derived from the dif-ferent techniques are moving toward common formats acrossdata types (e.g., SINEX for station positions, SP3 for satelliteorbits). All data are ASCII, providing machine independence,and compressed for transmission and archive. The Services arealso willing to evolve as requirements change by developingnew or using existing formats and standards for the exchangeof data and products.
9.8.3 Operating centers and communications
Operating (or operational data) centers are responsible for pro-viding the communication infrastructure for network stations,downloading data on a routine basis, re-formatting and check-ing the downloaded data, maintaining these network stations,and archiving the raw data. Connections to the station are typi-cally through Internet or dial-up methods with satellite commu-nications used in more remote areas. Direct connections allowfor rapid download, at least daily but often sub-daily (or evensub-hourly). Currently, GNSS and laser ranging stations are re-quired to transmit data on a daily basis (although most stationssend on an hourly basis), at a minimum, to these operation cen-ters. VLBI data are physically shipped from the network sta-tions to a correlator on disk packs; in some cases, however,the data are electronically transferred via high-speed networks(e-transfer). Since VLBI observing is organized in sessions,the data transmission follows a session schedule. DORIS sta-tions uplink data to the DORIS receiver on-board the observedsatellite, thus making installations in more remote areas possi-ble. DORIS-equipped satellites then download these data totheDORIS or satellite control center for transmission to IDS datacenters.
The future GGOS, striving for a much more homoge-neous distribution of core stations and technique-specificobser-vation networks, will have to rely heavily on satellite communi-cation technologies in the next few years, i.e., technologies thatare accessible from very remote areas on the globe. Commu-nication links via satellites become cheaper and cheaper everyyear, making this technology more and more suited for GGOS.
Thinking of satellite constellations observing the Earthin near real-time (e.g. for a tsunami early warning system us-ing GNSS reflectometry), only inter-satellite communicationsor communications via geostationary satellites will allowthedata to arrive at the data centers and analysis centers in nearreal-time for the corresponding analysis to take place. Thede-velopment of such innovative communication technologies hasto start now and the data flow should be in place in a couple ofyears.
9.8.4 Future technologies and capabilities for data infras-tructure
Several of the geometric IAG Services are moving into therealm of real-time data streaming. Real time and near real-timeapplications (e.g., weather forecasting, tsunami early warningsystems) require low-latency data and product delivery. Real-time data transfer also allows operations centers and analysts tomonitor station health and thus provide rapid notification andcorrection of station problems. Standards, and protocols forreal-time operations, liaisons with regional real-time networks,and technologies to broadcast products for real-time usersarecurrently under development. Near real-time products derivedfrom these data streams will be investigated. The developmentsfor a future VLBI system (VLBI2010) aim at real-time e-VLBI,where the transmission of station data is accomplished throughhigh-speed network transfer to the correlator during an observ-ing session and the data are correlated in real time. Beforefull real-time capability, intermediate steps with e-transfer andcorrelation after the observing session will likely be necessary.GGOS will play a critical role in promoting standards by whichreal-time networks can operate and exchange data products ona global basis.
The data rates of observation of the space geodetic tech-niques will dramatically increase in the decade to come. GNSSstations will observe 100 instead of 30 satellites and the datarate may be as high as 50-100 Hz. Such high data rates willenable not only, for example, the observation of seismic eventswith GNSS observations (site motion during the earthquake)and subsequent determination of rupture parameters, but alsothe monitoring of rapid scintillations in the ionosphere. Thenew generation of VLBI telescopes will record about 10 timesas much data as the present setup data. The upcoming inSARmissions (like TerraSAR-X and TanDEM-X) will collect dataexpressed in petabytes (1015 bytes). The data infrastructure thatis capable to handle such huge amounts of data has not yet beendesigned nor developed, but should be part of GGOS in 2020.
9.9 GGOS User Interface: Database, Portal,and Clearinghouse
It is difficult to anticipate the development of web technologies,methodologies and approaches that will prevail in 2020. Con-sidering the development of the last ten to thirteen years andextrapolating this into the future suggests considerable changes
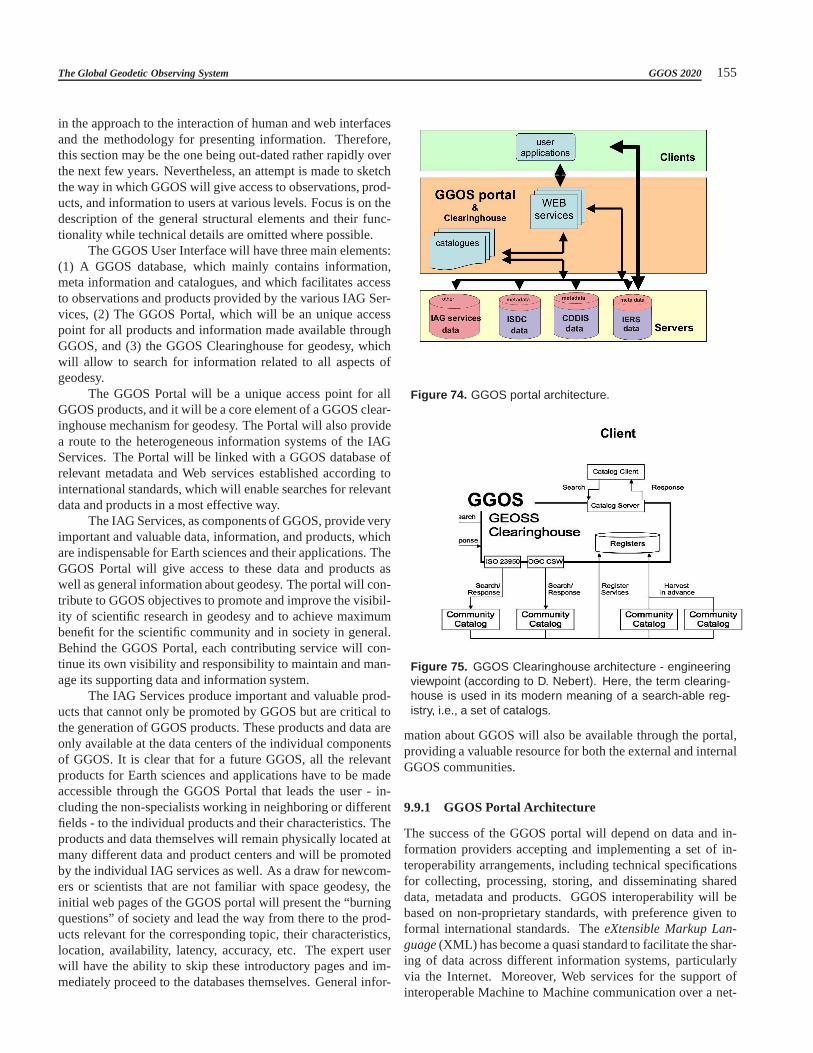
The Global Geodetic Observing System GGOS 2020 155
in the approach to the interaction of human and web interfacesand the methodology for presenting information. Therefore,this section may be the one being out-dated rather rapidly overthe next few years. Nevertheless, an attempt is made to sketchthe way in which GGOS will give access to observations, prod-ucts, and information to users at various levels. Focus is onthedescription of the general structural elements and their func-tionality while technical details are omitted where possible.
The GGOS User Interface will have three main elements:(1) A GGOS database, which mainly contains information,meta information and catalogues, and which facilitates accessto observations and products provided by the various IAG Ser-vices, (2) The GGOS Portal, which will be an unique accesspoint for all products and information made available throughGGOS, and (3) the GGOS Clearinghouse for geodesy, whichwill allow to search for information related to all aspects ofgeodesy.
The GGOS Portal will be a unique access point for allGGOS products, and it will be a core element of a GGOS clear-inghouse mechanism for geodesy. The Portal will also providea route to the heterogeneous information systems of the IAGServices. The Portal will be linked with a GGOS database ofrelevant metadata and Web services established according tointernational standards, which will enable searches for relevantdata and products in a most effective way.
The IAG Services, as components of GGOS, provide veryimportant and valuable data, information, and products, whichare indispensable for Earth sciences and their applications. TheGGOS Portal will give access to these data and products aswell as general information about geodesy. The portal will con-tribute to GGOS objectives to promote and improve the visibil-ity of scientific research in geodesy and to achieve maximumbenefit for the scientific community and in society in general.Behind the GGOS Portal, each contributing service will con-tinue its own visibility and responsibility to maintain andman-age its supporting data and information system.
The IAG Services produce important and valuable prod-ucts that cannot only be promoted by GGOS but are critical tothe generation of GGOS products. These products and data areonly available at the data centers of the individual componentsof GGOS. It is clear that for a future GGOS, all the relevantproducts for Earth sciences and applications have to be madeaccessible through the GGOS Portal that leads the user - in-cluding the non-specialists working in neighboring or differentfields - to the individual products and their characteristics. Theproducts and data themselves will remain physically located atmany different data and product centers and will be promotedby the individual IAG services as well. As a draw for newcom-ers or scientists that are not familiar with space geodesy, theinitial web pages of the GGOS portal will present the “burningquestions” of society and lead the way from there to the prod-ucts relevant for the corresponding topic, their characteristics,location, availability, latency, accuracy, etc. The expert userwill have the ability to skip these introductory pages and im-mediately proceed to the databases themselves. General infor-
Figure 74. GGOS portal architecture.
Figure 75. GGOS Clearinghouse architecture - engineeringviewpoint (according to D. Nebert). Here, the term clearing-house is used in its modern meaning of a search-able reg-istry, i.e., a set of catalogs.
mation about GGOS will also be available through the portal,providing a valuable resource for both the external and internalGGOS communities.
9.9.1 GGOS Portal Architecture
The success of the GGOS portal will depend on data and in-formation providers accepting and implementing a set of in-teroperability arrangements, including technical specificationsfor collecting, processing, storing, and disseminating shareddata, metadata and products. GGOS interoperability will bebased on non-proprietary standards, with preference giventoformal international standards. TheeXtensible Markup Lan-guage(XML) has become a quasi standard to facilitate the shar-ing of data across different information systems, particularlyvia the Internet. Moreover, Web services for the support ofinteroperable Machine to Machine communication over a net-
The Global Geodetic Observing System GGOS 2020 156
work are built on XML based standards (SOAP, WSDL).Data, products, and information from contributing IAG
services will becatalogued in a registry that is publicly ac-cessible through the clearinghouse. It is envisioned that thisclearinghouse is maintained collectively under the GGOS por-tal. The catalogue including thesauri will itself be subject toGGOS interoperability specifications, including the standardsearch and portrayal services.
The functions of the GGOS portal (e.g., search capabili-ties for stations, satellites, data, products, institutions, data min-ing tools, visualization, Web services, connections to other cat-alogues, etc.) are supported by the GGOS Clearinghouse (Fig-ure 74). The GGOS Clearinghouse will be an facility that col-lects and distributes information concerning the data cataloguesand services. In a broader sense, the GGOS Clearinghouse willallow for a dialog of stakeholders on relevant issues in geodesy.
The GGOS Portal will also provide access to a distributednetwork of catalogue services that support the interoperabilityagreements of GGOS. Contributing IAG Services may nom-inate catalogues containing structured, standards-basedmeta-data and other Web services for access by the GGOS Clear-inghouse. The Clearinghouse provides search capability acrossthe catalogues and their registered resources by mapping thesecatalogues. The GGOS portal will search the GGOS Clearing-house but will also provide access to other GGOS resourcese.g., calendar functions, bulletin boards, etc. Through the useof interoperability standards, additional portals may be estab-lished for national or professional communities to access theGGOS Clearinghouse.
The metadata to be held by the Clearinghouse is depen-dent upon the approach used for searching. Two anticipated ca-pabilities for access to remote catalogues (see Figure 75) mayinclude:
• Distributed search approach: search requests are sent inparallel to registered distributed catalogues of the IAG ser-vices.
• Harvested approach: The Clearinghouse periodically har-vests all metadata from registered distributed catalogues.A user search request is executed against the metadata har-vested from the remote catalogues and the results are man-aged and portrayed in the GGOS Clearinghouse.
9.9.2 GGOS Portal Goals and Objectives
The GGOS Portal will provide a Web site that:
• represents a single Web access point (door of entry) for allgeodetic products relevant in the framework of GGOS
• offers a set of tools for organized knowledge discovery in-cluding visualisation to assist identification and selectionof appropriate resources (information, data, products),
• access the GGOS clearinghouse to search data catalogues,products and data sets generated by GGOS components
• helps in answering the “burning questions of society” andleads the way to the products, their characteristics, loca-tion, availability, latency, and accuracy
• allows searching and information retrieval of descrip-tive metadata from multiple, diverse target resources,databases, webpages, and library catalogues
• provides access to general information about GGOS.
Functions to be covered by the GGOS Portal include butare not limited to:
• Basic functions of the GGOS Web site such as hot spotinformation, news, tutorials, quick links, announcements,etc.
• A registry to host catalogues for metadata for all “prod-ucts” of the IAG services relevant to GGOS based onGGOS standards to ensure interoperability within theGGOS community and to other systems, in particularGEOSS.
• Search (temporal, spatial, multi-technique, keywords,etc.) of metadata, data, and product databases.
• Visualization of products (time series, maps, etc.).
• Information on and explanations of data, products, andgeodetic techniques, with direction to service-specific re-sources.
The GGOS Portal will have to be based on an open-sourceplatform and Web portal application allowing users to down-load, install and customize the portal services in their ownen-vironment. Based on modern architecture, standards and Webservices the GGOS portal can be realized not only by single in-stitutions but also by consortia with distributed server architec-ture. The portal should be designed and implemented in sucha fashion to permit mirroring/installation at alternate physicallocations.
9.9.3 A GGOS clearinghouse mechanism for geodesy
A major function of the GGOS Clearinghouse will be the ac-cess to information on observations, products, and informationrelevant to GGOS, IAG, and geodesy in general. In a broadersense, the GGOS registry, Portal and Search engines should becomplemented by a general clearinghouse mechanism (com-parable to the clearinghouse mechanism for the Conventionon Biodiversity, which links all stakeholders of the Conven-tion; see http://www.cbd.int/chm/default.shtml). The missionof such a future GGOS clearinghouse mechanism would be tocontribute to the implementation of GGOS, its standards, andits conventions, for the maximum benefit of its users, throughthe promotion and facilitation of technical and scientific coop-eration, among the IAG Services and Commissions, other or-ganizations in Earth observation including but not limitedto

The Global Geodetic Observing System GGOS 2020 157
GEO, other relevant organizations, and stakeholders. In par-ticular, the GGOS clearinghouse mechanism should have threemajor goals:
• Promote and facilitate technical and scientific cooperation,among the IAG Services and Commissions, among GGOScomponents and other organizations, and within and be-tween countries.
• Develop a global mechanism for exchanging and integrat-ing information on geodesy.
• Develop the necessary human and technological network.
Such an extended clearinghouse mechanism would have tobe compatible with different levels of national/componentca-pacity, driven by users’ needs, and structurally decentralized.It would provides access to information, support decision-making, and have no vested interest in controlling the expertiseor information. Thus, it would be created for the mutual benefitof all IAG Services and Commissions and other stakeholders.
The activities of this clearinghouse mechanism wouldsupport GGOS’ thematic and cross-cutting work programs bypromoting cooperation, exchanging information and develop-ing a network of partners. A first priority would be to ensureuniversal access to the GGOS Implementation Plan, includ-ing the underlying documents of the GGOS 2020 process, theGGOS Standards, and Conventions. The information providedwould include case studies, national reports, and other relevantdocumentation. The mechanism would increase public aware-ness of the geodetic programs, issues, and products, includingthe relevance of the global terrestrial reference frame. Itwouldbe established as an Internet-based system to facilitate greatercollaboration among the IAG Services and Commissions, theGGOS stakeholders, across national borders, through educationand training projects, research cooperation, funding opportuni-ties, access to and transfer of technology, and repatriation ofinformation.
This clearinghouse mechanism would be based on thephilosophy that broad participation and easy access must beatop priority. The underlying database can therefore be tappedthrough both traditional and electronic means of communica-tion. Special efforts will have to be made to ensure the partici-pation of organizations and institutions in developing countries,an issue expected to be of high relevance also in 2020.
9.10 Data analysis, combination, modeling, andproducts
A major function of GGOS will be to facilitate the integra-tion of the various levels of GGOS into a consistent observingsystem (Figure 76) delivering products and services as far aspossible independent of the observing techniques and the pro-cessing. Considering the multi-technique, multi-components,and multi-parameter nature of GGOS, this will require con-sistency of processing strategies, models and standards across
Figure 76. Combination and integration of the geodetic ob-servation techniques. The combined infrastructure allows thedetermination and maintenance of the global geodetic refer-ence frames, and the determination of Earth’s gravity fieldand rotation. The ground networks and navigation satellites(currently in particular GPS) are crucial in positioning, withapplications to all SBAs. In particular, they allow the moni-toring of volcanoes, earthquakes, tectonically active regionsand landslide-prone areas. The Low Earth Orbit (LEO) satel-lites monitor sea level, ice sheets, water storage on land, at-mospheric water content, high-resolution surface motion, andvariations in the Earth’ gravity field. The latter are cause, toa large extent, by regional and global mass transport in thehydrological cycle.
all components of GGOS. GGOS will facilitate communica-tion and standardization between the analysis centers for theindividual techniques and sensors, initiate intercomparison ofproducts generated by the various components, and promotethe study and modeling of technique-specific effects and othergeodetic/geophysical signals. Redundancy and reliability willbe achieved by having more than one analysis center for themajor tasks and by developing full reprocessing capabilities forall data types.
Combination of the geometric products is currentlyachieved by IERS. IGFS is developing the combination capa-

The Global Geodetic Observing System GGOS 2020 158
No. Parameter VLBI GNSS DORIS SLR LLR Alti-PRARE metry
1 Quasar Coordinates X2 Nutation X (X) (X) X3 Polar Motion X X X X X4 UT X5 Length of Day X X X X6 Coordinates and Velocities X X X X X (X)7 Geocenter X X X X8 Gravity Field X X X (X) X9 Orbit X X X X X
10 LEO X X X X11 Ionosphere X X X X12 Troposphere X X X X13 Time/Frequency (X) X (X)
Table 16. Parameter Space fora rigorous combination and inte-gration of the geodetic observa-tion techniques. Entry 1 definesthe ICRF. Entries 2 to 5 relatedto the EOPs. Entries 6 and 7 to-gether define the ITRF, while en-tries 7 to 10 are related to thegravity field. The atmosphere iscovered by entries 11 and 12.
Figure 77. Interactions in the Earth System centered aroundthe three pillars of geodesy.
bilities for the gravimetric products. The borderline betweenand potential overlap of IERS and IGFS (Figure 77) will re-quire careful attention of GGOS. GGOS will have to facilitatecombination across the full parameter space (Figure 16) andfully utilize synergies and advantages of the combination ap-proach together with IERS and IGFS.
A central issue for achieving consistency and highly ac-curate products will be the GGOS Conventions. Currently, theconventions in the fields of geometry and rotation are takencare of by the IERS. In the future, these conventions will haveto be extended to fully cover the gravity field as well. Theywill have to address the geodetic, geophysical, geodynamic,etc. models to be used or, if not sufficient, to be developed.Coupling of models from oceanography, meteorology, geodesy,geophysics, glaciology, mass transport, energy budget, willhave to be addressed in order to achieve the GGOS accuracygoal. As pointed out in Chapter 8, 4-D Earth system modelingand the assimilation of diverse data into these 4-D Earth systemmodels will have to be studied and eventually be covered by theconventions. Thus, the need for modeling and/or assimilation
centers may arise. The importance of global geophysical fluidsfor validation will give a high weight to the GGFC or an equiv-alent component of GGOS. However, the tools and methods forvalidation need more research and development.
It is evident that the GGOS observing system has to bemore than just a Earth observing system collecting a tremen-dous amount of data. The recorded observations have to be an-alyzed with state-of-the-art processing software and processingstandards to generate time series of relevant geodetic, geody-namic, geophysical, hydrological and atmospheric parameters.To reach consistency between the different observation tech-niques the results of the individual techniques have to be rigor-ously combined an integrated using the information on the localties between the different instruments at co-location sites andsatellites. Finally, the resulting products have to be validatedand interpreted by making use of physical, geophysical modelsand modeling software packages and by using additional ob-servation data from other disciplines as, e.g., the meteorologi-cal, oceanographic, hydrological, etc. communities and madeavailable to science and society through user-friendly, transpar-ent mechanisms (e.g., the GGOS portal and data managementsystems).
Data analysis centers and centers combining the solutionsfrom different analysis centers and from different observationtechniques and generating a series of well-defined GGOS prod-ucts. Institutions and groups are also needed that constructgeodetic, geodynamic, geophysical models of the processesinthe Earth system based on the GGOS products, confront thesemodels with the GGOS products and interpret the processes inthe Earth system and the interaction between the various com-ponents of this system. Finally, the products have to be care-fully validated.
With respect to the data analysis itself, software and mod-eling improvements are foreseen in form of the development ofnew tropospheric mapping functions, gradient models, and at-mospheric turbulence models. Further areas of improvementare loading effects including mass loading models for hydro-logical variables, thermal and gravitational antenna deforma-tions, and source structure effects. In addition, new analysis

The Global Geodetic Observing System GGOS 2020 159
strategies will be investigated, in particular, the generation ofconsistent VLBI multi-purpose solutions for TRF, EOP, andCRF. Also the software noise of solutions obtained from dif-ferent software packages will be studied.
The processing and analysis procedures will have toprogress towards fully automated processing in near real-timeor even in real-time (particularly for early warning systems,GNSS seismology, atmosphere and ionosphere sounding). Fullreprocessing capabilities for all data available will be crucial inorder to provide long and temporally consistent time series. Akey development will allow for combination of all data typesonthe observation level. This includes the combination of terres-trial data with LEO data (co-location, gravity, geocenter,atmo-sphere) as well as the combination with satellite altimetrydataand with InSAR and/or lidar. Finally, the combination of prod-ucts from different analysis centers will increase redundancy,reliability, and accuracy.
The major outcome of the GGOS system in 2020 is a setof highly accurate, consistent and long-term stable products asthe geodetic contribution to the observation and monitoring ofthe Earth system (i.e., to GEOSS, IGOS-P and other interna-tional and regional initiatives). The high-level list of productsis given in Section 7.5. All GGOS product accuracies in 2020shall be of the order of about 10−9 measured relative to theabsolute values of the measured quantities. Asking for theseaccuracies is, however, not sufficient. In order to serve thepur-poses mentioned, consistency between all GGOS products onthe 10−9 level is required, as well.

The Global Geodetic Observing System GGOS 2020 160
10 Towards GGOS in 2020
G. Beutler, M. Pearlman, H.-P. Plag, R. Neilan, M. Rothacher,R. Rummel
This chapter is devoted to the implementation of GGOS,addressing mainly the organizational aspect mentioned in Sec-tion 1.3. GGOS monitors (maintains) the geometric and gravi-metric reference frames and provides the transformation be-tween the systems with the state of the art observational tools.In doing so, GGOS provides the observational basis to deter-mine mass transport in the Earth system and thus serves theEarth science community with Earth observations and geodeticproducts relevant for many studies. The accuracy of and theconsistency between all GGOS products shall be on the10−9
or better level.
10.1 The GGOS high-level components
The tasks of GGOS outlined in Section 7.4 ask for the followingcomponents (entities):
1. Terrestrial, technique-specific entitiescoordinating theworldwide collection and primary analysis of the observa-tions and the generating unique technique-specific prod-ucts,
2. Entities combining the technique-specific productsandto come up with technique-independent, combined seriesof products,
3. An Entity proposing the geodetic (and geodesy re-lated) space missionsin collaboration with the majorspace agencies (including geodetic missions to the Moonand other planets), resulting in anuninterrupted seriesof geodesy-related space missionsto observe the time-varying gravity field, the time-varying sea-surface and ice-surface topography, and to maintain the geometric andgravimetric reference frames,
4. An entity for communications and network coordina-tion to design and continuously improve the GGOS net-work,
5. Bureau of Standardsto deal with first five bullet pointslisted in Section 7.4, i.e. the conventions for the referencesystems and frames and the geodetic standards.
6. Central Coordination Office to coordinate the activitiesof the above GGOS entities and to provide the interfaceto the GGOS user community and the political decisionmakers.
Many of the above entities, in particular the technique-specificnetworks and the center for combination of the geometry-related products and Earth rotation, already exist. These exist-ing elements may need modification, fine-tuning, or improvedcoordination between them. It also may be necessary to put
some of the existing elements on a new funding basis (see Sec-tion 10.3).
The GGOS elements of Levels 2 and 3 (see Section 9.1)related to geometry are in essence in place (GNSS and laserranging satellites, including our Moon with its laser reflectors).
The same is not true for the space missions monitoringthe Earth’s gravity field and measuring sea- and ice-sheet to-pography. Admittedly, we are looking back to a long series ofaltimetry missions to establish the sea surface topography. Inaddition, with the missions CHAMP, GRACE, and GOCE, animpressive series of gravity missions is currently active or beingdeployed in the near future. There are, however, no consistentplans for monitoring the gravity field and the fluid componentson a long term basis. GGOS shall develop a master plan formissions monitoring the Earth’s gravity field and the geometryof the solid Earth, oceans and ice sheets. This task has to beseen in analogy to monitoring the geometrical components ofthe geodetic reference system. Therefore, GGOS shall have anentity for proposing the geodetic space missions, which mustclosely cooperate with the space agencies.
The proposed GGOS structure is visualized in Figure 78.GGOS needs a decision making body. For this purpose, GGOSshall have a Steering Committee, in which all shareholders arerepresented, in particular the IAG Services and Commissions.This Steering Committee is the GGOS Plenary that decideson the general strategy and policy guiding the development ofGGOS. For the day-to-day work, a smaller Executive Com-mittee is proposed, which prepares proposals for the SteeringCommittee and oversights the work of the the Central Coordi-nation Office according to the decisions of the Steering Com-mittee.
GGOS needs a Science Panel composed of the leadingexperts in geodesy and (more generally) in Earth sciences toensure the GGOS focus to remain on the relevant scientific andsocietal needs. This panel is the main scientific advisory groupfor the GGOS Steering Committee.
To a large extent, this structure is defined in the GGOSTerms of Reference (ToR). The current version of the ToR wasaccepted by IAG during the IUGG meeting in Perugia, Italy,in July 2007. The IAG By Laws of as accepted there, too, de-fine GGOS as IAG’s Observing System as an IAG entity on thesame (hierarchically highest) level as its Commissions andSer-vices. Consequently, the GGOS Chair, appointed by the IAGExecutive Committee, is a member of the IAG Executive Com-mittee.
10.2 Building on the heritage
Let us briefly browse through the existing and the plannedGGOS infrastructure. We review the infrastructure level bylevel (see Section 9.1).
10.2.1 Level 1: the terrestrial geodetic infrastructure
The terrestrial part of GGOS at present consists of
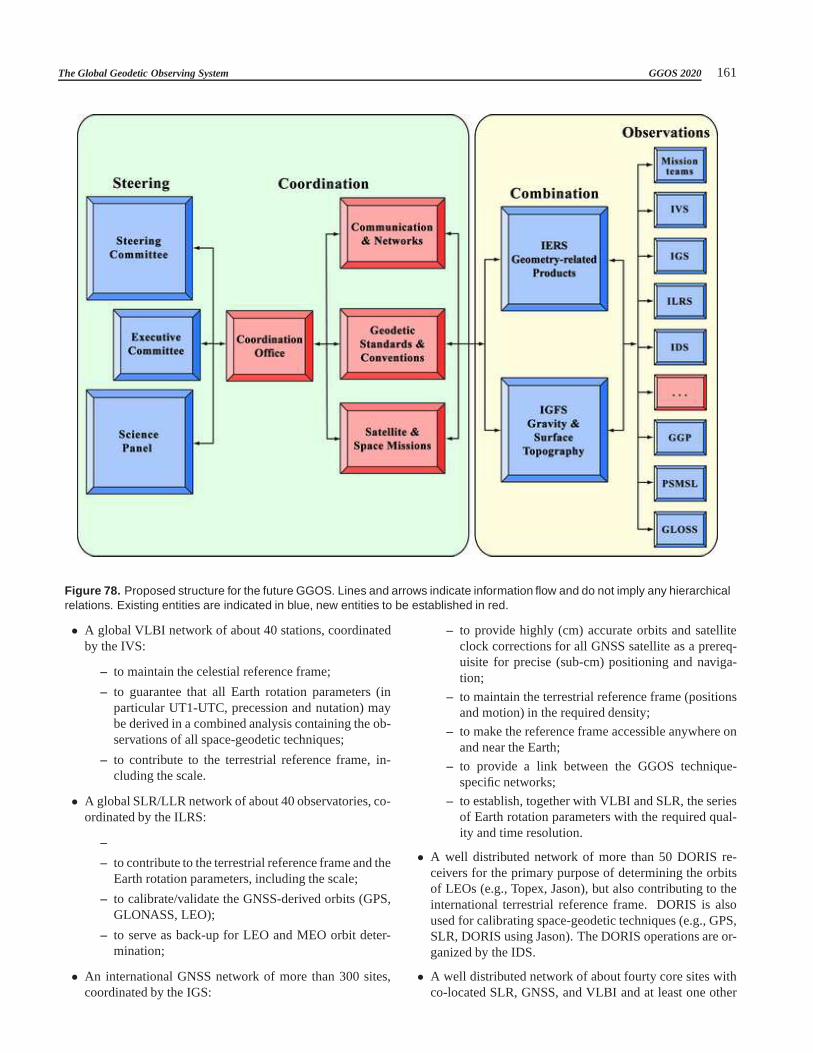
The Global Geodetic Observing System GGOS 2020 161
Figure 78. Proposed structure for the future GGOS. Lines and arrows indicate information flow and do not imply any hierarchicalrelations. Existing entities are indicated in blue, new entities to be established in red.
• A global VLBI network of about 40 stations, coordinatedby the IVS:
– to maintain the celestial reference frame;
– to guarantee that all Earth rotation parameters (inparticular UT1-UTC, precession and nutation) maybe derived in a combined analysis containing the ob-servations of all space-geodetic techniques;
– to contribute to the terrestrial reference frame, in-cluding the scale.
• A global SLR/LLR network of about 40 observatories, co-ordinated by the ILRS:
–
– to contribute to the terrestrial reference frame and theEarth rotation parameters, including the scale;
– to calibrate/validate the GNSS-derived orbits (GPS,GLONASS, LEO);
– to serve as back-up for LEO and MEO orbit deter-mination;
• An international GNSS network of more than 300 sites,coordinated by the IGS:
– to provide highly (cm) accurate orbits and satelliteclock corrections for all GNSS satellite as a prereq-uisite for precise (sub-cm) positioning and naviga-tion;
– to maintain the terrestrial reference frame (positionsand motion) in the required density;
– to make the reference frame accessible anywhere onand near the Earth;
– to provide a link between the GGOS technique-specific networks;
– to establish, together with VLBI and SLR, the seriesof Earth rotation parameters with the required qual-ity and time resolution.
• A well distributed network of more than 50 DORIS re-ceivers for the primary purpose of determining the orbitsof LEOs (e.g., Topex, Jason), but also contributing to theinternational terrestrial reference frame. DORIS is alsoused for calibrating space-geodetic techniques (e.g., GPS,SLR, DORIS using Jason). The DORIS operations are or-ganized by the IDS.
• A well distributed network of about fourty core sites withco-located SLR, GNSS, and VLBI and at least one other
The Global Geodetic Observing System GGOS 2020 162
measurement technique (gravimetry or DORIS) at siteswith acceptable weather and geological conditions. Atleast four of these sites should have full LLR capability.
• The IERS combining the products emerging from thetechnique-specific Services and issuing the products re-quired for the terrestrial and celestial reference frame, in-cluding the series of Earth rotation parameters.
• A global network of absolute gravity sites and supercon-ducting gravity sites co-located with space-geodetic refer-ence stations with the goal to tie the geometric referenceframe with high long-term stability to the CM.
• A global network of tide gauges collocated with perma-nent GNSS sites.
In view of the impressive number of properly working IAG Ser-vices (Figure 78) with their fully working networks and dataprocessing elements, GGOS must be built on this very valuableheritage.
10.2.2 Level 2: the LEO satellite missions
The satellite gravity-related part of GGOS is not in a position asgood as the geometry-related GGOS-parts. It currently consiststhe IGFS, and the individual satellite mission teams, and itshallbe augmented by a Satellite Mission entity. It should be statedthat the IGFS has not (yet) assumed the role of comparing andcombining gravity field results from all missions. Neither doesit incorporate the results of the altimetry missions. The en-tity for Satellite Missions does not exist either. Attemptsto es-tablish a mission-independentInternational Altimetry Service(IAS) have not been succesfull so far, and the establishmentof an IAS should have high priority. Likewise, GGOS shouldpromote the establishment of a mission-independent globalIn-SAR entity, preferably as a service. However, for both satellitealtimetry and InSAR, question of access to the proprietary datais a major obstacle that GGOS needs to address in interactionwith the space agencies and, potentially, GEO.
10.2.3 Level 3: The GNSS and SLR satellites
A considerable number of “cannonball” satellites (Lageos 1and 2, Starlette, etc.) were launched for geodetic purposesinthe20th century. The continued observation of these satellitesand the analysis of their observations are essential to derive,for example, the geocenter location w.r.t. the GGOS networkand the (other) low degree and order coefficients of the Earth’spotential. The deployed SLR satellites provide continuityovercenturies.
In the near future there will be three fully operationalGNSS based on the same principles of operation (GPS,GLONASS and GALILEO). The observation of all availableGNSS satellites through GGOS (with all suitable techniques)will be important, from the point of view of the number ofterrestrial observing sites. Moreover, many (if not most) Low
Earth Orbiters (LEOs) deployed for Earth observation are orwill be equipped with GNSS receivers and SLR reflectors toallow for an independent validation of the orbit quality derivedfrom the microwave observations. It is therefore extremelyim-portant for GGOS that all GPS-, GLONASS-, and GALILEO-spacecrafts will be equipped with SLR reflectors. Co-locationin space is the analogy of co-location on the ground.
10.2.4 Level 4: lunar and planetary “geodesy” and mis-sions
Our Moon is in many respects “just another satellite’. Thanksto its extremely low “cross section to mass ratio” (comparedtothe corresponding ratios for the artificial satellites) thelunar or-bit offers in addition the unique opportunity to test the theoriesof gravitation. For monitoring the development of the distancebetween Earth and Moon and for the test of theories of gravita-tion it is therefore essential that LLR to the reflectors deployedby the Apollo missions and Russian spacecrafts is continuedatleast until transponders on the Moon and other planets becomeavailable. The lunar retro-reflectors provide long-term continu-ity for LLR.
When exploring our Moon, the planets and their satellitesof our planetary system there are a number of issues, which canonly be addressed using the geodetic techniques, which wereestablished when exploring the dynamics of the Earth. Let usmention in particular:
• establishment of a body-fixed reference frame (corre-sponding to the terrestrial reference frame);
• determination of the body’s rotation (corresponding toEarth rotation); note that the celestial reference frame, es-tablished and maintained by the IVS, is a prerequisite forstudying the rotation of such bodies;
• determination of the body’s gravity field (via the trajecto-ries of orbiters, including the gravity field of the Moon);
• evolution of the planets’ satellite system (including theevolution of the Earth-Moon system);
• determination of the body’s surface (via altimeter).
There have been and there will be a number of missions to theMoon and to other planets, where some of these issues wereand will be addressed so-to-speak as by-products. The geode-tic exploration of other celestial bodies should be studiedin amuch more consistent way in the future.
10.2.5 Level 5: the extragalactic objects
The Quasars and their signals are the only objects observed byGGOS, which need not be deployed. It is a primary task of theIVS to define and maintain a list of quasars with their coordi-nates for geodetic purposes. The IVS was given this duty byIAG (through IUGG) and IAU (the International AstronomicalUnion). Although the Quasar distances are large enough that

The Global Geodetic Observing System GGOS 2020 163
proper motion can be neglected, the center of the microwaveradiation may slightly vary. The task of selecting the objectsfor geodetic purpose is therefore not trivial.
10.3 Organizational considerations
10.3.1 History
The IAG has a long tradition of establishing scientific services.The first one, theInternational Latitude Service(ILS) was cre-ated under the auspices of IAG at the end of the19th century.Its creation is in a way exemplary for the motivation to createthe GGOS: The creation of the ILS was based on the need tomonitor Earth rotation, in particular polar motion (which at thattime could by established by latitude observations with astro-nomical telescopes). The ILS, then its successor, theInterna-tional Polar Motion Service(IPMS) were remarkably stable:Series of polar motion determinations were generated by theseServices for about eighty years. Thanks to theses Services weare today in possession of more than one hundred years of polarmotion data. The ILS, BIH, and the IPMS were directly fundedby the government agencies for the declared purpose of moni-toring the rotation of the Earth, which also included the defini-tion and realization of universal time. Today we are deeply in-debted to our forefathers for having initiated the geodeticstudyof the Earth as a whole, based on a worldwide collaborationof institutions and backed up by governmental commitments.With GGOS we want to achieve a comparable system to servethe needs of the21st century.
10.3.2 The revolution invoked by space geodesy
The funding situation in the field of geodesy and geodynam-ics changed dramatically in the second half of the20th cen-tury. With the replacement of optical astrometry by the rapidlydeveloping space geodetic techniques, Earth monitoring forgeodetic and geodynamics purposes was funded to a great ex-tent by research and development funds. This step was also jus-tified by the fact that modern space geodetic methods openedthe way to study not only aspects related to Earth rotation, butprovided the metrological basis for a much wider range of ap-plications (from global studies to regional and local ones). Inthe 1990s it also became evident that technique-specific ser-vices had to be created in order to exploit the full scientificpotential of the new techniques. First the IGS, then the ILRS,the IVS,and eventually the IDS were created.
10.3.3 Current situation
The technique-specific IAG Services were established throughcalls for participation without offering funding for operations.Today, these Services are therefore based on a voluntary collab-oration of the contributing organizations. Naturally, thefund-ing situation differs from country to country (sometimes evenfrom institution to institution). It may be puzzling for govern-ment representatives and science managers that despite consid-
erable uncertainties the IAG Services were so successful andstable. However, the question needs to be asked whether thismodel can be sufficient in the long run.
GEO is building the GEOSS to a large extent on the sameprinciple of voluntary commitment and best effort of those con-tribution. The experience of the successful IAG Services showsthat this principle requires a high degree of redundancy, andat the same time is problematic for providing a uniform globalcoverage of ground-based infrastructure. In particular for refer-ence frame maintenance, large spatial gaps and temporal varia-tions in the monitoring infrastructure (including changesin thepolyhedron through new and disappearing stations) cause tem-poral inhomogeneities and degradations of accuracy.
In 2001 the IAG council approved, upon recommendationof the IAG Executive, a new structure with the GGOS project asthe Association’s flagship. It was the intention to view moderngeodesy from the global perspective and to bundle the effortsof all branches of this science to serve one and the same goal.This report should be viewed as the principal result of the workof the GGOS planning committee (2003-2005) and the GGOSimplementation committee (2005-2007).
10.3.4 Internal organization of GGOS
In Section 10.2 it was argued that GGOS must be built on thefoundation of the IAG Services developed in the late20th cen-tury. In Section 10.3.6 the two essential elements of the GGOSenvironment, namely the GEO (and its attempt to establish itsGEOSS) and IGOS-P were introduced. The required GGOSstructure was laid out in Section 10.1 (Figure 78). GGOS shallhave
• A Steering Committee as the pleanry and decision-makingcomponent with representation of the shareholders;
• A Science Panel with broad expertise providing scientificadvice to the Steering Committee;
• An Executive Committee developing GGOS along thestrategy and guidelines decided upon by the SteeringCommittee;
• A future Coordination Office responsible for the day-to-day operations;
• Three future entities (for satellite missions, geodetic stan-dards, and networks and communications).
GGOS shall be based on the infrastructure provided by the IAGServices, i.e.
• Two combination Services (IERS and IGFS)
• The technique-specific Services (IGS, ILRS, IVS, IDS,IGeS, GGP), the satellite and space mission teams, andfuture services such as an IAS and an InSAR services.

The Global Geodetic Observing System GGOS 2020 164
The missing parts of GGOS shall be created as soon aspossible. Their creation should be based on a call for participa-tion issued by the IAG. A recommitment under the new bound-ary conditions (and an adapted list of duties and deliverables)shall be initiated for the established parts of GGOS.
Prior to issuing the calls for participation and recommit-ment this report and proposal shall be discussed with the princi-pal sponsoring agencies (including the umbrella organizations).The conclusions and findings of this report shall serve as thebasis for the deployment of the future GGOS.
10.3.5 Integration of relevant regional activities
GGOS will actively seek participation of regional geodeticpro-grams to augment the GGOS global coverage in order to makethe most economic use of available resources.
10.3.6 Integration of GGOS into global programs
It is encouraging to note that recently the necessity to preservethe infrastructure for global Earth observation was recognizedon the ministerial level (see also Sections 1.3 and 5.1). In2003, thead hocGEO was established as a result of a G8-meeting, and guided by a series of three ministerial-level EarthObservation Summits, GEO developed a plan for the imple-mentation of GEOSS (see Chapter 5 for an overview or GEO,2005a,b, for background information). In 2005, GEO was es-tablished permanently, and currently, this group includesmorethan 70 member countries and more than 45 participating orga-nizations. GEO is establishing the GEOSS with the visiontorealize a future wherein decisions and actions to the benefitofhumankind are informed via coordinated, comprehensive andsustained Earth observations and information(GEO, 2005a).GEOSS is building on and adding value to existing Earth-observation systems by coordinating their efforts, addressingcritical gaps, supporting their interoperability, sharing informa-tion, reaching a common understanding of user requirements,and improving delivery of information to users.
The IAG, represented in GEO by GGOS Delegates, is oneof the very active participating organizations. GGOS clearlymust be developed taking into account its role as a crucial partof the GEOSS. GGOS may be viewed as the metrological basisfor all parts of the GEOSS.
The importance of geodesy and, in particular, GGOS, forEarth observations is increasingly acknowledged by GEO andcomparable organization, as well as their users, such as UnitedNations authorities and scientific projects. Further progress ingeodetic techniques and products is seen as an essential steptowards a better understanding of the Earth system to the bene-fit of mankind. This has been recognized by GEO in includinga task specifically addressing the geodetic reference frames inthe GEO Work Plan 2007-2009.
GGOS is coordinated scientifically by IAG. On a higherorganizational level, GGOS must be associated with that inter-national organization, which eventually will have all the otherglobal observing systems under its auspices. Assuming a suc-
cessful establishment of GEOSS, it is clear that the GGOS mustbe one of the systems in GEOSS. However, in order to improvethe funding situation and to establish a firm link to an appropri-ate intergovernmental authority, GGOS should also be associ-ated with an UN body, where UNESCO appears to be the ap-propriate choice. It is expected that this umbrella organizationwill sponsor parts of the GGOS elements. IAG will provide (asit did so far) the scientific umbrella and expertise for GGOSand it will provide, through GGOS, the link to the umbrellaorganization.

The Global Geodetic Observing System GGOS 2020 165
11 Recommendations
H.-P. Plag, G. Beutler, R. Gross, T. A. Herring, P. Pauli, C.Rizos, M. Rothacher, R. Rummel, D. Sahagian, J. Zumberge
In this Chapter, we summarize the recommendations ofthe GGOS 2020 Writing Team. The recommendations arenumbered, with the first number indicating the chapter fromwhich a recommendation originates.Recommendation 1.1 (Transition from research to opera-tional):Recognizing that
geodesy has an large potential to help meeting the chal-lenge in reaching sustainable development for a global societyon a changing planetit is recommended that
IAG and GGOS engage in improving the framework con-ditions for fully utilizing the potential of geodesy for Earth ob-servation by actively promoting a transition of the geodetic ob-serving system from research to operational, and facilitate theestablishment of an operational core of GGOS with sufficienthuman resources for a sustained operation of this core.Recommendation 1.2 (Global reference systems):Recognizing that
the global geodetic reference frames are fundamental forall Earth observationsit is recommended that
IAG and GGOS facilitate, particularly in the frame ofGEO, international agreement on global geodetic referencesys-tem.Recommendation 1.3 (Outreach and Eduction):Recognizing that
society to a large extent is not aware of the vital roleplayed by geodesy for realizing a sustainable development,andthat
educational aspects are extremely important (becausethey have the greatest implication on societal behavior) inorderto prepare future generations to make use of the full benefitsofgeodesyit is recommended that
IAG and GGOS make dedicated outreach efforts to sci-ence and society at large with the goal to promote geodesy’srole in reaching sustainable development and to integrate thisrole of geodesy appropriately into education.Recommendation 3.1 (Towards new reference systems):Recognizing that
the combination of geodetic measurements from GGOSwill require new definitions of a terrestrial reference system anda consistent realizations of this systemit is recommended that
particular attention be paid in GGOS to the developmentof these new reference systems.Recommendation 4.1 (Promotion of ITRS and maintenanceof ITRF):Recognizing that
a stable and accurate geodetic reference frame must un-derpin Spatial Data Infrastructures, to ensure that all geo-referenced data used by a wide range of community groups andgovernment agencies is unambiguously linked to the geodeticfoundationit is recommended that
ITRS be employed as the global geodetic reference sys-tem for SDI, and that
the ITRF be maintained and made accessible with an op-erational core ensuring ITRF with the accuracy, long-term sta-bility, and accessibility required by SDI applications.Recommendation 4.2 (The link between science and appli-cations):Recognizing that
geodesy plays a vital role with respect to sustainable de-velopment, the provision of community services, support formany vital industries, security and emergency management,mapping and navigation, and othersit is recommended that
the link between “scientific geodesy” and “practical (oroperational) geodesy” be strengthened, and made explicit sothat national geodetic agencies are reminded of the mutual ben-efits of these two parts of geodesy, and of the fundamental con-tribution of geodesy to their mission.Recommendation 4.3 (Links of IAG to other professionalorganizations):Recognizing that
geodesy and GGOS are relevant to an number of interna-tional and national scientific and professional sister organiza-tions of IAG, including, but not restricted to ISPRS, FIG, IAIN,IEEE, and IUGGit is recommended that
the IAG continue to work closely with these organizationsby promoting the GGOS vision and its activities.Recommendation 4.4 (Embracing new technologies):Recognizing that
there is a rapid technological development integrated intoprofessional applications of geodesyit is recommended that
GGOS embrace new geoinformation/geodetic technolo-gies such as DInSAR, GNSS-RTK, structural monitoring sys-tems, and multi-sensor precision navigation systems, in anin-tegrated manner to address different spatial and temporal userrequirements for high accuracy geometric information thatisunambiguously tied to a rigorous geodetic framework.Recommendation 5.1 (Representation in Earth ObservationCommittees):Recognizing that
geodesy provides the metrological basis enabling Earthobservation with the required accuracy and that
the global geodetic reference frame is a fundamental con-tribution to global Earth observationit is recommended that
GGOS maintain a formal representation in existing Earthobserving coordination committees (international bodiesand

The Global Geodetic Observing System GGOS 2020 166
commissions), and establishes links to relevant committees asappropriate..Recommendation 5.2 (Real-time access to data of GNSStracking stations):Recognizing that
real-time or low-latency access to geodetic observations,in particular GNSS observations, is increasingly important forapplications in numerical weather predictions, space weatherpredictions, early warnings, and other societal applicationit is recommended that
existing and future ground-based GNSS sites installed bygeodesists be connected in near-real time to GNSS data andanalysis centers thus enabling these non-geodetic applications,and that
future geodesy missions using GNSS receivers be radiooccultation-compatible, whenever possible, and that the corre-sponding subsequent data processing can be done outside thegeodesy mission.Recommendation 5.3 (Gravity field and circulation mod-els):Recognizing that
detailed knowledge of the Earth’s gravity field is impor-tant for atmosphere and ocean circulation modelsit is recommended that
that GGOS establish proper contacts and interfacing tothe Earth system modeling community with the goal to discussimprovements of the gravity field representation in circulationmodels.Recommendation 5.4 (GNSS and climate studies):Recognizing that
GNSS observations are an important information sourcefor climate studies related to water vaporit is recommended that
GGOS (through its components) continue archivingGNSS observation and all necessary data for future climatestudies, and that
long-term funding for this archiving be secured from rel-evant climate programs.Recommendation 5.5 (GGOS and monitoring of the globalwater cycle):Recognizing that
geodetic observations are fundamental for monitoring theglobal hydrological cycle on global to local scalesit is recommended that
GGOS encourage and support a global water cycle ser-vice that provides information on changes in the water storageon land, in ice sheets and in the ocean on a routine basis, po-tentially through assimilation of the geodetic observations in aEarth system model consistently treating the geodetic observa-tions.Recommendation 5.6 (GNSS seismology):Recognizing that
GNSS can potentially contribute to the near-real time de-termination of the seismic magnitude and associated displace-ment field of particularly great earthquakes
it is recommended thatGGOS promote the development of GNSS seismology
particularly for early warning and disaster assessment pur-poses.Recommendation 6.1 (GGOS in support of planetary mis-sions):Recognizing that
planetary geodesy, radio science, interferometry (includ-ing imaging VLBI, astrometric VLBI, and Earth-Space VLBI),and inter-planetary navigation all require an accurate geodeticfoundation, and that
although the performance of GGOS is not a limiting fac-tor in all of these applications, future requirements will be moredemanding, especially those imposed by inter-planetary navi-gation, and in some cases exceeding present-day capabilities ofGGOSit is recommended that
GGOS be developed in order to meet these future require-ments, that in particular
GGOS allow the real-time determination of Earth orien-tation accurate to≤ 3 mm, and that
GGOS enable calibrations of troposphere delay and iono-sphere accurate to≤ 3 mm and≤ 2 TEC units, respectively.Recommendation 7.1 (Threshold and target values forGGOS):Recognizing that
it will not always be possible to implement the observingsystem meeting all observational requirementsit is recommended that
GGOS set up, together with relevant user groups, thres-hold and target values in terms of accuracy, spatial and tem-poral resolution, latency, and integrity, for the quantities to beobserved or derived from geodetic observations.Recommendation 7.2 (GGOS database of user needs andobservational requirements):Recognizing that
the user needs and observational requirements with re-spect to geodetic observations and products will evolve overtimeit is recommended that
GGOS maintain a database of user requirements and alist of products to be provided by GGOS in order to meet theseevolving requirements.Recommendation 7.3 (Improved access to ITRF):Recognizing that
the global geodetic reference frame and ready access tothis frame plays a crucial role for many scientific, professionaland societal applicationsit is recommended that
GGOS focus on improved access to the global referenceframe with low latency and high spatial resolution as well asthe long-term stability of the frame.Recommendation 8.1 (Future reference frame approachbased on extended model):Recognizing that

The Global Geodetic Observing System GGOS 2020 167
users in many applications increasingly require access toa geodetic reference frame with high spatial and temporal res-olution in order to be able to detect ’anomalous’ motion of anobject with respect to the reference frameit is recommended that
GGOS encourage the development of a future referenceframe approach based on a reference frame model with, in prin-ciple, infinite spatial and temporal resolution, and that
this reference frame be based on a dynamic Earth systemmodel that assimilates observations and predicts the motion ofall points on Earth surface as well as variations in the gravityfield of the Earth system and the rotation of the solid Earth.Recommendation 8.2 (Towards and integrated Earth sys-tem model):Recognizing that
the future geodetic reference frame approach, in order tomeet the demanding user requirements and to achieve the re-quired spatial resolution, will have to be based on model pre-dictionit is recommended that
GGOS promote the development of an integrated Earthsystem model, which can be used to predict the geodetic quan-tities in a self-consistent framework, and that
both forward-modeling and inversion methods are devel-oped to predict geodetic quantities and to invert geodetic obser-vations for the forcings, respectively.Recommendation 9.1 (Augmentation of the current globalgeodetic infrastructure):Recognizing that
the currently implemented global geodetic infrastructureis not sufficient to provide a monitoring of Earth’s shape, grav-ity field and rotation meeting most of the users’ needs and tosustain the global geodetic reference frames required for manyscientific and societal applicationsit is recommended that
the global geodetic infrastructure not only be maintainedat the current level but also be augmented, in order to close ma-jor spatial and technological gaps, with (1) a global network ofcore stations on all continents, thus filling in the major spatialgaps in the ground networks, (2) absolute and superconductinggravimeters at a global network of reference sites, in particularthe core stations, and (3) two additional dedicated SLR satel-lites, that
an operational core system be built up and maintainedwith the necessary infrastructure for an operational geode-tic Earth system service providing quantitative information onchanges in ice sheets, sea level, water cycle, and climate, aswell as for hazards, disasters, and resource management appli-cation, and that
the operational core include at least (i) the global geodeticnetworks for the determination and monitoring of the geodeticreference frames, including Earth rotation, (ii) continuous grav-ity satellites missions for the monitoring of mass transport, (iii)continuous satellite missions for the monitoring of ice sheet,sea surface height, and lake level variations, and (iv) continuous
satellite missions for the imaging of the solid Earth’s surface.Recommendation 10.1 (Continuation of the IAG Services):Recognizing that
the terrestrial technique-specific entities represented bythe IAG Services are the basis of IAG’s GGOS, and that theirproducts are prerequisites for the realization GGOSit is recommended that
the work of the technique-specific entities, based on thestate-of-the-art observational and analysis tools, be continued,and that
funding for these technique-specific Services be securedon a long-term basis.Recommendation 10.2 (Uninterrupted sequence of satellitemissions):Recognizing that
uninterrupted geodesy-related satellite missions are re-quired for the generation of the best possible time-varyinggrav-ity field, and the monitoring of sea- and ice-surface topogra-phies, and that
today there is no consistent plan for deploying geodesy-related satellite missionsit is recommended that
GGOS, in close partnership with the space agencies andCEOS, develops a plan for uninterrupted series of geodesy-related space missions based on scientific and societal needs,and that
GGOS have an specific entity developing these scenarios.Recommendation 10.3 (Continuation of IERS):Recognizing that
the results of the technique-specific entities (the IAGServices) are compared, validated, and combined to gener-ate unique, technique-independent geodetic products (celes-tial, terrestrial, (and, to a lesser extent) gravitationalreferenceframes, constants, etc.), that
this work is taken care of by the IERS for the geometry-related productsit is recommended that
the work of the IERS be continued based on state-of-the-art validation and combination techniques, and that
funding for these activities be secured on a long-term ba-sis.Recommendation 10.4 (Plan for gravimetric satellite mis-sions):Recognizing that
full utilization of the gravimetric satellite missions re-quires long time series based on all relevant techniquesit is recommended that
the IGFS develop a plan to generate mission-independentgravity-products, which also include terrestrial and airbornedata, that
an entity realizing this plan (inside or outside the IGFS)be identified, or, if not existing, be created, and that
long-term funding for this entity be secured.Recommendation 10.5 (Establishment of an IAS):Recognizing that
The Global Geodetic Observing System GGOS 2020 168
the geodetic products resulting from space missions (in-cluding SLR data, terrestrial and airborne gravity measure-ments) must be compared, validated, and combined to resultin unique geodetic products (mainly), which have to be, more-over, consistent with the geometry-related products, and that
an international altimetry service could addresses one as-pect of this problem, namely that of sea and ice surface topog-raphy based on the data of all altimetry missions availableit is recommended that
an IAS as a mission-independent altimetry service be de-ployed and incorporated into GGOS, and that
funding for this IAS be secured on a long-term basis.Recommendation 10.6 (Establishment of an internationalInSAR Service):Recognizing that
the InSAR observations are very versatile observations ofEarth’s surface deformations and that
these observations serve a wide range of applicationsit is recommended that
an international InSAR service is established and incor-porated into GGOS, that
this service supports the application of InSAR integratedwith GNSS and makes products related to Earth’s surface de-formations routinely available, and that
funding for this service be secured on a long-term basis.Recommendation 10.7 (Standards and conventions):Recognizing that
in order to ensure consistency of observations, data pro-cessing, modeling and products across the three pillars ofgeodesy at a level of better than10−9, adherence to commongeodetic standards and conventions is crucialit is recommended that
a GGOS entity responsible for the geodetic Standards andConventions be created (named “GGOS Bureau of Standardsand Conventions”), that
this entity keep track of and make available a detailed andconcise list of geodetic conventions, constants, and procedures,and that
this catalogue include the IERS conventions.Recommendation 10.8 (Networks and communication):Recognizing that
currently there is a large number of more or less indepen-dent technique-specific ground tracking networks (and prod-ucts) in GGOS, and that
coordination of these networks is not sufficientit is recommended that
the IAG Services operating the technique-specific net-works create, in cooperation with the IERS, a GGOS Commu-nications and Networks Entity with the objective of this entityto design the networks (minimum number and distribution ofcore stations, co-location of techniques, etc.) and scope the op-eration (communication and data flow between networks andfrom stations to regional and global data centers) of the net-work as a whole.Recommendation 10.9 (United Nations support for GGOS):
Recognizing thatthe full implementation of GGOS and particularly of an
operational core system requires broad international support forGGOS as organizationit is recommended that
IAG continue its active role in GEO and other relevantorganizations, and that
IAG and GGOS continue the dialog on the associationof GGOS with an appropriate United Nations’ agency (UN-ESCO).Recommendation 10.10 (Establishment of a GGOS Coordi-nating Office):Recognizing that
GGOS is based on a wide range of contributing organi-zations, institutions, space agencies, services, and systems, andthat
GGOS has a wide range of users and stake holdersit is recommended that
GGOS establish a central coordinating entity (named here“GGOS Central Coordinating Office”) with the task to maintainan overview on GGOS contributors and users and their require-ments as well as to support the GGOS decision making entitiesin the day-to-day business, and that
funding for this entity be secured on a long-term basis,preferably through the respective United Nations’ agency.Recommendation AI.1 (GEO Resolution):Recognizing that
the fundamental role for geodesy and the geodetic geode-tic observation system for Earth observation in general andGEO in particular necessitate the continuous commitment ofmany national and regional institutions, organizations and gov-ernments to GGOSit is recommended that
the GEO Plenary consider a resolution recommending tothe GEO member countries to maintain, and if necessary, in-crease their support of the operational maintenance of the in-frastructure of GGOS at a level appropriate to meet the require-ments of the SBAs addressed by GEO.Recommendation AI.2 (GGOS Stakeholder Conference):Recognizing that
the implementation of GGOS on the basis of the findingsand recommendations resulting from the GGOS 2020 Processrequires a continuous dialog engaging all stakeholders insideand outside of IAGit is recommended that
a conference of the GGOS stakeholder organizations beorganized in 2008 to further develop the findings and recom-mendations of the GGOS 2020 documents (the Reference Doc-ument and the Strategy Document) into key elements for theimplementation plan of GGOS, and that
the GGOS 2020 documents serve as the basis for discus-sion and decisions at this conference.Recommendation AI.3 (Establishment of the new GGOSEntities):Recognizing that

The Global Geodetic Observing System GGOS 2020 169
the proposed new entities of GGOS are essential forprogress towards the full implementation of GGOSit is recommended that
the GGOS Bureau of Geodetic Standards & Conventionsand the GGOS Coordination Office be established through acall for proposals immediately after the GGOS stakeholderconference.

The Global Geodetic Observing System GGOS 2020 170
Acknowledgements
This work has been supported by many colleagues in geodesyand adjacent fields of Earth science.
Financial support for the Lead Editor was provided byNASA (through a contract with JPL and in the frame of severalresearch projects), and the Norwegian Mapping Authority.
The research described in Chapter 6 was partly carried outat the Jet Propulsion Laboratory, California Institute of Tech-nology, under a contract with the National Aeronautics andSpace Administration.
The work of one of the authors (R. S. Gross) describedin this report was performed at the Jet Propulsion Laboratory,California Institute of Technology, under contract with the Na-tional Aeronautics and Space Administration.
References
Abshire, J. B., Riris, H., Kawa, S. R., Sun, X., Chen, J., Mao,J.,Stephens, M. A., Allan, G., Collatz, G. J., & Jian, P.-S., 2007.Laser sounder for global measurements of CO2 concentra-tions in the troposphere from space,Geophys. Res. Abst., 9,EGU2007–A–10014.
Achard, F., Eva, H. D., Stibig, H. J., & et al., 2002. Determi-nation of deforestation rates of the world’s humid tropicalforests,Science, 297, 999–1002.
Achard, F., Eva, H. D., Mayaux, P., & et al., 2004. Improvedestimates of net carbon emissions from land cover changein the tropics for the 1990s,Global Biogeochemical Cycles,18(2), Art. No. GB2008.
Alley, W. M., Healy, R. W., LaBaugh, J. W., & Reilly, V.,2002. Flow and storage in groundwater systems,Science,296, 1985–1990.
Alsdorf, D., Dunne, T., Hess, L., Melack, J. M., & Birkett,C., 2001. Water level changes in a large Amazon lake mea-sured with spaceborne radar interferometry and altimetry,Geophys. Res. Let., 28, 2671–2674.
Alsdorf, D. E., Melack, J. M., Dunne, T., Mertes, L. A. K.,Hess, L. L., & Smith, L. C., 2000. Interferometric radarmeasurements of water level change: Amazon floodplain re-sponse to river stage,Nature, 404, 174–177.
Alsdorf, D. E., Smith, L. C., & Melack, J. M., 2001. Ama-zon water level changes measured with interferometric SIR-C radar,IEEE Transactions on Geoscience and Remote Sens-ing, 39, 423–431.
Altamimi, Z., Sillard, P., & Boucher, C., 2002. A new re-lease of the International Terrestrial Reference Frame forearth science applications,J. Geophys. Res., 107, 2214, doi:10.1029/2001JB000561.
Altamimi, Z., Collileux, X., & Boucher, C., 2006. DORIS con-tribution to ITRF2005,J. Geodesy, 80(8-11), 625–635, DOI10.1007/s00190–006–0065–5.
Altamini, Z., Coulot, D., Berio, P., & Exertier, P., 2006. Howcan combination help to achieve consistency at the 0.1 ppblevel?, Position paper presented at the GGOS 2006 Work-shop ’Towards a Consistent Geodetic Foundation for EarthObservations, October 8-9, 2006,Munich, Germany. Avail-able at http://geodesy.unr.edu/ggos/ggosws2006/.
Andersen, O. B., Woodworth, P. L., & Flather, R. A., 1995.Intercomparison of recent global ocean tide models,J. Geo-phys. Res., 100, 25,261–25,282.
Asner, G. P., Knapp, D. E., Broadbent, E. N., & et al., 2005. Se-lective logging in the Brazilian Amazon,Science, 310, 480–482.
Asner, G. P., Broadbent, E. N., Oliveira, P. J. C., & et al., 2006.Condition and fate of logged forests in the Brazilian Ama-zon,Proc. National Academy of Sciences of the United Statesof America, 103(34), 12947–12950.
Assistant Secretary of Defence for Command, Control, Com-munication, and Intelligence, 2001. Global positioning sys-tem standard positioning service performance standards,Tech. rep., Assistant Secretary of Defence, Washington.
Banerjee, P., Pollitz, F. F., & Burgmann, R., 2005. The sizeandduration of the Sumatra-Andaman earthquake from far-fieldstatic offsets,Science, 308, 1769–1772.
Bao, L. F., Piatanesi, A., Lu, Y., Hus, H. T., & Zhou, X. H.,2005. Sumatra tsunami affects observations by GRACEsatellites,Eos, Trans. Am. Geophys. Union, 86, 353,356.
Barber, R. T., Sanderson, M. P., Lindley, S. T., Chai, F., New-ton, J., Trees, C. C., Foley, D. G., & Chavez, F., 1996. Pri-mary productivity and its regulation in the equatorial Pacificduring and following the 1991-1992 El Nino,Deep-Sea Re-search II, 43, 933–969.
Battrick, B., ed., 2006.The Changing Earth: New ScientificChallanges for ESA’s Living Planet Programme, EuropeanSpace Agency, ESTEC, Noordwijk, The Netherlands.
Becker, M., Zerbini, S., Baker, T., Burki, B., Galanis, J.,Garate, J., Georgiev, I., Kahle, H., Kotzev, V., Lobazov, V.,Marson, I., Negusini, M., Richter, B., Veis, G., & Yuze-fovich, P., 2002. Assessment of height variations by GPSat mediterranean and Black Sea coast tide gauges from theSELF projects,Global and Planetary Change, 34(1-2), 5–35.
Bernasconi, C. & others, ., 2005.Climate Change and the Euro-pean Water Dimension, European Commission, EUR 21553.
The Global Geodetic Observing System GGOS 2020 171
Beutler, G., Hein, G. W., Melbourne, W. G., & G., S., eds.,1996. GPS Trends in Precise Terrestrial, Airborne, andSpaceborne Applications, vol. 115 of Proc. IAG sympo-sium no., Springer-Verlag, New York.
Beutler, G., Rothacher, M., Schaer, S., Springer, T. A., Kouba,J., & Neilan, R. E., 1999. The International GPS Service(IGS): An interdisciplinary service in support of earth sci-ences,Advances of Space Research, 23, 631–653.
Beutler, G., Mervart, L., & Verdun, A., 2004.Methods of Ce-lestial Mechanics: Volume I: Physical, Mathematical, andNumerical Principles, Springer, Berlin etc.
Beutler, G., Drewes, H., Plag, H.-P., Reigber, C., Rothacher,M., & Rummel, R., 2005. IAG GGOS Implementation Plan,Tech. rep., GeoForschungZentrum Potsdam, Germany.
Beyerle, G. & Hocke, K., 2001. Observation and simulation ofdirect and reflected GPS signals in radio occultation experi-ments,Geophys. Res. Lett., 28(9), 1895–1898.
Bindoff, N. L., Willebrand, J., Artale, V., Cazenave, A., Gre-gory, J., Gulev, S., Hanawa, K., Le Qur, C., Levitus, S.,Nojiri, Y., Shum, C., Talley, L., & Unnikrishnan, A., 2007.Observations: Oceanic climate change and sea level, inCli-mate Change 2007: The Physical Science Basis. Contribu-tion of Working Group I to the Fourth Assessment Reportof the Intergovernmental Panel on Climate Change, editedby S. Solomon, D. Qin, M. Manning, Z. Chen, M. Marquis,K. B. Averyt, M. Tignor, & H. L. Miller, Cambridge Univer-sity Press, Cambridge, United Kingdom and New York, NY,USA.
Bird, P., 2003. An updated digital model of plate bound-aries, Geochemistry Geophysics Geosystems, 4(3), 1027,doi:10.1029/2001GC000252.
Blewitt, G., 1993. Advances in global positioning system tech-nology for geodynamics investigations: 1978–1992, inCon-tributions of Space Geodesy to Geodynamics: Technology,edited by D. E. Smith & D. L. Turcotte, vol. 25 ofGeody-namics Series, pp. 195–213, American Geophysical Union.
Blewitt, G., 2003. Self-consistency in reference frames, geo-center definition, and surface loading of the solid earth,J.Geophys. Res., 108, 10.1029/2002JB002082.
Blewitt, G. & Clarke, P., 2003. Inversion of earth’s chang-ing shape to weigh sea level in static equilibrium withsurface mass redistribution,J. Geophys. Res., 107, DOI:10.1029/2002JB002290.
Blewitt, G., Lavallee, D., Clarke, P., & Nurutdinov, K., 2001.A new global mode of earth deformation: Seasonal cycledetected,Science, 294, 2342–2345.
Blewitt, G., Coolbaugh, M. F., Sawatzky, D. L., Holt, W.,Davis, J. L., & Bennett, R. A., 2003. Targeting of poten-tial geothermal resources in the Great Basin from regional to
basin-scale relationship between geodetic strain and geolog-ical structures,Geothermal Resources Council Transactions,27, 3–7.
Blewitt, G., Hammond, W. C., & Kreemer, C., 2005. Relatinggeothermal resources to Great Basin tectonics using GPS,Geothermal Resources Council Transactions, 29, 331–335.
Blewitt, G., Altamimi, Z., Davis, J., Gross, R., Kuo, C.,Lemoine, F., Neilan, R., Plag, H.-P., Rothacher, M., Shum,C. K., Sideris, M. G., Schone, T., Tregoning, P., & Zerbini,S., 2006. Geodetic observations and global reference framecontributions to understanding sea level rise and variability,in Understanding Sea-level Rise and Variability, A WorldClimate Research Programme Workshop and a WCRP con-tribution to the Global Earth Observation System of Sys-tems, 6-9 June 2006, UNESCO, Paris, edited by T. Aarup,J. Church, S. Wilson, & P. Woodworth, pp. 127–143, WCRP,World Meterological Organization, Paris.
Blewitt, G., Kreemer, C., Hammond, W., Plag, H.-P., Stein, S.,& Okal, E., 2006. Rapid determination of earthquake magni-tude using GPS for tsunami warning systems,Geophys. Res.Lett., 33, L11309, doi:10.1029/2006GL026145.
Board on Earth Sciences and Resources, 2003.Living on anActive Earth: Perspectives on Earthquake Science, The Na-tional Academies Press, Free online version available athttp://darwin.nap.edu/books/0309065623/html.
Bock, Y. & Leppard, N., eds., 1990.Global Positioning System:An Overview, vol. 102 ofProc. IAG symposium, Springer-Verlag, New York.
Bonaccorso, A., Calvari, S., Garfi, G., Lodato, L., & Patane,D., 2003. Dynamics of the December 2002 flank failureand tsunami at Stromboli volcano inferred by volcanologi-cal and geophysical observations,Geophys. Res. Lett., 20,doi:10.1029/2003GL017702.
Bonforte, A. & Puglisi, G., 2003. Magma uprising andflank dynamics on Mount Etna volcano, studied usingGPS data (1994–1995),J. Geophys. Res., 108(B3), 2153,doi:10.1029/2002JB001845.
Burris, J., Andrews, A., Riris, H., Abshire, J., Gates, A., Kari-nak, M., & Sun, X., 2006. Profiling CO2 within the planetaryboundary layer, Abstract submitted to the 23rd InternationalLaser Radar Conference (ILRC23), July 2006 in Nara Japan.
Cardellach, E., Ruffini, G., Pino, D., Rius, A., Komjathy, A.,& Garrison, J., 2003. Mediterranean balloon experiment:GPS reflection for wind speed retrieval from the stratosphere,Rem. Sens. Env..
Cardellach, E., Ao, C. O., de la Torre Juarez, M.,& Hajj, G. A., 2004. Carrier-phase delay altime-try with GPS-reflection/occultation interferometry fromlow-Earth orbiters, Geophys. Res. Lett., 31, L10402,doi:10.1029/2004GL019775.
The Global Geodetic Observing System GGOS 2020 172
Carlson, R. & 42 others, 2002. Earthscope scientific targetsforthe world’s largest observatory pointed at the solid Earth,Workshop report, Geoscience Professional Services, Inc.
Chao, B. F., 1994. Man-made lakes and sea-level rise,Nature,370, 258.
Chao, B. F., 2003. Geodesy is not just for static measurementsanymore,Eos, Trans. Am. Geophys. Union, 84(16), 145–150.
Chao, B. F. & Gross, R., 1987. Changes in the Earth’s rota-tion and low-degree gravitional field induced by earthquakes,Geophys. J. Int., 91, 569–596.
Chao, B. F. & Gross, R., 2005. Did the 26 December 2004Sumatra, Indonesia, earthquake disrupt the Earth’s rotationas the mass media have said?,Eos, Trans. Am. Geophys.Union, 86(1), 1.
Chelton, D. B., Schlax, M. G., Freilich, M. H., & Milliff,R. F., 2004. Satellite measurements reveal persistent short-scale features in ocean winds,Science, 303(5660), 978–983.
Chen, J., Devey, C., Fischer, C., Lin, J., & Whitmarsh, B., 2005.Ocean – abyss of time: Earth science for society, Tech. rep.,International Year of Planet Earth, Earth Science for SocietyFoundation, Leiden, The Netherlands.
Chen, J. L. & Wilson, C. R., 2003. Low degree gravitationalchanges from earth rotation and geophysical models,Geo-phys. Res. Lett., 30(24), 2257, doi:10.1029/2003GL018688.
Cheng, M. & Tapley, B. D., 2004. Variations in the Earth’soblateness during the past 28 years,J. Geophys. Res., 109,B09402, doi:10.1029/2004JB003028.
Church, J. A., Gregory, J. M., Huybrechts, P., Kuhn, M., Lam-beck, K., Nhuan, M. T., Qin, D., & Woodworth, P. L., 2001.Changes in sea level, inClimate Change 2001: The Scien-tific Basis. Contribution of Working Group I to the Third As-sessment Report of the Intergovernmental Panel on ClimateChange, edited by J. T. Houghton, Y. Ding, D. J. Griggs,M. Noguer, P. J. van der Linden, X. Dai, K. Maskell, &C. A. Johnson, pp. 639–693, Cambridge University Press,Cambridge.
Clarke, P. J., Lavallee, D. A., Blewitt, G., van Dam, T., &Wahr, J. M., 2005. Effect of gravitational consistency andmass conservation on seasonal surface mass loading models,Geophys. Res. Lett., 32, doi: 10.1029/2005GL022441.
Commission on Geosciences, E. & Resources, 1997.Satel-lite Gravity and the Geosphere: Contributions to the Studyof the Solid Earth and Its Fluid Envelopes, The Na-tional Academies Press, Free online version available athttp://darwin.nap.edu/books/0309057922/html.
Commission on Physical Sciences, Mathematics, and Ap-plications, 1990.Geodesy in the Year 2000, The Na-tional Academies Press, Free online version available athttp://darwin.nap.edu/books/0309041457/html.
Cretaux, J. F., Soudarin, L., Cazenave, A., & Bouille, F., 1998.Present-day tectonic plate motions and crustal deforma-tions from the DORIS system,J. Geophys. Res., 103(B12),30167–30181, DOI 10.1029/98JB02239.
Crossley, D., Hinderer, J., Casula, G., Francis, O., Hsu, H.-T.,Imanishi, Y., Jentzsch, G., Kaarianen, J., Merriam, J., Meur-ers, B., Neumeyer, J., Richter, B., Shibuya, K., Sato, T., &van Dam, T., 1999. Network of superconducting gravimetersbenefits a number of disciplines,Trans. Am. Geophys. U., 80,121–126.
Crowley, J. W., Mitrovica, J. X., Bailey, R. C., Tamisiea, M.E.,& Davis, J. L., 2006. Land water storage within the CongoBasin inferred from GRACE satellite gravity data,Geophys.Res. Lett., 33, L19402, doi:10.1029/2006GL027070.
Dahl, A. L., 1998. IGOS from the perspective of the Global Ob-serving Systems and their sponsors, inProceedings for the27-th Int. Symp. on Remote Sensing of Environment: Infor-mation for Sustainability, June 8-12, 1998, Tromsø, Norway,pp. 92–94, Norwegian Space Centre.
Davis, J. L., Elsegui, P., Mitrovica, J. X., & Tamisiea,M. E., 2004. Climate-driven deformation of the solid Earthfrom GRACE and GPS,Geophys. Res. Lett., 31, L24605,doi:10.1029/2004GL021435.
Day, J. W., Gunn, J. D., Folan, W. J., Yanez-Arancibia, A.,& Horton, B. P., 2007. Emergence of complex societies aftersea level stabilized,Eos, Trans. Am. Geophys. Union, 88(15),169–170.
de Viron, O., Schwarzbaum, G., Lott, F., & Dehant, V., 2005.Diurnal and subdiurnal effects of the atmosphere on theEarth rotation and geocenter motion,J. Geophys. Res., 110,B11404, doi:10.1029/2005JB003761.
Defra, 2005. The threat posed by tsunamis to the uk, Tech.rep., British Geological Survey, Edinburgh, Study com-missioned by Department for Environment, Food and Ru-ral Affairs (Defra) Flood Management and produced byBritish Geological Survey, Proudman Oceanographic Lab-oratory, Met Office and HR Wallingford. Available athttp://www.defra.gov.uk/environ/fcd/research.
DeMets, C., Gordon, R. G., Argus, D. F., & Stein, S., 1994.Effect of recent revisions to the geomagnetic reversal timescale on estimates of current plate motions,Geophys. Res.Lett., 21, 2191–2194.
DESDynI Writing Committee, 2007. Report of the July 16-19, 2007 Orlando, Florida Workshop to Assess the Na-tional Research Council Decadal Survey Recommendations
The Global Geodetic Observing System GGOS 2020 173
for the DESDynI Radar/Lidar Space Mission, Available athttp://science.hq.nasa.gov/earth-sun/index.html.
Dickey, J. O., Newhall, X. X., & Williams, J. G., 1985. Earthorientation from lunar laser ranging and an error analysis ofpolar motion services,J. Geophys. Res., 90, 9353–9362.
Dickey, J. O., Bender, P. L., Faller, J. E., Newhall, X. X., Rick-lefs, R. L., Ries, J. G., Shelus, P. J., Veillet, C., Whipple,A. L., Wiant, J. R., Williams, J. G., & F., Y. C., 1994. Lunarlaser ranging: A continuing legacy of the Apollo program,Science, 265, 482–490.
Dixon, T. H., Amelung, F., Ferretti, A., Novali, F., Rocca, F.,Dokka, R., Sella, G., Kim, S.-W., Wdowinski, S., & Whit-man, D., 2006. Subsidence and flooding in new orleans,Na-ture, 441, 587–588.
Dong, D., Fang, P., Bock, Y., Cheng, M. K., & Miyazaki, S.,2002. Anatomy of apparent seasonal variations from GPS-derived site position time series,J. Geophys. Res., 107, 2075,doi:10.1029/2001JB000573.
Drewes, H., 2006. The science rationale of the Global Geode-tic Observing System GGOS, inDynamic Planet – Monitor-ing and Understanding a Dynamic Planet with Geodetic andOceanographic Tools, edited by P. Tregoning & C. Rizos,vol. 130 of International Association of Geodesy Sym-posia, pp. 703–710, Springer Verlag, Berlin.
Drinkwater, M. R., Floberghagen, R., Haagmans, R., Muzi,D., & Popescu, A., 2003. GOCE; ESA’s first Earth ExplorerCore mission, inEarth Gravity Field from Space - fromSensor to Earth Sciences, edited by G. B. Beutler, M. R.Drinkwater, R. Rummel, & R. von Steiger, vol. 18 ofSpaceScience Series of ISSI, pp. 419–432, Kluwer AcademicPublishers, Dordrecht.
EEA, 1999. Sustainable water use in europe, Part 1: Sectoraluse of water, European Environment Agency, available at:http://themes.eea.eu.int/binary/e/enviasses01.pdf.
Elgered, G., Plag, H.-P., Marel, H., Barlag, S., & Nash, J.,2005.COST Action 716 Exploitation of Ground-based GPSfor Operational Numerical Weather Prediction and ClimateApplications, no. EUR 21639 in COST European coopera-tion in the field of scientific and technical research, EuropeanCommission.
Elosegui, P., Davis, J. L., Jaldehag, R. T. K., Johansson, J. M.,Niell, A. E., & Shapiro, I. I., 1995. Geodesy using the GlobalPositioning System: the effects of signal scattering on esti-mates of site position,J. Geophys. Res., 100, 9921–9934.
Eltahir, E. A. B. & Yeh, P., 1999. On the asymmetric responseof aquifer water level to droughts and floods in illinois,Wat.Resour. Res., 35(4), 1199–1217.
Emanuel, K., 2003. Tropical cyclones,Annual Review of Earthand Planetary Sciences, 31, 75–104.
Estefan, J. A. & Folkner, W. M., 1995. Sensitivityof planetary cruise navigation to Earth orientation cal-ibration errors, Tech. Rep. TDA PR 42-123, July-September 1995, pp. 1-29, Jet Propulsion Labora-tory, California Institute of Technology, Pasadena, CA,http://tmo.jpl.nasa.gov/progressreport/42-123/123E.pdf.
European Commission, 2004. Agreement on the promotion,provision and use of Galileo and GPS satellite-basednavigation systems and related applications, Available athttp://europe.eu.int/comm/dgs/energytransport/galileo-/documents% -/doc/ 200406 21 summit2004en.pdf.
European Commission and ESA, 2003. Global Monitoring forEnvironment and Security: Final report for the GMES ini-tial period (2001-2003) version 3.5, Draft report, EuropeanCommission, Available at http://www.gmes.info/library/.
Fagard, H., 2006. Twenty years of evolution for the DORISpermanent network: from its initial deployment to its renova-tion, J. Geodesy, 80(8-11), 429–456, DOI 10.1007/s00190–006–0084–2.
Farrell, W. E., 1972. Deformation of the Earth by surface loads.,Rev. Geophys. Space Phys., 10, 761–797.
Farrell, W. E. & Clark, J. A., 1976. On postglacial sea level,Geophys. J. R. Astron. Soc., 46, 647–667.
Fedrizzi, M., de Paula, E. R., Langley, R. B., Komjathy, A.,Batista, I. S., & Kantor, I. J., 2005. Study of the March 31,2001 magnetic storm effects on the ionosphere using GPSdata,Advances in Space Research, 36, 534–545.
Ferretti, A., Novali, F., Burgmann, R., Hilley, G., & Prati, C.,2004. InSAR permanent scatterer analysis reveals ups anddowns in San Francisco Bay area,Eos, Trans. Am. Geophys.Union, 85(24), 317,324.
Fey, A. L., Ma, C., Arias, E. F., Charlot, P., Feissel-Vernier, M.,Gontier, A.-M., Jacobs, C. S., Li, J., & MacMillan, D. S.,2004. The second extension of the International CelestialReference Frame,Astronomical J., 127, 3587–3608.
Folkner, W. M., 1996. Dsn station locations and un-certainties, Tech. Rep. TDA PR 42-128, October-December 1996, pp. 1-34, Jet Propulsion Labora-tory, California Institute of Technology, Pasadena, CA,http://tmo.jpl.nasa.gov/progressreport/42-128/128F.pdf.
Folkner, W. M., Yoder, C. F., Yuan, D. N., Standish, E. M., &Preston, R. A., 1997. Interior structure and seasonal mass re-distribution of Mars from radio tracking of Mars Pathfinder,Science, 278, 1749–1752.
Garces, M., Caron, P., Hetzer, C., Le Pichon, A., Bass, H.,& Bhattacharyya, J., 2005. Deep infrasound radiated by theSumatra earthquake and tsunami,Eos, Trans. Am. Geophys.Union, 86, 317, 320.
The Global Geodetic Observing System GGOS 2020 174
Garrison, J. L. & Katzberg, S. J., 2000. The application of re-flected GPS signals to ocean remote sensing,Remote Sens.Environ., 73, 175–187.
Garrison, J. L., Katzberg, S. J., & Hill, M. I., 1998. Effect of searoughness on bistatically scattered range coded signals fromthe Global Positioning System,Geophys. Res. Lett., 25(13),2257–2260.
GEO, 2005. The Global Earth Observing System of Sys-tems (GEOSS) - 10-Year Implementation Plan, Available athttp://earthobservations.org.
GEO, 2005. Global Earth Observing System of SystemsGEOSS - 10-Year Implementation Plan Reference Docu-ment - Draft, Tech. Rep. GEO 1000R/ESA SP 1284, ESAPublication Division, ESTEC, Noordwijk, The Netherlands,Avaliable at http://earthobservations.org.
Geoconnection, 2007. Canadian geospatial data infrastructure,http://www.geoconnections.org/CGDI.cfm/fuseaction/key-Docs.home/gcs.cfm.
Germain, O., Ruffini, G., Soulat, F., Caparrini, M., Chapron,B., & Silvestrin, P., 2004. The Eddy Experiment: GNSS-R speculometry for directional sea-roughness retrieval fromlow altitude aircraft, Geophys. Res. Lett., 31, L21307,doi:10.1029/2004GL020991.
Gewin, V., 2004. Mapping opportunities,Nature, 427, 376–377.
Gleason, S., Hodgart, S., Sun, Y., Gommenginger, C., Mackin,S., Adjrad, M., & Unwin, M., 2005. Detection and process-ing of bistatically reflected GPS signals from low Earth or-bit for the purpose of ocean remote sensing,IEEE Trans.Geosci. Remote Sensing, 43(6), 1229–1241.
Gonzalez, F. I., Milburn, H. M., Bernard, E. N., & New-man, J. C., 1998. Deep-ocean assessment and reporting oftsunamis (DART): Brief overview and status report, inPro-ceedings of the International Workshop on Tsunami DisasterMitigation, 19-22 January 1998, Tokyo, Japan.
Gower, J., 2005. Jason 1 detects the 26 december 2004 tsunami,Eos, Trans. Am. Geophys. Union, 86(4), 37.
Grindlay, N. & Hearne, M., 2005. High risk of tsunami in theNorthern Caribbean,Eos, Trans. Am. Geophys. Union, 86,121, 126.
Gross, R., 2006. Degree-2 harmonics of the Earth’s mass loadestimated from GRACE and Earth rotation data and modelsof surficial geophysical fluids,Eos Trans. AGU, 87, AbstractG31A–03, West. Pac. Geophys. Meet. Suppl.
Gross, R. S., Blewitt, G., Clarke, P. J., & Lavallee, D.,2004. Degree-2 harmonics of the earth’s mass load estimatedfrom gps and earth rotation data,Geophys. Res. Lett., 31,doi:10.1029/2004GL019589.
Haines, B. J., Bar-Sever, Y. E., Bertiger, W., Desai, S., & Willis,P., 2004. New strategies for the 1-cm precise orbit determi-nation,Marine Geodesy, 27(1-2), 299–318.
Hajj, G. A., Ao, C. O., C. O. Iijima, C. O., Kuang, D.,Kursinski, E. R., Mannucci, A. J., Meehan, T. K., Ro-mans, L. J., de la Torre Juarez, M., & Yunck, T. P.,2004. CHAMP and SAC-C atmospheric occultation re-sults and intercomparisons,J. Geophys. Res., 109, D06109,doi:10.1029/2003JD003909.
Hansen, M. C. & DeFries, R. S., 2004. Detecting long-termglobal forest change using continuous fields of tree-covermaps from 8-km advanced very high resolution radiome-ter (AVHRR) data for the years 1982-99,Ecosystems, 7(7),695–716.
Heidbach, O., Barth, A., Connolly, P., Fuchs, K., Muller, B.,Tingay, M., Reinecker, J., Sperner, B., & Wenzel, F., 2004.Stress maps in minutes: the 2004 world stress map release,Eos, Trans. Am. Geophys. Union, 85, 521, 529.
Hein, G. W., Rodriguez, J. A. A., Wallner, S., Eisfeller, B.,Pany, T., & Hartl, P., 2007. Envisioning a future gnss systemof systems,Inside GNSS, 2(1), 58–67.
Hinderer, J. & Crossley, D., 2004. Scientific achievementsfrom the first period (1997-2003) of the Global Geodynam-ics Project using a worldwide network of superconductinggravimeters,J. Geodynamics, 38, 237–262.
Hofmann-Wellenhof, B., Lichtenegger, H., & Collins, J., 1997.Global Positioning System: Theory and Practice, Springer-Verlag, New York.
Hogan, J., 2005. Warming debate highlights poor data,Nature,436, 896, doi:10.1038/436896a.
Hughes, C. W., Stepanov, V. N., Fu, L.-L., Barnier, B., & Har-greaves, G. W., 2007. Three forms of variability in Argen-tine Basin ocean bottom pressure,J. Geophys. Res., 112,C01011, doi:10.1029/2006JC003679.
IGOS-P Ocean Theme Team, 2001. An Ocean Theme for theIGOS Partnership, Tech. rep., IGOS Integrated Global Ob-serving Strategy, Available at http://www.igospartners.org.
Ilk, K. H., Flury, J., Rummel, R., Schwintzer, P., Bosch, W.,Haas, C., Schroter, J., Stammer, D., Zahel, W., Miller, H.,Dietrich, R., Huybrechts, P., Schmeling, H., Wolf, D., Gotze,H. J., Riegger, J., Bardossy, A., Gunter, A., & Gruber, T.,2005. Mass transport and mass distribution in the earth sys-tem, Tech. rep., GOCE-Projectburo Deutschland, Technis-che Universitat Munchen, GeoForschungsZentrum Potsdam.
InSAR Working Group, 2005. Insar workshop summary report,october 20-22, 2004, oxnard, california, Tech. rep., NASA,Jet Propulsion Laboratory, California Institute of Technol-ogy, Pasadena, California.

The Global Geodetic Observing System GGOS 2020 175
International GPS Service, 2001. GPS Tide Gauge BenchmarkMonitoring Pilot Project (TIGA - PP), Call for participa-tion, International GPS Service, available at http://op.gfz-potsdam.de/staff/schoene/TIGACfP.pdf.
IOC, 1997. Global Sea Level Observing System (GLOSS)Implementation Plan - 1997, Tech. rep., IntergovernmentalOceanographic Commission, Technical Series, vol 50, 91 ppplus Annexes.
IOC, 2006. Manual on sea-level measurement and interpreta-tion, Volume 4 - An update to 2006, Tech. Rep. 14, Inter-governmental Oceanographic Commission (IOC), Paris, 80pages.
Jayles, C., Nhun-Fat, B., & Tourain, C., 2006. Doris: systemdescription and control of the signal integrity,J. Geodesy,80(8-11), 457–472, DOI 10.1007/s00190–006–0046–8.
Jerrett, D. & Nash, J., 2001. Potential uses of surface basedGPS water vapour measurements for meteorological pur-poses,Phys. Chem. Earth, 26, 457–462.
Johannessen, J. A., Balmino, G., Le Provost, C., Rummel,R., Sabadini, R., Sunkel, H., Tscherning, C. C., Visser, P.,Woodworth, P., Hughes, C., LeGrand, P., Sneeuw, N., Per-osanz, F., Aguirre-Martinez, M., Rebhan, H., & Drinkwa-ter, M., 2003. The European Gravity Field and Steady-StateOcean Circulation Explorer satellite mission: its impact ongeophysics,Surveys in Geophys., 24(4), 339–386.
Juttner, H.-U. & Plag, H.-P., 1999. On modelling of earthrotation variations in an integrated model and appropriateframe of reference, in3. DFG Rundgesprach zum ThemaBezugssysteme, edited by M. Schneider, vol. 5 ofMitteilun-gen des Bundesamtes fur Kartographie und Geodasie,pp. 59–62, Bundesamtes fur Kartographie und Geodasie.
Katzberg, S. J., Walker, R. A., Roles, J. R., Lynch, T., & Black,P. G., 2001. First GPS signals reflected from the interior of atropical storm: Preliminary results from hurricane Michael,Geophys. Res. Lett., 28(10), 1981–1984.
Kaula, W. M., 1966.Theory of Satellite Geodesy, BlaisdellPublishing Co., Waltham, MA.
Kaula, W. M., 1970. The terrestrial environment: solid-earthand ocean physics, Tech. rep., Massachusetts Institute ofTechnology, Cambridge, Mass., Community ’Williamstown’Report prepared for National Aeronautics and Space Admin-istration, Washington, D.C.
Kavaya, M. J., 1999. What is lidar?, Available at: http://-www.ghcc.msfc.nasa.gov/sparcle/sparcletutorial.html.
Kerr, R., 2005. Failure to gauge the quake crippled the warningeffort, Science, 307, 201.
Key, J. & the IGOS-Cryo Writing Team, 2004. Concept of anIGOS-Cryosphere Theme (IGOS-Cryo), Tech. rep., IGOSIntegrated Global Observing Strategy, Version 2.2, October7, 2004, available at http://www.igospartners.org.
Kierulf, H. P., Bockmann, L., Kristiansen, O., & Plag, H.-P., 2002. Foot-print of the space-geodetic observatory, Ny-Alesund, Svalbard, inProceedings of the Second IVS Gen-eral Meeting, Tsukuba, Japan, 4-6 February 2002, editedby N. Vandenberg & K. Baver, pp. 86–90, NASA GoddardSpace Flight Center, Greenbelt, MD.
Komjathy, A., Zavorotny, V., Axelrad, P., Born, G., & Garrison,J., 2000. GPS signal scattering from sea surface: wind speedretrieval using experimental data and theoretical model,Rem.Sens. Environ., 73, 162–174.
Komjathy, A., Sparks, L., Wilson, B., & Mannucci, A. J., 2005.Automated daily processing of more than 1000 ground-basedGPS receivers to study intense ionospheric storms,RadioScience, 40, RS6006 doi:10.1029/2005RS003279.
Konopliv, A. S., Yoder, C. F., Standish, E. M., Yuan, D. N., &Sjogren, W. L., 2006. A global solution for the Mars staticand seasonal gravity, Mars orientation, Phobos and Deimosmasses, and Mars ephemeris,Icarus, 182, 23–50.
Kovalevsky, J., 1997. Connection of the HIPPARCOS cat-alogue to the extragalactic reference frame, inProceed-ings from the Hipparcos Venice ’97 symposium PresentingThe Hipparcos and Tycho Catalogues and first astrophys-ical results of the Hipparcos astrometry mission, ESTEC,The Netherlands, available at http://astro.estec.esa.nl/SA-general/Projects/Hipparcos/hippvenice.html.
Kreemer, C. & Holt, W. E., 2001. A no-net-rotation model ofpresent-day surface motions,Geophys. Res. Lett., 28, 4407–4410.
Kreemer, C., Holt, W. E., & Haines, A. J., 2003. An integratedglobal model of present-day plate motion and plate boundarydeformation,Geophys. J. Int., 154, 8–34.
Kreemer, C., Blewitt, G., & Hammond, W. C., 2006. Usinggeodesy to explore correlations between crustal deformationcharacteristics and geothermal resources,Geothermal Re-sources Council Transactions, 30, 441–446.
Kreemer, C., Blewitt, G., Hammond, W. C., & Plag, H.-P.,2006. Global deformations from the great 2004 Sumatra-Andaman earthquake observed by GPS: implications forrupture process and global reference frame,Earth PlanetsSpace, 58, 141–148.
Kunze, E. & Smith, S. G. L., 2004. The role of small-scale to-pography in turbulent mixing of the global ocean,Oceanog-raphy, 17(1-2), 55–64.

The Global Geodetic Observing System GGOS 2020 176
Kusche, J. & Schrama, E. J. O., 2005. Surface mass redistri-bution inversion from global GPS deformation and GravityRecovery and Climate Experiment (GRACE) gravity data,J.Geophys. Res., 110, B09409, doi:10.1029/2004JB003556.
La Rocca, M., Galluzzo, D., Saccorotti, G., Tinti, S., Cimini,G. B., & Del Pezzo, E., 2004. Seismic signals associatedwith landslides and with a tsunami at Stromboli volcano,Italy, Bull. Seismological Soc. America, 94, 1850–1867.
Lambeck, K., 1988.Geophysical Geodesy - The Slow Defor-mations of the Earth, Oxford Science Publications.
Lambert, S. B., Bizouard, C., & Dehant, V., 2006.Rapid variations in polar motion during the 2005-2006 winter season,Geophys. Res. Lett., 33, L13303,doi:10.1029/2006GL026422.
Lanari, R., De Natale, G., Berardino, P., Sansosti, E., Riccia-rdi, G. P., Borgstrom, S., Capuano, P., Pingue, F., & Troise,C., 2002. Evidence for a peculiar style of ground deforma-tion inferred at Vesuvius volcano,Geophys. Res. Lett., 29(9),doi:10.1029/2001GL014571.
Langley, R. B., King, R. W., & Shapiro, I. I., 1981. Earth rota-tion from lunar laser ranging,J. Geophys. Res., 86, 11913–11918.
Larson, K. M., Bodin, P., & Gomberg, J., 2003. Using 1-hzGPS data to measure deformations caused by the DenaliFault Earthquake,Science, 300, 1421–1424.
Latychev, K., Mitrovica, J. X., Tromp, J., Tamisiea, M. E., Ko-matitsch, D., & Christara, C. C., 2005. Glacial isostatic ad-justement on 3-D Earth models: a finite-volume formalism,Geophys. J. Int., 161, 421–444.
Lawford, R. & the Water Theme Team, 2004. A Global Wa-ter Cycle Theme for the IGOS Partnership, Tech. rep.,IGOS Integrated Global Observing Strategy, Report of theGlobal Water Cycle Theme Team, April 2004, available athttp://www.igospartners.org.
Le Provost, C., Le Grand, P., Dombrowsky, E., Le Traon, P. Y.,Losch, M., Ponchaut, F., Schroter, J., Sloyan, B., & Sneeuw,N., 1999. Impact of GOCE for ocean circulation studies, Fi-nal report, ESA study contract 13175/98/NL/GD.
Leick, A., 2003.GPS Satellite Surveying, J. Wiley and Sons,Inc., New York.
Lemoine, F., Kenyon, S., Factor, J., Trimmer, R., Pavlis, N.,Chinn, D., Cox, C., Klosko, S., Luthcke, S., Torrence, M.,Wang, Y., Williamson, R., Pavlis, E., Rapp, R., & Olsen,T., 1998. The development of the joint nasa gsfc and theNational Imagery and Mapping Agency (NIMA) geopoten-tial model EGM96, Tech. rep., NASA Goddard Space FlightCenter.
Lemoine, J. M. & Capdeville, H., 2006. A corrective modelfor Jason-1 DORIS Doppler data in relation to the SouthAtlantic anomaly, J. Geodesy, 80(8-11), 507–523, DOI10.1007/s00190–006–0068–2.
Lesack, L. F. W. & Melack, J. M., 1995. Flooding hydrologyand mixture dynamics of lake water derived from multiplesources in an Amazon floodplain lake,Water Resourc. Res.,31, 329–345.
Lovelock, J., 1979.GAIA: A new look at life on Earth, OxfordUniversity Press, 157pp.
Lowe, S. T., LaBrecque, J. L., Zuffada, C., Romans, L. J.,Young, L. E., & Hajj, G. A., 2002. First spaceborne ob-servation of an Earth-reflected GPS signal,Radio Sci., 37,doi:10.1029/2000RS002539.
Lu, Z., Wicks, C., Dzurisin, D., Thatcher, W., Freymueller,J.,McNutt, S., & Mann, D., 2000. Aseismic inflation of West-dahl volcano, Alaska, revealed by satellite radar interferom-etry,Geophys. Res. Lett., 27, 1567–1570.
Luthcke, S. B., Rowlands, D. D., Lemoine, F. G., Klosko,S. M., & Chinn, D., 2006. Monthly spherical harmonic grav-ity field solutions determined from GRACE inter-satelliterange-rate data alone,Geophys. Res. Lett., 33, L02402,doi.10.1029/2005GL024846.
Ma, C., Arias, E. F., Eubanks, T. M., Fey, A. L., Gontier, A. M.,Jacobs, C., Sovers, O. J., & Archinal, B. A. Charlot, P.,1998. The International Celestial Reference Frame as real-ized by very long baseline interferometry,Astronomical J.,116, 516–546.
Mandrake, L., Wilson, B., Wang, C., Hajj, G., Mannucci, A.,& Pi, X., 2005. A performance evaluation of the operationalJet Propulsion Laboratory/University of Southern CaliforniaGlobal Assimilation Ionospheric Model (JPL/USC GAIM),J. Geophys. Res., 110, A12306, doi:10.1029/2005JA011170.
Mannucci, A. J., Wilson, B. D., Yuan, D. N., Ho, C. H.,Lindqwister, U. J., & Runge, T. F., 1998. A global mappingtechnique for GPS-derived ionospheric total electron contentmeasurements,Radio Science, 33, 565–582.
Mannucci, A. J., Iijima, B. A., Lindqwister, U. J., Pi, X.,Sparks, L., & Wilson, B. D., 1999. GPS and ionosphere, inURSI Reviews of Radio Science, 1996-1999, Oxford Univer-sity Press.
Marsh, S. & the Geohazards Theme Team, 2004. GeohazardsTheme Report, Tech. rep., IGOS Integrated Global Observ-ing Strategy, Available at http://www.igospartners.org.
Marson, I., 2000. Regional and local sea-level variations,gravimetry, in Sea level change and coastal processes- Implications for Europe, edited by D. Smith, S. B.

The Global Geodetic Observing System GGOS 2020 177
Raper, S. Zerbini, & A. Sanchez-Arcilla, pp. 91–93, Euro-pean Commission, Directorate-General for Research, EUR19337.
Martin-Mur, T. J., Abraham, D. S., Berry, D., Bhaskaran, S.,Cesarone, R. J., & Wood, L. J., 2006. The JPL roadmap fordeep space navigation (AAS 06-223), inProceedings of theAAS/AIAA 2006 Space Flight Mechanics Meeting, vol. 124of Advances in the Astronautical Sciences, pp. 1925–1932.
Martin-Neira, M., 1993. A passive reflectometry and interfer-ometry system (PARIS): Application to ocean altimetry,ESAJournal, 17, 331–355.
Massonet, D., Rossi, M., Carmosa, C., Adragna, F., Peltzer,G., Feigl, K., & Rabaute, T., 1993. The displacement fieldof the Landers earthquake mapped by radar interferometery,Nature, 364, 138–142.
McCabe, M. F. & Wood, E. F., 2006. Scale influences on theremote estimation of evapotranspiration using multiple satel-lite sensors,Remote Sensing of the Environment, 105(4),271–285.
McCarthy, D. D. & Petit, G., 2004.IERS Conventions 2003,IERS Technical Note 32, International Earth Rotation Ser-vice, Also available at http://www.iers.org.
Menke, W. & Levin, V., 2005. A strategy to rapidly determinethe magnitude of great earthquakes,Eos, Trans. Am. Geo-phys. Union, 86, 185,189.
Milburn, H. B., Nakamura, A. I., & Gonzalez, F. I., 1996. Real-time tsunami reporting from the deep ocean, inProceedingsof the Oceans 96 MTS/IEEE Conference, 23-26 September1996, Fort Lauderdale, FL, pp. 390–394.
Milly, P. C. D., Cazenave, A., & Gennero, M. C., 2003. Contri-bution of climate-driven change in continental water storageto recent sea-level rise,Proceedings of the National Academyof Sciences, 100(23), 13158–13161.
Milne, G. A., Mitrovica, J. X., & Davis, J. L., 1999. Near-field hydro-isostasy: the implementation of a revised sea-level equation,Geophys. J. Int., 139, 464–482.
Mitrovica, J. X. & Milne, G. A., 1998. Glaciation-induced per-turbations in the Earth’s rotation: A new appraisal,J. Geo-phys. Res., 103(B1), 985–1005.
Mitrovica, J. X. & Milne, G. A., 2003. On post-glacial sealevel: I. General theory,Geophys. J. Int., 154, 253–267.
Mitrovica, J. X., Davis, J. L., & Shapiro, I. I., 1994. A spec-tral formalism for computing three-dimensional deforma-tions due to surface loads 2.Present-day glacial isostaticad-justment,J. Geophys. Res., 99, 7075–7101.
Mitrovica, J. X., Tamisiea, M. E., Davis, J. L., & Milne, G. A.,2001. Recent mass balance of polar ice sheets inferred frompatterns of global sea-level change,Nature, 409, 1026–1028.
Miyazaki, S., Larson, K., Choi, K., Hikima, K., Koketsu, K.,Bodin, P., Haase, J., Emore, G., & Yamagiwa, A., 2004.Modeling the rupture process of the 2003 September 25Tokachi-Oki (Hokkaido) earthquake using 1-Hz GPS data,Geophys. Res. Lett., 31, doi:10.1029/2004GL021457.
Morel, L. & Willis, P., 2005. Terrestrial reference frame ef-fects on mean sea level determined by TOPEX/Poseidon,Adv. Space Res., 36, 358–368.
Mueller, I. & Zerbini, S., eds., 1989.The Interdisciplinary Roleof Space Geodesy, vol. 22 of Lecture Notes in Earth Sci-ences, Springer-Verlag Berlin etc.
Mueller, I. I., Rajal, B. S., & Zhu, Y. S., 1982. Comparison ofpolar motion data from the 1980 project MERIT short cam-paign, in High-Precision Earth Rotation and Earth-MoonDynamics, edited by O. Calame, vol. 94 ofAstrophysicsand Space Science Library, pp. 141–146, D. Reidel Pub-lishing Company, Dordrecht, Holland.
Mulholland, J. D., 1980. Scientific advances from ten years oflunar laser ranging,Rev. Geophys. Space Phys., 18, 549–564.
NASA, 1991. Solid earth sciences in the 1990s. volume 1 –program plan, NASA Technical Memorandum 4256, NASAOffice of Space Science and Applications, Washington D.C.
NASA, 1991. Solid earth sciences in the 1990s. volume 2 –panel reports, NASA Technical Memorandum 4256, NASAOffice of Space Science and Applications, Washington D.C.
NASA, 1991. Solid earth sciences in the 1990s. volume 3 –measurement techniques and technology, NASA TechnicalMemorandum 4256, NASA Office of Space Science and Ap-plications, Washington D.C.
National Research Council, 2004.Groundwater Fluxes AcrossInterfaces, The National Acadamies Press, Washington, DC,Report prepared by the Committee on Hydrological Sci-ence, Water Science and Technology Board, Board on Atmo-spheric Sciences and Climate, Division on Earth Life Stud-ies.
National Research Council, 2007.Earth Science and Appli-cations from Space: National Imperatives for the NextDecade and Beyond - Committee on Earth Science andApplications from Space: A community Assessment andStrategy for the Future, National Library, available athttp://books.nap.edu/catalog/11820.html.
Niebauer, T. M., Sasagawa, G. S., Faller, J. E., Hilt, R., & Klop-ping, F., 1995. A new generation of absolute gravimeters,Metrologia, 32(3), 159–180.
Niell, A., Whitney, A., Petrachenko, B., Schluter, W.,Vandenberg, N., Hase, H., Koyama, Y., Ma., C.,Schuh, H., & Tuccari, G., 2006. Vlbi 2010: Cur-rent and future requirements for Geodetic VLBI Sys-tems, in International VLBI Service for Geodesy and

The Global Geodetic Observing System GGOS 2020 178
Astronomy 2005 Annual Report, edited by D. Behrend& K. Baver, pp. 13–40, NASA/TP-2006-214136, avail-able at http://ivscc.gsfc.nasa.gov/publications/ar2005/spcl-vlbi2010/.
Nocquet, J.-M., Calais, E., Alamimi, Z., Sillard, P., & Boucher,C., 2001. Intraplate deformation in western Europe deducedfrom an analysis of the International Terrestrial ReferenceFrame 1997 (UTRF) velocity field,J. Geophys. Res., 106,11,239–11,257.
Occhipinti, G., Lognonne, P., Alam Kherani, E., & Hebert,H.,2006. Three-dimensional waveform modeling of ionosphericsignature induced by the 2004 Sumatra tsunami,Geophys.Res. Lett., 33, L20104, doi:10.1029/2006GL026865.
Okada, Y., 1992. Internal deformation due to shear and tensilefaults in a half-space,Bull. Seismo. Soc. America, 82, 1018–1040.
Oki, T. & Kanae, S., 2006. Global hydrological cycles andworld water resources,Science, 313, 1068–1072, DOI:10.1126/science.1128845.
Pavelyev, A. G., Volkov, A. V., Zakharov, A. I., Krutikh, S. A.,& Kucherjavenkov, A. I., 1996. Bistatic radar as a tool forEarth investigation using small satellites,Acta Astronautica,39(9-12), 721–730.
Peltier, W. R., 2004. Global glacial isostasy and the surface ofthe ice-age Earth: The ICE-5G(VM2) model and GRACE,Ann. Rev. Earth Planet Sci., 32, 111–149.
Pielke Jr., R. & Landsea, C. W., 1998. Normalized hurricanedamage in the United States: 1925-95,Weather and Fore-casting, 13, 621–631.
Plag, H.-P., 2005. The GGOS as the backbone for global ob-serving and local monitoring: a user driven perspective,J.Geodynamics, 40, 479–486, doi:10.1016/j.jog.2005.06.012.
Plag, H.-P., 2006. National geodetic infrastructure: current sta-tus and future requirements - the example of Norway, Bul-letin 112, Nevada Bureau of Mines and Geology, Universityof Nevada, Reno, 97 pages.
Plag, H.-P., 2006. GGOS and it user requirements, linkage andoutreach, inDynamic Planet – Monitoring and Understand-ing a Dynamic Planet with Geodetic and OceanographicTools, edited by P. Tregoning & C. Rizos, vol. 130 ofInter-national Association of Geodesy Symposia, pp. 711–718,Springer Verlag, Berlin.
Plag, H.-P. & Juttner, H.-U., 2001. Inversion of global tidegauge data for present-day ice load changes, inProceed.Second Int. Symp. on Environmental research in the Arcticand Fifth Ny-Alesund Scientific Seminar, edited by T. Ya-manouchi, no. Special Issue, No. 54 in Memoirs of the Na-tional Institute of Polar Research, pp. 301–317.
Plag, H.-P., Ambrosius, B., Baker, T. F., Beutler, G., Bianco,G., Blewitt, G., Boucher, C., Davis, J. L., Degnan, J. J.,Johansson, J. M., Kahle, H.-G., Kumkova, I., Marson, I.,Mueller, S., Pavlis, E. C., Pearlman, M. R., Richter, B.,Spakman, W., Tatevian, S. K., Tomasi, P., Wilson, P., &Zerbini, S., 1998. Scientific objectives of current and futureWEGENER activities,Tectonophysics, 294, 177–223.
Plag, H.-P., Engen, B., Clark, T. A., Degnan, J. J., &Richter, B., 1998. Post-glacial rebound and present-daythree-dimensional deformations,J. Geodynamics, 25, 263–301.
Plag, H.-P., Axe, P., Knudsen, P., Richter, B., & Verstraeten, J.,eds., 2000.European Sea Level Observing System (EOSS):Status and future developments, vol. EUR 19682, Office forOfficial Publication of the European Communities, Luxem-bourg, 72 pages.
Plag, H.-P., Romagnoli, C., & Zerbini, S., 2000. Regional andlocal sea level variations - introduction, inSea level changeand coastal processes - Implications for Europe, edited byD. Smith, S. B. Raper, S. Zerbini, & A. Sanchez-Arcilla, pp.81–84, European Commission, Directorate-General for Re-search.
Plag, H.-P., Gross, R., Chao, B. F., & Van Dam, T., 2005. Forc-ing of polar motion in the Chandler frequency band: Anopportunity to evaluate interannual climate variations,Eos,Trans. Am. Geophys. Union, 86(3), 26.
Plag, H.-P., Beutler, G., Forsberg, R., Ma, C., Neilan, R.,Pearlman, M., Richter, B., & Zerbini, S., 2006. Linkingthe Global Geodetic Observing System (GGOS) to the In-tegrated Global Observing Strategy Partnership (IGOS-P)through the Theme ’Earth System Dynamics’, inDynamicPlanet – Monitoring and Understanding a Dynamic Planetwith Geodetic and Oceanographic Tools, edited by P. Trego-ning & C. Rizos, vol. 130 ofInternational Association ofGeodesy Symposia, pp. 727–734, Springer Verlag, Berlin.
Plag, H.-P., Blewitt, G., Kreemer, C., & Hammond, W. C.,2006. Solid Earth deformations induced by the Sumatraearthquakes of 2004-2005, inDynamic Planet – Monitor-ing and Understanding a Dynamic Planet with Geodetic andOceanographic Tools, edited by P. Tregoning & C. Rizos,vol. 130 of International Association of Geodesy Sym-posia, pp. 549–556, Springer Verlag, Berlin.
Plag, H.-P., Blewitt, G., & Herring, T. A., 2007. Towards a con-sistent conventional treatment of surface-load induced defor-mations, Position Paper presented at the IERS Workshop onConventions, September 20-21, 2007, Sevres, France. Avail-able at http://www.bipm.org/en/events/iers/papers.html.
Plag, H.-P., Hammond, W., Kreemer, C., & Blewitt, G., 2007.Integrating point and image geodesy: mutual benefits andrequirements, Poster presented at the DESDynI Workshop,July 17-19, 2007, Orlando, Florida, USA.

The Global Geodetic Observing System GGOS 2020 179
Plumb, J., Larson, K., White, J., & Powers, E., 2005. Absolutecalibration of a geodetic time transfer system,IEEE Trans.Ultrason. Ferroelectr. Freq. Control, 52(11), 1904–1911.
Poli, P., Moll, P., Rabier, F., Desroziers, G., Chapnik, B.,Berre,L., Healy, S. B., Andersson, E., & El Guelai, F.-Z., 2007.Forecast impact studies of zenith total delay data from Euro-pean near real-time GPS stations in Meteo France 4DVAR,J. Geophys. Res., 112, D06114, doi:10.1029/2006JD007430.
Pollitz, F. F., 1996. Coseismic deformation from earthquakefaulting on a layered spherical Earth,Geophys. J. Int., 125,1–14.
Pollitz, F. F., 1997. Gravitational-viscoelastic postseismic re-laxation on a layered spherical Earth,J. Geophys. Res., 102,17,921–17,941.
Pongratz, J., Bounoua, L., DeFries, R. S., & et al., 2006. Theimpact of land cover change on surface energy and waterbalance in Mato Grosso, Brazil,Earth Interactions, 10, Art.No. 19.
Pritchard, M. E. & Simons, M., 2002. A satellite geodetic sur-vey of large-scale deformation of volcanic centres in the cen-tral Andes,Nature, 418, 167–171.
Ramankutty, N., 2004. Croplands in West Africa: A geograph-ically explicit dataset for use in models,Earth Interactions,8, 1–22.
Ray, J. & Senior, K., 2003. IGS/BIPM pilot project: GPS car-rier phase for time/frequency transfer and time scale forma-tion, Metrologia, 40, S270–288.
Ray, J., Dong, D., & Altamimi, Z., 2004. IGS referenceframes: Status and future improvements,GPS Solutions, pp.DOI:10.1007/s10291–004–0110–x.
Ray, J. R. & Senior, K., 2001. Temperature sensitivity of tim-ing measurements using Dorne Margolin antennas,GPS So-lutions, 5, 24–30.
Ray, J. R. & Senior, K., 2005. Geodetic techniques for time andfrequency comparisons using GPS phase and code measure-ments,Metrologia, 42, 215–232.
Raymond, C., Burbanks, D., Chao, B. F., Donnellan, A., Gille-spie, A., Henyey, T. L., Herring, T., Jordam, T., Turcotte,D. L., & Zoback, M. L., 2003. Global earthquake satellitesystem (gess) - a 20 year plan to enable earthquake predic-tion, Tech. Rep. JPL 400-1069 03/03, NASA JPL, CaliforniaInstitute of Technology, Pasadena, California.
Reigber, C., Schwintzer, P., & Luhr, H., 1999. The CHAMPgeopotential mission,Boll. Geof. Teor. Appl., 40, 285–289.
Reigber, C., Schwintzer, P., Neumayer, K.-H., Barthelmes,F.,Konig, R., Forste, C., Balmino, G., Biancale, R., Lemoine,J.-M., Loyer, S., Bruinsma, S., Perosanz, F., & Fayard,
T., 2003. The CHAMP-only EIGEN-2 Earth Gravity FieldModel,Adv. Space Res., 31(8), 1883–1888.
Reigber, C., Schmidt, R., Flechtner, F., Konig, R., Meyer,U.,Neumayer, K.-H., Schwintzer, P., & Zhu, S. Y., 2005. AnEarth gravity field model complete to degree and order 150from GRACE: EIGEN-GRACE02S,J. Geodynamics, 39, 1–10, doi: 10.1016/j.jog.2004.07.001.
Richter, B., Zerbini, S., Matonti, F., & Simon, D., 2004. Long-term crustal deformation monitored by gravity and spacetechniques at Medicina, Italy and Wettzell, Germany,J. Geo-dynamics, 38, 281–292, doi:10.1016/j.jog.2004.07.013.
Rieck, C., Jarlemark, P., Jaldehag, K., & Johansson, J., 2003.Thermal influence on the receiver chain of GPS carrierphase equipment for time and frequency transfer, inProc.2003 IEEE Int. Frequency Control Symp.and PDA ExhibitionJointly with the 17th European Frequency and Time Forum(Tampa, Florida, 5-8 May 2003), pp. 326–331.
Rizos, C. & Drane, C. R., 2004. The role of telegeoinformat-ics in its, inTelegeoinformatics: Location-Based Computingand Services, edited by H. A. Karimi & A. Hammad, CRCPress LLC, ISBN 0-415-36976-2,377 pages.
Robertson, D. S., 1991. Geophysical applications of very-long-baseline interferometry,Rev. Mod. Phys, 63(4), 899–918.
Rodell, M. & Famiglietti, J. S., 2001. An analysis of terrestrialwater storage variations in Illinois with implications fortheGravity Recovery and Climate Experiment (GRACE),Wat.Resour. Res., 37, 1327–1340.
Rodell, M. & Famiglietti, J. S., 2002. The potential for satellite-based monitoring of groundwater storage changes usingGRACE: The High Plains aquifer, central U.S.,J. Hydrol.,263, 245–256.
Rodell, M., Houser, P. R., Jambor, U., Gottschalck, J., Mitchell,K., Meng, C.-J., Arsenault, K., Cosgrove, B., Radakovich, J.,Bosilovich, M., Entin, J. K., Walker, J. P., Lohmann, D., &Toll, D., 2004. The Global Land Data Assimilation System,Bull. Amer. Meteor. Soc., 85(3), 381–394.
Rodell, M., Chen, J., Kato, H., Famiglietti, J., Nigro, J., &Wil-son, C., 2006. Estimating ground water storage changes inthe Mississippi River basin (USA) using GRACE,Hydroge-ology Journal, pp. doi:10.1007/s10040–006–0103–7.
Roeloffs, E. A., 1988. Fault stability changes induced beneatha reservoir with cyclic variations in water level,J. Geophys.Res., 93B, 2107–2124.
Roemmich, D., Willis, J., Gilson, J., Stammer, D., Koehl, A.,Yemenis, T., Chambers, D. P., Landerer, F., Marotzke, J.,Gregory, J., Suzuki, T., Church, J., White, N., Domingues,C., Cazenave, A., & Letraon, P.-Y., 2006. Global oceanwarming and sea level rise, inUnderstanding Sea-level

The Global Geodetic Observing System GGOS 2020 180
Rise and Variability, A World Climate Research ProgrammeWorkshop and a WCRP contribution to the Global EarthObservation System of Systems, 6-9 June 2006, UNESCO,Paris, edited by T. Aarup, J. Church, S. Wilson, & P. Wood-worth, pp. 33–79, WCRP, World Meterological Organiza-tion, Paris.
Rothacher, M., Beutler, G., Weber, R., & Hefty, J., 2001. High-frequency variations in Earth rotation from Global Position-ing System data,J. Geophys. Res., 106(B7), 13,711–13,738.
Rowley, R. J., Kostelnick, J. C., Braaten, D., Li, X., & Meisel,J., 2007. Risk of rising sea level to population and land area,Eos, Trans. Am. Geophys. Union, 88(9), 105, 107.
Rummel, R., 2000. Global Integrated Geodetic and Geody-namic Observing System (GIGGOS), inTowards an In-tegrated Global Geodetic Observing System, edited byR. Rummel, H. Drewes, W. Bosch, & H. Hornik, vol. 120 ofInternational Association of Geodesy Symposia, pp. 253–260, Springer, Berlin.
Rummel, R., Drewes, H., Bosch, W., & Hornik, H., eds., 2000.Towards an Integrated Global Geodetic Observing System,vol. 120 of International Association of Geodesy Sym-posia, Springer, Berlin.
Rummel, R., Drewes, H., & Beutler, G., 2002. IntegratedGlobal Geodetic Observing System (IGGOS): A candidateIAG project, inVistas for Geodesy in the New Millennium,edited by J. Adam & K.-P. Schwarx, vol. 125 ofInter-national Association of Geodesy Symposia, pp. 609–614,Springer, Berlin.
Rummel, R., Rothacher, M., & Beutler, G., 2005. GlobalGeodetic Observing System (GGOS): Science rationale,J.Geodynamics, 40, 357–362.
Sahagian, D., 2000. Global physical effects of anthropogenichydrological alterations sea level and water redistribution,Global Planet. Change, 25(1-2), 39–48.
Sahagian, D. L., Schwartz, F. W., & Jacobs, D. K., 1994. Directanthropogenic contribution to sea level rise in the twentiethcentury,Nature, 367, 54–57.
Salichon, J., LeCozannet, G., Hosford, S., Missotten, R.,& McManus, K., 2007. Igos-g theme report, Tech. rep.,BRGM, Orlean, France.
Salstein, D. A., Viron, O., Yseboodt, M., & Dehant, V., 2001.High-frequency geophysical fluid modeling necessary to un-derstand earth rotation variability,EOS, 82, 237–238.
Schaer, S., Gurtner, W., & Feltens, J., 1998. IONEX: TheIONosphere Map EXchange format version 1, inProceed-ings of the 1998 IGS Analysis Centers Workshop, ESOC,Darmstadt, Germany, February 9-11, 1998.
Schellnhuber, H.-J. & Wenzel, V., eds., 1998.Earth SystemAnalysis - Integrating Science for Sustainable Development,Springer, Berlin and others.
Schierless, L., Schunk, R. W., Sojka, J. J., & Thompson, D. C.,2004. Development of a physics-based reduced state Kalmanfilter for the ionosphere,J. Geophys. Res., pp. RS1S04,doi:10.1029/2002RS002797.
Seitz, F., Stuck, J., & Thomas, M., 2005. White noise Chandlerwobble excitation, inForcing of polar motion in the Chan-dler frequency band: A contribution to understanding inter-annual climate variations, edited by H.-P. Plag, B. Chao,R. Gross, & T. van Dam, vol. 24, p. This issue, Cahiers duCentre Europeen de Geodynamic et de Seismologie.
Sella, G. F., Doxon, T. H., & Mao, A. L., 2002. Revel: A modelfor recent plate velocities from space geodesy,J. Geophys.Res., 107, 10.1029/2000JB000033.
Seneviratne, S., Viterbo, P., Luthi, D., & Schar, C., 2004. In-ferring changes to terrestrial water storage using ERA-40 re-analysis data: The Mississippi River basin,J. Climate, 17,2039–2057.
SESWG, 2002.Living on a restless planet, NASA, JetPropulsion Laboratory, Pasadena, California, Report ofthe Solid Earth Science Working Group, also available athttp://solidearth.jpl.nasa.gov.
Shedlock, K. M., Giardini, D., Grunthal, G., & Zhang, P.,2000. The GSHAP Global Seismic Hazard Map,Seismolog-ical Res. Let., 71, 679–689.
Shelus, P. J., 2001. Lunar laser ranging: Glorious past and abright future,Surv. Geophysics, 22, 517–535.
Sherwood, R., Mannucci, A., Zuffada, C., & Heeg, C., 2006.GPS system of systems for science study, Jpl documentd-34579, Jet Propulsion Laboratory, Pasadena, California,USA.
Shiklomanov, I. A., 1993. World fresh water resources, inWa-ter in Crisis, edited by P. H. Gleick, Oxford University Press,New York.
Sideris, M., 2007. Iag closing address, Presentation at theIUGG Meeting, Perugia, Italy, July, 2007.
Skole, D. & Tucker, C., 1993. Tropical deforestation and habi-tat fracmentation in the Amazon – satellite data from 1978to 1988,Science, 261, 1104–1104.
Skole, D. L., Chomentowski, W. H., Salas, W. A., & et al.,1994. Physical and human dimensions of deforestation inAmazonia,Bioscience, 44(5), 314–322.
Smith, D. B., 1998. The emerging IGOS partnership, inPro-ceedings for the 27-th Int. Symp. on Remote Sensing of En-vironment: Information for Sustainability, June 8-12, 1998,Tromsø, Norway, pp. 99–102, Norwegian Space Centre.

The Global Geodetic Observing System GGOS 2020 181
Smith, D. E. & Turcotte, D. L., eds., 1993.Contributions ofSpace Geodesy to Geodynamics: Crustal Dynamics, vol. 23of American Geophysical Union Geodynamics Series,American Geophysical Union, Washington, D. C.
Smith, D. E. & Turcotte, D. L., eds., 1993.Contributions ofSpace Geodesy to Geodynamics: Earth Dynamics, vol. 24of American Geophysical Union Geodynamics Series,American Geophysical Union, Washington, D. C.
Smith, D. E. & Turcotte, D. L., eds., 1993.Contributionsof Space Geodesy to Geodynamics: Technology, vol. 25of American Geophysical Union Geodynamics Series,American Geophysical Union, Washington, D. C.
Smith, D. E., Christodoulidis, D. C., Kolenkiewicz, R., Dunn,P. J., Klosko, S. M., Torrence, M. H., Fricke, S., & Black-well, S., 1985. A global geodetic reference frame from LA-GEOS ranging (sl5.1ap),J. Geophys. Res., 90, 9221–9233.
Smith, D. E., Kolenkiewicz, R., Dunn, P. J., Robbins, J. W.,Torrence, M. H., Klosko, S. M., Williamson, R. G., Pavlis,E. C., Douglas, N. B., & K., F. S., 1990. Tectonic motionand deformation from satellite laser ranging to LAGEOS,J.Geophys. Res., 95, 22013–22041.
Smith, D. E., Kolenkiewicz, R., Nerem, R. S., Dunn, P. J., Tor-rence, M. H., Robbins, J. W., Klosko, S. M., Williamson,R. G., & Pavlis, E. C., 1994. Contemporary global horizon-tal crustal motion,Geophys. J. Int., 119, 511–520.
Smith, D. E., Zuber, M. T., Frey, H. V., Garvin, J. B., Head,J. W., Muhleman, D. O., Pettengill, G. H., Phillips, R. J.,Solomon, S. C., Zwally, H. J., & Banerdt, W. B., 1998. To-pography of the northern hemisphere of Mars from the Marsorbiter laser altimeter,Science, 279, 1686–1692.
Smith, R. D., Maltrud, M. E., Bryan, F., & Hecht, M. W., 2000.Numerical simulation of the North Atlantic Ocean at 1/10,J. Phys. Oceanogr., 30, 1532–1561.
Smith, W. H. F. & Sandwell, D. T., 2004. Conventionalbathymetry, bathymetry from space, and geodetic altimetry,Oceanography, 17(1-2), 8–23.
Smrekar, S. E., McGill, G. E., Raymond, C. A., & Dimitriou,A. M., 2004. Geologic evolution of the Martian dichotomy inthe Ismenius area of Mars and implications for plains mag-netization,J. Geophys. Res., 109, E11002.
Solomon, S. C. & the Solid Earth Science Working Group,2002. Living on a restless planet, NASA, Jet Propul-sion Laboratory, Pasadena, California, also available athttp://solidearth.jpl.nasa.gov.
Soudarin, L. & Cretaux, J. F., 2006. A model of present-day tectonic plate motions from 12 years of DORISmeasurements,J. Geodesy, 80(8-11), 609–624, DOI10.1007/s00190–006–0090–4.
Soudarin, L., Cretaux, J.-F., & Cazenave, A., 1999. Verti-cal crustal motions from the DORIS space-geodesy system,Geophys. Res. Lett., 26(9), 1207–1210.
Sovers, O. J., Fanselow, J. L., & Jacobs, C. S., 1998. Astrom-etry and geodesy with radio interferometry: Experiments,models, results,Rev. Mod. Phys., 70(4), 1393–1454.
Space Studies Board, 2005.Earth science and applicationsfrom space: urgent needs and opportunities to servethe Nation, Committee on Earth Science and Applica-tions from Space: A Community Assessment and Strat-egy for the Future, Space Studies Board, National Re-search Council, Washington, D.C., USA, Available athttp://www.nap.edu/catalog/11281.html.
Spencer, P. S. J., Robertson, D. S., & Mader, G. L., 2004. Iono-spheric data assimilation methods for geodetic applications,in Proceedings of IEEE PLANS 2004, Monterey, California,April 26-29, 2004, pp. 510–517.
Spencer, R. & Vassie, J. M., 1997. The evolution of deep oceanpressure measurements in the U.K.,Progress in Oceanogra-phy, 40, 423–435.
Spiess, F. N., 1990. Seafloor geodesy by the year 2000, inGeodesy in the Year 2000, edited by Commission on Phys-ical Sciences, Mathematics, and Applications, pp. 100–113,The National Academies Press, Free online version availableat http://darwin.nap.edu/books/0309041457/html.
Steffen, K., Thomas, R., Rignot, E., Cogley, G., Dyurgerov,M., Raper, S., & Huybrechts, P., 2006. Cryospheric contribu-tions to sea-level rise and variability, inUnderstanding Sea-level Rise and Variability, A World Climate Research Pro-gramme Workshop and a WCRP contribution to the GlobalEarth Observation System of Systems, 6-9 June 2006, UN-ESCO, Paris, edited by T. Aarup, J. Church, S. Wilson, &P. Woodworth, pp. 79–107, WCRP, World Meterological Or-ganization, Paris.
Stolz, A., Bender, P. L., Faller, J. E., Silverberg, E. C., Mul-holland, J. D., Shellus, P. J., Williams, J. G., Carter, W. E.,Currie, D. G., & Kaula, W. M., 1976. Earth rotation mea-sured by lunar laser ranging,Science, 193, 997–999.
Strozzi, T., Tosi, L., Wegmuller, U., Teatini, P., Carbognin, L.,& Rosselli, R., 2002. Thematic and land subsidence maps ofthe Lagoon of Venice from ERS SAR Interferometry,Geo-phys. Res. Lett., 29(13), 345–347.
Sun, W. & Okubo, S., 1998. Surface potential and gravitychanges due to internal dislocations in a spherical Earth -II. Application to a finite fault,Geophys. J. Int., 132, 79–88.
Sun, W., Okubo, S., & Fu, G. Y., 2006. Green’s functions of co-seismic strain changes and investigation of effects of Earth’sspherical curvature and radial heterogeneity,Geophys. J. Int.,167, 1273–1291.

The Global Geodetic Observing System GGOS 2020 182
Talwani, P. & Acree, S., 1985. Pore pressure diffusion and themechanism of reservoir-induced seismicity,Pure Appl. Geo-phys., 122, 947–965.
Tapley, B. D., Schutz, B. E., & Eanes, R. J., 1985. Station co-ordinates, baselines, and Earth rotation from LAGEOS laserranging: 1976-1984,J. Geophys. Res., 90, 9235–9248.
Tapley, B. D., Schutz, B. E., Eanes, R. J., Ries, J. C., &Watkins, M. M., 1993. Lageos laser ranging contributions togeodynamics, geodesy, and orbital dynamics, inContribu-tions of Space Geodesy to Geodynamics: Earth Dynamics,edited by D. E. Smith & D. L. Turcotte, vol. 24 ofAmeri-can Geophysical Union Geodynamics Series, pp. 147–173,American Geophysical Union, Washington, D. C.
Tapley, B. D., Bettadpur, S., Ries, J. C., Thompson, P. F., &Watkins, M. M., 2004. GRACE measurements of mass vari-ability in the Earth system,Science, 305, 503–505.
Tapley, B. D., Bettadpur, S., Watkins, M., & Reigber, C.,2004. The gravity recovery and climate experiment: missionoverview and early results,Geophys. Res. Lett., 31, L09607,doi: 10.1029/2004GL019920.
Tardin, A. T. & da Cunha, R. P., 1990. Report inpe-5015-rpe/609, Tech. rep., Instituto de Pesquisas Espaciais, SaoJose dos Campos, Brazil.
Tavernier, G. & et al., 2006. The International DORIS Service:genesis and early achievements,J. Geodesy, 80(8-11), 403–417, DOI 10.1007/s00190–006–0082–4.
Thomas, M., Dobslaw, H., Stuck, J., & Seitz, F., 2005. Theocean’s contribution to polar motion excitation - as manysolutions as numerical models?, inForcing of polar mo-tion in the Chandler frequency band: A contribution to un-derstanding interannual climate variations, edited by H.-P.Plag, B. Chao, R. Gross, & T. van Dam, vol. 24, p. Thisissue, Cahiers du Centre Europeen de Geodynamic et deSeismologie.
Thornton, C. L. & Border, J. S., 2000. Radiometrictracking techniques for deep space navigation, Mono-graph 1, Jet Propulsion Laboratory, California Instituteof Technology, Pasadena, CA, http://descanso.jpl.nasa.-gov/Monograph/series1/Descanso1all.pdf.
Titov, V., Gonzaalez, F. I., Bernard, E. N., Eble, M. C., Mofjeld,H. O., Newman, J. C., & Venturato, A. J., 2005. Real-timetsunami forecasting: Challenges and solution,Natural Haz-ards, 35, 41–48.
Titov, V., Rabinovich, A. B., Mofjeld, H. O., Thomson, R. E.,&Gonzalez, F. I., 2005. The global reach of the 26 December2004 Sumatra tsunami,Science, 309, 2045–2048.
Townshend, J. R. & the IGOL Writing Team, 2004. In-tegrated Global Observations of the Land: A proposed
theme to the IGOS Partnership - Version 2, Tech. rep.,IGOS Integrated Global Observing Strategy, Proposal pre-pared by the IGOL Proposal Team, May 2004, available athttp://www.igospartners.org.
Townshend, J. R. G. & Justice, C. O., 1995. Spatial variabil-ity of images and the monitoring of changes in the normal-ized difference vegetation index,Intern. J. Remote Sensing,16(12), 2187–2195.
Treuhaft, R. N., Lowe, S. T., Zuffada, C., & Chao, Y., 2001.2-cm GPS altimetry over Crater lake,Geophys. Res. Lett.,22(23), 4343–4346.
Turner II, B. L., Clark, W. C., Kates, R. W., Richards, J. F.,Mathews, J. T., & Meyer, W. B., eds., 1990.The Earthas Transformed by Human Action: Global and RegionalChanges in the Biosphere Over the Past 300 Years, Univer-sity Press, Cambridge, 713 pages.
UNAVCO, 1998. Supporting research into Earth pro-cesses and hazards via high-precision geodesy usingthe Global Positioning System, Available online athttp://www.unavco.org/pubsreports/brochures/1998-UNAVCO/1998UNAVCO.html.
United Nations, 2006.Water - a shared responsibility. TheUnited Nations Water Development Report 2, UNESCO,Paris, and Berghahn Books, New York.
Van Camp, M., Williams, S. D. P., & Francis, O., 2005. Uncer-tainty of absolute gravity measurements,J. Geophys. Res.,110, B05406, doi:10.1029/ 2004JB003497.
Van Dam, T., Plag, H.-P., Francis, O., & Gegout, P., 2003.GGFC Special Bureau for Loading: current status and plans,in Proceedings of the IERS Global Geophysical Fluid Cen-ter Workshop, Munich, November 20-21, 2002, edited byB. Richter, W. Schwegman, & R. Dick, no. 30 in Interna-tional Earth Rotation and Reference System Service, IERSTechnical Note, pp. 180–198.
Vecchi, G. A., Wittenberg, A. T., Held, I. M., Leetmaa, A.,& Harrison, M. J., 2006. Weakening of tropical pacific at-mospheric circulation due to anthropogenic forcing,Nature,441, 73–76, doi:10.1038/nature04744.
Velicogna, I. & Wahr, J., 2005. Greenland mass bal-ance from GRACE,Geophys. Res. Lett., 32, L18505,doi:10.1029/2005GL023955.
Velicogna, I. & Wahr, J., 2006. Measurements of time-variablegravity show mass loss in Antarctica,Science, 311, 1754–1756.
Vigny, C., Simons, W. J. F., Abu, S., Bamphenyu, R., Satira-pod, C., Choosakul, N., Subarya, C., Socquet, A., Omar, K.,Abidin, H. Z., & Ambrosius, B. A. C., 2005. Insight intothe 2004 Sumatra-Andaman earthquake from GPS measure-ments in southeast Asia,Nature, 436, 201–206.
The Global Geodetic Observing System GGOS 2020 183
Wahr, J., Swenson, S., Zlotnicki, V., & Velicogna, I., 2004.Time-variable gravity from GRACE: First results,Geophys.Res. Lett., 31, L11501, doi:10.1029/2004GL019779.
Wahr, J., Swenson, S., & Velicogna, I., 2006. The accuracy ofGRACE mass estimates,Geophys. Res. Lett., 33, L06401,doi:10.1029/2005GL025305.
Wahr, J. M., 1981. A normal mode expansion for the forcedresponse of a rotating earth,Geophys. J. R. Astron. Soc., 64,651–675.
Wahr, J. M., Dazhong, H., & Trupin, A., 1995. Predictionof vertical uplift caused by changing polar ice volumes onvisco-elastic Earth,Geophys. Res. Lett., 22, 977–980.
Wang, Z. & Ormsbee, L., 2005. Comparison between proba-bilistic seismic hazard analysis and flood frequency analysis,Eos, Trans. Am. Geophys. Union, 86, 45,51–52.
Williams, D. & Townshend, J. R. G., 1998. The concept of anIntegrated Global Observing Strategy, inProceedings for the27-th Int. Symp. on Remote Sensing of Environment: Infor-mation for Sustainability, June 8-12, 1998, Tromsø, Norway,pp. 95–98, Norwegian Space Centre.
Williams, D., Rank, D., Kijek, R., Cole, S., & Pagiatakis, S.,2005. National geodetic infrastructure requirements study,Study report NRCan 03 - 0628, Natural Resources Canada,Final unpublished Report, prepared by BearingPoint; avail-able on request from NRC.
Williams, J. G., Newhall, X. X., & Dickey, J. O., 1993. Lu-nar laser ranging: Geophysical results and reference frames,in Contributions of Space Geodesy to Geodynamics: EarthDynamics, edited by D. E. Smith & D. L. Turcotte, vol. 24of American Geophysical Union Geodynamics Series, pp.83–88, American Geophysical Union, Washington, D. C.
Willis, P. & Heflin, M. B., 2004. External validation of theGRACE GGM01C gravity field using GPS and DORISpositioning results,Geophys. Res. Lett., 31(13), L13616,doi:10.1029/2004GL020038.
Willis, P., Haines, B., Berthias, J. P., Sengenes, P., & Le Mouel,J. L., 2004. Behaviour of the DORIS/Jason oscillator overthe South Atlantic Anomaly,C. R. Geosci., 336(9), 839–846.DOI 10.1016/j.crte.204.01.004.
Willis, P., Jayles, C., & Bar-Sever, Y., 2006. DORIS: From orbitdetermination for altimeter missions to geodesy,C. R. Geo-science, p. doi:10.1016/j.crte.2005.11.013.
Woodworth, P. & Player, R., 2003. The Permanent Service forMean Sea Level: an update to the 21st century,J. CoastalResearch, 19, 287–295.
Woodworth, P. L., Aarup, T., Merrifield, M., Mitchum, G. T., &Le Provost, C., 2003. Measuring progress of the Global SeaLevel Observing System,Eos, Trans. Am. Geophys. Union,84(50), 565, 10.1029/2003EO500009.
Woppelmann, G., Zerbini, S., & Marcos, M., 2006.Tide gauges and geodesy: a secular synergy illustratedby three present-day case studies,C.R. Geoscience, p.doi:10.1016/j.crte.2006.07.006.
Wu, X., Argus, D. F., Heflin, M. B., Ivins, E. R., & Webb, F. H.,2002. Site distribution and aliasing effects in the inversionfor load coefficients and geocenter motion from GPS data,Geophys. Res. Lett., 29, 2210, doi: 10.1029/2002GL016324.
Wu, X., Heflin, M. B., Ivins, E. R., Argus, D. F., & Webb, F. H.,2003. Large-scale global surface mass variations inferredfrom GPS measurements of load-induced deformation,Geo-phys. Res. Lett., 30, 1742, doi: 10.1029/2003GL017546.
Wu, X., Heflin, M. B., Ivins, E. R., & Fukumori, I., 2006. Sea-sonal and interannual global surface mass variations frommultisatellite geodetic data,J. Geophys. Res., 111, B09401,doi:10.1029/2005JB004100.
Yoder, C. F., Konopliv, A. S., Yuan, D. N., Standish, E. M., &Folkner, W. M., 2003. Fluid core size of mars from detectionof the solar tide,Science, 300, 299–303.
Zebker, H., ed., 2005.InSAR Workshop Summary Report, Octo-ber 20-22, 2004, Oxnard, California, NASA, Jet ProbulsionLaboratory, Pasadena, California, USA.
Zerbini, S., Plag, H.-P., Baker, T., Becker, M., Billiris, H.,Burki, B., Kahle, H.-G., Marson, I., Pezzoli, L., Richter,B.,Romangoli, C., Sztobryn, M., Tomasi, P., Tsimplis, M., Veis,G., & Verrone, G., 1996. Sea level in the Mediterranean: afirst step towards separation of crustal movements and abso-lute sea-level variations,Global and Planetary Change, 14,1–48.
Zerbini, S., Negusini, M., Romagnoli, C., Domenichini, F.,Richter, B., & Simon, D., 2002. Multi-parameter continu-ous observations to detect ground deformation and to studyenvironmental variability impacts,Global Planet. Change,34(1-2), 37–58.
Zerbini, S., Richter, B., Rocca, F., van Dam, T., & Matonti, F.,2006. A combination of space and terrestrial geodetic tech-niques to monitor land subsidence: Case Study, the South-eastern Po Plain, Italy,J. Geophys. Res., Submitted.
Zuffada, C., Elfouhaily, T., & Lowe, S., 2003. Sensitiv-ity analysis of wind vector measurements from ocean re-flected GPS signals,Rem. Sens. Environ., 88, 341–350,doi:10.1016/S0034–4257(03)00175–5.
Zwally, H. J., Abdalati, W., Herring, T., Larson, K., Saba, J.,& Steffen, K., 2002. Surface melt-induced acceleration ofgreenland ice-sheet flow,Science, 297, 218–222.

The Global Geodetic Observing System GGOS 2020 184
APPENDICES
A List of Authors, and Reviewers
A.1 Authors
EditorsPlag, Hans-Peter, USAMichael Pearlman, USA
Chapter Lead Authors:Beutler, Gerhard, Switzerland (Chapter 10)Gross, Richard S., USA (Chapter 7)Herring, Thomas A., USA (Chapter 8)Plag, Hans-Peter, USA (Exec. Sum., Chapters 1, 2, and 11)Rizos, Chris, Australia (Chapter 4)Rothacher, Markus, Germany (Chapter 9)Rummel, Rainer, Germany (Chapter 3)Sahagian, Dork, USA (Chapter 5)Zumberge, James F., USA (Chapter 6)
Contributing authorsAbshire, J., ??? (Chapter 5)Alsdorf, D., ??? (Chapter 5)Altamimi, Zuheir, France (Chapters 2, 8)Bettadpur, Srinivas, USA (Chapters 2)Beutler, Gerhard, Switzerland (Exec. Sum., Chapters 1, 2, 3, 7,9, 11)Beyerle, G., ??? (Chapter 2)Border, J. S., USA, (Chapter 6)Bosch, Wolfgang, Germany (Chapter 9)Brzezinska, Doreta, USA (Chapter 4)Cazenave, Anny, France (Chapter 2)Crossley, David, USA (Chapter 2)Davis, P., ??? (Chapter 5)Dehant, Veronique, Belgium (Chapters 3, 6)Donnellan, Andrea, USA (Chapters 2, 9)Folkner, W. M., USA (Chapter 6)Forsberg, Rene, Denmark (Chapters 2, 4)Gross, Richard S., USA (Exec. Sum., Chapters 1, 3, 9, 11)Herring, Thomas A., USA (Exec. Sum., Chapters 1, 11)Hinderer, Jacques, France (Chapters 2, 9)Houser, P., ??? (Chapter 5)Ilk, K. H., Germany (Chapter 3)Johnston, Garry, Australia (Chapter 4)Jones, D. L., USA (Chapter 6)Komjathy, A., USA (Chapter 2)Kremmer, Cornelius, USA (Chapter 5)Lilja Bye, Bente, Norway (Exec. Sum.)Ma, Chopo, USA (Chapters 2, 9)Mannucci, A. J., USA, (Chapter 2)Martin-Mur, T., USA (Chapter 6)Melack, J., ??? (Chapter 5)Neilan, Ruth, USA (Chapter 10)
Noll, Carey, USA (Chapter 2)Nothnagel, Axel, Germany (Chapter 2)Oberst, Jochen, Germany (Chapter 6)Pavlis, Erricos C., USA (Chapter 2)Pearlman, Michael R., USA, (Chapters 1, 2, 5, 9, 10)Plag, Hans-Peter, USA (Chapters 3, 5, 7, 8, 9, 10)Poli, Paul, France (Exec. Sum., Chapters 2, 3, 5, 8, 11)Ray, Jim , USA (Chapter 8)Reid, S. (Chapter 5)Ries, J., USA (Chapter 9)Rizos, Chris, Australia (Exec. Sum., Chapters 1, 11)Rodell, Matthew, USA (Chapter 5)Rothacher, Markus, Germany (Exec. Sum., Chapters 1, 3, 10,11)Rummel, Rainer, Germany (Exec. Sum., Chapters 1, 10, 11)Sahagian, Dork, USA (Exec. Sum., Chapters 1, 11)Schreiber, Uli, Germany (Chapter 2)Schuh, Harald, Austria (Chapter 9)Seitz, Frank, Germany (Chapter 9)Senior, K., USA (Chapter 2)Shum, C. K., USA (Chapter 9)Smith, Dru, USA (Chapters 4, 9)Stein, Seth, USA (Chapter 3)Thomas, Maik, Germany (Chapter 9)Thomas, Robert, USA (Chapters 3, 5)Velacognia, E., ??? (Chapter 9)Wahr, John, USA (Chapter 9)Williams, J. G., USA (Chapter 6)Willis, Pascal, France (Chapter 9)Woodworth, Philip L., U.K. (Chapters 2, 3)Wu, Xiaoping, USA (Chapter 6)Zerbini, Susanna, Italy (Chapters 2, 3)Zlotnicki, Victor, USA (Chapter 3)Zumberge, James, USA (Exec. Sum., Chapters 1, 11)
A.2 Reviewers
Hughes, Chris, U.K.Miller, Norman, USAMueller, Ivan I., USAReigber, Christoph, GermanySanso, Fernado, ItalyTscherning, Christian, Denmark

The Global Geodetic Observing System GGOS 2020 185
B Definitions
Convention: In the context of this report, convention refersto an agreement between groups, especially an internationalagreement, that is slightly less formal than a treaty. Conven-tions are for example the agreed-upon way to transform frominertial frame to terrestrial frame, splitting three unique anglesthat connect the two frames to a set of conventionally definedsub-group of angles (polar motion, Earth rotation, nutation andprecession). In geodesy, conventions often regulate ways toprocess data in order to ensure comparability of the resultingproducts. In many cases, standards (see below) adopted by e.g.IAG/IUGG become part of conventions. For example, stan-dards that define the “refractivity” of the atmosphere at variouswavelengths adopted by IAG/IUGG are later used in “conven-tional” approaches of the determination of the propagationde-lays through the atmosphere.
Core Station or Core Site: Geodetic site with three or morespace-geodetic techniques co-located and connected throughwell monitored (on the level of 1 mm) local ties between thetechniques. In most cases, a core site will include at least threeout of SLR, VLBI, GNSS, and DORIS and also be co-locatedwith absolute and relative (superconducting) gravimeters.
Standard: In geodesy, a standard refers to an authorizedmodel (normally authorized by IAG or IUGG or other inter-national bodies recognized by IAG/IUGG) used to define a unitof measurement. Examples of standards are the definition ofthe meter, the speed of light, and similar physical constants.

The Global Geodetic Observing System GGOS 2020 186
C Acronyms and abbreviations
AC Analysis CenterAG Absolute gravimeterAIRS Atmospheric Infra-Red SounderANZLIC Australia and New Zealand Land Information CouncilASDI Australian Spatial Data InfrastructureAVHRR Advanced Very High Resolution RadiometerBGI International Gravimetric BureauBIPM Bureau International des Poids et MesuresBPR Bottom Pressure RecorderCCRS Conventional Celestial Reference SystemCDR Critical Design ReviewCDRF Conventional Dynamic Reference FrameCEOS Committee for Earth Observation SatellitesCGDI Canadian Geospatial Data InfrastructureCGNSS Continous GNSSCGPS Continuous GPSCHAMP Challenging Minisatellite PayloadCM Center of Mass of the whole Earth systemCMV Common Mode VariationsCEOS Committee for Earth Observation SatellitesCOPES Coordinated Observation and Prediction of the Earth SystemCORES Continuously Operating GPS StationsCRS Celestial Reference SystemCSRS Canadian Spatial Reference SystemCTF Control track farmingCTRS Conventional Terrestrial Reference SystemDEM Digital Elevation ModelDIMERS Dynamical Integrated Modular Earth Rotation SystemDORIS Doppler Orbitography and Radiopositioning Integrated by
SatellitesDSM Digital Surface ModelDST Dynamic Sea Surface TopographyDyMEG Dynamic Model for the Earth Rotation and GravityECEF Earth-centered, Earth-fixedECGN European Combined Geodetic NetworkEGG European Gravimetric GeoidEGN Earth Gravity ModelEGNOS European Geostationary Navigation Overlay ServiceENSO El Nino Southern OscillationEOP Earth Orientation ParametersEOS Earth Observation SummitEPN European Permanent NetworkERNP European Radio Navigation PlanERP Earth Rotation ParameterESEAS European Sea Level ServiceETRS Eurasisan Terrestrial Reference SystemEUREF European Reference FrameEuroGOOS European Part of the Global Ocean Observing SystemFAGS Federation of Astronomical and Geophysical Data Analysis
ServicesFANS Future Air Navigation SystemFAO Food and Agriculture OrganizationFGDC Federal Geographic Data CommitteeFIG International Federation of SurveyorsFOC Full Operational CapabilityFR Final ReviewG3OS Global Three Observing SystemsGA Geoscience AustraliaGCM General Circulation ModelGCOS Global Climate Observing SystemGDP Gross Domestic Productad hocGEO ad hocGroup on Earth Observations
GEO (permanent) Group on Earth ObservationsGEOSS Global Earth Observation System of SystemsGGFC (IERS) Global Geophysical Fluid CenterGGOS Global Geodetic Observing SystemGGP Global Geodynamics ProjectGIM Global Ionospheric MappingGIS Geographic Information SystemsGLONASS Global Navigation Satellite SystemGLOSS Global Sea Level Observing SystemGMES Global Monitoring of Environment and SecurityGNSS Global Navigation Satellite SystemGNSSS Global Navigation Satellite System of SystemsGOCE Gravity field and steady-state Ocean Circulation ExplorerGOOS Global Ocean Observing SystemGPS Global Positioning SystemGPS&IGS GPS system combined with IGS productsGRACE Gravity Recovery and Climate ExperimentGRS Geodetic Reference SystemGRS80 Geodetic Reference System 1980GSOGTOS Global Terrestrial Observing SystemGVA Gross Value AddedHRSC High Resolution Stereo CameraIAG International Association of GeodesyIAIN International Association of Institutes of NavigationIAS International Altimetry ServiceIAU International Astronomic UnionICAO International Civil Aviation OrganisationICET International Center for Earth TidesICRF International Celestial Reference FrameICRS International Celestial Reference SystemICSM Intergovernmental Committee on Surveying and MappingICSU International Council for ScienceICT Information and Communication TechnologyIDS International DORIS ServiceIEEE originally an acronym for the Institute of Electrical and Elec-
tronics Engineers, Inc.; today a name by itselfIERS International Earth Rotation and Reference Systems ServiceIGeS International Geoid ServiceIGFS International Gravity Field ServiceIGOL Integrated Global Observation for LandIGOS Integrated Global Observing StrategyIGOS-P Integrated Global Observing Strategy PartnershipIGS International GNSS ServiceILRS International Laser Ranging ServiceIMO International Maritime OrganisationINS Inertial Navigation SystemsInSAR Interferometric Synthetic Aperture RadarINSPIRE Infrastructure for Spatial Information in EuropeIOC International Oceanographic CommissionION Institute of NavigationIPCC Intergovernmental Panel on Climate ChangeIPWV Integrated Precipitable Water Vapor ContentIRNSS Indian Radionavigation Satellite SystemISIS International SAR Information SystemISPRS International Society for Photogrammetry and RemoteSensingISR Incoherent Scatter RadarsITRF International Terrestrial Reference FrameITRS International Terrestrial Reference SystemIUGG International Union of Geodesy and GeophysicsIVS International VLBI Service for Geodesy and Astrometry

The Global Geodetic Observing System GGOS 2020 187
IYPE International Year Of Planet EarthJPL Jet Propulsion LaboratoryLBS Location-Based ServiceLEO Low Earth OrbitersLLR Lunar Laser RangingLOD Length of DayLRO Lunar Reconnaissance OrbiterLSL Local Sea LevelMEO-belt Medium Earth Orbit-beltMERIT Monitoring Earth Rotation and Inter-comparison of Tech-
niquesMGS Mars Global SurveyorMLA Mercury Laser AltimeterMODIS Moderate-Resolution Imaging SpectroradiometerMOLA Mars Orbiting Laser AltimeterMSAS Multifunctional Transport Satellite Space-based Augmentation
SystemMYRTLE Multi Year Return Time Level EquipmentNASA National Aeronautics and Space AdministrationNGANGOS Nordic Geodynamic Observing SystemNGRF Norwegian Geodetic Reference FrameNGRS Australian National Geospatial Reference SystemNGS National Geodetic SurveyNKG Nordic Geodetic CommissionNMA Norwegian Mapping AuthorityNNGI Norwegian National Geodetic InfrastructureNNR No Net RotationNNT No Net TranslationNOAA National Oceanic and Atmospheric AgencyNRT near-real timeNSDI National Spatial Data InfrastructureNSRS National Spatial Reference SystemOMB Office of Management and BudgetPARIS Passive Reflectometry and Interferometry SystemPF Precision FarmingPGR Post-Glacial ReboundPM Polar Motionppb parts per billionPPP Precise Point PositioningPRR Preliminary Requirement ReviewPSMSL Permanent Service for Mean Sea LevelQZSS Quasi-Zenith Satellite SystemRFO Reference Frame OriginRLR Revised Local ReferenceRRR Roling Requirement ReviewRTK Real-Time KinematicSA Selected AvailabilitySATREF Satellite based reference systemSB Special BureauSBA Societal Benefit AreaSBAS Satellite-Based Augmentation SystemSBL (IERS GGFC) Special Bureau for LoadingSCIGN Southern California Integrated GPS NetworkSDI Spatial Data InfrastructureSG Superconducting gravimeterSI International System of UnitsSiS Signal in SpaceSLR Satellite Laser RangingSOC Satellite Orbits and ClocksSPS Standard Positioning ServiceSRTM Shuttle Radar Topography Mission
SSM/I Special Sensor Microwave/ImagerTAI International Atomic TimeTCG Geocentric Coordinate TimeTEC Total Electron ContentTIGA TIde GAuge Pilot ProjectTSR Terrestrial Reference SystemTT Terrestrial TimeUAV Unmanned Aerial VehicleUC User CategoryUK-DMC United Kindom’s Desaster Monitoring ConstellationUN United NationsUNEP United Nations Environmental ProgrammeUNFCCC United Nations Framework Convention on Climate ChangeUR User RequirementUTC Coordinated Universal TimeWAAS Wide Area Augmentation SystemWCRP World Climate Research ProgrammeWGS84 World Geodetic System 1984WMO World Meteorological OrganisationWSSD World Summit on Sustainable DevelopmentWWW World Wide WebVLBA Very Long Baseline ArrayVLBI Very Long Baseline InterferometryVSI VLBI Standard Interface

Sponsored by: