Embed Size (px)
Citation preview

The Global Flows of Metals and Minerals
By Donald G. Rogich and Grecia R. Matos
Open-File Report 2008–1355
U.S. Department of the InteriorU.S. Geological Survey
ii
U.S. Department of the InteriorDIRK KEMPTHORNE, Secretary
U.S. Geological SurveyMark D. Myers, Director
U.S. Geological Survey, Reston, Virginia: 2008
For product and ordering information: World Wide Web: http://www.usgs.gov/pubprod Telephone: 1–888–ASK–USGS
For more information on the USGS the Federal source for science about the Earth, its natural and living resources, natural hazards, and the environment: World Wide Web: http://www.usgs.gov Telephone: 1–888–ASK–USGS
Any use of trade, product, or firm names is for descriptive purposes only and does not imply endorsement by the U.S. Government.
Although this report is in the public domain, permission must be secured from the individual copyright owners to reproduce any copyrighted materials contained within this report.
Suggested citation:Rogich, D.G., and Matos, G.R., 2008, The global flows of metals and minerals: U.S. Geological Survey Open-File Report 2008–1355, 11 p., available only online at http://pubs.usgs.gov/of/2008/1355/.
iii
Contents
Abstract ...........................................................................................................................................................1The Metals and Minerals Database ...........................................................................................................1Trajectory of Global Metals and Minerals Flows ......................................................................................3Country Comparisons ....................................................................................................................................5Equity Consideration, per Capita Consumption, and Extraction/Consumption
Patterns ..............................................................................................................................................5Global Extraction and Consumption Patterns ...........................................................................................6Use of Secondary Resources and Accretion in Stock ............................................................................7Outputs.............................................................................................................................................................8Future Studies...............................................................................................................................................10Concluding Remarks....................................................................................................................................10References Cited..........................................................................................................................................11
Figures
1. World gross domestic product and world population ............................................................3 2. Global metals and minerals extraction .....................................................................................3 3. Global aluminum, copper, lead, and zinc consumption ..........................................................3 4. Global iron and steel consumption ............................................................................................3 5. Global chromium and nickel consumption ...............................................................................4 6. Global extraction of toxic metals ...............................................................................................4 7. Cadmium consumption by country ............................................................................................4 8. Global extraction of fertilizer minerals ......................................................................................4 9. Cement consumption of the world and China ..........................................................................5 10. Finished steel consumption by country ....................................................................................5 11. Copper consumption by country. ...............................................................................................5 12. Aluminum consumption by country. ..........................................................................................5 13. Cement consumption by country. ..............................................................................................5 14. Finished steel consumption per capita by country. ................................................................6 15. Copper consumption per capita by country .............................................................................6 16. Aluminum consumption per capita by country ........................................................................6 17. Cement consumption per capita by country ............................................................................6
18. Consumption and extraction in the European Union group of 15 countries .......................7 19. Consumption and extraction in North America .......................................................................7 20. Consumption and extraction in South America .......................................................................8 21. Consumption and extraction in China .......................................................................................8 22. Consumption and extraction in China .......................................................................................9 23. Consumption and extraction in India.........................................................................................9 24. Graph illustrating calculated world metals recycling rates ................................................10 25. Calculated world processing wastes for 12 selected mineral commodities ....................10 26. Calculated world sulfur release from nonferrous smelting .................................................10
iv
Tables
1. Minerals and metals included in the global database ...........................................................2 2. Calculated world concentration and processing wastes for selected mineral
commodities in 2004 .....................................................................................................................9
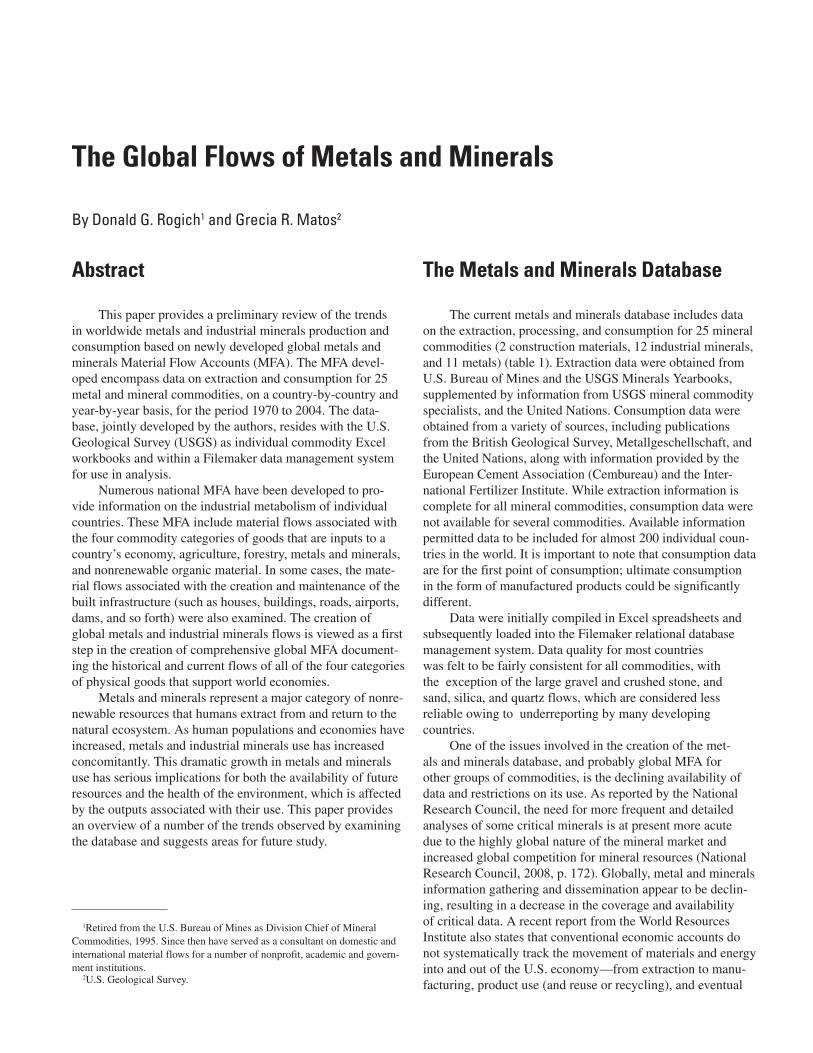
Abstract
This paper provides a preliminary review of the trends in worldwide metals and industrial minerals production and consumption based on newly developed global metals and minerals Material Flow Accounts (MFA). The MFA devel-oped encompass data on extraction and consumption for 25 metal and mineral commodities, on a country-by-country and year-by-year basis, for the period 1970 to 2004. The data-base, jointly developed by the authors, resides with the U.S. Geological Survey (USGS) as individual commodity Excel workbooks and within a Filemaker data management system for use in analysis.
Numerous national MFA have been developed to pro-vide information on the industrial metabolism of individual countries. These MFA include material flows associated with the four commodity categories of goods that are inputs to a country’s economy, agriculture, forestry, metals and minerals, and nonrenewable organic material. In some cases, the mate-rial flows associated with the creation and maintenance of the built infrastructure (such as houses, buildings, roads, airports, dams, and so forth) were also examined. The creation of global metals and industrial minerals flows is viewed as a first step in the creation of comprehensive global MFA document-ing the historical and current flows of all of the four categories of physical goods that support world economies.
Metals and minerals represent a major category of nonre-newable resources that humans extract from and return to the natural ecosystem. As human populations and economies have increased, metals and industrial minerals use has increased concomitantly. This dramatic growth in metals and minerals use has serious implications for both the availability of future resources and the health of the environment, which is affected by the outputs associated with their use. This paper provides an overview of a number of the trends observed by examining the database and suggests areas for future study.
The Metals and Minerals Database
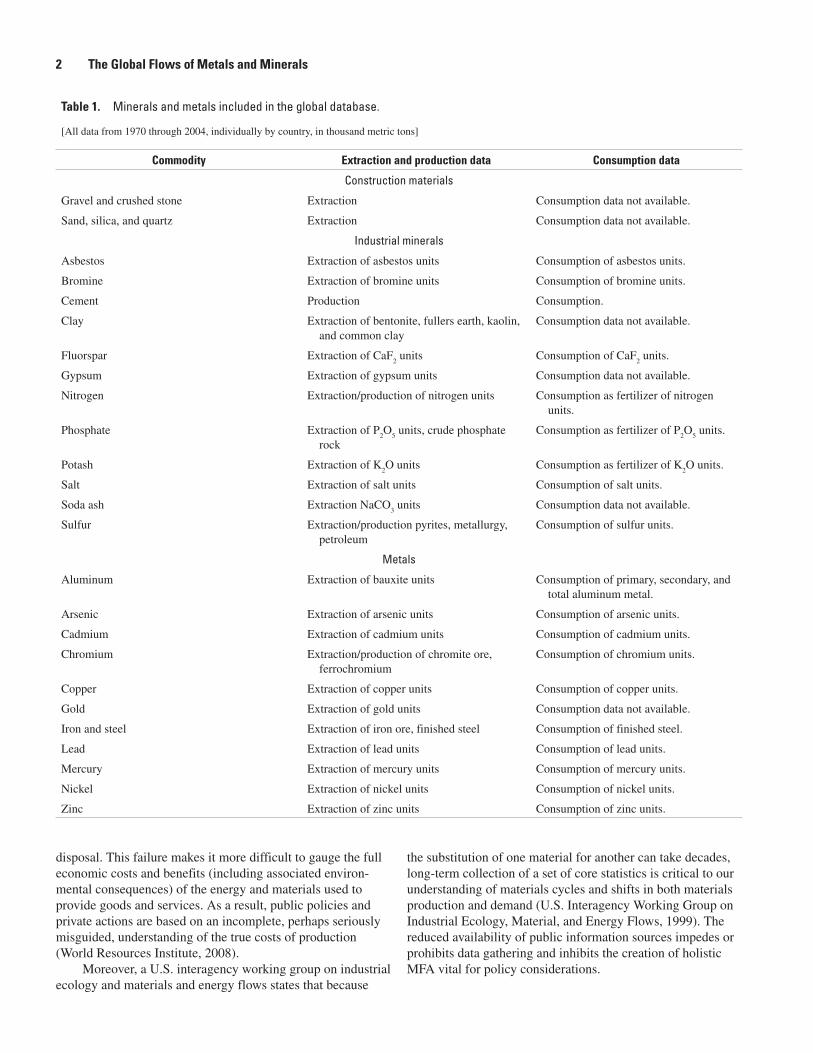
The current metals and minerals database includes data on the extraction, processing, and consumption for 25 mineral commodities (2 construction materials, 12 industrial minerals, and 11 metals) (table 1). Extraction data were obtained from U.S. Bureau of Mines and the USGS Minerals Yearbooks, supplemented by information from USGS mineral commodity specialists, and the United Nations. Consumption data were obtained from a variety of sources, including publications from the British Geological Survey, Metallgeschellschaft, and the United Nations, along with information provided by the European Cement Association (Cembureau) and the Inter-national Fertilizer Institute. While extraction information is complete for all mineral commodities, consumption data were not available for several commodities. Available information permitted data to be included for almost 200 individual coun-tries in the world. It is important to note that consumption data are for the first point of consumption; ultimate consumption in the form of manufactured products could be significantly different.
Data were initially compiled in Excel spreadsheets and subsequently loaded into the Filemaker relational database management system. Data quality for most countries was felt to be fairly consistent for all commodities, with the exception of the large gravel and crushed stone, andsand, silica, and quartz flows, which are considered less reliable owing to underreporting by many developing countries.
One of the issues involved in the creation of the met-als and minerals database, and probably global MFA for other groups of commodities, is the declining availability of data and restrictions on its use. As reported by the National Research Council, the need for more frequent and detailed analyses of some critical minerals is at present more acute due to the highly global nature of the mineral market and increased global competition for mineral resources (National Research Council, 2008, p. 172). Globally, metal and minerals information gathering and dissemination appear to be declin-ing, resulting in a decrease in the coverage and availability of critical data. A recent report from the World Resources Institute also states that conventional economic accounts do not systematically track the movement of materials and energy into and out of the U.S. economy—from extraction to manu-facturing, product use (and reuse or recycling), and eventual
The Global Flows of Metals and Minerals
By Donald G. Rogich1 and Grecia R. Matos2
1Retired from the U.S. Bureau of Mines as Division Chief of Mineral Commodities, 1995. Since then have served as a consultant on domestic and international material flows for a number of nonprofit, academic and govern-ment institutions. 2U.S. Geological Survey.
2 The Global Flows of Metals and Minerals
Table 1. Minerals and metals included in the global database.
[All data from 1970 through 2004, individually by country, in thousand metric tons]
Commodity Extraction and production data Consumption data
Construction materials
Gravel and crushed stone Extraction Consumption data not available.
Sand, silica, and quartz Extraction Consumption data not available.
Industrial minerals
Asbestos Extraction of asbestos units Consumption of asbestos units.
Bromine Extraction of bromine units Consumption of bromine units.
Cement Production Consumption.
Clay Extraction of bentonite, fullers earth, kaolin, and common clay
Consumption data not available.
Fluorspar Extraction of CaF2 units Consumption of CaF
2 units.
Gypsum Extraction of gypsum units Consumption data not available.
Nitrogen Extraction/production of nitrogen units Consumption as fertilizer of nitrogen units.
Phosphate Extraction of P2O
5 units, crude phosphate
rock Consumption as fertilizer of P
2O
5 units.
Potash Extraction of K2O units Consumption as fertilizer of K
2O units.
Salt Extraction of salt units Consumption of salt units.
Soda ash Extraction NaCO3 units Consumption data not available.
Sulfur Extraction/production pyrites, metallurgy, petroleum
Consumption of sulfur units.
Metals
Aluminum Extraction of bauxite units Consumption of primary, secondary, and total aluminum metal.
Arsenic Extraction of arsenic units Consumption of arsenic units.
Cadmium Extraction of cadmium units Consumption of cadmium units.
Chromium Extraction/production of chromite ore, ferrochromium
Consumption of chromium units.
Copper Extraction of copper units Consumption of copper units.
Gold Extraction of gold units Consumption data not available.
Iron and steel Extraction of iron ore, finished steel Consumption of finished steel.
Lead Extraction of lead units Consumption of lead units.
Mercury Extraction of mercury units Consumption of mercury units.
Nickel Extraction of nickel units Consumption of nickel units.
Zinc Extraction of zinc units Consumption of zinc units.
disposal. This failure makes it more difficult to gauge the full economic costs and benefits (including associated environ-mental consequences) of the energy and materials used to provide goods and services. As a result, public policies and private actions are based on an incomplete, perhaps seriously misguided, understanding of the true costs of production (World Resources Institute, 2008).
Moreover, a U.S. interagency working group on industrial ecology and materials and energy flows states that because
the substitution of one material for another can take decades, long-term collection of a set of core statistics is critical to our understanding of materials cycles and shifts in both materials production and demand (U.S. Interagency Working Group on Industrial Ecology, Material, and Energy Flows, 1999). The reduced availability of public information sources impedes or prohibits data gathering and inhibits the creation of holistic MFA vital for policy considerations.
Trajectory of Global Metals and Minerals Flows 3
Trajectory of Global Metals and Minerals Flows
While the database permits the examination of individual metal and mineral commodities and countries singly or in any combination, this paper discusses only selected commodity and country examples to illustrate some of the analytic pos-sibilities. The underlying factors driving the trends observed below are considered appropriate subjects for future study and no attempt has been made to do so comprehensively, other than to describe what has taken place.
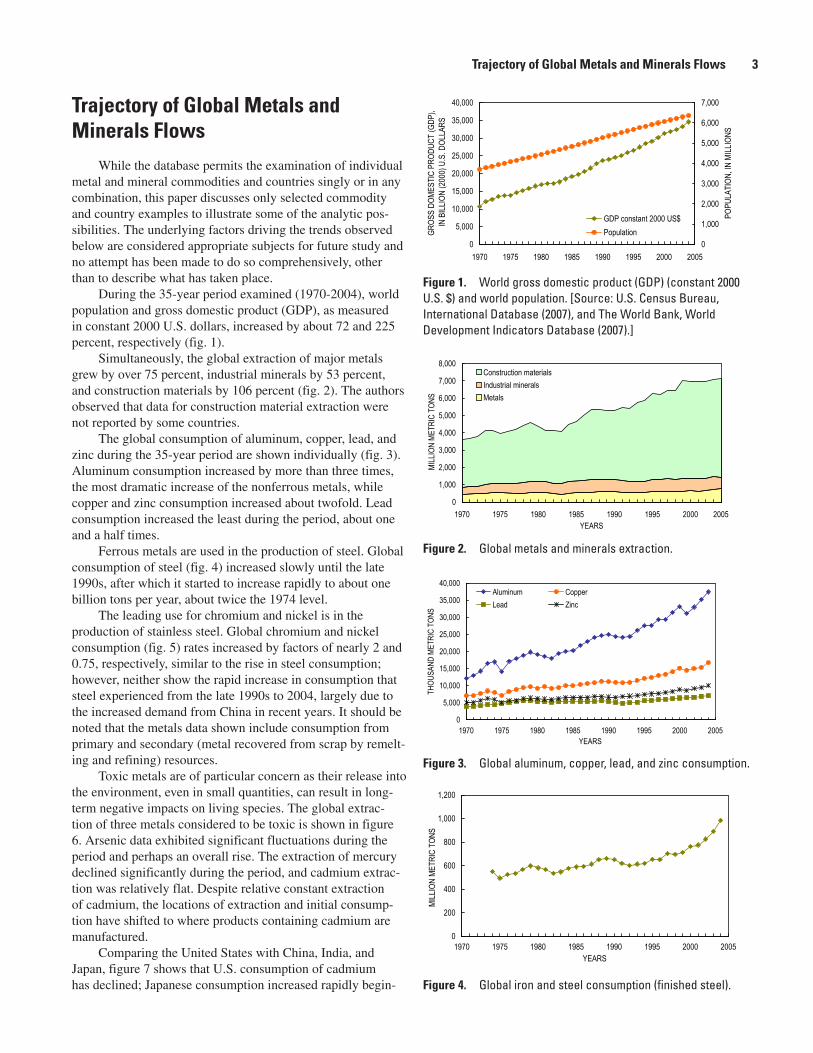
During the 35-year period examined (1970-2004), world population and gross domestic product (GDP), as measured in constant 2000 U.S. dollars, increased by about 72 and 225 percent, respectively (fig. 1).
Simultaneously, the global extraction of major metals grew by over 75 percent, industrial minerals by 53 percent, and construction materials by 106 percent (fig. 2). The authors observed that data for construction material extraction were not reported by some countries.
The global consumption of aluminum, copper, lead, and zinc during the 35-year period are shown individually (fig. 3). Aluminum consumption increased by more than three times, the most dramatic increase of the nonferrous metals, while copper and zinc consumption increased about twofold. Lead consumption increased the least during the period, about one and a half times.
Ferrous metals are used in the production of steel. Global consumption of steel (fig. 4) increased slowly until the late 1990s, after which it started to increase rapidly to about one billion tons per year, about twice the 1974 level.
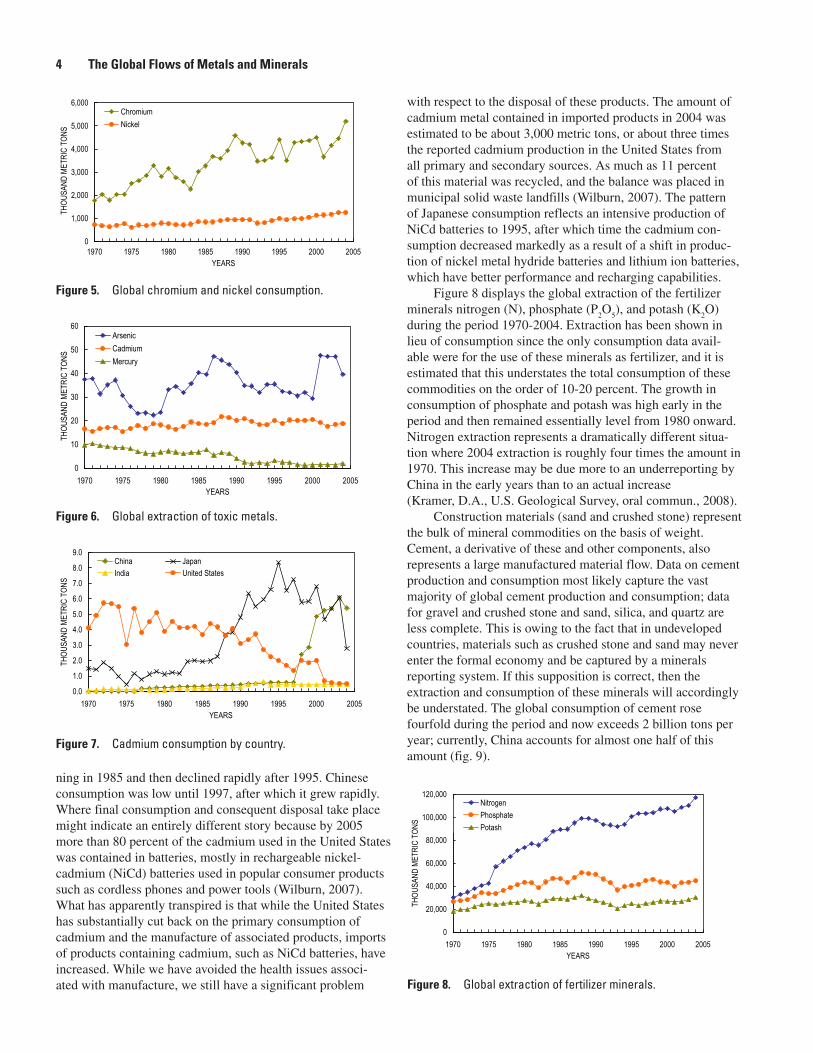
The leading use for chromium and nickel is in the production of stainless steel. Global chromium and nickel consumption (fig. 5) rates increased by factors of nearly 2 and 0.75, respectively, similar to the rise in steel consumption; however, neither show the rapid increase in consumption that steel experienced from the late 1990s to 2004, largely due to the increased demand from China in recent years. It should be noted that the metals data shown include consumption from primary and secondary (metal recovered from scrap by remelt-ing and refining) resources.
Toxic metals are of particular concern as their release into the environment, even in small quantities, can result in long-term negative impacts on living species. The global extrac-tion of three metals considered to be toxic is shown in figure 6. Arsenic data exhibited significant fluctuations during the period and perhaps an overall rise. The extraction of mercury declined significantly during the period, and cadmium extrac-tion was relatively flat. Despite relative constant extraction of cadmium, the locations of extraction and initial consump-tion have shifted to where products containing cadmium are manufactured.
Comparing the United States with China, India, and Japan, figure 7 shows that U.S. consumption of cadmium has declined; Japanese consumption increased rapidly begin-
FIGURE 1
0
5,000
10,000
15,000
20,000
25,000
30,000
35,000
40,000
1970 1975 1980 1985 1990 1995 2000 2005YEARS
GROS
S DO
MEST
IC P
RODU
CT (G
DP),
IN B
ILLIO
N (2
000)
U.
.S.
DOL
LARS
0
1,000
2,000
3,000
4,000
5,000
6,000
7,000
POPU
LATI
ON, IN
MILL
IONS
GDP constant 2000 US$Population
Figure 1. World gross domestic product (GDP) (constant 2000 U.S. $) and world population. [Source: U.S. Census Bureau, International Database (2007), and The World Bank, World Development Indicators Database (2007).]
FIGURE 2
0
1,000
2,000
3,000
4,000
5,000
6,000
7,000
8,000
1970 1975 1980 1985 1990 1995 2000 2005YEARS
MILL
ION
METR
IC T
ONS
Construction materialsIndustrial mineralsMetals
Figure 2. Global metals and minerals extraction.FIGURE 3
0
5,000
10,000
15,000
20,000
25,000
30,000
35,000
40,000
1970 1975 1980 1985 1990 1995 2000 2005YEARS
THOU
SAND
MET
RIC
TONS
Aluminum CopperLead Zinc
Figure 3. Global aluminum, copper, lead, and zinc consumption.FIGURE 4
0
200
400
600
800
1,000
1,200
1970 1975 1980 1985 1990 1995 2000 2005YEARS
MILL
ION
METR
IC T
ONS
Figure 4. Global iron and steel consumption (finished steel).
4 The Global Flows of Metals and Minerals
ning in 1985 and then declined rapidly after 1995. Chinese consumption was low until 1997, after which it grew rapidly. Where final consumption and consequent disposal take place might indicate an entirely different story because by 2005 more than 80 percent of the cadmium used in the United States was contained in batteries, mostly in rechargeable nickel-cadmium (NiCd) batteries used in popular consumer products such as cordless phones and power tools (Wilburn, 2007). What has apparently transpired is that while the United States has substantially cut back on the primary consumption of cadmium and the manufacture of associated products, imports of products containing cadmium, such as NiCd batteries, have increased. While we have avoided the health issues associ-ated with manufacture, we still have a significant problem
FIGURE 8
0
20,000
40,000
60,000
80,000
100,000
120,000
1970 1975 1980 1985 1990 1995 2000 2005YEARS
THOU
SAND
MET
RIC
TONS
NitrogenPhosphatePotash
Figure 8. Global extraction of fertilizer minerals.
FIGURE 7
0.0
1.0
2.0
3.0
4.0
5.0
6.0
7.0
8.0
9.0
1970 1975 1980 1985 1990 1995 2000 2005YEARS
THOU
SAND
MET
RIC
TONS
ChinaIndia
JapanUnited States
Figure 7. Cadmium consumption by country.
FIGURE 5
0
1,000
2,000
3,000
4,000
5,000
6,000
1970 1975 1980 1985 1990 1995 2000 2005YEARS
THOU
SAND
MET
RIC
TONS
ChromiumNickel
Figure 5. Global chromium and nickel consumption.
FIGURE 6
0
10
20
30
40
50
60
1970 1975 1980 1985 1990 1995 2000 2005YEARS
THOU
SAND
MET
RIC
TONS
ArsenicCadmiumMercury
Figure 6. Global extraction of toxic metals.
with respect to the disposal of these products. The amount of cadmium metal contained in imported products in 2004 was estimated to be about 3,000 metric tons, or about three times the reported cadmium production in the United States from all primary and secondary sources. As much as 11 percent of this material was recycled, and the balance was placed in municipal solid waste landfills (Wilburn, 2007). The pattern of Japanese consumption reflects an intensive production of NiCd batteries to 1995, after which time the cadmium con-sumption decreased markedly as a result of a shift in produc-tion of nickel metal hydride batteries and lithium ion batteries, which have better performance and recharging capabilities.
Figure 8 displays the global extraction of the fertilizer minerals nitrogen (N), phosphate (P
2O
5), and potash (K
2O)
during the period 1970-2004. Extraction has been shown in lieu of consumption since the only consumption data avail-able were for the use of these minerals as fertilizer, and it is estimated that this understates the total consumption of these commodities on the order of 10-20 percent. The growth in consumption of phosphate and potash was high early in the period and then remained essentially level from 1980 onward. Nitrogen extraction represents a dramatically different situa-tion where 2004 extraction is roughly four times the amount in 1970. This increase may be due more to an underreporting by China in the early years than to an actual increase (Kramer, D.A., U.S. Geological Survey, oral commun., 2008).
Construction materials (sand and crushed stone) represent the bulk of mineral commodities on the basis of weight. Cement, a derivative of these and other components, also represents a large manufactured material flow. Data on cement production and consumption most likely capture the vast majority of global cement production and consumption; data for gravel and crushed stone and sand, silica, and quartz are less complete. This is owing to the fact that in undeveloped countries, materials such as crushed stone and sand may never enter the formal economy and be captured by a minerals reporting system. If this supposition is correct, then the extraction and consumption of these minerals will accordingly be understated. The global consumption of cement rose fourfold during the period and now exceeds 2 billion tons per year; currently, China accounts for almost one half of this amount (fig. 9).

Equity Consideration, per Capita Consumption, and Extraction/Consumption Patterns 5
Country Comparisons
Figures 10–13 display the consumption trends for selected commodities for China, the European Union group of 15 countries (EU-15), India, the Republic of Korea, and the United States. These graphs show the dramatic rise in consumption in China as its economy developed. This trend stands in contrast with the rather slower and intermittent growth of the United States and EU-15 where a higher stage of development was achieved earlier. While consumption of steel, copper, aluminum, and cement in China increased modestly from 1970 to about 1995, subsequent to that period, consumption grew very rapidly. Currently, China consumes about one-half of the world’s annual production of cement and 25 percent of the world’s steel. While the growth in consump-tion of these commodities was also high for India and the Republic of Korea, the absolute quantities consumed are small compared with China.
Equity Consideration, per Capita Consumption, and Extraction/Consumption Patterns
An examination of the rates of consumption per capita provides a somewhat different picture than that portrayed by considering absolute material flows. Per capita consumption rates for aluminum, copper, steel, and cement were examined for China, the EU-15, India, the Republic of Korea, the United States, and the world as a whole for the period 1970–2004 (figs. 14–17). The first observation in the per capita analysis is the rapid increase in per capita consumption of these com-modities by the Republic of Korea. High growth rates existed for all four commodities due to rapid industrialization up until the Asian financial crisis at the end of 1997. The economy of the Republic of Korea focused on heavy industry and automo-tive production during the 1970s and 1980s, which required intensive use of steel, copper, and aluminum. Later, the electronics, telecommunications, motor vehicle, shipbuilding,
FIGURE 9
0
500
1,000
1,500
2,000
2,500
1970 1975 1980 1985 1990 1995 2000 2005YEARS
MILL
ION
METR
IC T
ONS
WorldChina
Figure 9. Cement consumption of the world and China.
FIGURE 10
0
50
100
150
200
250
300
1970 1975 1980 1985 1990 1995 2000 2005YEARS
MILL
ION
METR
IC T
ONS
China EU-15India Republic of KoreaUnited States World
Figure 10. Finished steel consumption by country.
FIGURE 11
0
500
1,000
1,500
2,000
2,500
3,000
3,500
4,000
4,500
1970 1975 1980 1985 1990 1995 2000 2005YEARS
THOU
SAND
MET
RIC
TONS
China EU-15India Republic of KoreaUnited States World
Figure 11. Copper consumption by country.FIGURE 12
0
2,000
4,000
6,000
8,000
10,000
12,000
1970 1975 1980 1985 1990 1995 2000 2005YEARS
THOU
SAND
MET
RIC
TONS
China EU-15India Republic of KoreaUnited States World
Figure 12. Aluminum consumption by country.
FIGURE 13
100200300400500600700800900
1,000
1970 1975 1980 1985 1990 1995 2000 2005YEARS
MILL
ION
METR
IC T
ONS
China EU-15India Republic of KoreaUnited States
0
Figure 13. Cement consumption by country.
6 The Global Flows of Metals and MineralsFIGURE 14
0
200
400
600
800
1,000
1,200
1970 1975 1980 1985 1990 1995 2000 2005YEARS
METR
IC T
ONS
PER
PEO
PLE China EU-15
India Republic of KoreaUnited States World
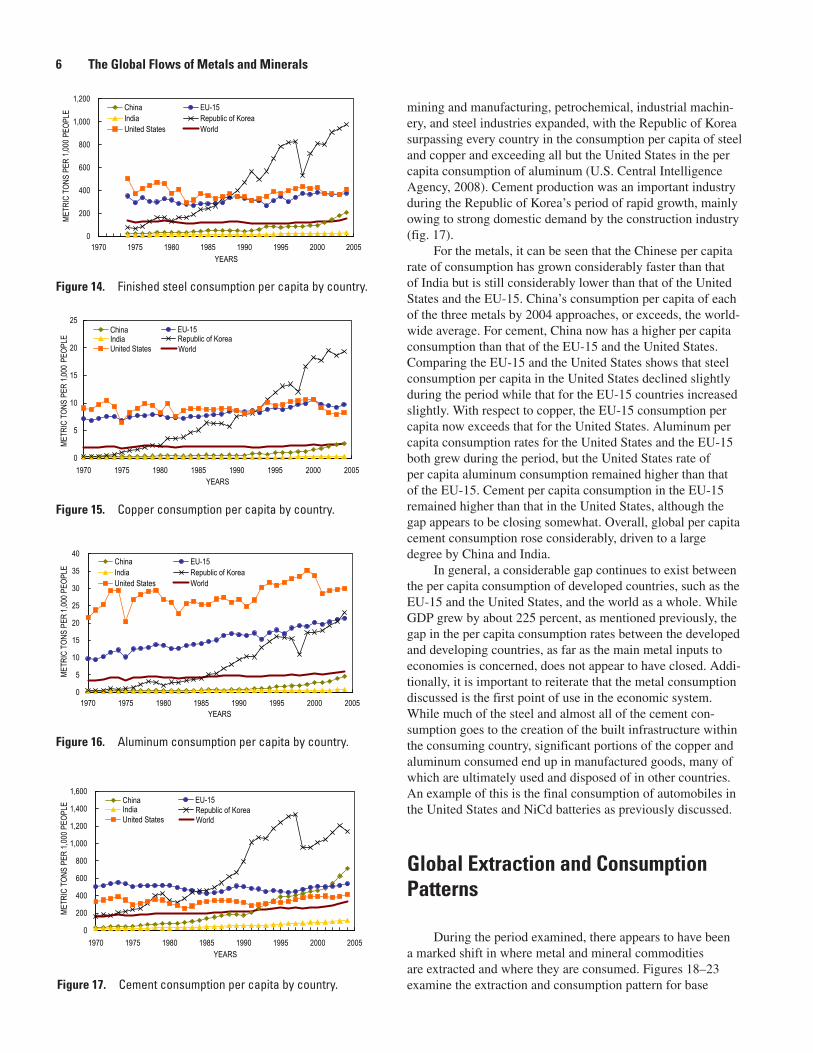
1,000
Figure 14. Finished steel consumption per capita by country.FIGURE 15
0
5
10
15
20
25
1970 1975 1980 1985 1990 1995 2000 2005YEARS
METR
IC T
ONS
PER
1,000
PEO
PLE
China EU-15India Republic of KoreaUnited States World
Figure 15. Copper consumption per capita by country.
FIGURE 16
0
5
10
15
20
25
30
35
40
1970 1975 1980 1985 1990 1995 2000 2005YEARS
METR
IC T
ONS
PER
1,00
0 PEO
PLE
China EU-15India Republic of KoreaUnited States World
Figure 16. Aluminum consumption per capita by country.
FIGURE 17
0
200
400
600
800
1,000
1,200
1,400
1,600
1970 1975 1980 1985 1990 1995 2000 2005YEARS
METR
IC T
ONS
PER
1,00
0 PEO
PLE China EU-15
India Republic of KoreaUnited States World
Figure 17. Cement consumption per capita by country.
mining and manufacturing, petrochemical, industrial machin-ery, and steel industries expanded, with the Republic of Korea surpassing every country in the consumption per capita of steel and copper and exceeding all but the United States in the per capita consumption of aluminum (U.S. Central Intelligence Agency, 2008). Cement production was an important industry during the Republic of Korea’s period of rapid growth, mainly owing to strong domestic demand by the construction industry (fig. 17).
For the metals, it can be seen that the Chinese per capita rate of consumption has grown considerably faster than that of India but is still considerably lower than that of the United States and the EU-15. China’s consumption per capita of each of the three metals by 2004 approaches, or exceeds, the world-wide average. For cement, China now has a higher per capita consumption than that of the EU-15 and the United States. Comparing the EU-15 and the United States shows that steel consumption per capita in the United States declined slightly during the period while that for the EU-15 countries increased slightly. With respect to copper, the EU-15 consumption per capita now exceeds that for the United States. Aluminum per capita consumption rates for the United States and the EU-15 both grew during the period, but the United States rate of per capita aluminum consumption remained higher than that of the EU-15. Cement per capita consumption in the EU-15 remained higher than that in the United States, although the gap appears to be closing somewhat. Overall, global per capita cement consumption rose considerably, driven to a large degree by China and India.
In general, a considerable gap continues to exist between the per capita consumption of developed countries, such as the EU-15 and the United States, and the world as a whole. While GDP grew by about 225 percent, as mentioned previously, the gap in the per capita consumption rates between the developed and developing countries, as far as the main metal inputs to economies is concerned, does not appear to have closed. Addi-tionally, it is important to reiterate that the metal consumption discussed is the first point of use in the economic system. While much of the steel and almost all of the cement con-sumption goes to the creation of the built infrastructure within the consuming country, significant portions of the copper and aluminum consumed end up in manufactured goods, many of which are ultimately used and disposed of in other countries. An example of this is the final consumption of automobiles in the United States and NiCd batteries as previously discussed.
Global Extraction and Consumption Patterns
During the period examined, there appears to have been a marked shift in where metal and mineral commodities are extracted and where they are consumed. Figures 18–23 examine the extraction and consumption pattern for base
Use of Secondary Resources and Accretion in Stock 7
FIGURE 18-C
0
5,000
10,000
15,000
20,000
25,000
1970 1975 1980 1985 1990 1995 2000 2005YEARS
THOU
SAND
MET
RIC
TONS
ConsumptionExtraction
C
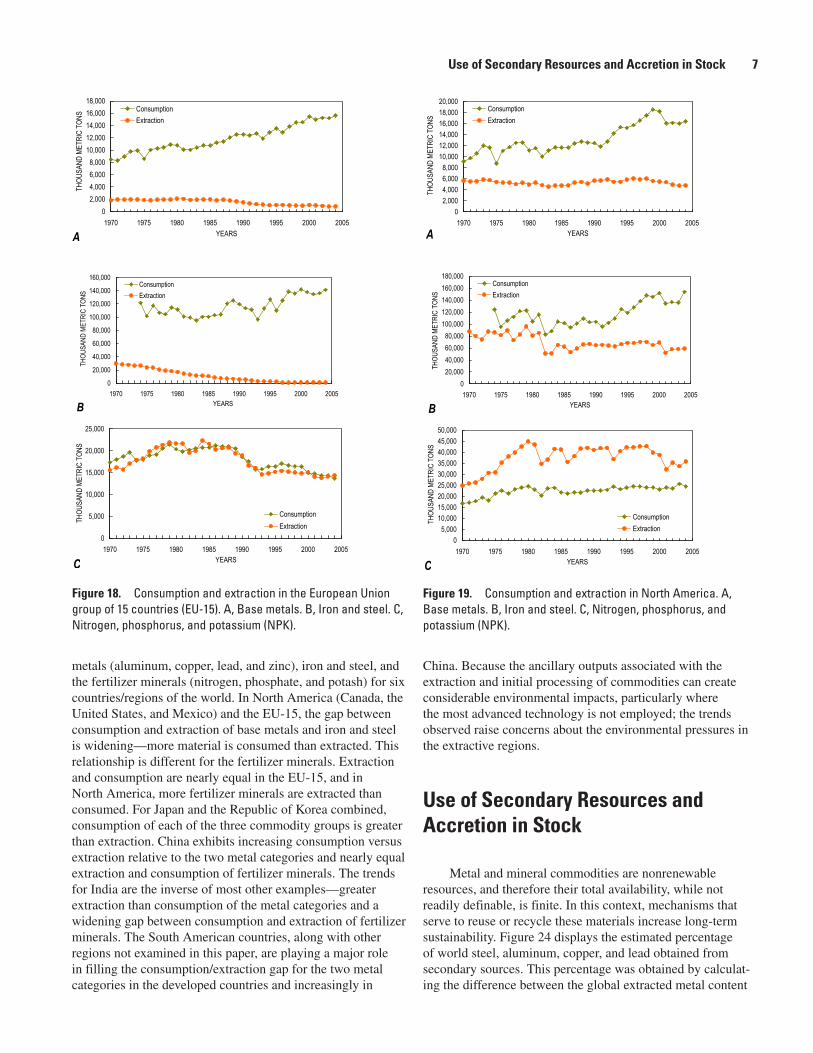
Figure 18. Consumption and extraction in the European Union group of 15 countries (EU-15). A, Base metals. B, Iron and steel. C, Nitrogen, phosphorus, and potassium (NPK).
FIGURE 18-A
02,0004,0006,0008,000
10,00012,00014,00016,00018,000
1970 1975 1980 1985 1990 1995 2000 2005YEARS
THOU
SAND
MET
RIC
TONS
ConsumptionExtraction
AFIGURE 18-B
0
20,000
40,000
60,000
80,000
100,000
120,000
140,000
160,000
1970 1975 1980 1985 1990 1995 2000 2005YEARS
THOU
SAND
MET
RIC
TONS
ConsumptionExtraction
B
FIGURE 19-B
020,00040,00060,00080,000
100,000120,000140,000160,000180,000
1970 1975 1980 1985 1990 1995 2000 2005YEARS
THOU
SAND
MET
RIC
TONS
ConsumptionExtraction
B FIGURE 19-C
05,000
10,00015,00020,00025,00030,00035,00040,00045,00050,000
1970 1975 1980 1985 1990 1995 2000 2005YEARS
THOU
SAND
MET
RIC
TONS
ConsumptionExtraction
C
FIGURE 19-A
02,0004,0006,0008,000
10,00012,00014,00016,00018,00020,000
1970 1975 1980 1985 1990 1995 2000 2005YEARS
THOU
SAND
MET
RIC
TONS
ConsumptionExtraction
A
Figure 19. Consumption and extraction in North America. A, Base metals. B, Iron and steel. C, Nitrogen, phosphorus, and potassium (NPK).
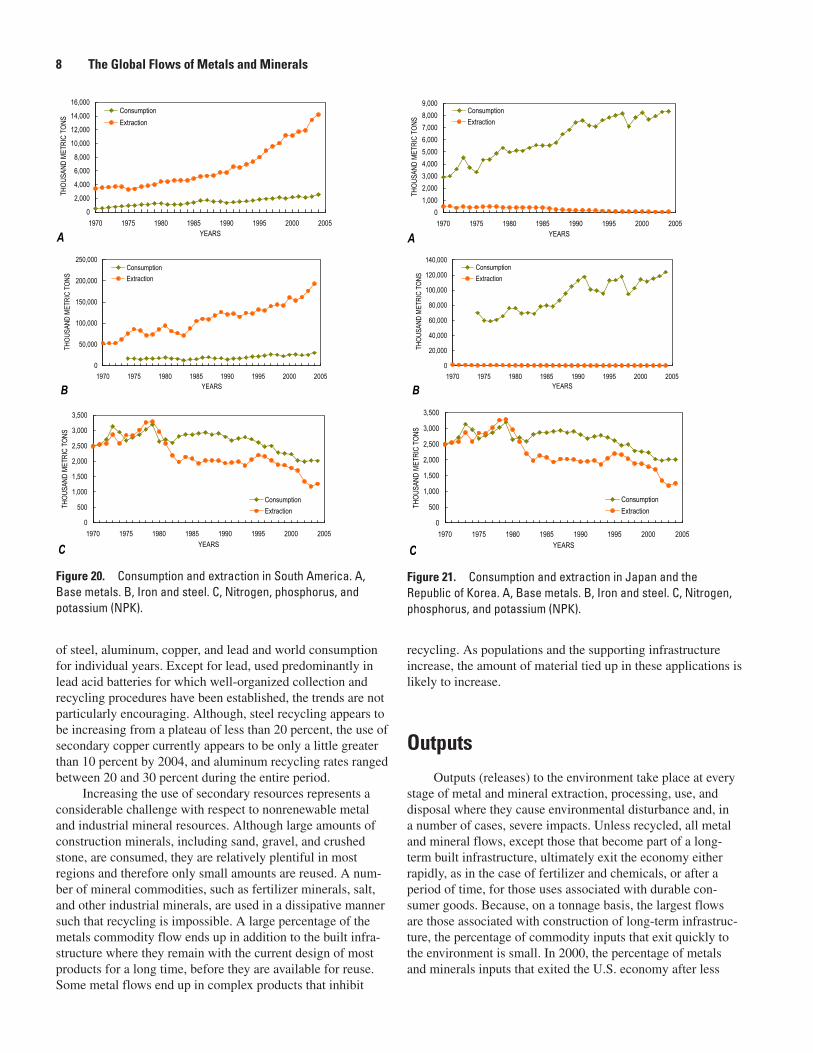
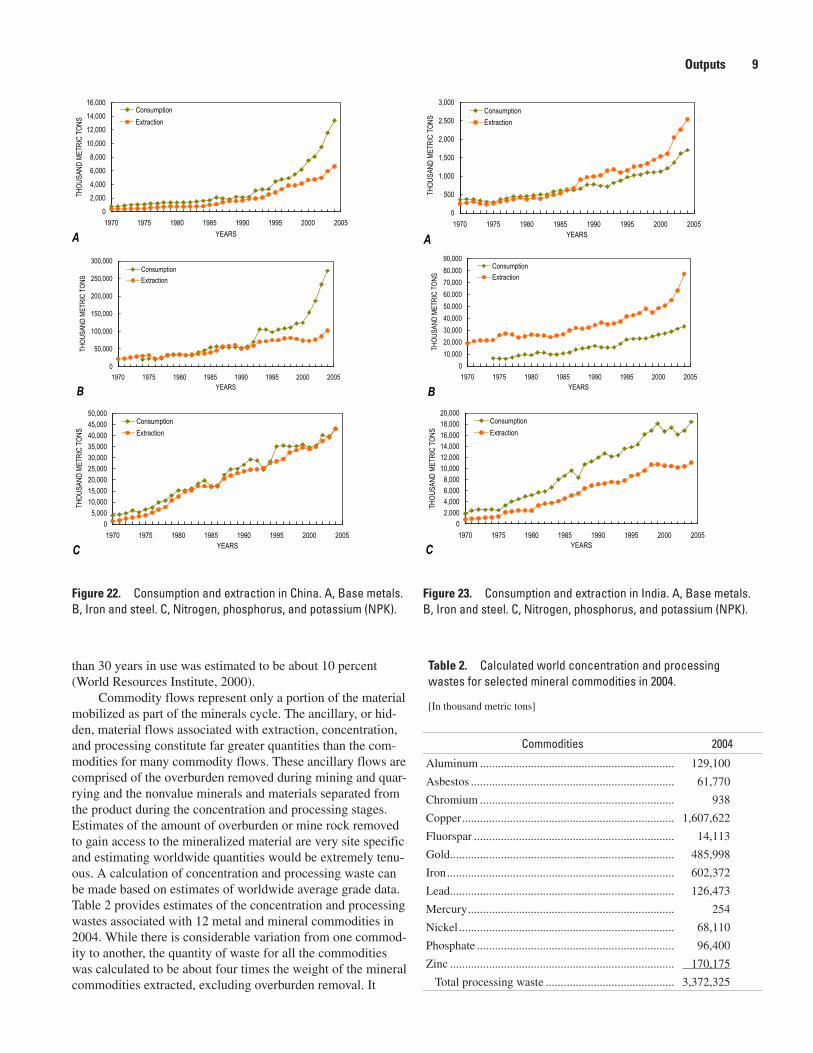
metals (aluminum, copper, lead, and zinc), iron and steel, and the fertilizer minerals (nitrogen, phosphate, and potash) for six countries/regions of the world. In North America (Canada, the United States, and Mexico) and the EU-15, the gap between consumption and extraction of base metals and iron and steel is widening—more material is consumed than extracted. This relationship is different for the fertilizer minerals. Extraction and consumption are nearly equal in the EU-15, and in North America, more fertilizer minerals are extracted than consumed. For Japan and the Republic of Korea combined, consumption of each of the three commodity groups is greater than extraction. China exhibits increasing consumption versus extraction relative to the two metal categories and nearly equal extraction and consumption of fertilizer minerals. The trends for India are the inverse of most other examples—greater extraction than consumption of the metal categories and a widening gap between consumption and extraction of fertilizer minerals. The South American countries, along with other regions not examined in this paper, are playing a major role in filling the consumption/extraction gap for the two metal categories in the developed countries and increasingly in
China. Because the ancillary outputs associated with the extraction and initial processing of commodities can create considerable environmental impacts, particularly where the most advanced technology is not employed; the trends observed raise concerns about the environmental pressures in the extractive regions.
Use of Secondary Resources and Accretion in Stock
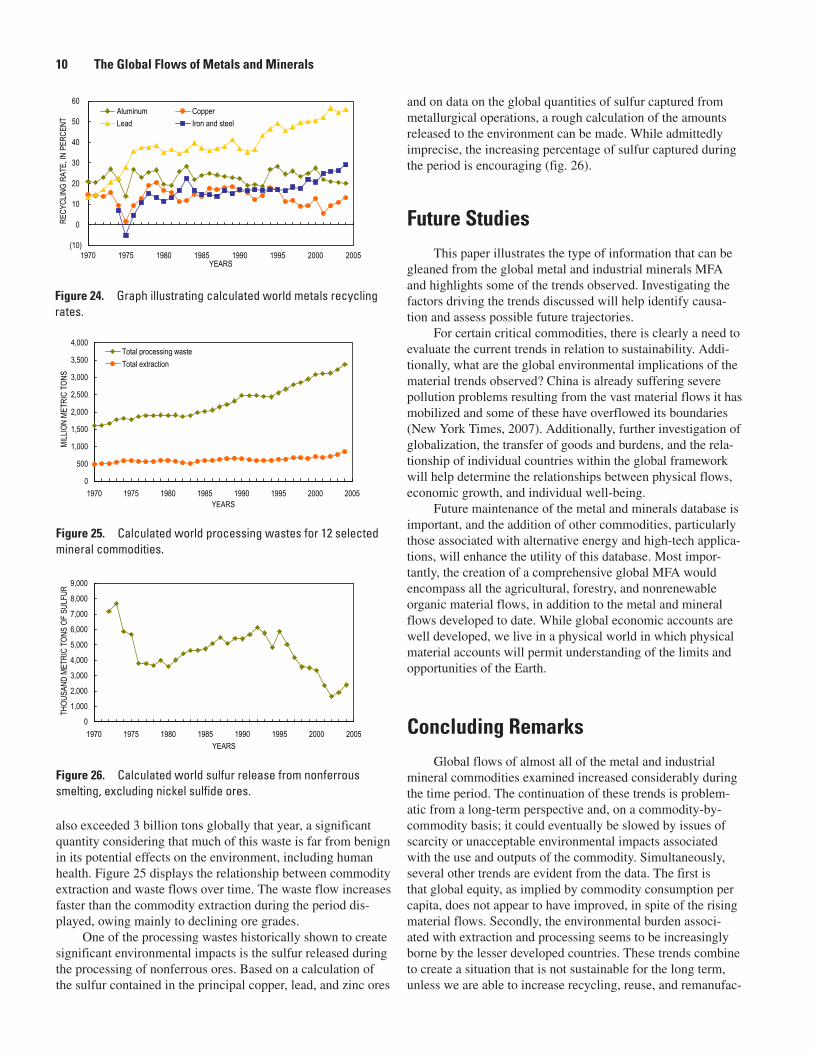
Metal and mineral commodities are nonrenewable resources, and therefore their total availability, while not readily definable, is finite. In this context, mechanisms that serve to reuse or recycle these materials increase long-term sustainability. Figure 24 displays the estimated percentage of world steel, aluminum, copper, and lead obtained from secondary sources. This percentage was obtained by calculat-ing the difference between the global extracted metal content
8 The Global Flows of Metals and MineralsFIGURE 20-A
0
2,000
4,000
6,000
8,000
10,000
12,000
14,000
16,000
1970 1975 1980 1985 1990 1995 2000 2005YEARS
THOU
SAND
MET
RIC
TONS
ConsumptionExtraction
A FIGURE 20-B
0
50,000
100,000
150,000
200,000
250,000
1970 1975 1980 1985 1990 1995 2000 2005YEARS
THOU
SAND
MET
RIC
TONS
ConsumptionExtraction
B FIGURE 21-C
0
500
1,000
1,500
2,000
2,500
3,000
3,500
1970 1975 1980 1985 1990 1995 2000 2005YEARS
THOU
SAND
MET
RIC
TONS
ConsumptionExtraction
C
Figure 20. Consumption and extraction in South America. A, Base metals. B, Iron and steel. C, Nitrogen, phosphorus, and potassium (NPK).
FIGURE 21-A
01,0002,0003,0004,0005,0006,0007,0008,0009,000
1970 1975 1980 1985 1990 1995 2000 2005YEARS
THOU
SAND
MET
RIC
TONS
ConsumptionExtraction
A
Figure 21. Consumption and extraction in Japan and the Republic of Korea. A, Base metals. B, Iron and steel. C, Nitrogen, phosphorus, and potassium (NPK).
FIGURE 21-B
0
20,000
40,000
60,000
80,000
100,000
120,000
140,000
1970 1975 1980 1985 1990 1995 2000 2005YEARS
THOU
SAND
MET
RIC
TONS
ConsumptionExtraction
B FIGURE 21-C
0
500
1,000
1,500
2,000
2,500
3,000
3,500
1970 1975 1980 1985 1990 1995 2000 2005YEARS
THOU
SAND
MET
RIC
TONS
ConsumptionExtraction
C
of steel, aluminum, copper, and lead and world consumption for individual years. Except for lead, used predominantly in lead acid batteries for which well-organized collection and recycling procedures have been established, the trends are not particularly encouraging. Although, steel recycling appears to be increasing from a plateau of less than 20 percent, the use of secondary copper currently appears to be only a little greater than 10 percent by 2004, and aluminum recycling rates ranged between 20 and 30 percent during the entire period.
Increasing the use of secondary resources represents a considerable challenge with respect to nonrenewable metal and industrial mineral resources. Although large amounts of construction minerals, including sand, gravel, and crushed stone, are consumed, they are relatively plentiful in most regions and therefore only small amounts are reused. A num-ber of mineral commodities, such as fertilizer minerals, salt, and other industrial minerals, are used in a dissipative manner such that recycling is impossible. A large percentage of the metals commodity flow ends up in addition to the built infra-structure where they remain with the current design of most products for a long time, before they are available for reuse. Some metal flows end up in complex products that inhibit
recycling. As populations and the supporting infrastructure increase, the amount of material tied up in these applications is likely to increase.
OutputsOutputs (releases) to the environment take place at every
stage of metal and mineral extraction, processing, use, and disposal where they cause environmental disturbance and, in a number of cases, severe impacts. Unless recycled, all metal and mineral flows, except those that become part of a long-term built infrastructure, ultimately exit the economy either rapidly, as in the case of fertilizer and chemicals, or after a period of time, for those uses associated with durable con-sumer goods. Because, on a tonnage basis, the largest flows are those associated with construction of long-term infrastruc-ture, the percentage of commodity inputs that exit quickly to the environment is small. In 2000, the percentage of metals and minerals inputs that exited the U.S. economy after less
Outputs 9FIGURE 22-A
0
2,000
4,000
6,000
8,000
10,000
12,000
14,000
16,000
1970 1975 1980 1985 1990 1995 2000 2005YEARS
THOU
SAND
MET
RIC
TONS
ConsumptionExtraction
A
Figure 22. Consumption and extraction in China. A, Base metals. B, Iron and steel. C, Nitrogen, phosphorus, and potassium (NPK).
FIGURE 22-B
0
50,000
100,000
150,000
200,000
250,000
300,000
1970 1975 1980 1985 1990 1995 2000 2005YEARS
THOU
SAND
MET
RIC
TONS
ConsumptionExtraction
B FIGURE 22-C
05,000
10,00015,00020,00025,00030,00035,00040,00045,00050,000
1970 1975 1980 1985 1990 1995 2000 2005YEARS
THOU
SAND
MET
RIC
TONS
ConsumptionExtraction
C
FIGURE 23-A
0
500
1,000
1,500
2,000
2,500
3,000
1970 1975 1980 1985 1990 1995 2000 2005YEARS
THOU
SAND
MET
RIC
TONS
ConsumptionExtraction
AFIGURE 23-B
010,00020,00030,00040,00050,00060,00070,00080,00090,000
1970 1975 1980 1985 1990 1995 2000 2005YEARS
THOU
SAND
MET
RIC
TONS
ConsumptionExtraction
B
Figure 23. Consumption and extraction in India. A, Base metals. B, Iron and steel. C, Nitrogen, phosphorus, and potassium (NPK).
FIGURE 23-C
02,0004,0006,0008,000
10,00012,00014,00016,00018,00020,000
1970 1975 1980 1985 1990 1995 2000 2005YEARS
THOU
SAND
MET
RIC
TONS
ConsumptionExtraction
C
than 30 years in use was estimated to be about 10 percent (World Resources Institute, 2000).
Commodity flows represent only a portion of the material mobilized as part of the minerals cycle. The ancillary, or hid-den, material flows associated with extraction, concentration, and processing constitute far greater quantities than the com-modities for many commodity flows. These ancillary flows are comprised of the overburden removed during mining and quar-rying and the nonvalue minerals and materials separated from the product during the concentration and processing stages. Estimates of the amount of overburden or mine rock removed to gain access to the mineralized material are very site specific and estimating worldwide quantities would be extremely tenu-ous. A calculation of concentration and processing waste can be made based on estimates of worldwide average grade data. Table 2 provides estimates of the concentration and processing wastes associated with 12 metal and mineral commodities in 2004. While there is considerable variation from one commod-ity to another, the quantity of waste for all the commodities was calculated to be about four times the weight of the mineral commodities extracted, excluding overburden removal. It
Table 2. Calculated world concentration and processing wastes for selected mineral commodities in 2004.
[In thousand metric tons]
Commodities 2004
Aluminum ................................................................. 129,100
Asbestos .................................................................... 61,770
Chromium ................................................................. 938
Copper ....................................................................... 1,607,622
Fluorspar ................................................................... 14,113
Gold ........................................................................... 485,998
Iron ............................................................................ 602,372
Lead ........................................................................... 126,473
Mercury ..................................................................... 254
Nickel ........................................................................ 68,110
Phosphate .................................................................. 96,400
Zinc ........................................................................... 170,175
Total processing waste ........................................... 3,372,325
10 The Global Flows of Metals and Minerals
FIGURE 24
(10)
0
10
20
30
40
50
60
1970 1975 1980 1985 1990 1995 2000 2005YEARS
RECY
CLIN
G RA
TE, IN
PER
CENT
Aluminum CopperLead Iron and steel
Figure 24. Graph illustrating calculated world metals recycling rates.
Figure 25. Calculated world processing wastes for 12 selected mineral commodities.
FIGURE 25
0
500
1,000
1,500
2,000
2,500
3,000
3,500
4,000
1970 1975 1980 1985 1990 1995 2000 2005YEARS
MILL
ION
METR
IC T
ONS
Total processing wasteTotal extraction
Figure 26. Calculated world sulfur release from nonferrous smelting, excluding nickel sulfide ores.
FIGURE 26
0
1,000
2,000
3,000
4,000
5,000
6,000
7,000
8,000
9,000
1970 1975 1980 1985 1990 1995 2000 2005YEARS
THOU
SAND
MET
RIC
TONS
OF
SULF
UR
also exceeded 3 billion tons globally that year, a significant quantity considering that much of this waste is far from benign in its potential effects on the environment, including human health. Figure 25 displays the relationship between commodity extraction and waste flows over time. The waste flow increases faster than the commodity extraction during the period dis-played, owing mainly to declining ore grades.
One of the processing wastes historically shown to create significant environmental impacts is the sulfur released during the processing of nonferrous ores. Based on a calculation of the sulfur contained in the principal copper, lead, and zinc ores
and on data on the global quantities of sulfur captured from metallurgical operations, a rough calculation of the amounts released to the environment can be made. While admittedly imprecise, the increasing percentage of sulfur captured during the period is encouraging (fig. 26).
Future StudiesThis paper illustrates the type of information that can be
gleaned from the global metal and industrial minerals MFA and highlights some of the trends observed. Investigating the factors driving the trends discussed will help identify causa-tion and assess possible future trajectories.
For certain critical commodities, there is clearly a need to evaluate the current trends in relation to sustainability. Addi-tionally, what are the global environmental implications of the material trends observed? China is already suffering severe pollution problems resulting from the vast material flows it has mobilized and some of these have overflowed its boundaries (New York Times, 2007). Additionally, further investigation of globalization, the transfer of goods and burdens, and the rela-tionship of individual countries within the global framework will help determine the relationships between physical flows, economic growth, and individual well-being.
Future maintenance of the metal and minerals database is important, and the addition of other commodities, particularly those associated with alternative energy and high-tech applica-tions, will enhance the utility of this database. Most impor-tantly, the creation of a comprehensive global MFA would encompass all the agricultural, forestry, and nonrenewable organic material flows, in addition to the metal and mineral flows developed to date. While global economic accounts are well developed, we live in a physical world in which physical material accounts will permit understanding of the limits and opportunities of the Earth.
Concluding RemarksGlobal flows of almost all of the metal and industrial
mineral commodities examined increased considerably during the time period. The continuation of these trends is problem-atic from a long-term perspective and, on a commodity-by-commodity basis; it could eventually be slowed by issues of scarcity or unacceptable environmental impacts associated with the use and outputs of the commodity. Simultaneously, several other trends are evident from the data. The first is that global equity, as implied by commodity consumption per capita, does not appear to have improved, in spite of the rising material flows. Secondly, the environmental burden associ-ated with extraction and processing seems to be increasingly borne by the lesser developed countries. These trends combine to create a situation that is not sustainable for the long term, unless we are able to increase recycling, reuse, and remanufac-
References Cited 11
turing; significantly reduce the amount of materials used; or
reduce environmental releases. If populations continue to grow
as expected, the creation of new industrial models may help to
increase recycling inputs and decrease outputs.
Finally, examining the material flows associated with
metals and minerals tells only part of the story; thus, compil-
ing the material flows associated with the other major com-
modity groups in a similar fashion may be a useful undertak-
ing. In a finite world, a holistic and detailed understanding of
the physical flows of the materials mobilized and transformed
will be helpful to the creation and maintenance of a sustain-
able industrial economy.
References Cited
Kahn, Joseph, and Yardley, Jim, 2007, As China roars, pollu-
tion reaches deadly extremes: New York Times, August 26,
2007, p. 9.
National Research Council of the National Academies, 2008,
Minerals, critical minerals, and the U.S. economy: Wash-
ington, D.C., National Research Council of the National
Academies, Committee on Critical Mineral Impacts on the
U.S. economy, Committee on Earth Resources, 264 p.
U.S. Census Bureau, 2007, International database: U.S. Cen-
sus Bureau, accessed online July 20, 2007, at
http://www.census.gov/ipc/www/idb/idbsprd.html.
U.S. Central Intelligence Agency, 2008, South Korea: World
Factbook 2008, accessed online June 27, 2008, at
https://www.cia.gov/library/publications/
the-world-factbook/print/ks.html.
U.S. Interagency Working Group on Industrial Ecology, Mate-
rial and Energy Flows, 1999, Materials report: Washington,
D.C., U.S. Interagency Working Group on Industrial Ecol-
ogy, Material and Energy Flows, 29 p.
Wilburn, D.R., 2007, Flow of cadmium from rechargeable
batteries in the United States, 1996-2005: U.S. Geological
Survey Scientific Investigations Report 2007-5198, 34 p.,
accessed online at http://pubs.usgs.gov/sir/2007/5198/.
World Bank, 2007, World development indicators database:
The World Bank, accessed online July 20, 2007, at
http://web.worldbank.org/WBSITE/EXTERNAL/DATASTAT
ISTICS/0,,contentMDK:20535285~menuPK:1192694~page
PK:64133150~piPK:64133175~theSitePK:239419,00.html.
World Resources Institute, 2000, The weight of nations—
Material outflows from industrial economies: Washington,
D.C., World Resources Institute, 125 p.
World Resources Institute, 2008, Material flows in the United
States; a physical accounting of the U.S. industrial econ-
omy: Washington, D.C., World Resources Institute, 42 p.