Embed Size (px)
Citation preview

The Global Financial Centres Index 23 1
The Global Financial Centres Index 23
MARCH 2018
Financial Centre Futures

2 The Global Financial Centres Index 23
We are pleased to present the twenty-third edition of the Global Financial Centres Index (GFCI 23).
In March 2007, Z/Yen released the first edition of the GFCI, which continues to provide evaluations of competitiveness and rankings for the major financial centres around the world.
In July 2016 the China Development Institute (CDI) in Shenzhen and Z/Yen Partners in London established a strategic partnership for research into financial centres. We continue our collaboration in producing the GFCI.
The GFCI is updated every March and September and receives considerable attention from the global financial community. The index serves as a valuable reference for policy and investment decisions.
Z/Yen is the City of London's leading commercial think-tank. Z/Yen was founded in 1994 to promote societal advance through better finance and technology. Z/Yen has built its practice around a core of high-powered project managers, supported by experienced technical specialists so that clients get expertise they need, rather than just resources available. The firm is headquartered in London, but Z/Yen is committed to the ‘virtual office’ concept and is an intense user of technology in order to improve flexibility and benefit staff.
The CDI is a leading national think-tank that develops solutions to public policy challenges through broad-scope and in-depth research to help advance China’s reform and opening-up to world markets. The CDI has been working on the promotion and development of China’s financial system since its establishment 29 years ago. Based on rigorous research and objective analysis, CDI is committed to providing innovative and pragmatic reports for governments at different levels in China and corporations at home and abroad.
The author of this report, Mark Yeandle, would like to thank Mike Wardle, Bikash Kharel, Shevangee Gupta, Michael Mainelli, Carol Feng, Peng Yu, and the rest of the GFCI team for their contributions with research, modelling, and ideas.

The Global Financial Centres Index 23 1
2018 is set to be a year of change in Kazakhstan’s financial landscape as the fully-fledged launch of the Astana International Financial Centre (AIFC)undoubtedly unveils a new chapter of reform and modernisation in the country’s financial sector.
Kazakhstan has always been in the forefront of innovations and structural reforms. Within just a quarter of the century, Kazakhstan has asserted a reputation of a regional leader deservedly achieved through years of political stability and a strong commitment to economic liberalisation in combination with the immense stocks of natural resources. Since its independence, Kazakhstan has succeeded in increasing its economy five times with total country wealth exceeding $110 billion. The achievements of the past years laid out a firm and solid foundation to face the current global economic challenges with confidence and focus on further aspirations to achieve long-term sustainable growth and maintain its leading positions on the regional and global stage.
AIFC is the unrivalled financial centre aimed at creating uncontested market space for the region of more than 300 million consumers. It is the first and sole financial centre among entire CIS counties who pioneered in introducing a common-law framework designed to bring the favourable environment for business growth. To earn global community’s confidence in AIFC, the most trusted, influential and well-recognised judges were nominated to the AIFC Court. This is clear evidence of Kazakhstan and AIFC’s highest commitment to the rule of law, transparency and accountability.
Since inception, we have invested a significant amount of time and effort to create best in the class financial centre with a most compelling ecosystem. AIFC’s fundamentals lie within a top-notch legal and regulatory regime, no corporate tax regime, depth and breadth in financial services and instruments’ offering, highly supportive and flexible environment fostering the long-term growth and innovative development of its participants. AIFC is aimed to become a home for the best talents and experts by supporting their career development and promoting the best working environment, not to mention a city that offers the very high standards of living.
Astana is a young and fast-growing city that has made its mark on the world map. Astana is often referred as a city of the future. Modern infrastructure and logistics developed based on smart city concept, futuristic city architecture representing a miracle of urban construction, variety of housing, education and
healthcare facilities as well as lifestyle options bring the most comfortable conditions and serve the needs and tastes of different people reallocating to Astana from around the globe.
In a short span of 20 years, Astana has already been recognised as a political and cultural centre and now, it is also placed as a new destination in the map of global financial centres. It is a very important moment for Astana, as today, for the first time, it is featuring in the Global Financial Centre Index, globally recognised benchmark assessing the competitiveness of interna-tional financial hubs. This milestone is an acknowledgment of our efforts by global financial players.
In fact, AIFC has been gaining tremendous response over the last three years when His Excellency, President Nazarbayev has first introduced his vision of building an international financial centre. AIFC has become an enabling partner to the variety of financial hubs, international organisations, development institutes, financial corporations and companies of different scale. Among our most honoured relationships are the strategic partnership with the largest world stock ex-changes, Nasdaq Inc. and Shanghai Stock Exchange. They view AIX, AIFC’s stock exchange, as the main platform for financing the “Belt and Road” projects in the all Central Asian region. AIX is also missioned to host the large scaled privatization program of the country’s major national companies. The trust and support of our global partners give us confidence that we will continue in our mission to develop the world-class financial centre for the whole region of Central Asia, the Caucasus, Eurasian Economic Union, the Middle East, West China, Mongolia and Europe.
Commemorating a successful launch of AIFC coinciding with the 20th anniversary of Astana this year, we are honoured to host AIFC’s Grand Opening Ceremony on July 5th, 2018. It is a historical event for us and will allow sharing our plans and long-term vision, demonstrate our credentials and comparative advantages as well as engage global industry specialists in the most trending topics’ discussions. I welcome the readers of GFCI 23 to share this historical day with us.
Kairat Kelimbetov
Governor of AIFC
Foreword

2 The Global Financial Centres Index 23
GFCI 23 Summary and Headlines GLOBAL FINANCIAL CENTRES INDEX 23
• We researched 110 centres for this edition of the Global Financial Centres Index (GFCI 23). The number of financial centres in the main index has increased from 92 to 96 with the addition of Astana, Baku, New Delhi and Tianjin from the associate centres list. There are 14 associate centres awaiting potential inclusion in the main index.
• GFCI 23 was compiled using 103 instrumental factors. These quantitative measures are provided by third parties including the World Bank, The Economist Intelligence Unit, the OECD, and the United Nations. Details can be found in Appendix 4.
• The instrumental factors were combined with 28,599 financial centre assessments provided by respondents to the GFCI online questionnaire (www.globalfinancialcentres.net). Details of the 2,340 respondents are shown opposite. Further details of the methodology behind GFCI 23 can be found in Appendix 3.
THE RESULTS
• There is an overall increase in confidence for the leading centres. Signs of a bias towards stronger and more established centres are evident with the top 25 centres all rising in the ratings. Ratings fell for all of the lowest 50 centres.
• London and New York remain at the top of the rankings and the gap between them in ratings closed to one point on a scale of 1,000. Hong Kong retains third place. London’s rating rose less than the other four top centres. There is now less than 50 points between the top five centres. San Francisco and Boston moved into the top ten, replacing Beijing and Zurich.
• Western European financial centres remain volatile. The top five centres rose in the ratings. Most of the lower placed centres lost ground. Hamburg, Munich, Monaco, and Madrid, rose strongly in the ranks, with other improvements for Paris, Jersey, Edinburgh and Lisbon. Hamburg in particular rose 38 places in the ranks.
• In the Asia/Pacific region, the leading centres improved their ratings. There were significant rises in the ranks for Qingdao, Bangkok, Kuala Lumpur and Busan. Tianjin and New Delhi are new entrants to the GFCI.
• North American centres generally achieved improved ratings and improved their ranks accordingly. This was a reversal from GFCI 22. The exception was Washington DC, which dropped 20 places in the rankings. Montreal also dropped by one place (although its rating was 22 higher than in GFCI 22).
• All centres in the Eastern Europe and Central Asia suffered a fall in their ratings. However, Cyprus, Istanbul and Moscow rose in the ranks. Tallinn and Riga both fell over 30 places in the ranks. Astana and Baku are new entrants to the GFCI.
• In the Middle East and Africa, only Dubai and Abu Dhabi increased their ratings. Mauritius, Riyadh, and Casablanca improved their ranking despite falls in their ratings.
• All centres in Latin America and the Caribbean fell in the GFCI ratings except for the Cayman Islands. Despite the fall in the ratings, six centres rose in the ranks with the Bahamas leading the way rising 22 places. The Cayman Islands are now the leading centre in the region.
• European ‘island’ centres fell back after rising in GFCI 22. The British Crown Dependencies of Jersey, Guernsey, and the Isle of Man all fell in the ratings.

The Global Financial Centres Index 23 3
Fewer than 100
100 to 500
500 to 1,000
1,000 to 2,000
2,000 to 5,000
More than 5,000
Other
Western Europe
Asia/Pacific
North America
Middle East & Africa
Eastern Europe & CentralAsiaLatin America & theCaribbeanOther
Banking
Finance
Government &RegulatoryInsurance
Investment Management
Professional Services
Trade Association
Respondents Chart 1 | GFCI 23 Respondents by Industry Sector
Chart 2 | GFCI 23 Respondents by Region
Chart 3 | GFCI 23 Respondents by Organisation Size (Number of Employees)

4 The Global Financial Centres Index 23
Table 1 | GFCI 23 Ranks and Ratings
Change in Change in
Rank Rating Rank Rating Rank Rating
London 1 794 1 780 0 ▲14
New York 2 793 2 756 0 ▲37
Hong Kong 3 781 3 744 0 ▲37
Singapore 4 765 4 742 0 ▲23
Tokyo 5 749 5 725 0 ▲24
Shanghai 6 741 6 711 0 ▲30
Toronto 7 728 7 710 0 ▲18
San Francisco 8 726 17 693 ▲9 ▲33
Sydney 9 724 8 707 ▼1 ▲17
Boston 10 722 19 690 ▲9 ▲32
Beijing 11 721 10 703 ▼1 ▲18
Melbourne 12 720 13 696 ▼1 ▲24
Montreal 13 719 12 697 ▼1 ▲22
Chicago 14 718 24 683 ▲10 ▲35
Vancouver 15 717 18 692 ▲3 ▲25
Zurich 16 713 9 704 ▼7 ▲9
Los Angeles 17 712 23 683 ▲6 ▲29
Shenzhen 18 710 20 689 ▲2 ▲21
Dubai 19 709 18 691 ▼1 ▲18
Frankfurt 20 708 11 701 ▼9 ▲7
Luxembourg 21 701 14 695 ▼7 ▲6
Cayman Islands 22 700 31 671 ▲9 ▲29
Osaka 23 692 21 688 ▼2 ▲4
Paris 24 687 26 680 ▲2 ▲7
Abu Dhabi 25 683 25 682 0 ▲1
Geneva 26 682 16 694 ▼10 ▼12
Seoul 27 679 22 686 ▼5 ▼7
Guangzhou 28 678 32 668 ▲4 ▲10
Hamburg 29 676 67 628 ▲38 ▲48
Taipei 30 673 27 677 ▼3 ▼4
Dublin 31 666 30 672 ▼1 ▼6
Casablanca 32 664 35 665 ▲3 ▼1
Qingdao 33 662 47 649 ▲14 ▲31
Tel Aviv 34 661 34 666 0 ▼5
Munich 35 660 50 646 ▲15 ▲14
Bermuda 36 656 29 673 ▼7 ▼17
Bangkok 37 643 61 634 ▲24 ▲9
Calgary 38 642 71 624 ▲33 ▲18
Jersey 39 637 40 658 ▲1 ▼21
Kuala Lumpur 40 632 55 640 ▲15 ▼8
Madrid 41 631 59 636 ▲18 ▼5
Stockholm 42 629 39 660 ▼3 ▼31
Edinburgh 43 628 52 643 ▲9 ▼15
Wellington 44 621 38 661 ▼6 ▼40
Warsaw 45 620 36 664 ▼9 ▼44
Busan 46 618 70 625 ▲24 ▼7
Doha 47 617 45 651 ▼2 ▼34
Washington DC 48 616 28 676 ▼20 ▼60
CentreGFCI 22GFCI 23

The Global Financial Centres Index 23 5
Table 1 (continued) | GFCI 23 Ranks and Ratings
Change in Change in
Rank Rating Rank Rating Rank Rating
Glasgow 49 614 49 647 0 ▼33
Amsterdam 50 613 33 667 ▼17 ▼54
Bahrain 51 612 51 645 0 ▼33
Johannesburg 52 610 48 648 ▼4 ▼38
Guernsey 53 605 41 657 ▼12 ▼52
Monaco 54 604 68 627 ▲14 ▼23
Oslo 55 602 46 650 ▼9 ▼48
Mauritius 56 601 69 626 ▲13 ▼25
Isle of Man 57 600 56 639 ▼1 ▼39
Copenhagen 58 599 43 655 ▼15 ▼56
Bahamas 59 596 81 614 ▲22 ▼18
British Virgin Islands 60 594 37 663 ▼23 ▼69
Milan 61 593 54 641 ▼7 ▼48
Brussels 62 592 57 638 ▼5 ▼46
Tianjin 63 588 New New New New
Vienna 64 583 42 656 ▼22 ▼73
Rome 65 579 74 621 ▲9 ▼42
Gibraltar 66 576 75 620 ▲9 ▼44
Sao Paulo 67 574 63 632 ▼4 ▼58
Riyadh 68 573 77 618 ▲9 ▼45
Liechtenstein 69 570 64 631 ▼5 ▼61
Mexico City 70 569 73 622 ▲3 ▼53
Prague 71 567 58 637 ▼13 ▼70
Cyprus 72 566 76 619 ▲4 ▼53
Mumbai 73 565 60 635 ▼13 ▼70
Lisbon 74 564 79 616 ▲5 ▼52
Buenos Aires 75 563 90 600 ▲15 ▼37
Istanbul 76 562 78 617 ▲2 ▼55
Malta 77 561 85 609 ▲8 ▼48
New Delhi 78 560 New New New New
Tallinn 79 559 44 653 ▼35 ▼94
Panama 80 558 88 602 ▲8 ▼44
Rio de Janeiro 81 557 82 613 ▲1 ▼56
Chengdu 82 556 86 604 ▲4 ▼48
Moscow 83 555 89 601 ▲6 ▼46
Manila 84 554 66 629 ▼18 ▼75
Helsinki 85 553 83 612 ▼2 ▼59
Trinidad and Tobago 86 552 65 630 ▼21 ▼78
Riga 87 551 53 642 ▼34 ▼91
Astana 88 548 New New New New
Budapest 89 547 72 623 ▼17 ▼76
Jakarta 90 546 62 633 ▼28 ▼87
St Petersburg 91 531 87 603 ▼4 ▼72
Athens 92 525 84 611 ▼8 ▼86
Reykjavik 93 521 91 598 ▼2 ▼77
Almaty 94 519 80 615 ▼14 ▼96
Baku 95 511 New New New New
Dalian 96 501 92 595 ▼4 ▼94
CentreGFCI 23 GFCI 22

6 The Global Financial Centres Index 23
Table 2 | Associate Centres
Chart 4 shows the average rating of the top five centres in each region. This demonstrates that the historical dominance of the leading centres in Western Europe and North America has been eroded over time. The average assessment of the top five financial centres in the Asia/Pacific region
is now ahead of the comparable figure for Western Europe and North America. The top centres in other regions, especially in Latin America and Eastern Europe and Central Asia have closed the gap on other regions but have fallen back in GFCI 23.
Table 2 lists ‘Associate Centres’, which are included within the questionnaire but have yet to
acquire the number of assessments necessary to be included within the main index.
Chart 4 | GFCI 23 The Mean Rating of the Top Five Centres in Each Region
CentreNumber of Assessments
in the Last 24 months
Mean of
Assessments
Cape Town 131 615GIFT City-Gujarat 115 505Hangzhou 105 706Barbados 85 520Sofia 79 443Karachi 79 542Tehran 74 453Kuwait City 73 555Nairobi 65 506Santiago 60 618Bratislava 54 467Stuttgart 21 519Andorra 16 450San Diego New New
375
425
475
525
575
625
675
725
775
Asia/Pacific
Western Europe
North America
Middle East & Africa
Latin America & the Caribbean
Eastern Europe and Central Asia

The Global Financial Centres Index 23 7
Chart 5 shows the performance of the top five financial centres over time. There has been no change in the top five positions. London and New
York remain in first and second places although there is now only one point (on a scale of 1,000) separating them.
Chart 5 | The Top Five Centres— GFCI Ratings Over Time
The GFCI questionnaire asks respondents which centres they think will become more significant in the next few years.
Table 3 shows the top 15 centres mentioned. Five of the top seven centres are Asian.
Table 3 | The 15 Centres Likely to Become More Significant
Centre Mentions in last 24 months
Shanghai 126
Qingdao 110
Singapore 55
Frankfurt 42
Casablanca 35
Hong Kong 32
Beijing 31
Dublin 29
Astana 26
GIFT City - Gujarat 24
Luxembourg 23
Chengdu 22
Seoul 21
Dubai 18
Toronto 17
600
650
700
750
800
850
London
New York
Hong Kong
Singapore
Tokyo

8 The Global Financial Centres Index 23
Areas of Competitiveness The instrumental factors used in the GFCI model are grouped into five broad factors of competitiveness: Business Environment,
Human Capital, Infrastructure, Financial Sector Development, and Reputation. Chart 6 shows the GFCI taxonomy:
Chart 6 | GFCI 23 Areas of Competitiveness
To assess how financial centres perform in each of these areas, the GFCI factor assessment model is run separately for each of
the five groups of competitiveness at a time. The top 15 ranked centres in each sub-index are shown in Table 4:
Table 4 | GFCI 23 Top 15 by Area of Competitiveness
Business Environment
Human Capital InfrastructureFinancial Sector
DevelopmentReputation
Areas of Competitiveness
Political Stability
and Rule of Law
Institutional and Regulatory
Environment
Macroeconomic Environment
Tax and Cost Competitiveness
Availability of Skilled Personnel
Flexible Labour Market
Education and Development
Quality of Life
Built Infrastructure
ICT Infrastructure
Transport Infrastructure
Sustainable Development
Depth and Breadth of
Industry Clusters
Availability of Capital
Market Liquidity
Economic Output
City Brand and Appeal
Level of Innovation
Attractiveness and Cultural
Diversity
Comparative Positioning with Other Centres
Rank Business Environment Human Capital InfrastructureFinancial Sector
DevelopmentReputational & General
1 London Hong Kong London New York London
2 New York London New York London New York
3 Hong Kong New York Hong Kong Hong Kong Hong Kong
4 Singapore Singapore Singapore Washington DC Singapore
5 Chicago Tokyo Shanghai San Francisco San Francisco
6 Los Angeles Los Angeles Tokyo Boston Boston
7 Washington DC Washington DC Sydney Singapore Chicago
8 San Francisco Chicago Washington DC Chicago Washington DC
9 Boston San Francisco San Francisco Tokyo Los Angeles
10 Zurich Boston Toronto Frankfurt Tokyo
11 Toronto Dubai Frankfurt Shanghai Qingdao
12 Frankfurt Montreal Boston Los Angeles Toronto
13 Montreal Shanghai Beijing Beijing Shanghai
14 Sydney Osaka Montreal Edinburgh Sydney
15 Geneva Shenzhen Zurich Toronto Montreal
The Global Financial Centres Index 23 9
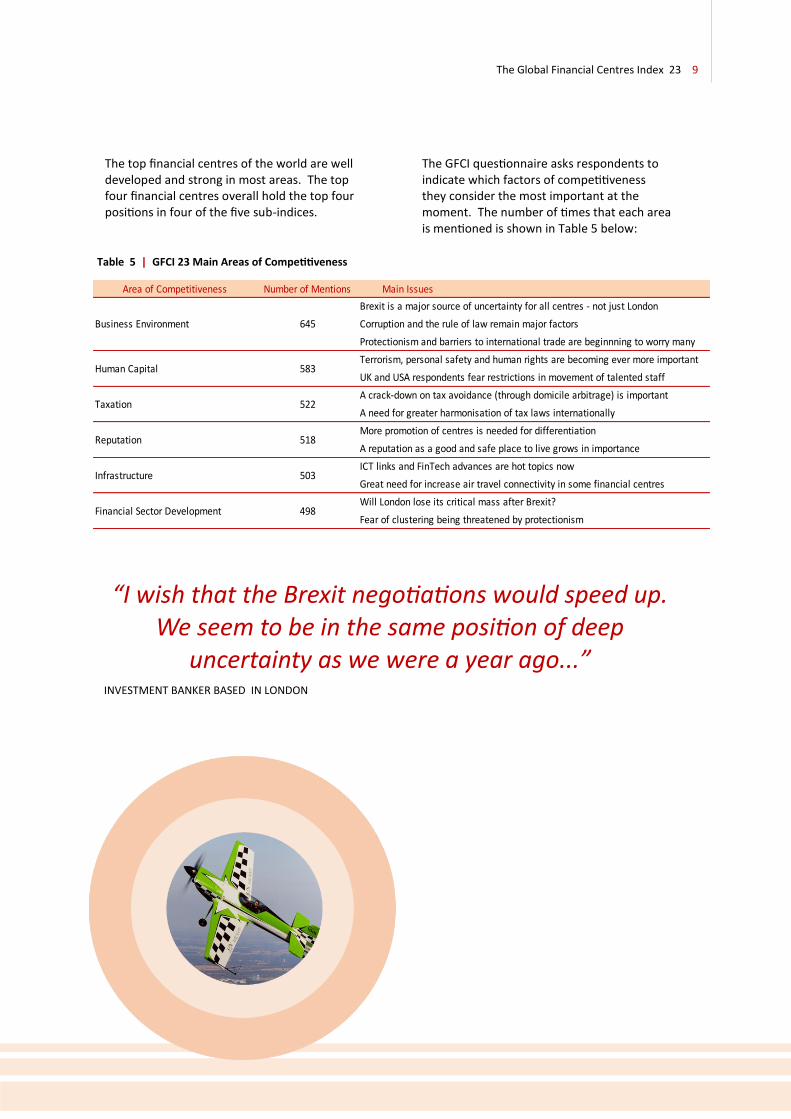
The top financial centres of the world are well developed and strong in most areas. The top four financial centres overall hold the top four positions in four of the five sub-indices.
The GFCI questionnaire asks respondents to indicate which factors of competitiveness they consider the most important at the moment. The number of times that each area is mentioned is shown in Table 5 below:
Table 5 | GFCI 23 Main Areas of Competitiveness
“I wish that the Brexit negotiations would speed up. We seem to be in the same position of deep
uncertainty as we were a year ago...” INVESTMENT BANKER BASED IN LONDON
Area of Competitiveness Number of Mentions Main Issues
UK and USA respondents fear restrictions in movement of talented staff
Financial Sector Development 498Will London lose its critical mass after Brexit?
Fear of clustering being threatened by protectionism
Reputation 518More promotion of centres is needed for differentiation
A reputation as a good and safe place to live grows in importance
Infrastructure 503ICT links and FinTech advances are hot topics now
Great need for increase air travel connectivity in some financial centres
Taxation 522A crack-down on tax avoidance (through domicile arbitrage) is important
A need for greater harmonisation of tax laws internationally
Human Capital 583Terrorism, personal safety and human rights are becoming ever more important
Business Environment 645
Brexit is a major source of uncertainty for all centres - not just London
Corruption and the rule of law remain major factors
Protectionism and barriers to international trade are beginnning to worry many

10 The Global Financial Centres Index 23
Regulatory Quality Our research into the competitiveness of financial centres indicates that the quality of regulation in a centre, as well as overall government effectiveness are both significant factors in a financial centre’s competitiveness.
The quality of regulation, the rule of law and the implementation of regulation are arguably the most important factors for a financial centre.
Charts 7 and 8 map two factors that relate to the quality of government and regulation and demonstrate the correlation of these factors with the GFCI 23 rating (the size of the bubbles indicates the relative GDP of each centre).
Chart 7 | GFCI 23 Rating against Regulatory Quality (supplied by the World Bank)
Chart 8 | GFCI 23 Rating against Government Effectiveness (supplied by the World Bank)
GFC
I 2
3 R
atin
g
BE28 Regulatory Quality
Asia/Pacific
Eastern Europe & Central Asia
Latin America & the Caribbean
Middle East & Africa
North America
Western Europe
New York
London
Tokyo
Hong Kong
Singapore
GFC
I 2
3 R
atin
g
BE18 Government Effectiveness
Asia/Pacific
Eastern Europe & Central Asia
Latin America & the Caribbean
Middle East & Africa
North America
Western Europe
New YorkLondon
Tokyo
Hong Kong
Singapore

The Global Financial Centres Index 23 11
Connectivity One of the most important benefits of hosting a thriving financial centre is connected to other financial centres. One way of measuring this connectivity is to look at the number of assessments given to and received from other financial centres.
Charts 9 and 10 use New York and Chicago as examples to contrast the different levels of connectivity that the two centres enjoy.
Chart 10 | GFCI 23 Connectivity — Chicago
Chart 9 | GFCI 23 Connectivity — New York

12 The Global Financial Centres Index 23
Using clustering and correlation analysis we have identified three measures (axes) that determine a financial centre’s profile along different dimensions of competitiveness.
‘Connectivity’ – the extent to which a centre is well known around the world, and how much non-resident professionals believe it is connected to other financial centres. Respondents are asked to assess only those centres with which they are personally familiar. A centre’s connectivity is assessed using a combination of ‘inbound’ assessment locations (the number of locations from which a particular centre receives assessments) and ‘outbound’ assessment locations (the number of other centres assessed by respondents from a particular centre). If the weighted assessments for a centre are provided by over 50% of other centres, this centre is deemed to be ‘Global’. If the ratings are provided by over 40% of other centres, this centre is deemed to be ‘International’.
‘Diversity’– the breadth of financial industry sectors that flourish in a financial centre. We consider this sector ‘richness’ to be measurable in a similar way to that of the natural environment. We therefore use a combination of biodiversity indices (calculated on the instrumental factors) to assess a centre’s diversity. A high score means that a centre is well diversified; a low diversity score reflects a less rich business environment.
‘Speciality’ – the depth within a financial centre of the following industry sectors: investment management, banking, insurance, professional services, and the government and regulatory sector. A centre’s ‘speciality’ performance is calculated from the difference between the GFCI rating and the industry sector ratings.
In Table 6 ‘Diversity’ (Breadth) and ‘Speciality’ (Depth) are combined on one axis to create a two dimensional table of financial centre profiles. The 96 centres in GFCI 23 are assigned a profile on the basis of a set of rules for the three measures: how well connected a centre is, how broad its services are, and how specialised it is.
The 16 Global Leaders (in the top left of the table) have both broad and deep financial services activities and are connected with many other financial centres. This list includes the top seven global financial centres. Other leading centres are profiled as Established International Centres.
Significant changes in GFCI 23 include Dublin and Seoul becoming Global Leaders, Chicago becoming a Global Diversified Centre (previously an Established International Centre) and Milan becoming a Global Diversified Centre (previously an International Diversified Centre).
Financial Centre Profiles
“It seems to me that more
of the smaller centres
would do better by
specialising in one sector.
Not everyone can be a
London or a New York.” ASSET MANAGER BASED IN MONTREAL
Chart 11 | GFCI 23 Profile Elements

The Global Financial Centres Index 23 13
Table 6 | GFCI 23 Financial Centre Profiles
Broad & Deep Relatively Broad Relatively Deep Emerging
Global Leaders Global Diversified Global Specialists Global Contenders
Abu Dhabi Amsterdam Luxembourg Qingdao
Bei jing Chicago Shenzhen
Dubai Mi lan
Dubl in Moscow
Frankfurt Washington DC
Hong Kong
London
New York
Paris
Seoul
Shanghai
Singapore
Sydney
Tokyo
Toronto
Zurich
Established
International
International
Diversified
International
Specialists
International
Contenders
Geneva Boston Astana Dal ian
Guangzhou Brussels Bri ti sh Virgin Is lands Doha
Is tanbul Busan Casablanca New Delhi
Kuala Lumpur Calgary Cayman Is lands
Los Angeles Copenhagen Chengdu
Melbourne Edinburgh Gibra l tar
Montreal Johannesburg Guernsey
Rio de Janeiro Madrid
San Francisco Munich
Stockholm Vienna
Vancouver
Warsaw
Established Players Local Diversified Local Specialists Evolving Centres
Bangkok Athens Bahamas Almaty
Hamburg Budapest Bermuda Bahra in
Mexico Ci ty Glasgow Buenos Aires Baku
Osaka Hels inki Is le of Man Cyprus
Prague Lisbon Jersey Jakarta
Sao Paulo Mumbai Liechtenstein Malta
Tel Aviv Os lo Mani la Panama
Rome Mauri tius Reykjavik
Tal l inn Monaco Riga
Wel l ington Taipei Riyadh
Trinidad and Tobago St Petersburg
Tianjin
Local
International
Global

14 The Global Financial Centres Index 23
1
2
7
24
17
42
8
13 15
71
58
62
43
60
74
55
49
85
39
36
86
32
80
77
93
87
The GFCI 23 World
28 50
48
41
64
20
92
89
22
53
31
25
81
45
70
67
14
61
10
71
65
79
21
66
59
75
57
69 35
54
91
76
16

The Global Financial Centres Index 23 15
The numbers on the map indicate the GFCI 23 rankings. Black dots denote Associate Centres:
Broad and Deep Relatively Broad Relatively Deep Emerging
Global Leaders Global Diversified Global Specialists Global Contenders
Established International International Diversified International Specialists International Contenders
Established Players Local Diversified Local Specialists Evolving Centres
4
5
3
6
29
51 19 30
90
68
9
12
23 34
83
46
18
33
47 33
26
27
40
37
52
73
44
96
78
88
82
84
56
94 95
72
63
11

16 The Global Financial Centres Index 23
Western Europe Table 7 shows the top 15 Western European centres in the GFCI. Overall assessments for the European centres continued to fluctuate as people speculate about which centres might benefit from London leaving the EU.
The top five European centres rose in the ratings. The German centres of Frankfurt, Hamburg and Munich showed strong gains. Other regional centres fell.
Table 7 | Western European Top 15 Centres in GFCI 23
Chart 12 | GFCI 23 Top Five Western European Centres over Time
600
650
700
750
800
850
London
Zurich
Frankfurt
Luxembourg
Paris
Change in Change in
Rank Rating Rank Rating Rank Rating
London 1 794 1 780 0 ▲14
Zurich 16 713 9 704 ▼7 ▲9
Frankfurt 20 708 11 701 ▼9 ▲7
Luxembourg 21 701 14 695 ▼7 ▲6
Paris 24 687 26 680 ▲2 ▲7
Geneva 26 682 16 694 ▼10 ▼12
Hamburg 29 676 67 628 ▲38 ▲48
Dublin 31 666 30 672 ▼1 ▼6
Munich 35 660 50 646 ▲15 ▲14
Jersey 39 637 40 658 ▲1 ▼21
Madrid 41 631 59 636 ▲18 ▼5
Stockholm 42 629 39 660 ▼3 ▼31
Edinburgh 43 628 52 643 ▲9 ▼15
Glasgow 49 614 49 647 0 ▼33
Amsterdam 50 613 33 667 ▼17 ▼54
GFCI 21GFCI 23Centre

The Global Financial Centres Index 23 17
-150 -100 -50 0 50 100 150
-150 -100 -50 0 50 100 150
-150 -100 -50 0 50 100 150
Chart 13 | GFCI 23 Assessments by Region for London — Difference from the Overall Mean of 854
Chart 14 | GFCI 23 Assessments by Region for Zurich — Difference from the Overall Mean of 755
Chart 15 | GFCI 23 Assessments by Region for Frankfurt — Difference from the Overall Mean of 735
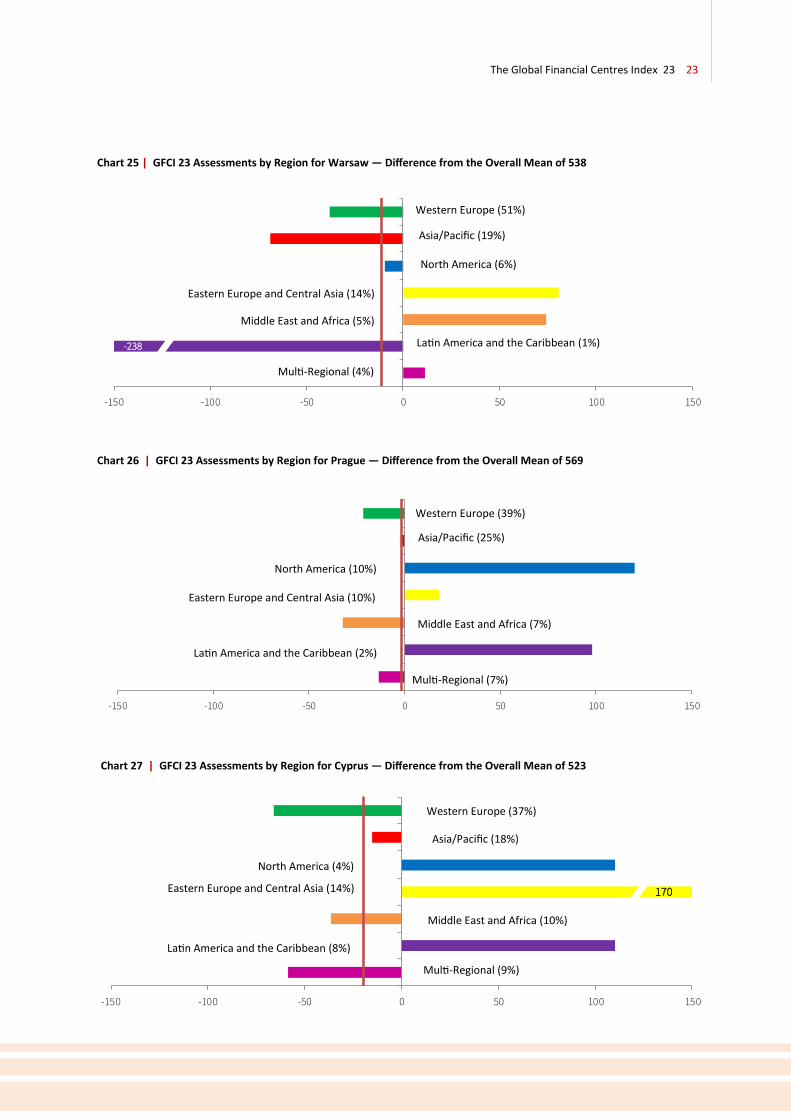
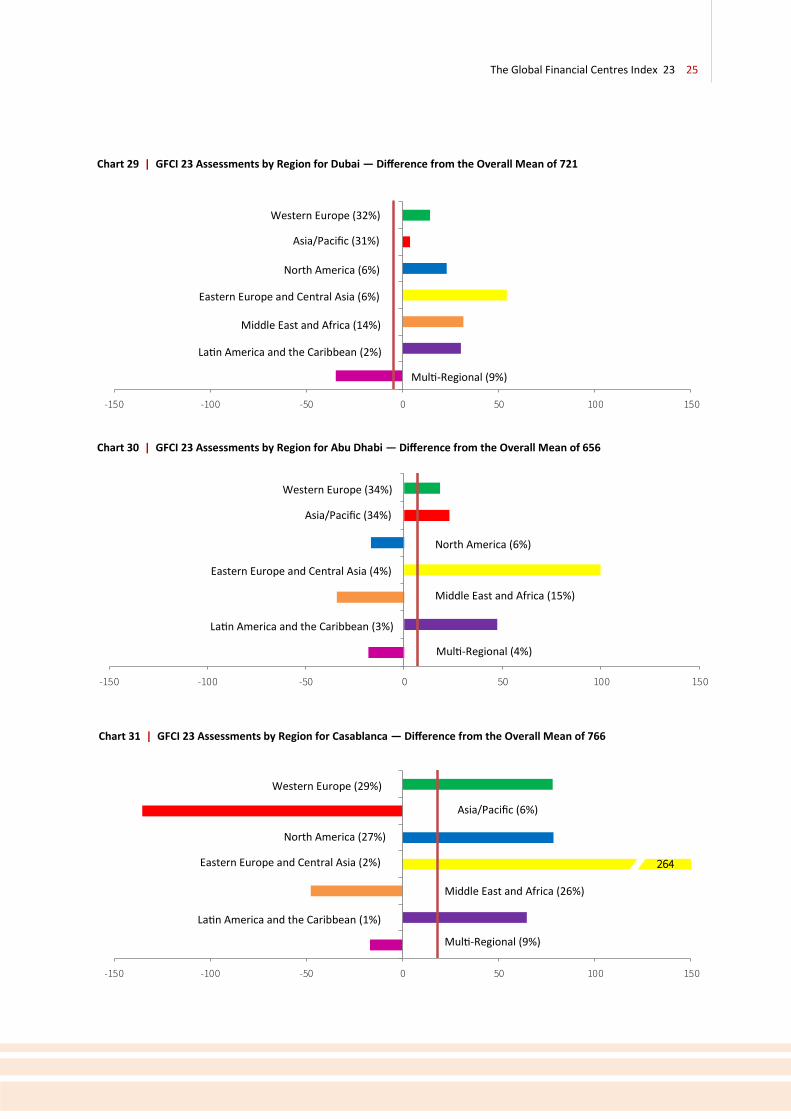
Charts 13 to 15 show the mean of assessments by region given to the leading three centres in Western Europe. Coloured bars to the left of the vertical axis indicate that respondents from that region gave lower than average assessments. Bars to the right indicate respondents from that region gave higher than average assessments. It is important to recognise that assessments given to
a centre by people based in that centre are excluded to remove ‘home’ bias.
The additional vertical axis (in red) shows the mean of assessments when assessments from the home region are removed. The percentage figure noted by each region indicates the percentage of the total number of assessments that are from that region.
Western Europe (38%)
North America (7%)
Latin America and the Caribbean (5%)
Asia/Pacific (32%)
Multi-Regional (7%)
Middle East and Africa (7%)
Eastern Europe and Central Asia (4%)
Western Europe (38%)
North America (4%)
Latin America and the Caribbean (2%)
Asia/Pacific (36%)
Multi-Regional (9%)
Middle East and Africa (7%)
Eastern Europe and Central Asia (4%)
Western Europe (20%)
North America (10%)
Latin America and the Caribbean (4%)
Asia/Pacific (45%)
Multi-Regional (10%)
Middle East and Africa (8%)
Eastern Europe and Central Asia (4%)

18 The Global Financial Centres Index 23
Asia/Pacific Table 8 shows the Asia/Pacific Centres in GFCI 23. The top nine centres in the region rose in the ratings with Hong Kong and Shanghai both
showing marked rises. These are largely reverses of the losses they saw in GFCI 22.
Table 8 | Asia/Pacific Top 15 Centres in GFCI 23
Chart 16 | GFCI 23 Top Five Asia/Pacific Centres over Time
450
500
550
600
650
700
750
800
Hong Kong
Singapore
Tokyo
Shanghai
Sydney
Change in Change in
Rank Rating Rank Rating Rating Rating
Hong Kong 3 781 3 744 0 ▲37
Singapore 4 765 4 742 0 ▲23
Tokyo 5 749 5 725 0 ▲24
Shanghai 6 741 6 711 0 ▲30
Sydney 9 724 8 707 ▼1 ▲17
Beijing 11 721 10 703 ▼1 ▲18
Melbourne 12 720 13 696 ▼1 ▲24
Shenzhen 18 710 20 689 ▲2 ▲21
Osaka 23 692 21 688 ▼2 ▲4
Seoul 27 679 22 686 ▼5 ▼7
Guangzhou 28 678 32 668 ▲4 ▲10
Taipei 30 673 27 677 ▼3 ▼4
Qingdao 33 662 47 649 ▲14 ▲31
Bangkok 37 643 61 634 ▲24 ▲9
Kuala Lumpur 40 632 55 640 ▲15 ▼8
GFCI 22Centre
GFCI 23

The Global Financial Centres Index 23 19
-150 -100 -50 0 50 100 150
-150 -100 -50 0 50 100 150
Chart 17 | GFCI 23 Assessments by Region for Hong Kong — Difference from the Overall Mean of 839
Chart 18 | GFCI 23 Assessments by Region for Singapore — Difference from the Overall Mean of 856
Chart 19 | GFCI 23 Assessments by Region for Tokyo — Difference from the Overall Mean of 803
Western Europe (28%)
North America (9%)
Latin America and the Caribbean (3%)
Asia/Pacific (43%)
Multi-Regional (6%)
Middle East and Africa (7%)
Eastern Europe and Central Asia (4%)
Western Europe (24%)
North America (8%)
Latin America and the Caribbean (3%)
Asia/Pacific (47%)
Multi-Regional (9%)
Middle East and Africa (6%)
Eastern Europe and Central Asia (3%)
-150 -100 -50 0 50 100 150
Western Europe (24%)
North America (9%)
Latin America and the Caribbean (3%)
Asia/Pacific (49%)
Multi-Regional (8%)
Middle East and Africa (4%)
Eastern Europe and Central Asia (3%)

20 The Global Financial Centres Index 23
North America Table 9 shows that North American centres generally achieved improved ratings and improved their ranks accordingly. This was a reversal of the results in GFCI 22. The exceptions were Washington DC, which
dropped 20 places in the ranks, and Montreal which fell a single place (although its rating was higher than in GFCI 22).
Table 9 | North American Centres in GFCI 23
Chart 20 | GFCI 23 Top Five North American Centres over Time
“American centres fell back last year due to concerns over the Trump administration.
There is a much more positive feeling right now.” VENTURE CAPITALIST BASED IN BOSTON
Change in Change in
Rank Rating Rank Rating Rank Rating
New York 2 793 2 756 0 ▲37
Toronto 7 728 7 710 0 ▲18
San Francisco 8 726 17 693 ▲9 ▲33
Boston 10 722 19 690 ▲9 ▲32
Montreal 13 719 12 697 ▼1 ▲22
Chicago 14 718 24 683 ▲10 ▲35
Vancouver 15 717 18 692 ▲3 ▲25
Los Angeles 17 712 23 683 ▲6 ▲29
Calgary 38 642 71 624 ▲33 ▲18
Washington DC 48 616 28 676 ▼20 ▼60
GFCI 22Centre
GFCI 23
550
600
650
700
750
800
850
New York
Toronto
San Francisco
Boston
Montreal

The Global Financial Centres Index 23 21
-150 -100 -50 0 50 100 150
-150 -100 -50 0 50 100 150
Chart 21 | GFCI 23 Assessments by Region for New York — Difference from the Overall Mean of 865
Chart 22 | GFCI 23 Assessments by Region for Toronto — Difference from the Overall Mean of 760
Chart 23 | GFCI 23 Assessments by Region for San Francisco — Difference from the Overall Mean of 766
-150 -100 -50 0 50 100 150
Western Europe (26%)
North America (8%)
Latin America and the Caribbean (4%)
Asia/Pacific (44%)
Multi-Regional (8%)
Middle East and Africa (7%)
Eastern Europe and Central Asia (3%)
Western Europe (23%)
North America (18%)
Latin America and the Caribbean (6%)
Asia/Pacific (39%)
Multi-Regional (8%)
Middle East and Africa (5%)
Eastern Europe and Central Asia (1%)
Western Europe (22%)
North America (19%)
Asia/Pacific (41%)
Latin America and the Caribbean (2%)
Multi-Regional (8%)
Middle East and Africa (6%)
Eastern Europe and Central Asia (2%)

22 The Global Financial Centres Index 23
Eastern Europe and Central Asia Table 10 shows the Eastern European and Central Asian Centres in GFCI 23. All centres in this region suffered a fall in their ratings. However, Cyprus, Istanbul and Moscow rose in the ranks.
Tallin and Riga both fell over 30 places in the ranks. Baku was a new entrant to the GFCI. Astana was also a new entrant having only launched their financial centre in January 2018.
Table 10 | Eastern European and Central Asian Centres in GFCI 23
Chart 24 | GFCI 23 Top Five Eastern European and Central Asian Centres over Time
350
400
450
500
550
600
650
700
Warsaw
Tallinn
Cyprus
Istanbul
Prague
Change in Change in
Rank Rating Rank Rating Rank Rating
Warsaw 45 620 36 664 ▼9 ▼44
Prague 71 567 58 637 ▼13 ▼70
Cyprus 72 566 76 619 ▲4 ▼53
Istanbul 76 562 78 617 ▲2 ▼55
Tallinn 79 559 44 653 ▼35 ▼94
Moscow 83 555 89 601 ▲6 ▼46
Riga 87 551 53 642 ▼34 ▼91
Astana 88 548 New New New New
Budapest 89 547 72 623 ▼17 ▼76
St Petersburg 91 531 87 603 ▼4 ▼72
Athens 92 525 84 611 ▼8 ▼86
Almaty 94 519 80 615 ▼14 ▼96
Baku 95 511 New New New New
GFCI 22Centre
GFCI 23
“Astana is set to become an important centre in the region. It needs to rapidly develop its international
air transportation network”. ECONOMIST IN SHANGHAI
The Global Financial Centres Index 23 23
-150 -100 -50 0 50 100 150
-150 -100 -50 0 50 100 150
-150 -100 -50 0 50 100 150
Chart 25 | GFCI 23 Assessments by Region for Warsaw — Difference from the Overall Mean of 538
Chart 26 | GFCI 23 Assessments by Region for Prague — Difference from the Overall Mean of 569
Chart 27 | GFCI 23 Assessments by Region for Cyprus — Difference from the Overall Mean of 523
-238
-317
- 317
Western Europe (51%)
North America (6%)
Latin America and the Caribbean (1%)
Asia/Pacific (19%)
Multi-Regional (4%)
Middle East and Africa (5%)
Eastern Europe and Central Asia (14%)
Western Europe (39%)
North America (10%)
Latin America and the Caribbean (2%)
Asia/Pacific (25%)
Multi-Regional (7%)
Middle East and Africa (7%)
Eastern Europe and Central Asia (10%)
Western Europe (37%)
North America (4%)
Asia/Pacific (18%)
Latin America and the Caribbean (8%)
Multi-Regional (9%)
Middle East and Africa (10%)
Eastern Europe and Central Asia (14%) 170

24 The Global Financial Centres Index 23
Table 11 shows the Middle East and African Centres in GFCI 23. In this region, only Dubai increased its rating although it fell one place in the ranks. Mauritius, Riyadh, and Casablanca improved their rankings
despite falls in their ratings. Johannesburg and Doha suffered modest falls in the ranks.
Table 11 | Middle East and African Centres in GFCI 23
Chart 28 | GFCI 23 Top Five Middle East and African Centres over Time
The Middle East and Africa
“Doha is now suffering from the falling out with the UAE and Saudi Arabia. We cannot do business here
if the situation continues.” ASSET MANAGER BASED IN DOHA
Change in Change in
Rank Rating Rank Rating Rank Rating
Dubai 19 709 18 691 ▼1 ▲18
Abu Dhabi 25 683 25 682 0 ▲1
Casablanca 32 664 35 665 ▲3 ▼1
Tel Aviv 34 661 34 666 0 ▼5
Doha 47 617 45 651 ▼2 ▼34
Bahrain 51 612 51 645 0 ▼33
Johannesburg 52 610 48 648 ▼4 ▼38
Mauritius 56 601 69 626 ▲13 ▼25
Riyadh 68 573 77 618 ▲9 ▼45
GFCI 22Centre
GFCI 23
400
450
500
550
600
650
700
750
Dubai
Abu Dhabi
Casablanca
Tel Aviv
Doha
The Global Financial Centres Index 23 25
-150 -100 -50 0 50 100 150
-150 -100 -50 0 50 100 150
Chart 29 | GFCI 23 Assessments by Region for Dubai — Difference from the Overall Mean of 721
Chart 30 | GFCI 23 Assessments by Region for Abu Dhabi — Difference from the Overall Mean of 656
Chart 31 | GFCI 23 Assessments by Region for Casablanca — Difference from the Overall Mean of 766
Western Europe (32%)
North America (6%)
Latin America and the Caribbean (2%)
Asia/Pacific (31%)
Multi-Regional (9%)
Middle East and Africa (14%)
Eastern Europe and Central Asia (6%)
Western Europe (29%)
North America (27%)
Asia/Pacific (6%)
Latin America and the Caribbean (1%)
Multi-Regional (9%)
Middle East and Africa (26%)
Eastern Europe and Central Asia (2%)
-150 -100 -50 0 50 100 150
Western Europe (34%)
North America (6%)
Latin America and the Caribbean (3%)
Asia/Pacific (34%)
Multi-Regional (4%)
Middle East and Africa (15%)
Eastern Europe and Central Asia (4%)
264

26 The Global Financial Centres Index 23
Latin America and the Caribbean Table 12 shows the Latin American and Caribbean centres in GFCI 23. All centres in this region fell in the GFCI ratings except for the Cayman Islands. Despite the fall in the ratings, six centres rose in the ranks with
the Bahamas leading the way rising 22 places. The Cayman Islands are now the leading centre in the region.
Table 12 | Latin American and Caribbean Centres in GFCI 23
Chart 32 | GFCI 23 Top Five Latin American and Caribbean Centres over Time
“The Caribbean is not a great place to be at the
moment. Hurricanes and now a loss in confidence.” INVESTMENT FUND DIRECTOR BASED IN MIAMI
Change in Change in
Rank Rating Rank Rating Rank Rating
Cayman Islands 22 700 31 671 ▲9 ▲29
Bermuda 36 656 29 673 ▼7 ▼17
Bahamas 59 596 81 614 ▲22 ▼18
British Virgin Islands 60 594 37 663 ▼23 ▼69
Sao Paulo 67 574 63 632 ▼4 ▼58
Mexico City 70 569 73 622 ▲3 ▼53
Buenos Aires 75 563 90 600 ▲15 ▼37
Panama 80 558 88 602 ▲8 ▼44
Rio de Janeiro 81 557 82 613 ▲1 ▼56
Trinidad and Tobago 86 552 65 630 ▼21 ▼78
GFCI 22Centre
GFCI 23
400
450
500
550
600
650
700
750
Bermuda
Cayman Islands
Bahamas
British Virgin Islands
Sao Paulo

The Global Financial Centres Index 23 27
-150 -100 -50 0 50 100 150
-150 -100 -50 0 50 100 150
-150 -100 -50 0 50 100 150
Chart 33 | GFCI 23 Assessments by Region for the Cayman Islands — Difference from the Overall Mean of 670
Chart 34 | GFCI 23 Assessments by Region for Bermuda — Difference from the Overall Mean of 661
Chart 35 | GFCI 23 Assessments by Region for the Bahamas — Difference from the Overall Mean of 584
Western Europe (30%)
North America (13%)
Latin America and the Caribbean (17%)
Asia/Pacific (24%)
Multi-Regional (8%)
Middle East and Africa (7%)
Eastern Europe and Central Asia (1%)
Western Europe (35%)
North America (11%)
Latin America and the Caribbean (20%)
Asia/Pacific (18%)
Multi-Regional (5%)
Middle East and Africa (10%)
Eastern Europe and Central Asia (1%)
Western Europe (29%)
North America (12%)
Asia/Pacific (22%)
Latin America and the Caribbean (22%)
Multi-Regional (10%)
Middle East and Africa (4%)
Eastern Europe and Central Asia (1%)
198
-203
426

28 The Global Financial Centres Index 23
Whilst the GFCI is calculated using only foreign assessments, we ask professionals on their views about the prospects of the centre in which they work (specifically whether their ‘home’ centre will become more or less competitive).
In general, respondents are far more optimistic about the future of their home centres than people outside that centre.
However, the uncertainty created by Brexit has influenced London based respondents who are significantly less confident about London’s future than respondents from Paris and Frankfurt feel about their home centres.
Home Centre Prospects
Chart 36 | GFCI 23 Home Centre Prospects — London Chart 37 | GFCI 23 Home Centre Prospects — New York
Chart 38 | GFCI 23 Home Centre Prospects — Frankfurt Chart 39 | GFCI 23 Home Centre Prospects — Paris

The Global Financial Centres Index 23 29
London
New York
Hong Kong
Singapore
Tokyo
Shanghai
Toronto
San Francisco
Sydney Shenzhen
Boston
Beijing
Melbourne
Chicago
Vancouver
Zurich
Los Angeles
Dubai
Frankfurt
Montreal
Luxembourg
Cayman Islands
Guangzhou
Osaka
Paris
Geneva
SeoulHamburg
Taipei
Qingdao
Abu Dhabi
Dublin
Casablanca
Tel Aviv
Munich
BermudaBangkok
Calgary
Jersey
Kuala Lumpur
Stability
Chart 40 | GFCI 23 – The Stability of the Top 40 Centres
The GFCI model allows for an analysis of the financial centre volatility of competitiveness. Chart 38 contrasts the ‘spread’ or variance of the individual assessments given to each of the top 40 centres with the sensitivity to changes in the instrumental factors.
The chart shows three bands of financial centres. The unpredictable centres in the top right of the chart have a higher sensitivity to changes in the instrumental factors and a higher variance of assessments. These centres have the highest potential future movement.
The stable centres in the bottom left have a lower sensitivity to change and have shown consistency in their past GFCI ratings.
Chart 40 only plots the top 40 centres (for clarity) but it is worth noting that most of the centres lower in the index would be in the unpredictable area of the chart if plotted.
Unpredictable Centres Dynamic Centres
Stable Centres
Increasing Sensitivity To Instrumental Factors
Incr
easi
ng
Var
ian
ce O
f A
sses
smen
ts

30 The Global Financial Centres Index 23
Reputation In the GFCI model, we look at reputation by examining the difference between the weighted average assessment given to a centre and its overall rating. The first measure reflects the average score a centre receives from finance professionals around the world, adjusted for time, with more recent assessments having more weight (see Appendix 3 for details).
The second measure is the GFCI score itself, which represents the average assessment adjusted to reflect the instrumental factors.
If a centre has a higher average assessment
than its GFCI rating, this indicates that
respondents’ perceptions of a centre are more
favourable than the quantitative measures
alone suggest.
Eight of the top 15 centres in terms of
reputational advantage are in the Asia/Pacific
region. Casablanca, New York, and London also
show a strong reputational advantage. This
may be due to strong marketing or general
awareness. Table 14 shows the top 15 centres
with the greatest positive difference between
the average assessment and the GFCI rating.
Table 14 | GFCI 23 Top 15 Centres Assessments And Ratings — Reputational Advantage
Centre - Top 15Weighted Average
Assessment
GFCI 23
Rating
GFCI 23 Reputational
Advantage
Washington DC 774 616 158
Qingdao 820 662 158
Singapore 851 765 86
Tianjin 671 588 83
Casablanca 737 664 73
New York 860 793 67
Wellington 685 621 64
London 851 794 57
Hong Kong 836 781 55
Sydney 779 724 55
Tokyo 798 749 49
Sao Paulo 620 574 46
Shanghai 786 741 45
Zurich 756 713 43
Milan 635 593 42

The Global Financial Centres Index 23 31
“Wellington is not often mentioned as a financial centre. They seem to be doing all the right things at the moment and we
are doing more business there than ever.”
ASSET MANAGER BASED IN SINGAPORE
Table 15 shows the 15 centres with the greatest reputational disadvantage - an indication that respondents’ perceptions of a
centre are less favourable than the quantitative measures alone would suggest.
Table 15 | GFCI 23 Bottom 15 Centres Assessments And Ratings — Reputational Disadvantage
Centre - Bottom 15Weighted Average
Assessment
GFCI 23
Rating
GFCI 23 Reputational
Advantage
Hamburg 636 676 -40
Moscow 514 555 -41
Tel Aviv 617 661 -44
Bangkok 597 643 -46
Copenhagen 548 599 -51
Riga 481 551 -70
Jersey 566 637 -71
Astana 476 548 -72
Riyadh 499 573 -74
Stockholm 554 629 -75
Chengdu 477 556 -79
Warsaw 540 620 -80
Trinidad and Tobago 455 552 -97
Athens 412 525 -113
Dalian 333 501 -168

32 The Global Financial Centres Index 23
Industry Sectors
Table 13 | GFCI 23 Industry Sector Sub-Indices — Top Fifteen
Industry sector sub-indices are created by building the GFCI statistical model using only the questionnaire assessments from respondents working in the relevant industry sectors. The GFCI 23 dataset has been used to calculate separate sub-indices for Banking,
Investment Management, Insurance, Professional Services, and Government & Regulatory sectors. Table 13 shows the top fifteen financial centres in these five industry sectors.
“Shanghai now has a much broader offer in financial services. It can now become a genuine
rival to Hong Kong.” HEDGE FUND MANAGER BASED IN HONG KONG
Rank BankingInvestment
ManagementInsurance Professional Services Government & Regulatory
1 London New York Hong Kong London London
2 New York Hong Kong Singapore New York New York
3 Hong Kong London London Hong Kong Hong Kong
4 Singapore Singapore New York Singapore Singapore
5 Shanghai Tokyo Tokyo Zurich Zurich
5 Tokyo San Francisco Shanghai Washington DC Washington DC
7 Beijing Toronto Washington DC Tokyo San Francisco
8 Boston Washington DC Boston Boston Toronto
9 Frankfurt Shanghai Zurich Toronto Frankfurt
10 San Francisco Boston Beijing San Francisco Boston
11 Sydney Chicago San Francisco Chicago Chicago
12 Chicago Beijing Los Angeles Sydney Sydney
13 Toronto Vancouver Shenzhen Frankfurt Geneva
14 Los Angeles Zurich Vancouver Shanghai Montreal
15 Shenzhen Sydney Toronto Vancouver Dublin

The Global Financial Centres Index 23 33
Size of Organisation
Chart 41 | GFCI 23 Average Assessments by Respondents’ Organisation Size (number of employees)
It is useful to look at how the leading centres are viewed by respondents working for different sizes of organisation. New York is favoured over London in five of the size categories we use. London has a strong lead from respondents in mid-sized organisations
but is significantly behind New York in the group of respondents from the largest organisations (this group is dominated by the largest global banks). Many of the largest global banks are headquartered in New York and favour it as their home centre.
“It is obvious to me that an investment bank with global aspirations needs to have a presence in US,
European and Asian time-zones.
New York, London and Singapore are all great locations.”
INVESTMENT BANKER BASED IN SINGAPORE
720
740
760
780
800
820
840
860
880
900
920
Fewer than 100 100 to 500 500 to 1,000 1,000 to 2,000 2,000 to 5,000 More than 5,000
London
New York
Hong Kong
Singapore
Tokyo

34 The Global Financial Centres Index 23
Appendix 1: Assessment Details Table 16 | GFCI 23 Details of Assessments by Centre
Number Average St. Dev
Glasgow 49 614 198 552 219
Amsterdam 50 613 448 622 211
Bahrain 51 612 138 580 207
Johannesburg 52 610 158 604 211
Guernsey 53 605 223 565 220
Monaco 54 604 213 611 218
Oslo 55 602 151 562 216
Mauritius 56 601 89 557 250
Isle of Man 57 600 192 551 233
Copenhagen 58 599 245 548 211
Bahamas 59 596 129 584 234
British Virgin Islands 60 594 172 640 240
Milan 61 593 280 641 193
Brussels 62 592 378 595 205
Tianjin 63 588 146 661 209
Vienna 64 583 188 540 231
Rome 65 579 233 565 215
Gibraltar 66 576 176 524 249
Sao Paulo 67 574 131 617 206
Riyadh 68 573 81 506 242
Liechtenstein 69 570 170 567 248
Mexico City 70 569 131 556 214
Prague 71 567 156 569 208
Cyprus 72 566 143 523 225
Mumbai 73 565 220 534 210
Lisbon 74 564 210 553 228
Buenos Aires 75 563 76 517 247
Istanbul 76 562 165 541 222
Malta 77 561 190 545 217
New Delhi 78 560 193 504 217
Tallinn 79 559 78 531 263
Panama 80 558 122 545 256
Rio de Janeiro 81 557 92 547 229
Chengdu 82 556 530 492 234
Moscow 83 555 330 527 222
Manila 84 554 163 523 191
Helsinki 85 553 153 530 210
Trinidad and Tobago 86 552 48 492 240
Riga 87 551 97 498 236
Astana 88 548 153 482 255
Budapest 89 547 107 531 196
Jakarta 90 546 165 566 195
St Petersburg 91 531 152 527 241
Athens 92 525 120 407 221
Reykjavik 93 521 116 516 230
Almaty 94 519 121 518 239
Baku 95 511 107 461 217
Dalian 96 501 941 332 176
CentreGFCI
23
Rank
GFCI
23
Rating
----- Assessmemts -----
Number Average St. Dev
London 1 794 1,321 854 153
New York 2 793 1,143 865 128
Hong Kong 3 781 1,086 839 129
Singapore 4 765 716 856 136
Tokyo 5 749 488 803 149
Shanghai 6 741 830 801 157
Toronto 7 728 409 760 162
San Francisco 8 726 434 766 160
Sydney 9 724 352 784 153
Boston 10 722 480 753 146
Beijing 11 721 849 738 163
Melbourne 12 720 213 731 177
Montreal 13 719 221 695 174
Chicago 14 718 486 735 155
Vancouver 15 717 246 735 169
Zurich 16 713 514 755 176
Los Angeles 17 712 394 718 154
Shenzhen 18 710 542 758 157
Dubai 19 709 478 721 189
Frankfurt 20 708 663 735 196
Luxembourg 21 701 388 693 212
Cayman Islands 22 700 192 670 231
Osaka 23 692 157 683 187
Paris 24 687 608 689 190
Geneva 25 682 411 668 194
Seoul 26 679 342 715 169
Guangzhou 27 678 353 692 161
Hamburg 28 676 227 626 213
Taipei 29 673 213 689 168
Abu Dhabi 30 669 334 656 219
Dublin 31 666 467 663 199
Casablanca 32 664 130 766 212
Qingdao 33 662 1,055 826 141
Tel Aviv 34 661 104 622 265
Munich 35 660 239 666 209
Bermuda 36 656 114 661 244
Bangkok 37 643 222 598 179
Calgary 38 642 149 611 194
Jersey 39 637 252 573 213
Kuala Lumpur 40 632 232 623 178
Madrid 41 631 291 619 186
Stockholm 42 629 186 562 228
Edinburgh 43 628 376 639 193
Wellington 44 621 78 686 186
Warsaw 45 620 168 538 230
Busan 46 618 150 589 201
Doha 47 617 181 644 216
Washington DC 48 616 456 765 173
----- Assessmemts -----Centre
GFCI
23
Rank
GFCI
23
Rating
The Global Financial Centres Index 23 35
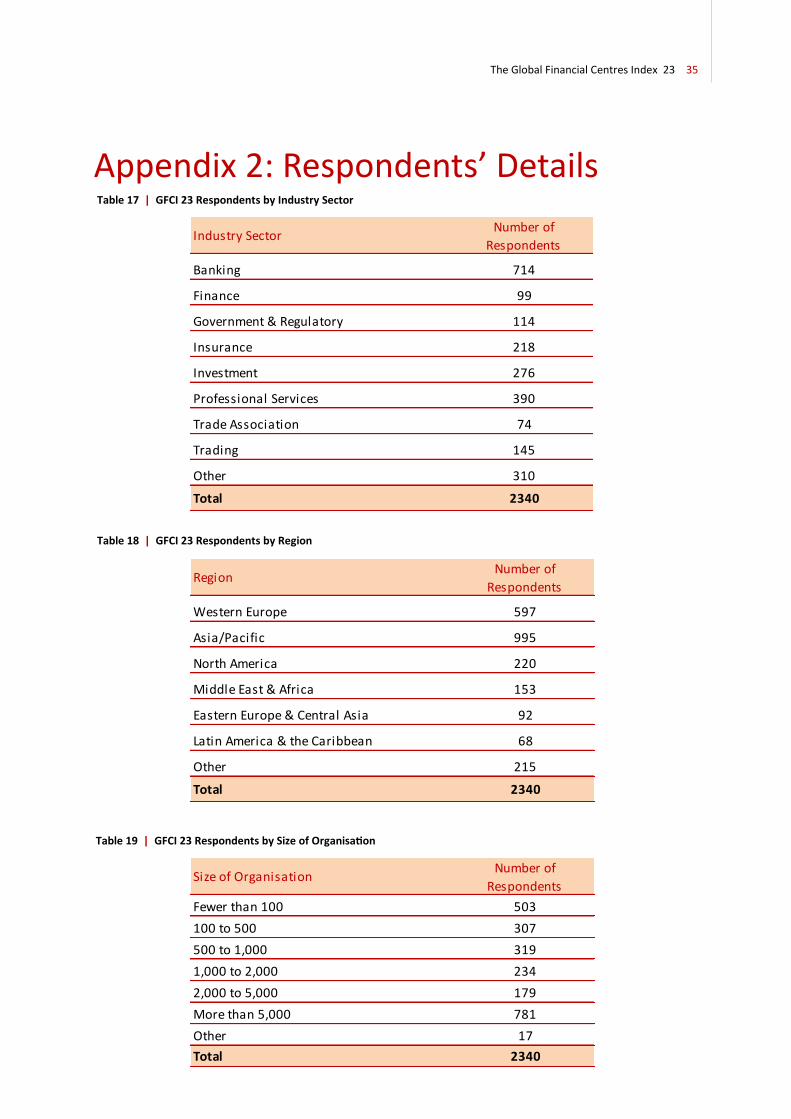
Appendix 2: Respondents’ Details Table 17 | GFCI 23 Respondents by Industry Sector
Table 19 | GFCI 23 Respondents by Size of Organisation
Table 18 | GFCI 23 Respondents by Region
Industry SectorNumber of
Respondents
Banking 714
Finance 99
Government & Regulatory 114
Insurance 218
Investment 276
Professional Services 390
Trade Association 74
Trading 145
Other 310
Total 2340
RegionNumber of
Respondents
Western Europe 597
Asia/Pacific 995
North America 220
Middle East & Africa 153
Eastern Europe & Central Asia 92
Latin America & the Caribbean 68
Other 215
Total 2340
Size of OrganisationNumber of
Respondents
Fewer than 100 503
100 to 500 307
500 to 1,000 319
1,000 to 2,000 234
2,000 to 5,000 179
More than 5,000 781
Other 17
Total 2340

36 The Global Financial Centres Index 23
Appendix 3: Methodology The GFCI provides ratings for financial centres calculated by a ‘factor assessment model’ that uses two distinct sets of input:
Instrumental factors: objective evidence of competitiveness was sought from a wide variety of comparable sources. For example, evidence about the telecommunications infrastructure competitiveness of a financial centre is drawn from the ICT Development Index (supplied by the United Nations), the Networked Readiness Index (supplied by the World Economic Forum), the Telecommunication Infrastructure Index (by the United Nations) and the Web Index (supplied by the World Wide Web Foundation). Evidence about a business-friendly regulatory environment is drawn from the Ease of Doing Business Index (supplied by the World Bank), the Government Effectiveness rating (supplied by the World Bank) and the Corruption Perceptions Index (supplied by Transparency International) amongst others.
A total of 103 instrumental factors are used in GFCI 23 of which 48 were updated since GFCI 22 and four are new to the GFCI). Not all financial centres are represented in all the external sources, and the statistical model takes account of these gaps.
Financial centre assessments: by means of an online questionnaire, running continuously since 2007, We received 3,353 responses to the questionnaire in the 24 months to June 2017. Of these, 2,340 respondents provided 28,599 valid assessments of financial centres. Financial centres are added to the GFCI questionnaire when they receive five or more mentions in the online questionnaire in response to the question: “Are there any financial centres that might become significantly more important over the next two to three years?”
A centre is only given a GFCI rating and ranking if it receives more than 150 assessments from other centres within the previous 24 months in the online survey. Centres in the GFCI that do not receive 50 assessments in a 24 month period are removed and added to the Associate list until the number of assessments increases.
At the beginning of our work on the GFCI, a number of guidelines were set out. Additional Instrumental Factors are added to the GFCI model when relevant and meaningful ones are discovered:
• indices should come from a reputable body and be derived by a sound methodology;
• indices should be readily available (ideally in the public domain) and be regularly updated;
• updates to the indices are collected and collated every six months;
• no weightings are applied to indices;
• Indices are entered into the GFCI model as directly as possible, whether this is a rank, a derived score , a value, a distribution around a mean or a distribution around a benchmark;
• if a factor is at a national level, the score will be used for all centres in that country; nation-based factors will be avoided if financial centre (city) - based factors are available;
• if an index has multiple values for a city or nation, the most relevant value is used (and the method for judging relevance is noted);
• if an index is at a regional level, the most relevant allocation of scores to each centre is made (and the method for judging relevance is noted);
• if an index does not contain a value for a particular city, a blank is entered against that centre (no average or mean is used).
Creating the GFCI does not involve totalling or averaging scores across instrumental factors. An approach involving totalling and averaging would involve a number of difficulties:
• indices are published in a variety of different forms: an average or base point of 100 with scores above and below this; a simple ranking; actual values (e.g. $ per square foot of occupancy costs); a composite ‘score’;
• indices would have to be normalised, e.g. in some indices a high score is positive while in others a low score is positive;
• not all centres are included in all indices;
• the indices would have to be weighted.

The Global Financial Centres Index 23 37
The guidelines for financial centre assessments by respondents are:
• responses are collected via an online questionnaire which runs continuously. A link to this questionnaire is emailed to the target list of respondents at regular intervals and other interested parties can fill this in by following the link given in the GFCI publications;
• financial centre assessments will be included in the GFCI model for 24 months after they have been received;
• respondents rating fewer than three or more than half of the centres are excluded from the model;
• respondents who do not say where they work are excluded;
• financial centre assessments from the month when the GFCI is created are given full weighting and earlier responses are given a reduced weighting on a log scale.
“Abu Dhabi continues to attract investment
even though Dubai has a stronger reputation
at the moment.” PENSION FUND MANAGER

38 The Global Financial Centres Index 23
The financial centre assessments and instrumental factors are used to build a predictive model of centre competitiveness using a support vector machine (SVM). SVMs are based upon statistical techniques that classify and model complex historic data in order to make predictions of new data. SVMs work well on discrete, categorical data but also handle continuous numerical or time series data. The SVM used for the GFCI provides information about the confidence with which each specific classification is made and the likelihood of other possible classifications.
A factor assessment model is built using the centre assessments from responses to the online question-naire. Assessments from respondents’ home centres are excluded from the factor assessment model to remove home bias. The model then predicts how respondents would have assessed centres they are not familiar with, by answering questions such as:
• If an investment banker gives Singapore and Sydney certain assessments then, based on the relevant data for Singapore, Sydney and Paris, how would that person assess Paris?
Or
• If a pension fund manager gives Edinburgh and Munich a certain assessment then, based on the relevant data for Edinburgh, Munich and Zurich, how would that person assess Zurich?
Financial centre predictions from the SVM are re-combined with actual financial centre assessments (except those from the respondents’ home centres) to produce the GFCI – a set of financial centre ratings.
The GFCI is dynamically updated either by updating and adding to the instrumental factors or through new financial centre assessments. These updates permit, for instance, a recently changed index of rental costs to affect the competitiveness rating of the centres.
Chart 42 | Reduction In Weighting as Assessments Get Older
0%
10%
20%
30%
40%
50%
60%
70%
80%
90%
100%
1 2 3 4 5 6 7 8 9 10 11 12 13 14 15 16 17 18 19 20 21 22 23 24
Pe
rce
nta
ge W
eig
hti
ng
of
Ass
ess
me
nt
Age of Assessment (Months)

The Global Financial Centres Index 23 39
It is worth drawing attention to a few consequences of basing the GFCI on instrumental factors and questionnaire responses:
• several indices can be used for each competitive factor;
• a strong international group of ‘raters’ has developed as the GFCI progresses;
• sector-specific ratings are available using the business sectors represented by questionnaire respondents. This makes it possible to rate Frankfurt as competitive in Banking (for example) while less competitive Insurance (for example);
• the factor assessment model can be queried in a ‘what if’ mode – “how much would Lon-don rental costs need to fall in order to increase London’s ranking against New York?”
Part of the process of building the GFCI is extensive sensitivity testing to changes in factors of competitiveness and financial centre assessments.
There are over ten million data points in the current GFCI model. The accuracy of predictions given by the SVM are regularly tested against actual assessments.
Chart 43 | The GFCI Process
Factor of CompetitivenessInstrumental Factor
Instrumental Factor
Instrumental Factor
Instrumental Factor
Instrumental Factor
Factor of Competitiveness
Factor of Competitiveness
Factor of Competitiveness
Factor of Competitiveness
Financial Centre Assessments from
Online Questionnaire
Instrumental Factor Updates
Change in Financial Centre Assessments
Instrumental Factor Prediction Engine (SVM)
UpdatedGFCI
40 The Global Financial Centres Index 23
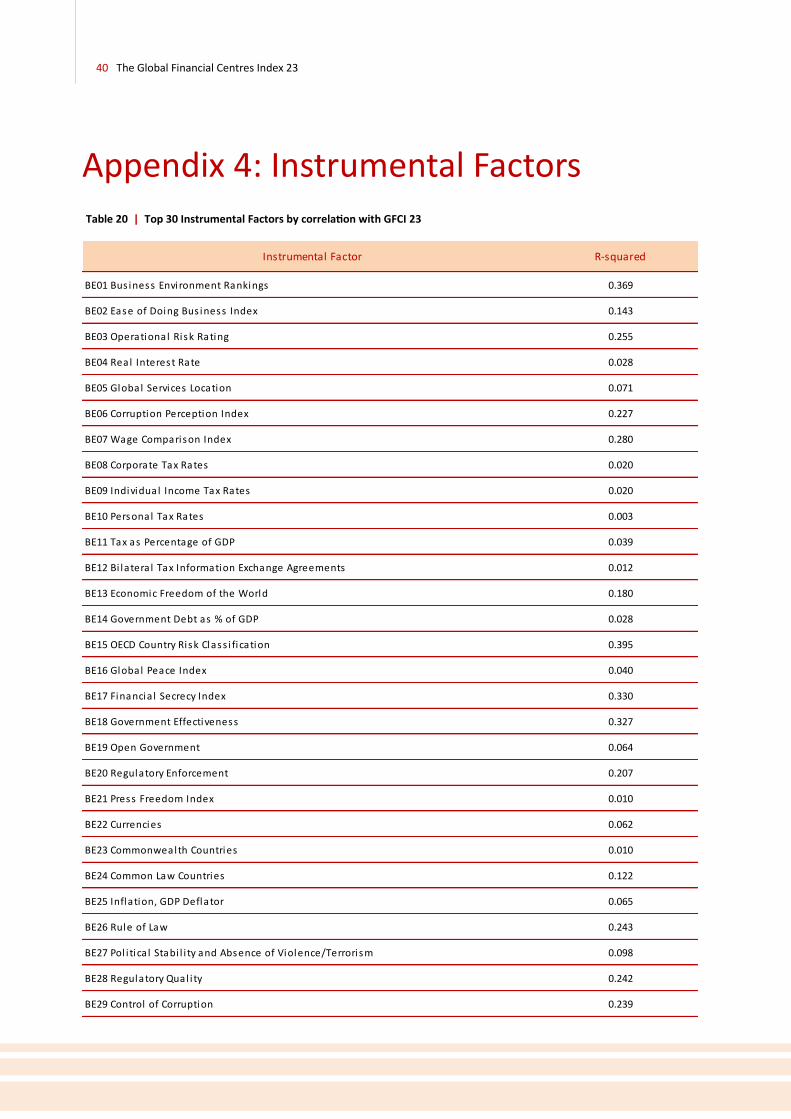
Appendix 4: Instrumental Factors Table 20 | Top 30 Instrumental Factors by correlation with GFCI 23
Instrumental Factor R-squared
BE01 Bus iness Environment Rankings 0.369
BE02 Ease of Doing Bus iness Index 0.143
BE03 Operational Risk Rating 0.255
BE04 Real Interest Rate 0.028
BE05 Global Services Location 0.071
BE06 Corruption Perception Index 0.227
BE07 Wage Comparison Index 0.280
BE08 Corporate Tax Rates 0.020
BE09 Individual Income Tax Rates 0.020
BE10 Personal Tax Rates 0.003
BE11 Tax as Percentage of GDP 0.039
BE12 Bi latera l Tax Information Exchange Agreements 0.012
BE13 Economic Freedom of the World 0.180
BE14 Government Debt as % of GDP 0.028
BE15 OECD Country Risk Class i fication 0.395
BE16 Global Peace Index 0.040
BE17 Financia l Secrecy Index 0.330
BE18 Government Effectiveness 0.327
BE19 Open Government 0.064
BE20 Regulatory Enforcement 0.207
BE21 Press Freedom Index 0.010
BE22 Currencies 0.062
BE23 Commonwealth Countries 0.010
BE24 Common Law Countries 0.122
BE25 Inflation, GDP Deflator 0.065
BE26 Rule of Law 0.243
BE27 Pol i tica l Stabi l i ty and Absence of Violence/Terrorism 0.098
BE28 Regulatory Qual i ty 0.242
BE29 Control of Corruption 0.239

The Global Financial Centres Index 23 41
Table 21 | GFCI 23 Business Environment Factors
Instrumental Factor Source WebsiteChange Since
GFCI 22
Bus iness Environment Rankings EIUhttp://www.eiu.com/public/thankyou_download.as
px?activity=download&campaignid=bizenviro2014
Ease of Doing Bus iness Index The World Bankhttp://databank.worldbank.org/data/reports.aspx?s
ource=doing-businessUpdated
Operational Risk Rating EIUhttp://www.viewswire.com/index.asp?layout=home
PubTypeRKUpdated
Real Interest Rate The World Bankhttp://databank.worldbank.org/data/reports.aspx?s
ource=world-development-indicatorsUpdated
Global Services Location AT Kearneyhttps://www.atkearney.com/digital-
transformation/gsliUpdated
Corruption Perception Index Transparency Internationalhttp://www.transparency.org/policy_research/surve
ys_indices/cpiUpdated
Wage Comparison Index UBShttp://www.ubs.com/1/e/wealthmanagement/weal
th_management_research/prices_earnings.html
Corporate Tax Rates PWC http://www.doingbusiness.org/reports/thematic-
reports/paying-taxes/Updated
Individual Income tax rates KPMGhttps://home.kpmg.com/xx/en/home/services/tax/t
ax-tools-and-resources/tax-rates-online/individual-New
Personal Tax Rates OECDhttp://www.oecd.org/tax/tax-policy/tax-
database.htmUpdated
Tax as Percentage of GDP The World Bankhttp://databank.worldbank.org/data/reports.aspx?s
ource=world-development-indicatorsUpdated
Bi latera l Tax Information Exchange Agreements OECDhttp://www.oecd.org/document/7/0,3343,en_2649_
33767_38312839_1_1_1_1,00.html
Economic Freedom of the World Fraser Insti tute http://www.freetheworld.com/release.html Updated
Government Debt as % of GDP CIAhttps://www.cia.gov/library/publications/the-world-
factbook/rankorder/2186rank.htmlUpdated
OECD Country Risk Class i fication OECD http://www.oecd.org/tad/xcred/crc.htm Updated
Global Peace Index Insti tute for Economics & Peace http://www.visionofhumanity.org/
Financia l Secrecy Index Tax Justice Network http://www.financialsecrecyindex.com/
Government Effectiveness The World Bankhttp://info.worldbank.org/governance/wgi/index.as
px#homeUpdated
Open Government World Justice Project http://worldjusticeproject.org/rule-of-law-index
Regulatory Enforcement World Justice Project http://worldjusticeproject.org/rule-of-law-index
Press Freedom Index Reporters Without Borders (RSF) http://en.rsf.org/
Currencies Swiss Association for Standardization (SNV)http://www.currency-iso.org/en/home/tables/table-
a1.htmlUpdated
Commonwealth Countries The Commonwealth http://thecommonwealth.org/member-countries
Common Law Countries CIAhttps://www.cia.gov/library/publications/the-world-
factbook/fields/2100.html
Inflation, GDP Deflator The World Bankhttp://databank.worldbank.org/data/reports.aspx?s
ource=world-development-indicatorsUpdated
Rule of Law The World Bankhttp://info.worldbank.org/governance/wgi/index.as
px#homeUpdated
Pol i tica l Stabi l i ty and Absence of Violence/TerrorismThe World Bankhttp://info.worldbank.org/governance/wgi/index.as
px#homeUpdated
Regulatory Qual i ty The World Bankhttp://info.worldbank.org/governance/wgi/index.as
px#homeUpdated
Control of Corruption The World Bankhttp://info.worldbank.org/governance/wgi/index.as
px#homeUpdated
Best Countries for Bus iness Forbeshttp://www.forbes.com/best-countries-for-
business/list/#tab:overallUpdated
Lloyd’s Ci ty Risk Index 2015-2025 Lloyd’s http://www.lloyds.com/cityriskindex/locations
Global Cybersecuri ty Index ITU http://www.itu.int/en/ITU-D/Cybersecurity/Pages/GCI.aspxUpdated

42 The Global Financial Centres Index 23
Table 22 | GFCI 23 Human Capital Factors
Table 23 | GFCI 23 Infrastructure Factors
Instrumental Factor Source WebsiteChange Since
GFCI 22
Graduates in Socia l Science, Bus iness and Law The World Bankhttp://databank.worldbank.org/data/reports.aspx?s
ource=Education%20StatisticsUpdated
Gross Tertiary Graduation Ratio The World Bankhttp://databank.worldbank.org/data/reports.aspx?s
ource=Education%20StatisticsUpdated
Visa Restrictions Index Henley Partnershttp://www.henleyglobal.com/citizenship/visa-
restrictions/
Human Development Index UN Development Programme http://hdr.undp.org
Citizens Domestic Purchas ing Power UBShttp://www.ubs.com/1/e/wealthmanagement/weal
th_management_research/prices_earnings.html
Number of High Net Worth Individuals Capgemini https://www.worldwealthreport.com/ Updated
Homicide Rates UN Office of Drugs & Crime https://data.unodc.org/
Top Tourism Destinations Euromonitorhttp://blog.euromonitor.com/2016/01/top-100-city-
destinations-ranking-2016.html
Average precipi tation in depth The World Bankhttp://databank.worldbank.org/data/reports.aspx?s
ource=world-development-indicators
Qual i ty of Living Ci ty Rankings Mercer http://www.mercer.com
Health Care Index Numbeo http://www.numbeo.com/health-care/rankings.jsp
Global Ski l l s Index Hays http://www.hays-index.com/ Updated
Linguis tic Divers i ty Ethnologue http://www.ethnologue.com/statistics/country
Global Terrorism Index Insti tute for Economics & Peace http://www.visionofhumanity.org/ Updated
World Ta lent Rankings IMD http://www.imd.org/wcc/news-talent-report/ Updated
Cost of Living Ci ty Rankings Mercer http://www.mercer.com
Qual i ty of Li fe Index Numbeo http://www.numbeo.com/quality-of-life/rankings.jsp
Crime Index Numbeo http://www.numbeo.com/crime/rankings.jsp#
Instrumental Factor Source WebsiteChange Since
GFCI 22
Office Occupancy Cost CBRE Researchhttp://www.cbre.com/research-and-reports/Global-
Prime-Office-Occupancy-Costs-2016
Prime International Res identia l Index Knight Frank http://www.knightfrank.com/wealthreport
JLL Real Estate Transparency Index Jones Lang LaSal le http://www.jll.com/greti/Pages/Rankings.aspx
ICT Development Index United Nations http://www.itu.int/net4/ITU-D/idi/2017/index.html Updated
Telecommunication Infrastructure Index United Nations http://unpan3.un.org/egovkb/Data-Center
Qual i ty of Domestic Transport Network World Economic Forumhttp://reports.weforum.org/travel-and-tourism-
competitiveness-report-2015/
Qual i ty of Roads World Economic Forumhttp://reports.weforum.org/travel-and-tourism-
competitiveness-report-2015/
Roadways per Land Area CIAhttps://www.cia.gov/library/publications/the-world-
factbook/rankorder/2085rank.html
Rai lways per Land Area CIAhttps://www.cia.gov/library/publications/the-world-
factbook/rankorder/2121rank.html
Networked Readiness Index World Economic Forumhttp://reports.weforum.org/global-information-
technology-report-2016/
Energy Susta inabi l i ty Index World Energy Counci lhttp://www.worldenergy.org/data/sustainability-
index/Updated
Metro Network Length Metro Bi ts http://mic-ro.com/metro/table.html Updated
Open Data Barometer The World Wide Web Foundationhttp://opendatabarometer.org/?_year=2016&indica
tor=ODBNew
Environmental Performance Yale Univers i ty http://epi.yale.edu//epi/country-rankings
Global Susta inable Competitiveness Index Solabi l i tyhttp://solability.com/the-global-sustainable-
competitiveness-index/the-indexUpdated
Logis tics Performance Index The World Bank http://lpi.worldbank.org/international/global
Networked Society Ci ty Index Ericssonhttps://www.ericsson.com/res/docs/2016/2016-
networked-society-city-index.pdf
TomTom Trafic Index TomTomhttps://www.tomtom.com/en_gb/trafficindex/list?ci
tySize=LARGE&continent=ALL&country=ALL
Sustainable Ci ties Mobi l i ty Index Arcadishttps://www.arcadis.com/en/global/our-
perspectives/sustainable-cities-mobility-index-New
The Global Financial Centres Index 23 43
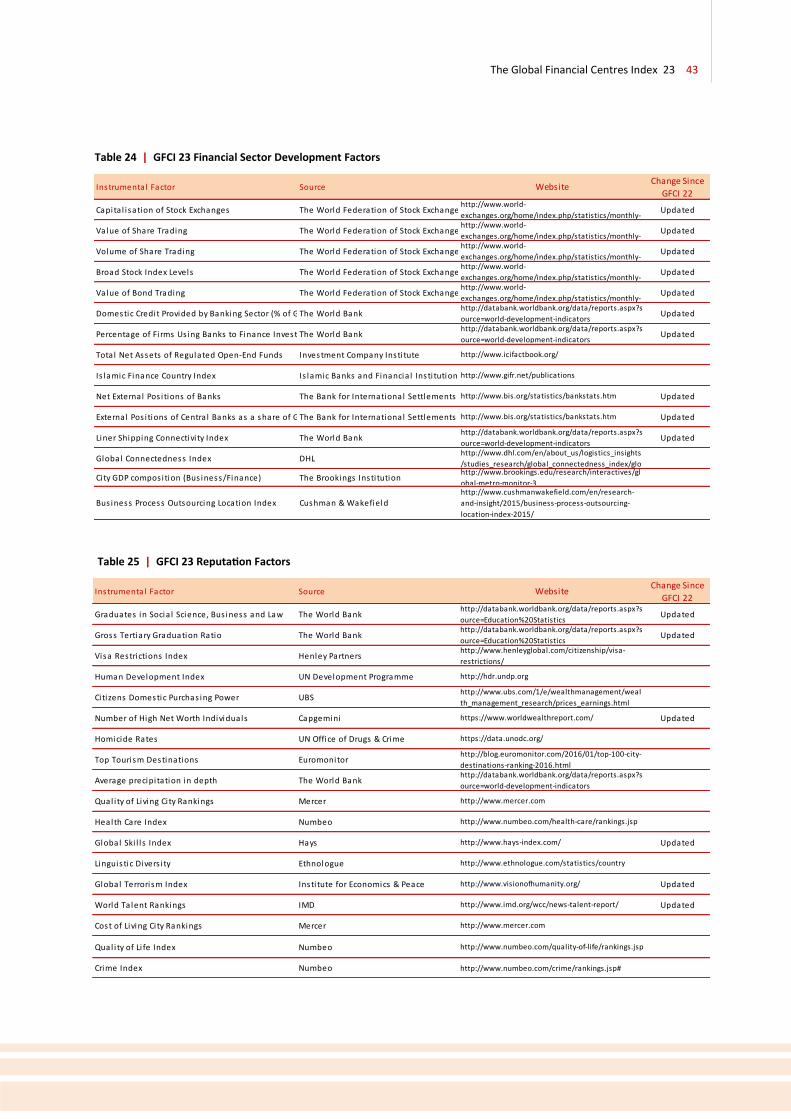
Table 24 | GFCI 23 Financial Sector Development Factors
Table 25 | GFCI 23 Reputation Factors
Instrumental Factor Source WebsiteChange Since
GFCI 22
Capita l i sation of Stock Exchanges The World Federation of Stock Exchangeshttp://www.world-
exchanges.org/home/index.php/statistics/monthly-Updated
Value of Share Trading The World Federation of Stock Exchangeshttp://www.world-
exchanges.org/home/index.php/statistics/monthly-Updated
Volume of Share Trading The World Federation of Stock Exchangeshttp://www.world-
exchanges.org/home/index.php/statistics/monthly-Updated
Broad Stock Index Levels The World Federation of Stock Exchangeshttp://www.world-
exchanges.org/home/index.php/statistics/monthly-Updated
Value of Bond Trading The World Federation of Stock Exchangeshttp://www.world-
exchanges.org/home/index.php/statistics/monthly-Updated
Domestic Credit Provided by Banking Sector (% of GDP)The World Bankhttp://databank.worldbank.org/data/reports.aspx?s
ource=world-development-indicatorsUpdated
Percentage of Fi rms Us ing Banks to Finance InvestmentThe World Bankhttp://databank.worldbank.org/data/reports.aspx?s
ource=world-development-indicatorsUpdated
Total Net Assets of Regulated Open-End Funds Investment Company Insti tute http://www.icifactbook.org/
Is lamic Finance Country Index Is lamic Banks and Financia l Insti tutionshttp://www.gifr.net/publications
Net External Pos i tions of Banks The Bank for International Settlements http://www.bis.org/statistics/bankstats.htm Updated
External Pos i tions of Centra l Banks as a share of GDPThe Bank for International Settlements http://www.bis.org/statistics/bankstats.htm Updated
Liner Shipping Connectivi ty Index The World Bankhttp://databank.worldbank.org/data/reports.aspx?s
ource=world-development-indicatorsUpdated
Global Connectedness Index DHLhttp://www.dhl.com/en/about_us/logistics_insights
/studies_research/global_connectedness_index/glo
City GDP compos ition (Bus iness/Finance) The Brookings Insti tutionhttp://www.brookings.edu/research/interactives/gl
obal-metro-monitor-3
Bus iness Process Outsourcing Location Index Cushman & Wakefieldhttp://www.cushmanwakefield.com/en/research-
and-insight/2015/business-process-outsourcing-
location-index-2015/
Instrumental Factor Source WebsiteChange Since
GFCI 22
Graduates in Socia l Science, Bus iness and Law The World Bankhttp://databank.worldbank.org/data/reports.aspx?s
ource=Education%20StatisticsUpdated
Gross Tertiary Graduation Ratio The World Bankhttp://databank.worldbank.org/data/reports.aspx?s
ource=Education%20StatisticsUpdated
Visa Restrictions Index Henley Partnershttp://www.henleyglobal.com/citizenship/visa-
restrictions/
Human Development Index UN Development Programme http://hdr.undp.org
Citizens Domestic Purchas ing Power UBShttp://www.ubs.com/1/e/wealthmanagement/weal
th_management_research/prices_earnings.html
Number of High Net Worth Individuals Capgemini https://www.worldwealthreport.com/ Updated
Homicide Rates UN Office of Drugs & Crime https://data.unodc.org/
Top Tourism Destinations Euromonitorhttp://blog.euromonitor.com/2016/01/top-100-city-
destinations-ranking-2016.html
Average precipi tation in depth The World Bankhttp://databank.worldbank.org/data/reports.aspx?s
ource=world-development-indicators
Qual i ty of Living Ci ty Rankings Mercer http://www.mercer.com
Health Care Index Numbeo http://www.numbeo.com/health-care/rankings.jsp
Global Ski l l s Index Hays http://www.hays-index.com/ Updated
Linguis tic Divers i ty Ethnologue http://www.ethnologue.com/statistics/country
Global Terrorism Index Insti tute for Economics & Peace http://www.visionofhumanity.org/ Updated
World Ta lent Rankings IMD http://www.imd.org/wcc/news-talent-report/ Updated
Cost of Living Ci ty Rankings Mercer http://www.mercer.com
Qual i ty of Li fe Index Numbeo http://www.numbeo.com/quality-of-life/rankings.jsp
Crime Index Numbeo http://www.numbeo.com/crime/rankings.jsp#

44 The Global Financial Centres Index 23
Vantage Financial Centres is an exclusive club of financial centres around the world run by Z/Yen Partners for organisations looking for a deeper understanding of financial centre
competitiveness. Members receive enhanced access to GFCI data, marketing opportunities, and training for centres seeking to enhance their profile and reputation.
The China Development Institute (CDI) is a leading national think-tank that develops solutions to public policy challenges through broad-scope and in-depth research to help advance China’s reform and opening-up to world markets.
The CDI has been working on the promotion and development of China’s financial system since its establishment 28 years ago. Based on rigorous research and objective analysis, CDI is committed to providing prospective, innovative and pragmatic reports for governments at different levels in China and corporations at home and abroad.
Global Times Consulting Co. is a strategic consultancy with a focus on China. We help Chinese (local) governments at all levels to build their reputation globally, providing strategic counsel, stakeholder outreach and communications to support their sustainable development. We also partner with multinational companies operating in this dynamic but challenging market, serving as a gateway to China. In addition, we help Chinese companies extend their reach overseas.
Global Times Consulting Co. adopts a research and knowledge-based approach. With extensive contacts and deep insights into China’s political and economic landscape, we develop and execute integrated programs for stakeholder relations and reputation management. Our extensive relationship with media and government organizations in China and worldwide helps us successfully execute programs and achieve desired goals.
Carol Feng at [email protected] www.cdi.org.cn
Daniel Wang at [email protected] www.globaltimes.com.cn
Abu Dhabi Global Market (ADGM), an international financial centre in the capital of the UAE, opened for business in October 2015. Strategically situated in Abu Dhabi, home to one of the world’s largest sovereign wealth funds, ADGM plays a vital role in positioning Abu Dhabi as a global hub for business and finance that connects the growing economies of the Middle East, Africa and South Asia. ADGM also earned industry recognition as the Financial Centre of the Year (MENA) 2016, its first year of operations, for its strategic and innovative contributions. In its second year, ADGM was recognised as the Top FinTech Hub in MENA.
With the support of three independent authorities, the Registration Authority, the Financial Services Regulatory Authority and ADGM Courts, local and global companies are able to conduct their business efficiently within an international regulatory framework that has an independent judicial system and a robust legislative infrastructure based on Common Law.
[email protected] / www.adgm.com
Gujarat International Finance Tec-City (GIFT), Gujarat, India has set up International Financial Services Centre (IFSC) which is the only approved IFSC in India. The GIFT IFSC is a gateway for inbound and outbound business from India. Centre is fast emerging as a preferred destination for undertaking International Financial Services.
The GIFT IFSC covers Banking, Insurance, Capital Market and allied services covering law firms, accounting firms and professional services firms. It provides very competitive cost of operation with competitive tax regime, single window clearance, relaxed Company Law provisions, International Arbitration Centre with overall facilitation of doing business.
Dipesh Shah at [email protected] www.giftgujarat.in
International Financial Services Centre

The Global Financial Centres Index 23 45
AIFC was established in 2015 to further develop the non-banking financial sector in Kazakhstan – a very timely establishment coinciding with a new wave of privatisation and review of asset allocation strategy of government funds. Based on Astana EXPO-2017 infrastructure, it also aims to promote FinTech and drive the development of niche markets such as Islamic and green finance in the region.
Located at the heart of Eurasia, AIFC provides unprecedented conditions for participants and investors: a legal system based on English law, an independent regulatory framework consistent with internationally recognised standards, tax exemptions for 50 years, simplified visa and labour regimes, English as a working language. AIFC will be fully operational from the beginning of 2018. Kazakhstan’s geography within the Eurasian Economic Union and its role in “One Belt, One Road” offer great potential for AIFC to be a successful regional financial centre.
Daniyar Kelbetov at [email protected] www.aifc.kz
[email protected] www.bifc.kr/eng
Since 2009 Busan Metropolitan City has been developing a financial hub specialising in maritime finance and derivatives. With its strategic location in the center of the southeast economic block of Korea and the crossroads of a global logistics route, Busan envisions growing into an international financial city in Northeast Asia. Following the successful launch of the 63-story Busan International Finance Center in 2014, the second phase development of the Busan Financial Hub will be completed in 2018 and is expected to provide world-class business infrastructure for financial institutions.
BIFC offers an attractive incentive package to global financial leaders and cooperation network of Busan Metropolitan City, Busan International Financial City Promotion Center, and Financial Hub Korea will support you to identify opportunities in Busan, one of the fastest developing cities in Asia.
Please find out more at: www.vantagefinancialcentres.net
or by contacting Mark Yeandle at [email protected]
BUSAN
INTERNATIONAL
FINANCE CENTER
Finance Montréal’s mandate is to promote Montréal as a world-class financial hub and foster cooperation among its member institutions to accelerate the industry’s growth. With renowned research capacities in artificial intelligence and a booming fintech sector, Montréal offers an experienced, diversified and innovative pool of talent as well as a stable, low cost and dynamic business environment.
For financial institutions searching for an ideal location to set up an intelligent service centre and operationalize their digital transformation, Finance Montréal can advise on the advantageous tax incentives aimed at facilitating the establishment and development of financial services corporations in the city.
[email protected] www.finance-montreal.com/en
“When would we know our financial system is working?” is the question underlying Long Finance’s goal to improve society’s understanding and use of finance over the long-term. In contrast to the short-termism that defines today’s economic views the Long Finance time-frame is roughly 100 years.
Long Finance is an initiative run by the Z/Yen Group. This report and its sister publications (including the Global Green Finance Index) are integral parts of Long Finance.
We cannot possibly cover the range of topics covered by the Long Finance initiative here— please visit the website to learn more.
[email protected] www.longfinance.net

46 The Global Financial Centres Index 23
www.zyen.com
Z/Yen helps organisations make better choices – our clients consider us
a commercial think-tank that spots, solves and acts. Our name
combines Zen and Yen – “a philosophical desire to succeed” – in a ratio,
recognising that all decisions are trade-offs. One of Z/Yen’s specialisms
is the study of the competitiveness of financial centres around the
world. A summary of this work is published every six months as the
Global Financial Centres Index.
www.globalfinancialcentres.net
Financial Centre Futures is a programme within the Long Finance
initiative that initiates discussion on the changing landscape of global
finance, seeking to explore how finance might work in the future.
Financial Centre Futures comprises the Global Financial Centres Index
along with other research publications that explore major changes to
the way we will live and work in the financial system of the future.
en.cdi.org.cn
The China Development Institute (CDI) is a non-governmental think tank
that develops solutions to public policy challenges through broad-scope
and in-depth research to help advance China’s reform and opening-up
to world markets. The CDI has been working on the promotion and
development of China’s financial system since its establishment nine
years ago. Based on rigorous research and objective analysis, CDI is
committed to providing prospective, innovative and pragmatic reports
for governments at different levels in China and corporations at home
and abroad.
CO-PRODUCED BY
PRODUCED BY
PUBLISHED BY FINANCIAL CENTRE FUTURES