Embed Size (px)
Citation preview

The Global Effects of U.S. Monetary Policy
Riccardo Degasperi 1 Simon Hong 2 Giovanni Ricco 3
1University of Warwick2University of Warwick
3University of Warwick, CEPR and OFCE-SciencesPo
Annual Conference Chaire Banque de France23 September 2019, Paris
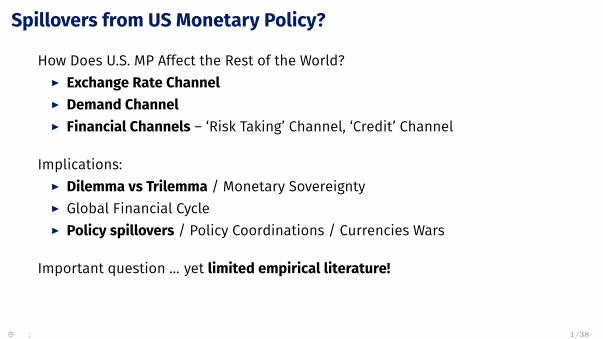
Spillovers from US Monetary Policy?
How Does U.S. MP Affect the Rest of the World?I Exchange Rate ChannelI Demand ChannelI Financial Channels – ‘Risk Taking’ Channel, ‘Credit’ Channel
Implications:I Dilemma vs Trilemma / Monetary SovereigntyI Global Financial CycleI Policy spillovers / Policy Coordinations / Currencies Wars
Important question ... yet limited empirical literature!
� : 1/38

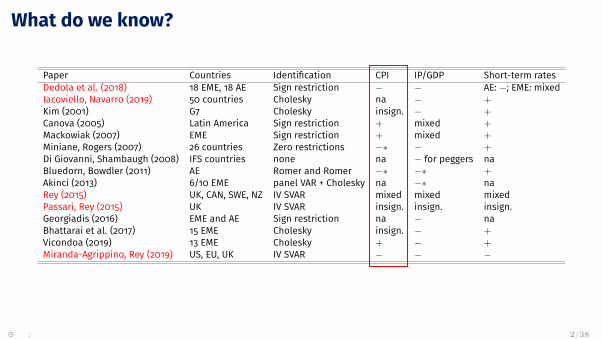
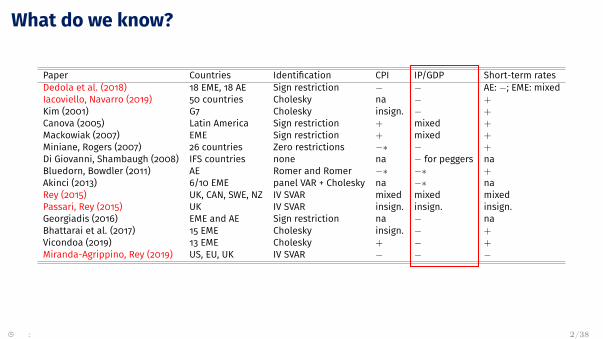
What do we know?
Paper Countries Identification CPI IP/GDP Short-term ratesDedola et al. (2018) 18 EME, 18 AE Sign restriction − − AE: −; EME: mixedIacoviello, Navarro (2019) 50 countries Cholesky na − +Kim (2001) G7 Cholesky insign. − +Canova (2005) Latin America Sign restriction + mixed +Mackowiak (2007) EME Sign restriction + mixed +Miniane, Rogers (2007) 26 countries Zero restrictions −∗ − +Di Giovanni, Shambaugh (2008) IFS countries none na − for peggers naBluedorn, Bowdler (2011) AE Romer and Romer −∗ −∗ +Akinci (2013) 6/10 EME panel VAR + Cholesky na −∗ naRey (2015) UK, CAN, SWE, NZ IV SVAR mixed mixed mixedPassari, Rey (2015) UK IV SVAR insign. insign. insign.Georgiadis (2016) EME and AE Sign restriction na − naBhattarai et al. (2017) 15 EME Cholesky insign. − +Vicondoa (2019) 13 EME Cholesky + − +Miranda-Agrippino, Rey (2019) US, EU, UK IV SVAR − − −
� : 2/38
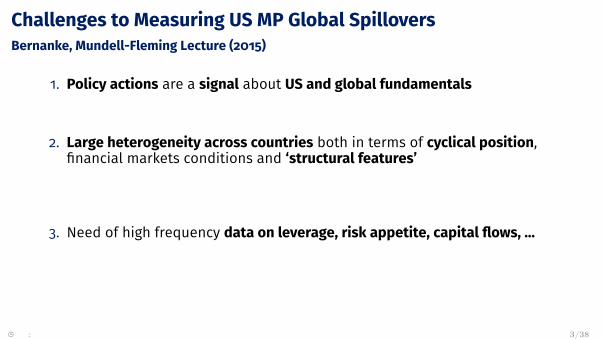
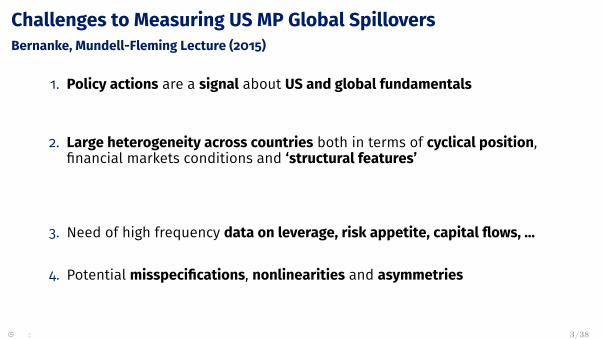
Challenges to Measuring US MP Global SpilloversBernanke, Mundell-Fleming Lecture (2015)
1. Policy actions are a signal about US and global fundamentals
=⇒ High Frequency Identification for conventional MP shocks ...=⇒ ... robust to signalling effects of MP actions
2. Large heterogeneity across countries both in terms of cyclical position,financial markets conditions and ‘structural features’
=⇒ Rich monthly dataset of 15 ADV and 15 EME=⇒ Efficient big data techniques with bilateral Large BVARs=⇒ Global macro and financial aggregates
3. Need of high frequency data on leverage, risk appetite, capital flows, ...
=⇒ Dataset of financial conditions indexes (CBC Global Liquidity dataset) CBC Data
4. Potential misspecifications, nonlinearities and asymmetries=⇒ Bayesian Local Projections and direct study of asymmetries
� : 3/38
Challenges to Measuring US MP Global SpilloversBernanke, Mundell-Fleming Lecture (2015)
1. Policy actions are a signal about US and global fundamentals
=⇒ High Frequency Identification for conventional MP shocks ...=⇒ ... robust to signalling effects of MP actions
2. Large heterogeneity across countries both in terms of cyclical position,financial markets conditions and ‘structural features’
=⇒ Rich monthly dataset of 15 ADV and 15 EME=⇒ Efficient big data techniques with bilateral Large BVARs=⇒ Global macro and financial aggregates
3. Need of high frequency data on leverage, risk appetite, capital flows, ...
=⇒ Dataset of financial conditions indexes (CBC Global Liquidity dataset) CBC Data
4. Potential misspecifications, nonlinearities and asymmetries
=⇒ Bayesian Local Projections and direct study of asymmetries
� : 3/38
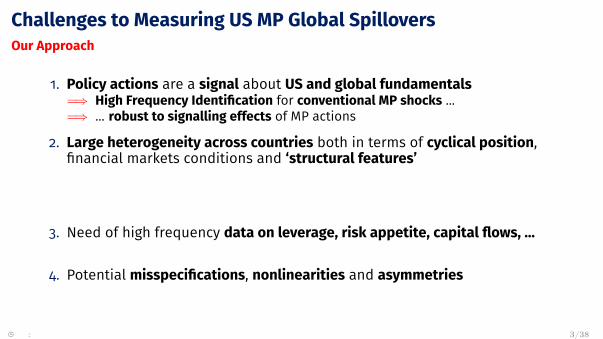
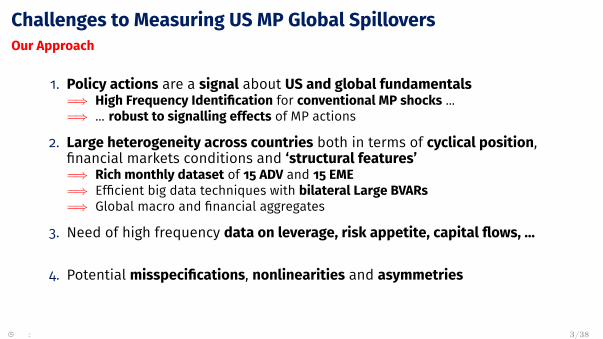
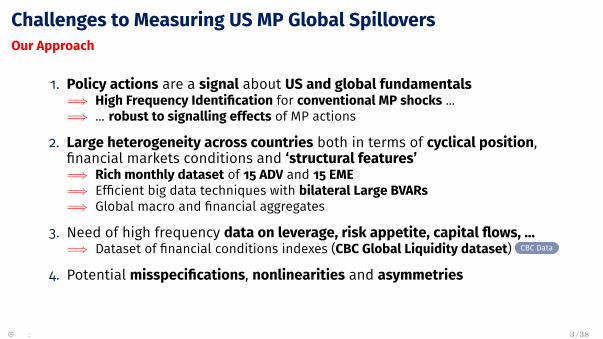
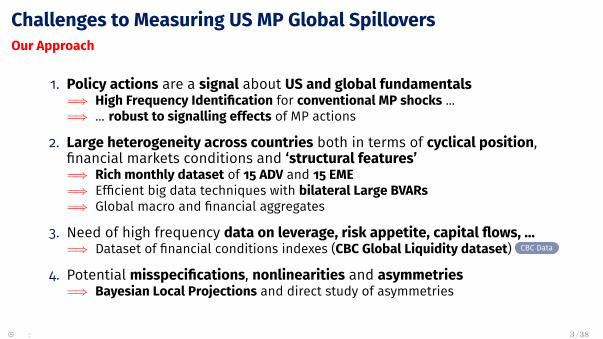
Challenges to Measuring US MP Global SpilloversOur Approach
1. Policy actions are a signal about US and global fundamentals=⇒ High Frequency Identification for conventional MP shocks ...=⇒ ... robust to signalling effects of MP actions
2. Large heterogeneity across countries both in terms of cyclical position,financial markets conditions and ‘structural features’
=⇒ Rich monthly dataset of 15 ADV and 15 EME=⇒ Efficient big data techniques with bilateral Large BVARs=⇒ Global macro and financial aggregates
3. Need of high frequency data on leverage, risk appetite, capital flows, ...
=⇒ Dataset of financial conditions indexes (CBC Global Liquidity dataset) CBC Data
4. Potential misspecifications, nonlinearities and asymmetries
=⇒ Bayesian Local Projections and direct study of asymmetries
� : 3/38
Challenges to Measuring US MP Global SpilloversOur Approach
1. Policy actions are a signal about US and global fundamentals=⇒ High Frequency Identification for conventional MP shocks ...=⇒ ... robust to signalling effects of MP actions
2. Large heterogeneity across countries both in terms of cyclical position,financial markets conditions and ‘structural features’=⇒ Rich monthly dataset of 15 ADV and 15 EME=⇒ Efficient big data techniques with bilateral Large BVARs=⇒ Global macro and financial aggregates
3. Need of high frequency data on leverage, risk appetite, capital flows, ...=⇒ Dataset of financial conditions indexes (CBC Global Liquidity dataset) CBC Data
4. Potential misspecifications, nonlinearities and asymmetries=⇒ Bayesian Local Projections and direct study of asymmetries
� : 3/38
Our Results
I Strong nominal effects
I Sizeable real effects
I Global response of capital flows and risk appetite
I Oil and commodities play an important role in CPI movements
I Some evidence of asymmetric effects
� : 4/38
Related Literature. HF Identification MP Shocks: Rudebush (1989), Kuttner (2001), Gürkaynak et al (2005),Gertler and Karadi (2015), Caldara and Herbst (2016), Jarociński and Karadi (2018),Cieslak and Schrimpf (2018), Andrade and Ferroni (2016), Miranda-Agrippino and Ricco(2015)
. Global Effects US MP: Kim (2001), Canova (2005), Mackowiak (2007), Miniane, Rogers(2007), Di Giovanni, Shambaugh (2008), Bluedorn, Bowdler (2011), Akinci (2013),Miranda-Agrippino, Rey (2019), Rey (2015, 2016), Passari, Georgiadis (2016), Bhattaraiet al. (2017), Gerko and Rey (2017), Stravakeva and Tang (2018), Dedola et al. (2018),Iacoviello, Navarro (2019), Vicondoa (2019), Gilchrist et al. (2019), Kalemli-Özcan (2019)
. Spillovers through Banks: Correa and Murry (2009), Cetorelli and Goldberg (2012),Temesvary et al. (2017), Correa et al. (2015), Buch et al. (2018), International BankingResearch Network (IBRN)
. Dominant Currency: Gourinchas and Rey (2007), Rey (2015), Bernanke (2015), Casas etal. (2017), Gourinchas et al (2017)
� : 5/38

The Identification of US MP Shocks
� : 5/38
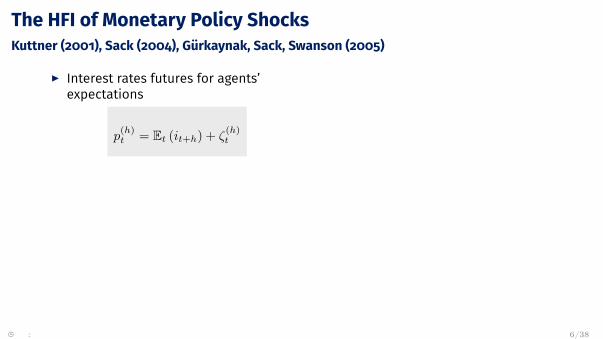
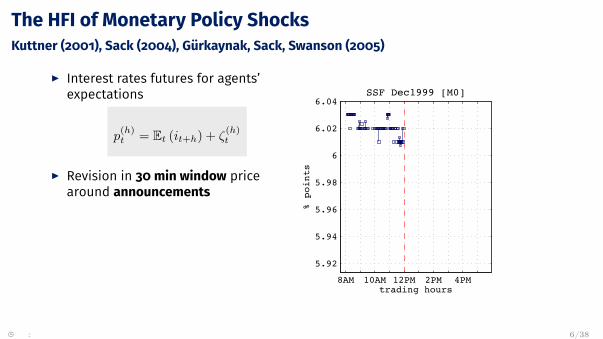
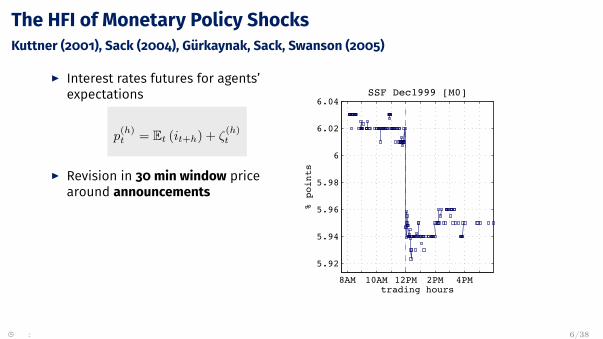
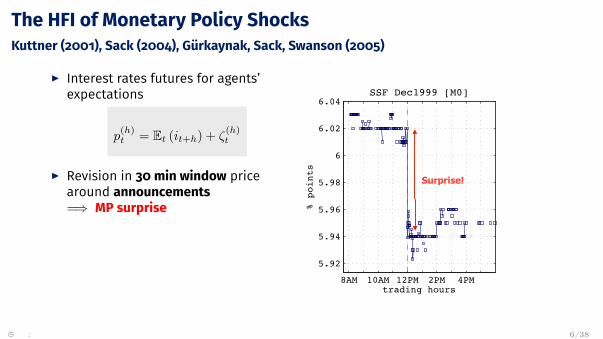
The HFI of Monetary Policy ShocksKuttner (2001), Sack (2004), Gürkaynak, Sack, Swanson (2005)
I Interest rates futures for agents’expectations
p(h)t = Et (it+h) + ζ
(h)t
I Revision in 30 min window pricearound announcements
8AM 10AM 12PM 2PM 4PM
5.92
5.94
5.96
5.98
6
6.02
6.04
% points
trading hours
SSF Dec1999 [M0]
� : 6/38
The HFI of Monetary Policy ShocksKuttner (2001), Sack (2004), Gürkaynak, Sack, Swanson (2005)
I Interest rates futures for agents’expectations
p(h)t = Et (it+h) + ζ
(h)t
I Revision in 30 min window pricearound announcements=⇒ MP surprise
8AM 10AM 12PM 2PM 4PM
5.92
5.94
5.96
5.98
6
6.02
6.04
% points
trading hours
SSF Dec1999 [M0]event type: Rate Decisiondate: 09/12/1999 12:00new rate: 5.5 (old: 5.5)forecast: 5.5
conflicts:none
Surprise!
� : 6/38
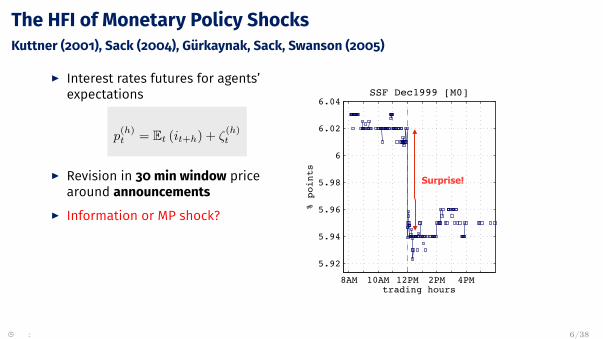
The HFI of Monetary Policy ShocksKuttner (2001), Sack (2004), Gürkaynak, Sack, Swanson (2005)
I Interest rates futures for agents’expectations
p(h)t = Et (it+h) + ζ
(h)t
I Revision in 30 min window pricearound announcements
I Information or MP shock?
8AM 10AM 12PM 2PM 4PM
5.92
5.94
5.96
5.98
6
6.02
6.04
% points
trading hours
SSF Dec1999 [M0]event type: Rate Decisiondate: 09/12/1999 12:00new rate: 5.5 (old: 5.5)forecast: 5.5
conflicts:none
Surprise!
� : 6/38
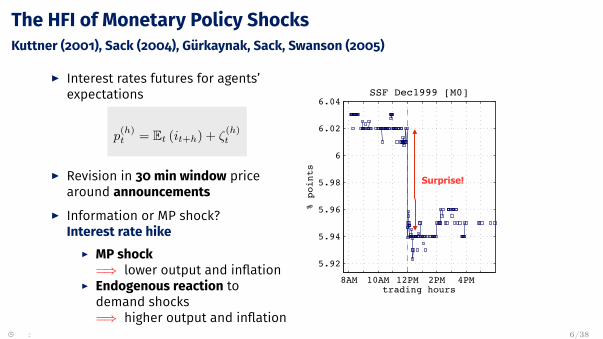
The HFI of Monetary Policy ShocksKuttner (2001), Sack (2004), Gürkaynak, Sack, Swanson (2005)
I Interest rates futures for agents’expectations
p(h)t = Et (it+h) + ζ
(h)t
I Revision in 30 min window pricearound announcements
I Information or MP shock?Interest rate hike
I MP shock=⇒ lower output and inflation
I Endogenous reaction todemand shocks=⇒ higher output and inflation
8AM 10AM 12PM 2PM 4PM
5.92
5.94
5.96
5.98
6
6.02
6.04
% points
trading hours
SSF Dec1999 [M0]event type: Rate Decisiondate: 09/12/1999 12:00new rate: 5.5 (old: 5.5)forecast: 5.5
conflicts:none
Surprise!
� : 6/38

An Informationally Robust HFIMiranda-Agrippino and Ricco (2018)
1. At FOMC frequency =⇒ Signaling Channel
FF4m = α0 +3∑
j=−1
θjFcbt xq+j +
2∑j=−1
ϑj
[F cb
t xq+j − F cbt−1xq+j
]+MPIm
� : 7/38
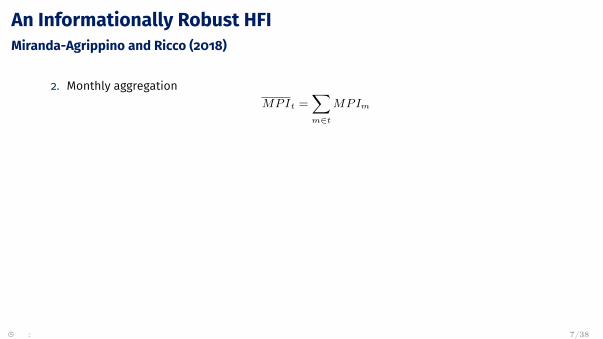
An Informationally Robust HFIMiranda-Agrippino and Ricco (2018)
2. Monthly aggregationMPIt =
∑m∈t
MPIm
� : 7/38
An Informationally Robust HFIMiranda-Agrippino and Ricco (2018)
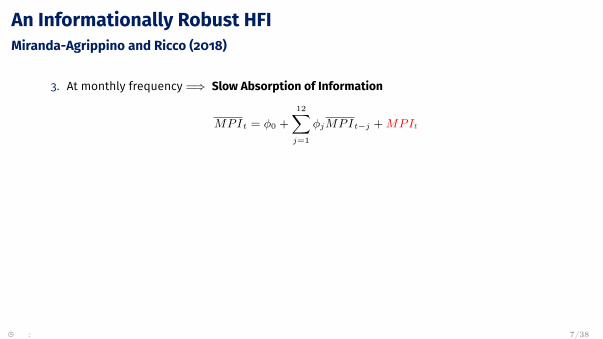
3. At monthly frequency =⇒ Slow Absorption of Information
MPIt = φ0 +12∑
j=1
φjMPIt−j +MPIt
� : 7/38
An Informationally Robust HFIMiranda-Agrippino and Ricco (2018)
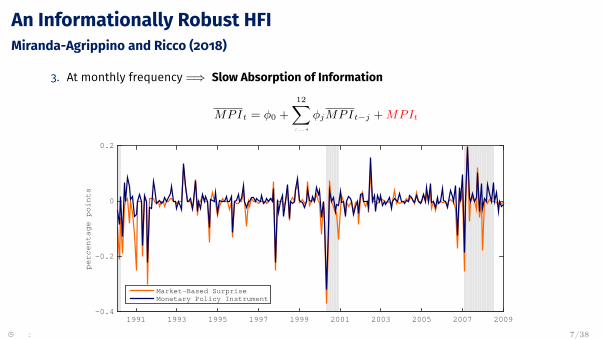
3. At monthly frequency =⇒ Slow Absorption of Information
MPIt = φ0 +12∑
j=1
φjMPIt−j +MPIt
1991 1993 1995 1997 1999 2001 2003 2005 2007 2009
percentage points
-0.4
-0.2
0
0.2
Market-Based SurpriseMonetary Policy Instrument
� : 7/38
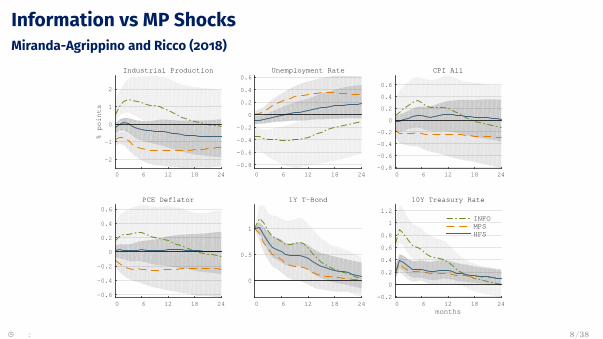
Information vs MP ShocksMiranda-Agrippino and Ricco (2018)
Industrial Production
0 6 12 18 24
% points
-2
-1
0
1
2
Unemployment Rate
0 6 12 18 24
-0.8
-0.6
-0.4
-0.2
0
0.2
0.4
0.6CPI All
0 6 12 18 24-0.8
-0.6
-0.4
-0.2
0
0.2
0.4
0.6
PCE Deflator
0 6 12 18 24
-0.6
-0.4
-0.2
0
0.2
0.4
0.6
1Y T-Bond
0 6 12 18 24
0
0.5
1
10Y Treasury Rate
months 0 6 12 18 24
-0.2
0
0.2
0.4
0.6
0.8
1
1.2INFOMPSHFS
� : 8/38

Large Bayesian VARs
I Large Bayesian VAR(12)I 27 variables in global setI 28 variables in advanced setI 28 variables in emerging set
I IV-SVAR (Stock and Watson 2012, 2018, Mertens and Ravn 2013)
I Standard macro priors (Normal-Inverse-Wishart)
I Optimal prior selection (Giannone, Lenza, Primiceri, 2015)
� : 9/38
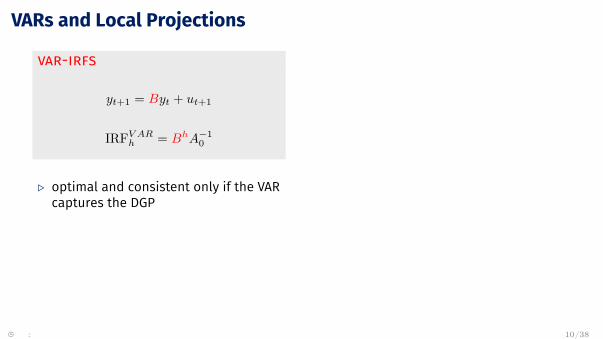
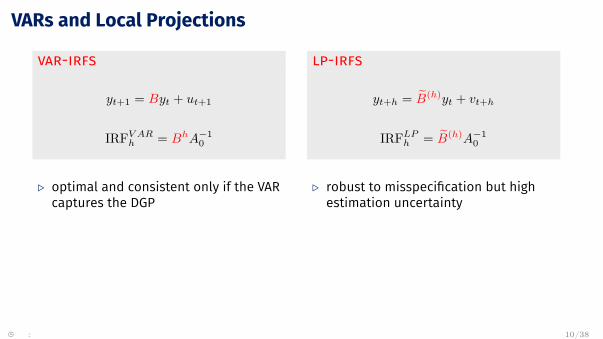
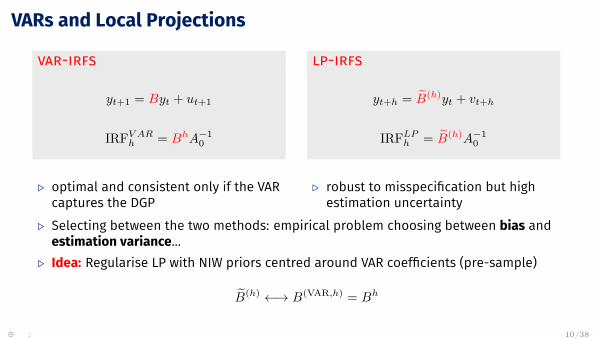
VARs and Local Projections
var-irfs
yt+1 = Byt + ut+1
IRFV ARh = BhA−1
0
. optimal and consistent only if the VARcaptures the DGP
lp-irfs
yt+h = B̃(h)yt + vt+h
IRFLPh = B̃(h)A−1
0
. robust to misspecification but highestimation uncertainty
. Selecting between the two methods: empirical problem choosing between bias andestimation variance...
. Idea: Regularise LP with NIW priors centred around VAR coefficients (pre-sample)
B̃(h) ←→ B(VAR,h) = Bh
� : 10/38

Global Spillovers
� : 10/38

Domestic Effects of U.S. Monetary Policy (BVAR)
0 6 12 18 24-4
-2
0
Industrial Production
0 6 12 18 24
-1
-0.5
0
CPI
0 6 12 18 24
-10
-5
0
5Nominal Stock Price
0 6 12 18 24-2
0
2
4
6
Trade Balance
0 6 12 18 24-2
0
2
4
6
Nominal Exchange Rate
0 6 12 18 24-0.2
0
0.2
0.4
0.6
Long-term Interest Rate
0 6 12 18 24
-80-60-40-20
02040
US Fin. Conditions
0 6 12 18 24-40
-20
0
20
US Policy Liquidity
0 6 12 18 24
-10
0
10
US Risk Appetite
0 6 12 18 24
-60-40-20
02040US Cross-border Flows
0 6 12 18 24
-0.2
0
0.2
0.4
0.6
Excess Bond Premium
0 6 12 18 24
-10
0
10
20
30VIX
0 6 12 18 24
-0.5
0
0.5
1
US 1Y Treasury Rate
� : 11/38
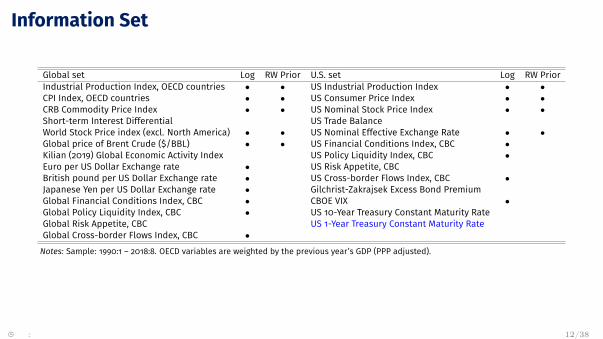
Information Set
Global set Log RW Prior U.S. set Log RW PriorIndustrial Production Index, OECD countries • • US Industrial Production Index • •CPI Index, OECD countries • • US Consumer Price Index • •CRB Commodity Price Index • • US Nominal Stock Price Index • •Short-term Interest Differential US Trade BalanceWorld Stock Price index (excl. North America) • • US Nominal Effective Exchange Rate • •Global price of Brent Crude ($/BBL) • • US Financial Conditions Index, CBC •Kilian (2019) Global Economic Activity Index US Policy Liquidity Index, CBC •Euro per US Dollar Exchange rate • US Risk Appetite, CBCBritish pound per US Dollar Exchange rate • US Cross-border Flows Index, CBC •Japanese Yen per US Dollar Exchange rate • Gilchrist-Zakrajsek Excess Bond PremiumGlobal Financial Conditions Index, CBC • CBOE VIX •Global Policy Liquidity Index, CBC • US 10-Year Treasury Constant Maturity RateGlobal Risk Appetite, CBC US 1-Year Treasury Constant Maturity RateGlobal Cross-border Flows Index, CBC •
Notes: Sample: 1990:1 – 2018:8. OECD variables are weighted by the previous year’s GDP (PPP adjusted).
� : 12/38
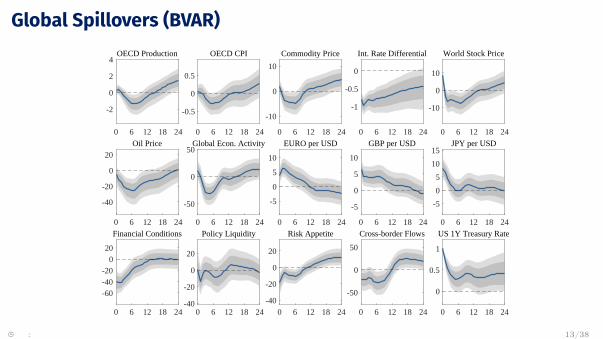
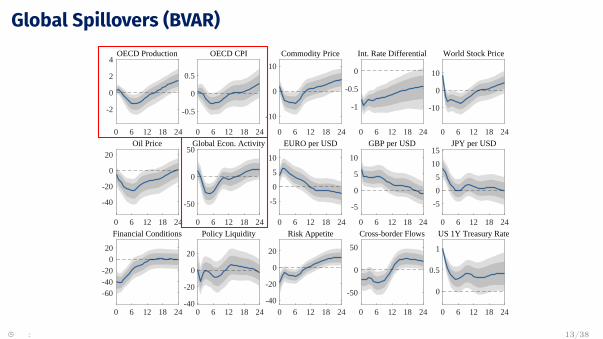
Global Spillovers (BVAR)
0 6 12 18 24
-2
0
2
4OECD Production
0 6 12 18 24
-0.5
0
0.5
OECD CPI
0 6 12 18 24
-10
0
10
Commodity Price
0 6 12 18 24
-1
-0.5
0
Int. Rate Differential
0 6 12 18 24
-10
0
10
World Stock Price
0 6 12 18 24
-40
-20
0
20
Oil Price
0 6 12 18 24
-50
0
50Global Econ. Activity
0 6 12 18 24
-5
0
5
10
EURO per USD
0 6 12 18 24
-5
0
5
10
GBP per USD
0 6 12 18 24
-5
0
5
10
15JPY per USD
0 6 12 18 24
-60-40-20
020
Financial Conditions
0 6 12 18 24-40
-20
0
20
Policy Liquidity
0 6 12 18 24-40
-20
0
20
Risk Appetite
0 6 12 18 24
-50
0
50
Cross-border Flows
0 6 12 18 24
0
0.5
1
US 1Y Treasury Rate
� : 13/38
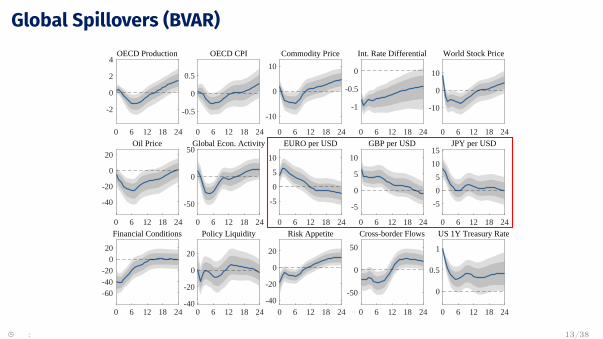
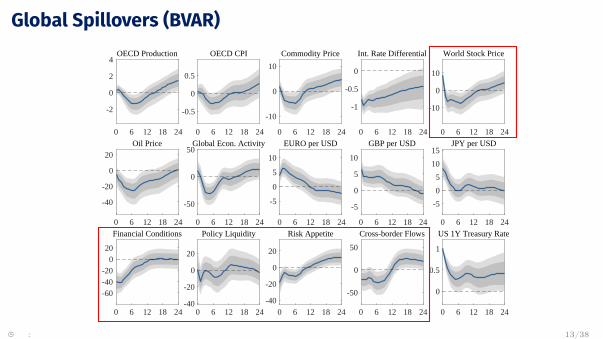
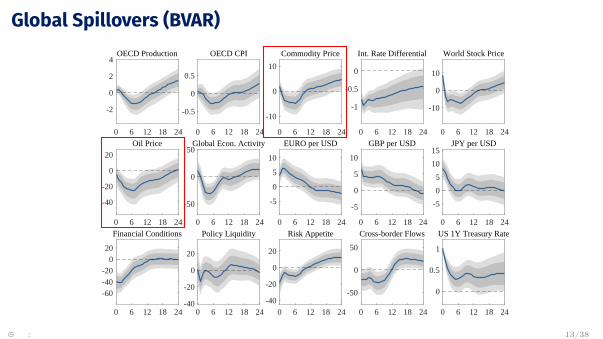

Global variables (BLP)
0 6 12 18 24
-2
0
2
OECD Production
0 6 12 18 24
-0.5
0
0.5
OECD CPI
0 6 12 18 24-10
-5
0
5
Commodity Price
0 6 12 18 24
-1
-0.5
0Int. Rate Differential
0 6 12 18 24
-10
0
10
World Stock Price
0 6 12 18 24
-40
-20
0
20Oil Price
0 6 12 18 24
-40
-20
0
20
40Global Econ. Activity
0 6 12 18 24
-5
0
5
10
EURO per USD
0 6 12 18 24-5
0
5
10
GBP per USD
0 6 12 18 24-5
0
5
10
JPY per USD
0 6 12 18 24
-60
-40
-20
0
20Financial Conditions
0 6 12 18 24-40
-20
0
20
Policy Liquidity
0 6 12 18 24-40
-20
0
20
Risk Appetite
0 6 12 18 24
-50
0
50Cross-border Flows
0 6 12 18 24
0
0.5
1
US 1Y Treasury Rate
� : 14/38
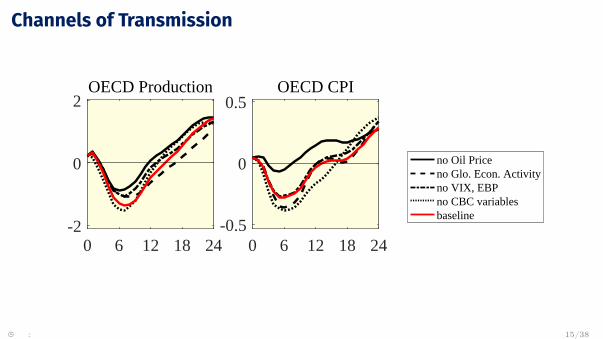
Channels of Transmission
0 6 12 18 24-2
0
2OECD Production
no Oil Priceno Glo. Econ. Activityno VIX, EBPno CBC variablesbaseline
0 6 12 18 24-0.5
0
0.5OECD CPI
0 6 12 18 24
-5
0
5
Commodity Price
0 6 12 18 24
-1
-0.5
0
Int. Rate Differential
0 6 12 18 24-10
0
10
World Stock Price
0 6 12 18 24
-30
-20
-10
0
10Oil Price
0 6 12 18 24-40
-20
0
20
Global Econ. Activity
0 6 12 18 24-5
0
5
EURO per USD
0 6 12 18 24-5
0
5
GBP per USD
0 6 12 18 24
-202468
JPY per USD
0 6 12 18 24
-40
-20
0
Glo. Financial Conditions
0 6 12 18 24
-10
0
10
Glo. Policy Liquidity
0 6 12 18 24
-20
-10
0
10
Glo. Risk Appetite
0 6 12 18 24-40
-20
0
20
Glo.Cross-border Flows
0 6 12 18 24
-2
-1
0
1
US Production
0 6 12 18 24-0.8-0.6-0.4-0.2
00.2
US CPI
0 6 12 18 24
-10
-5
0
5
US Nominal Stock Price
0 6 12 18 24
-2
0
2
4
6
US Trade Balance
0 6 12 18 24
-2
0
2
4
6
US Nom. Eff. Exch. Rate
0 6 12 18 24
-60
-40
-20
0
20US Fin. Conditions
0 6 12 18 24
-20
0
20
US Policy Liquidity
0 6 12 18 24
-10
0
10
20US Risk Appetite
0 6 12 18 24
-60-40-20
02040US Cross-border Flows
0 6 12 18 24-0.5
0
0.5
Excess Bond Premium
0 6 12 18 24-10
0
10
20
30VIX
0 6 12 18 24
-0.2
0
0.2
US 10Y Treasury Rate
0 6 12 18 240
0.5
1
US 1Y Treasury Rate
� : 15/38
Advanced Economies
� : 15/38

Countries and Data Coverage
Countries Data coverageAustralia Jan 1990 - Aug 2018Austria Jan 1990 - Aug 2018Belgium Jan 1990 - Aug 2018Canada Jan 1990 - Aug 2018Denmark Jan 1990 - Aug 2018Finland Jan 1990 - Aug 2018France Jan 1990 - Aug 2018Germany Jan 1990 - Aug 2018Italy Jan 1990 - Aug 2018Japan Jan 1990 - Aug 2018Netherlands Jan 1990 - Aug 2018Norway Jan 1990 - Aug 2018Spain Jan 1990 - Aug 2018Sweden Jan 1990 - Aug 2018UK Jan 1990 - Aug 2018
� : 16/38
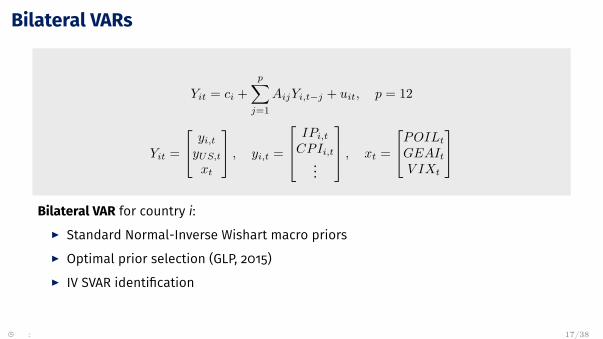
Bilateral VARs
Yit = ci +p∑
j=1AijYi,t−j + uit, p = 12
Yit =
yi,t
yUS,t
xt
, yi,t =
IPi,t
CPIi,t
...
, xt =
POILt
GEAIt
V IXt
Bilateral VAR for country i:
I Standard Normal-Inverse Wishart macro priorsI Optimal prior selection (GLP, 2015)I IV SVAR identification
� : 17/38

Information Set
Foreign set Logs RW Prior U.S. set Logs RW PriorIndustrial Production Index • • US Industrial Production Index • •Consumer Price Index • • US Consumer Price Index • •Core CPI Index • • US Core CPI Index • •Nominal Stock Price Index • • US Nominal Stock Price Index • •Trade Balance US Trade BalanceNominal USD Exchange Rate • • US Nominal Effective Exchange Rate • •Short-term Interest Rate US 10-Year Treasury Constant Maturity Rate •Policy Rate US Financial Conditions Index, CBC •Long-term Interest Rate US Policy Liquidity Index, CBC •Financial Conditions Index, CBC • US Risk Appetite, CBCPolicy Liquidity Index, CBC • US Cross-Border Flows Index, CBC •Risk Appetite, CBC US 1-year Treasury constant maturity rate •Cross-Border Flows Index, CBC •Global price of Brent Crude • •Kilian (2019) Global Economic Activity IndexCBOE VIX •
� : 18/38
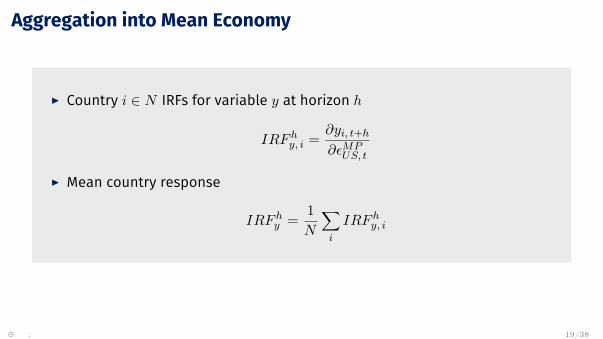
Aggregation into Mean Economy
I Country i ∈ N IRFs for variable y at horizon h
IRF hy, i = ∂yi, t+h
∂εMPUS, t
I Mean country response
IRF hy = 1
N
∑i
IRF hy, i
� : 19/38
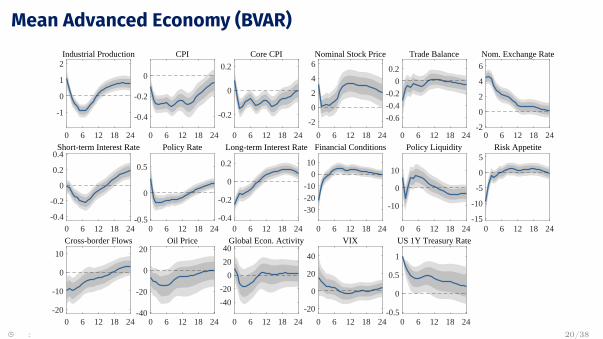
Mean Advanced Economy (BVAR)
0 6 12 18 24
-1
0
1
2Industrial Production
0 6 12 18 24
-0.4
-0.2
0
CPI
0 6 12 18 24
-0.2
0
0.2
Core CPI
0 6 12 18 24
-2
0
2
4
6Nominal Stock Price
0 6 12 18 24
-0.6
-0.4
-0.2
0
0.2
Trade Balance
0 6 12 18 24-2
0
2
4
6
Nom. Exchange Rate
0 6 12 18 24-0.4
-0.2
0
0.2
0.4Short-term Interest Rate
0 6 12 18 24-0.5
0
0.5
Policy Rate
0 6 12 18 24-0.4
-0.2
0
0.2
Long-term Interest Rate
0 6 12 18 24
-30-20-10
010
Financial Conditions
0 6 12 18 24
-10
0
10
Policy Liquidity
0 6 12 18 24-15
-10
-5
0
5Risk Appetite
0 6 12 18 24-20
-10
0
10
Cross-border Flows
0 6 12 18 24-40
-20
0
20Oil Price
0 6 12 18 24
-40
-20
0
20
40Global Econ. Activity
0 6 12 18 24
-20
0
20
40
VIX
0 6 12 18 24-0.5
0
0.5
1
US 1Y Treasury Rate
� : 20/38

CPI (BVAR)
0 6 12 18
-0.5
0
0.5
1AUSTRALIA
0 6 12 18
-0.5
0
0.5
AUSTRIA
0 6 12 18
-1
-0.5
0
0.5
BELGIUM
0 6 12 18
-1
-0.5
0
0.5
CANADA
0 6 12 18
-1
-0.5
0
0.5DENMARK
0 6 12 18-2
-1
0FINLAND
0 6 12 18
-0.5
0
0.5FRANCE
0 6 12 18-0.8-0.6-0.4-0.2
00.20.4
GERMANY
0 6 12 18
-0.5
0
0.5
ITALY
0 6 12 18
-0.5
0
0.5
JAPAN
0 6 12 18-1.5
-1
-0.5
0
NETHERLANDS
0 6 12 18
-0.5
0
0.5
1NORWAY
0 6 12 18
-1
0
1
SPAIN
0 6 12 18
-1
-0.5
0
0.5
SWEDEN
0 6 12 18
-0.5
0
0.5
UK
Response of: CPI
� : 21/38
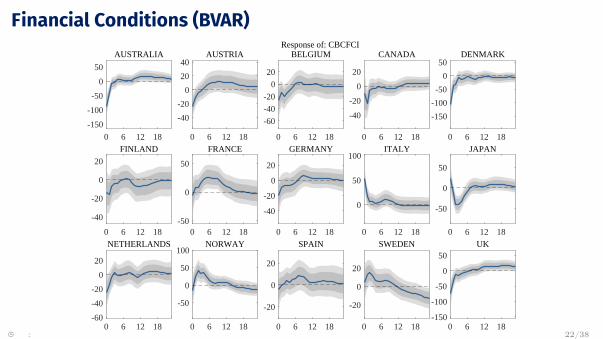
Financial Conditions (BVAR)
0 6 12 18
-150
-100
-50
0
50
AUSTRALIA
0 6 12 18
-40
-20
0
20
40AUSTRIA
0 6 12 18
-60
-40
-20
0
20
BELGIUM
0 6 12 18
-40
-20
0
20
CANADA
0 6 12 18
-150
-100
-50
0
50DENMARK
0 6 12 18
-40
-20
0
20
FINLAND
0 6 12 18-50
0
50
FRANCE
0 6 12 18
-40
-20
0
20
GERMANY
0 6 12 18
0
50
100ITALY
0 6 12 18
-50
0
50
JAPAN
0 6 12 18-60
-40
-20
0
20
NETHERLANDS
0 6 12 18
-50
0
50
100NORWAY
0 6 12 18
-20
0
20
SPAIN
0 6 12 18
-20
0
20
SWEDEN
0 6 12 18-150
-100
-50
0
50UK
Response of: CBCFCI
� : 22/38
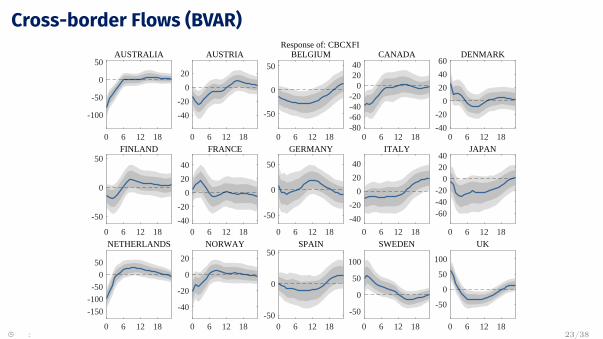
Cross-border Flows (BVAR)
0 6 12 18
-100
-50
0
50AUSTRALIA
0 6 12 18
-40
-20
0
20
AUSTRIA
0 6 12 18
-50
0
50BELGIUM
0 6 12 18-80-60-40-20
02040
CANADA
0 6 12 18-40
-20
0
20
40
60DENMARK
0 6 12 18
-50
0
50FINLAND
0 6 12 18-40
-20
0
20
40
FRANCE
0 6 12 18
-50
0
50
GERMANY
0 6 12 18
-40
-20
0
20
40
ITALY
0 6 12 18
-60-40-20
02040
JAPAN
0 6 12 18
-150
-100
-50
0
50
NETHERLANDS
0 6 12 18
-40
-20
0
20
NORWAY
0 6 12 18-50
0
50SPAIN
0 6 12 18
-50
0
50
100
SWEDEN
0 6 12 18
-50
0
50
100
UK
Response of: CBCXFI
� : 23/38

Mean Advanced Economy (BLP)
0 6 12 18 24
-1
0
1
2Industrial Production
0 6 12 18 24
-0.4
-0.2
0
CPI
0 6 12 18 24
-0.2
0
0.2Core CPI
0 6 12 18 24
-2
0
2
4
Nominal Stock Price
0 6 12 18 24
-0.6
-0.4
-0.2
0
0.2
Trade Balance
0 6 12 18 24
0
2
4
6Nom. Exchange Rate
0 6 12 18 24
-0.2
0
0.2
Short-term Interest Rate
0 6 12 18 24-0.4-0.2
00.20.40.6
Policy Rate
0 6 12 18 24-0.4
-0.2
0
0.2
Long-term Interest Rate
0 6 12 18 24
-30
-20
-10
0
10
Financial Conditions
0 6 12 18 24
-10
0
10
20Policy Liquidity
0 6 12 18 24-15
-10
-5
0
5Risk Appetite
0 6 12 18 24
-20
-10
0
10Cross-border Flows
0 6 12 18 24
-30
-20
-10
0
10
Oil Price
0 6 12 18 24
-40
-20
0
20
40Global Econ. Activity
0 6 12 18 24-20
0
20
40
VIX
0 6 12 18 24
0
0.5
1
US 1Y Treasury Rate
� : 24/38

Channels of Transmission (BVAR)
0 6 12 18 24
-1
0
1
Industrial Production
no Oil Priceno Exch. Ratesno Trade Bal.no CBCbaseline
0 6 12 18 24
-0.4
-0.2
0
CPI
0 6 12 18 24
-0.2
-0.1
0
0.1
Core CPI
0 6 12 18 24
0
2
4
6
Nominal Stock Price
0 6 12 18 24
-0.3
-0.2
-0.1
0
0.1Trade Balance
0 6 12 18 24-2
0
2
4
6Nom. Exchange Rate
0 6 12 18 24-0.4
-0.2
0
0.2
Short-term Int. Rate
0 6 12 18 24
-0.2
0
0.2
Policy Rate
0 6 12 18 24
-0.2
0
0.2
Long-term Int. Rate
0 6 12 18 24
-20
-10
0
10Financial Conditions
0 6 12 18 24-10
0
10Policy Liquidity
0 6 12 18 24
-10
-5
0
5Risk Appetite
0 6 12 18 24
-10
-5
0
5Cross-border Flows
0 6 12 18 24
-1.5
-1
-0.5
0
US Production
0 6 12 18 24-0.8-0.6-0.4-0.2
00.2
US CPI
0 6 12 18 24
-0.1
0
0.1
US Core CPI
0 6 12 18 24
-5
0
5US Nominal Stock Price
0 6 12 18 24
0
2
4
US Trade Balance
0 6 12 18 24
0
2
4
US NEER
0 6 12 18 240
0.1
0.2
0.3
US 10Y Treas. Rate
0 6 12 18 24
-60
-40
-20
0
20US Financial Conditions
0 6 12 18 24-20
-10
0
US Policy Liquidity
0 6 12 18 24
-10
-5
0
5
US Risk Appetite
0 6 12 18 24
-40
-20
0
20US Cross-border Flows
0 6 12 18 24
-20
-10
0
Oil Price
0 6 12 18 24
-20
-10
0
10
Global Econ. Activity
0 6 12 18 24
-10
0
10
20VIX
0 6 12 18 24
0
0.5
1
US 1Y Treasury Rate
0 6 12 18 24
-1
0
1
Industrial Production
no Oil Priceno Exch. Ratesno Trade Bal.no CBCbaseline
0 6 12 18 24
-0.4
-0.2
0
CPI
0 6 12 18 24
-0.2
-0.1
0
0.1
Core CPI
0 6 12 18 24
0
2
4
6
Nominal Stock Price
0 6 12 18 24
-0.3
-0.2
-0.1
0
0.1Trade Balance
0 6 12 18 24-2
0
2
4
6Nom. Exchange Rate
0 6 12 18 24-0.4
-0.2
0
0.2
Short-term Int. Rate
0 6 12 18 24
-0.2
0
0.2
Policy Rate
0 6 12 18 24
-0.2
0
0.2
Long-term Int. Rate
0 6 12 18 24
-20
-10
0
10Financial Conditions
0 6 12 18 24-10
0
10Policy Liquidity
0 6 12 18 24
-10
-5
0
5Risk Appetite
0 6 12 18 24
-10
-5
0
5Cross-border Flows
0 6 12 18 24
-1.5
-1
-0.5
0
US Production
0 6 12 18 24-0.8-0.6-0.4-0.2
00.2
US CPI
0 6 12 18 24
-0.1
0
0.1
US Core CPI
0 6 12 18 24
-5
0
5US Nominal Stock Price
0 6 12 18 24
0
2
4
US Trade Balance
0 6 12 18 24
0
2
4
US NEER
0 6 12 18 240
0.1
0.2
0.3
US 10Y Treas. Rate
0 6 12 18 24
-60
-40
-20
0
20US Financial Conditions
0 6 12 18 24-20
-10
0
US Policy Liquidity
0 6 12 18 24
-10
-5
0
5
US Risk Appetite
0 6 12 18 24
-40
-20
0
20US Cross-border Flows
0 6 12 18 24
-20
-10
0
Oil Price
0 6 12 18 24
-20
-10
0
10
Global Econ. Activity
0 6 12 18 24
-10
0
10
20VIX
0 6 12 18 24
0
0.5
1
US 1Y Treasury Rate
� : 25/38

Asymmetric Responses (BVAR)
0 6 12 18 24
-2
0
2
Industrial Production
PositiveNegative
0 6 12 18 24-0.4-0.2
00.20.40.6
CPI
0 6 12 18 24
-0.2
0
0.2
0.4
Core CPI
0 6 12 18 24
-8-6-4-2024Nominal Stock Price
0 6 12 18 24-0.5
0
0.5
Short-term Int. Rate
0 6 12 18 24
-0.5
0
0.5
Policy Rate
0 6 12 18 24
-20
0
20
Cross-border Flows
0 6 12 18 24-1
0
1
US 10Y Treas. Rate
0 6 12 18 24
-100
0
100US Fin. Conditions
0 6 12 18 24-40-20
020406080
US Policy Liquidity
0 6 12 18 24
-20
0
20
40US Risk Appetite
0 6 12 18 24
-100
0
100
US Cross-border Flows
0 6 12 18 24-40-20
02040
Oil Price
0 6 12 18 24
-50
0
50
Global Econ. Activity
0 6 12 18 24
-50
0
50
VIX
0 6 12 18 24
-1
0
1
US 1Y Treasury Rate
� : 26/38
Emerging Economies
� : 26/38
Countries and Data Coverage
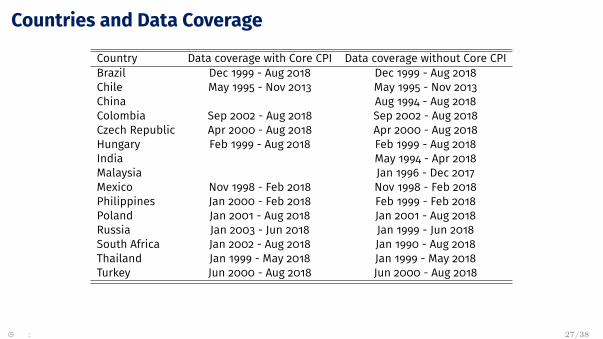
Country Data coverage with Core CPI Data coverage without Core CPIBrazil Dec 1999 - Aug 2018 Dec 1999 - Aug 2018Chile May 1995 - Nov 2013 May 1995 - Nov 2013China Aug 1994 - Aug 2018Colombia Sep 2002 - Aug 2018 Sep 2002 - Aug 2018Czech Republic Apr 2000 - Aug 2018 Apr 2000 - Aug 2018Hungary Feb 1999 - Aug 2018 Feb 1999 - Aug 2018India May 1994 - Apr 2018Malaysia Jan 1996 - Dec 2017Mexico Nov 1998 - Feb 2018 Nov 1998 - Feb 2018Philippines Jan 2000 - Feb 2018 Feb 1999 - Feb 2018Poland Jan 2001 - Aug 2018 Jan 2001 - Aug 2018Russia Jan 2003 - Jun 2018 Jan 1999 - Jun 2018South Africa Jan 2002 - Aug 2018 Jan 1990 - Aug 2018Thailand Jan 1999 - May 2018 Jan 1999 - May 2018Turkey Jun 2000 - Aug 2018 Jun 2000 - Aug 2018
� : 27/38
Information Set
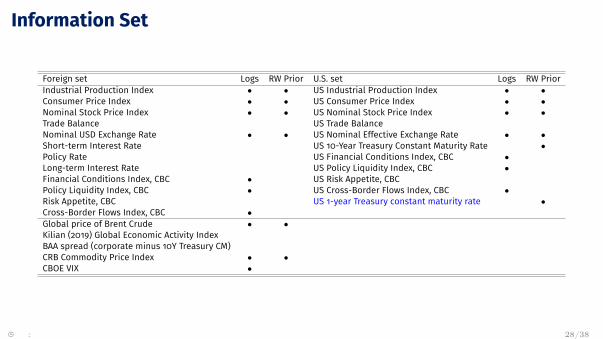
Foreign set Logs RW Prior U.S. set Logs RW PriorIndustrial Production Index • • US Industrial Production Index • •Consumer Price Index • • US Consumer Price Index • •Nominal Stock Price Index • • US Nominal Stock Price Index • •Trade Balance US Trade BalanceNominal USD Exchange Rate • • US Nominal Effective Exchange Rate • •Short-term Interest Rate US 10-Year Treasury Constant Maturity Rate •Policy Rate US Financial Conditions Index, CBC •Long-term Interest Rate US Policy Liquidity Index, CBC •Financial Conditions Index, CBC • US Risk Appetite, CBCPolicy Liquidity Index, CBC • US Cross-Border Flows Index, CBC •Risk Appetite, CBC US 1-year Treasury constant maturity rate •Cross-Border Flows Index, CBC •Global price of Brent Crude • •Kilian (2019) Global Economic Activity IndexBAA spread (corporate minus 10Y Treasury CM)CRB Commodity Price Index • •CBOE VIX •
� : 28/38
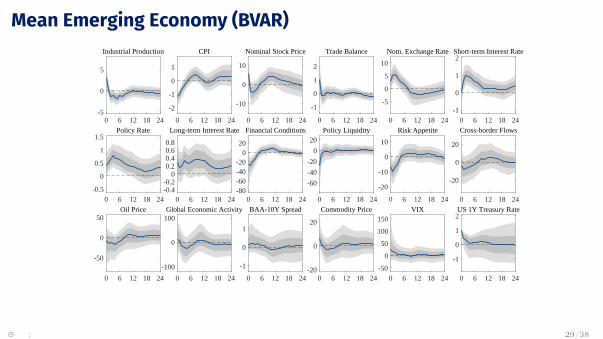
Mean Emerging Economy (BVAR)
0 6 12 18 24-5
0
5
Industrial Production
0 6 12 18 24
-2
-1
0
1
CPI
0 6 12 18 24
-10
0
10
Nominal Stock Price
0 6 12 18 24
-1
0
1
2
Trade Balance
0 6 12 18 24
-5
0
5
10
Nom. Exchange Rate
0 6 12 18 24-1
0
1
2Short-term Interest Rate
0 6 12 18 24-0.5
0
0.5
1
1.5Policy Rate
0 6 12 18 24-0.4-0.2
00.20.40.60.8
Long-term Interest Rate
0 6 12 18 24-80-60-40-20
020
Financial Conditions
0 6 12 18 24
-60
-40
-20
0
20Policy Liquidity
0 6 12 18 24
-20
-10
0
10
Risk Appetite
0 6 12 18 24
-20
0
20
Cross-border Flows
0 6 12 18 24
-50
0
50Oil Price
0 6 12 18 24
-100
0
100Global Economic Activity
0 6 12 18 24
-1
0
1
BAA-10Y Spread
0 6 12 18 24-20
0
20
Commodity Price
0 6 12 18 24-50
0
50
100
150VIX
0 6 12 18 24
-1
0
1
2US 1Y Treasury Rate
� : 29/38

Mean Emerging Economy (BLP)
0 6 12 18 24-4-20246
Industrial Production
0 6 12 18 24
-2
-1
0
1
CPI
0 6 12 18 24
-10
0
10
Nominal Stock Price
0 6 12 18 24
-1
0
1
2
Trade Balance
0 6 12 18 24
-5
0
5
10
Nom. Exchange Rate
0 6 12 18 24-1
0
1
Short-term Interest Rate
0 6 12 18 24
0
0.5
1
Policy Rate
0 6 12 18 24
-0.20
0.20.40.60.8
Long-term Interest Rate
0 6 12 18 24-80
-60
-40
-20
0
20
Financial Conditions
0 6 12 18 24
-60
-40
-20
0
20Policy Liquidity
0 6 12 18 24
-20
-10
0
10Risk Appetite
0 6 12 18 24
-20
0
20Cross-border Flows
0 6 12 18 24-80-60-40-20
02040
Oil Price
0 6 12 18 24-100
0
100Global Econ. Activity
0 6 12 18 24-1
0
1
BAA-10Y Spread
0 6 12 18 24
-10
0
10
20
Commodity Price
0 6 12 18 24-50
0
50
100
150
VIX
0 6 12 18 24
-1
0
1
2US 1Y Treasury Rate
� : 30/38
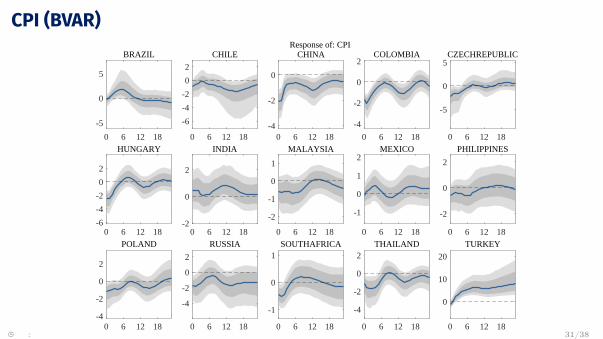
CPI (BVAR)
0 6 12 18
-5
0
5
BRAZIL
0 6 12 18
-6
-4
-2
0
2
CHILE
0 6 12 18-4
-2
0
CHINA
0 6 12 18
-4
-2
0
2COLOMBIA
0 6 12 18
-5
0
5CZECHREPUBLIC
0 6 12 18-6
-4
-2
0
2
HUNGARY
0 6 12 18-2
0
2
INDIA
0 6 12 18
-2
-1
0
1
MALAYSIA
0 6 12 18
-1
0
1
2MEXICO
0 6 12 18
-2
0
2
PHILIPPINES
0 6 12 18-4
-2
0
2
POLAND
0 6 12 18
-4
-2
0
2
RUSSIA
0 6 12 18
-1
0
1SOUTHAFRICA
0 6 12 18
-4
-2
0
2THAILAND
0 6 12 18
0
10
20
TURKEY
Response of: CPI
� : 31/38
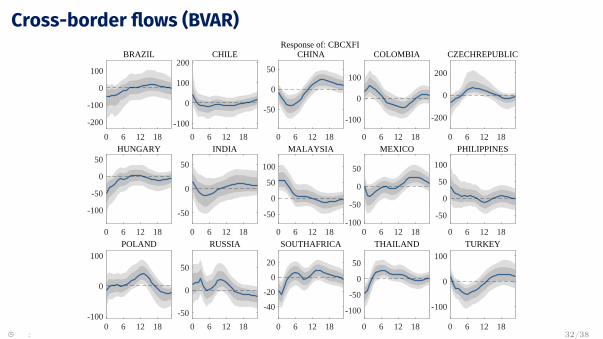
Cross-border flows (BVAR)
0 6 12 18
-200
-100
0
100
BRAZIL
0 6 12 18
-100
0
100
200CHILE
0 6 12 18
-50
0
50
CHINA
0 6 12 18
-100
0
100
COLOMBIA
0 6 12 18
-200
0
200
CZECHREPUBLIC
0 6 12 18
-100
-50
0
50HUNGARY
0 6 12 18
-50
0
50
INDIA
0 6 12 18
-50
0
50
100
MALAYSIA
0 6 12 18-100
-50
0
50
MEXICO
0 6 12 18
-50
0
50
100
PHILIPPINES
0 6 12 18-100
0
100POLAND
0 6 12 18
-50
0
50
RUSSIA
0 6 12 18
-40
-20
0
20
SOUTHAFRICA
0 6 12 18
-100
-50
0
50
THAILAND
0 6 12 18
-100
0
100
TURKEY
Response of: CBCXFI
� : 32/38
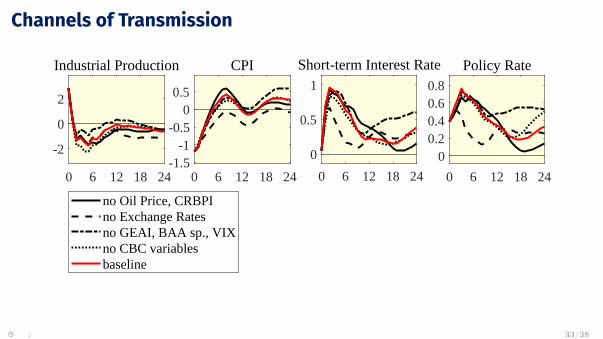
Channels of Transmission
0 6 12 18 24
-2
0
2
Industrial Production
no Oil Price, CRBPIno Exchange Ratesno GEAI, BAA sp., VIXno CBC variablesbaseline
0 6 12 18 24-1.5
-1-0.5
00.5
CPI
0 6 12 18 24
0
0.5
1
Short-term Interest Rate
0 6 12 18 24
00.20.40.60.8
Policy Rate
0 6 12 18 24
-2
-1
0
US Production
0 6 12 18 24
-1
-0.5
0
US CPI
0 6 12 18 24-6-4-202
US Nominal Stock Price
0 6 12 18 24
0
5
10
15US Trade Bal.
0 6 12 18 24-2
0
2
US Nom. Eff. Exch. Rate
0 6 12 18 24
-0.2
0
0.2
US 10Y Treas. Rate
0 6 12 18 24
-60
-40
-20
0
US Financial Conditions
0 6 12 18 24
-20
-10
0
10US Policy Liquidity
0 6 12 18 24
-15-10
-505
US Risk Appetite
0 6 12 18 24
-10
0
10
20
US Cross-border Flows
0 6 12 18 24-20
-10
0
10Oil Price
0 6 12 18 24
-20
0
20Global Econ. Activity
0 6 12 18 24
-0.2
0
0.2
BAA-10Y Spread
0 6 12 18 24-5
0
5
Commodity Price
0 6 12 18 24
0
10
20
30VIX
0 6 12 18 24
0
0.5
1
US 1Y Treasury Rate
� : 33/38
Capital Controls
� : 33/38
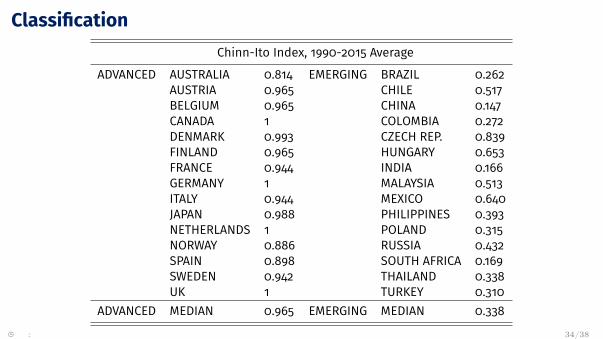
ClassificationChinn-Ito Index, 1990-2015 Average
ADVANCED AUSTRALIA 0.814 EMERGING BRAZIL 0.262AUSTRIA 0.965 CHILE 0.517BELGIUM 0.965 CHINA 0.147CANADA 1 COLOMBIA 0.272DENMARK 0.993 CZECH REP. 0.839FINLAND 0.965 HUNGARY 0.653FRANCE 0.944 INDIA 0.166GERMANY 1 MALAYSIA 0.513ITALY 0.944 MEXICO 0.640JAPAN 0.988 PHILIPPINES 0.393NETHERLANDS 1 POLAND 0.315NORWAY 0.886 RUSSIA 0.432SPAIN 0.898 SOUTH AFRICA 0.169SWEDEN 0.942 THAILAND 0.338UK 1 TURKEY 0.310
ADVANCED MEDIAN 0.965 EMERGING MEDIAN 0.338
� : 34/38
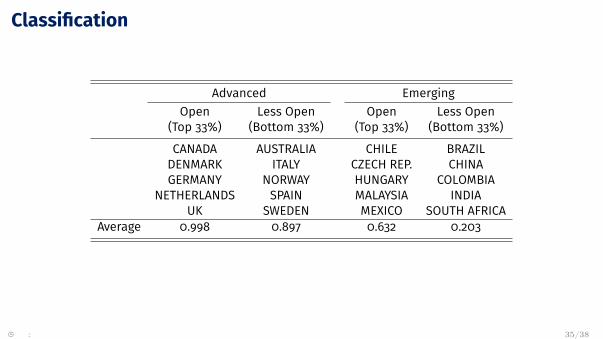
Classification
Advanced EmergingOpen Less Open Open Less Open
(Top 33%) (Bottom 33%) (Top 33%) (Bottom 33%)
CANADA AUSTRALIA CHILE BRAZILDENMARK ITALY CZECH REP. CHINAGERMANY NORWAY HUNGARY COLOMBIA
NETHERLANDS SPAIN MALAYSIA INDIAUK SWEDEN MEXICO SOUTH AFRICA
Average 0.998 0.897 0.632 0.203
� : 35/38
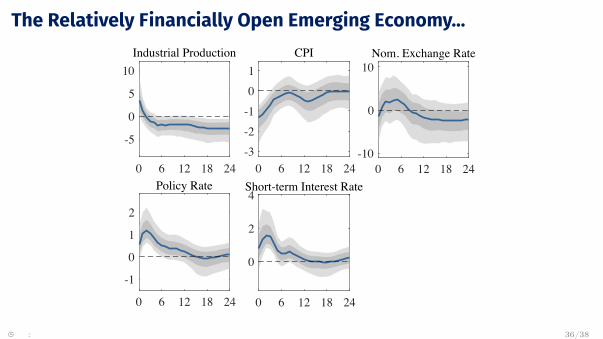
The Relatively Financially Open Emerging Economy...
0 6 12 18 24
-5
0
5
10Industrial Production
0 6 12 18 24-3-2-101
CPI
0 6 12 18 24-10
0
10Nom. Exchange Rate
0 6 12 18 24
0
2
4Short-term Interest Rate
0 6 12 18 24
-1
0
1
2
Policy Rate
0 6 12 18 24
0
100
200VIX
0 6 12 18 24-2
-1
0
1
US 1Y Treasury Rate� : 36/38
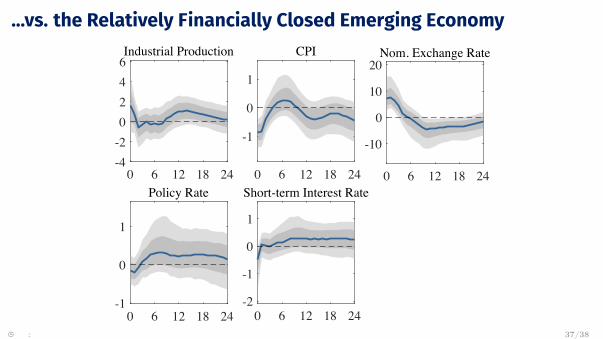
...vs. the Relatively Financially Closed Emerging Economy
0 6 12 18 24-4-20246Industrial Production
0 6 12 18 24
-1
0
1
CPI
0 6 12 18 24
-10
0
10
20Nom. Exchange Rate
0 6 12 18 24-2
-1
0
1
Short-term Interest Rate
0 6 12 18 24-1
0
1
Policy Rate
� : 37/38

Conclusions – The Global effects of U.S. Monetary Policy
I US monetary policy has large and pervasive effects
I Spillovers to both prices and real economy
I Strong evidence of financial channels
I Affect both Advanced Economies and Emerging Markets
I Initial evidence of asymmetric effects
� : 38/38

Appendix
� : 0/0
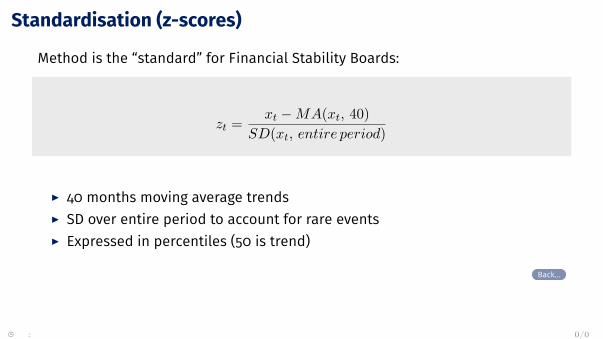
Standardisation (z-scores)
Method is the “standard” for Financial Stability Boards:
zt = xt −MA(xt, 40)SD(xt, entire period)
I 40 months moving average trendsI SD over entire period to account for rare eventsI Expressed in percentiles (50 is trend)
Back...
� : 0/0
Financial Conditions Index
I AKA: Credit Spreads
I Index of very short-term credit spreads (e.g. deposit loan spreads)
I Derived from the z-scores of each sub-variable, which are equally weightedand then normalised
I Varies between 0 and 100 with 50 indicating “neutral” relative to a40-month MA
Back...
� : 0/0

Policy Liquidity Index
I AKA: Central Bank Money
I Measures size of CB balance sheets and changes in their composition
I Derived from the z-scores of each sub-variable, which are equally weightedand then normalised
I Varies between 0 and 100 with 50 indicating “neutral” relative to a40-month MA
Back...
� : 0/0
Cross-border Flows IndexI AKA: Foreign Liquidity
I Comprises all financial flows into a currency (incl. banking flows, bonds andequities)
I Estimated from national trade and current account data, foreign exchangereserve movements and (interpolated) quarterly data on net FDI flows
I Derived from the “normalised” z-score of the value of cross-border flows.The resulting index varies between 0 and 100 with 50 indicating “neutral”relative to a 40-month moving average
I In the Global version, US weight is 24.81%
Back...
� : 0/0
Risk Appetite
I Difference between the Equity Exposure Index and the Bond Exposure Index
I Equity Exposure Index: AKA Equity Market SentimentI Based on the balance sheet exposure of all investors (by type) in the assetclass.
I Derived from a z-score of the current portfolio share away from its 5-yeartrend, e.g. equity holdings as a percentage of all financial assets
I Bond Exposure Index: AKA Bond Market SentimentI Equivalent of the equity exposure index for bonds
Back...
� : 0/0